
Abstract
Introduction
Inspired by contributions from criminal career and life-course research to the criminological understanding of individual criminal behaviour, a small but growing number of publications has explored the potential added value of taking a longitudinal approach to corporate offending (Blokland et al., 2021; Hunter, 2021; Simpson, 2019; Wu et al., 2024). At present, these explorations have largely been theoretical, noting both important benefits and potential caveats for the life-course analogy of organisational crime. To determine the merits of a longitudinal life-course approach to the understanding of corporate crime, findings from empirical work based on systematic, longitudinal data on corporate violations are needed (Simpson, 2019). Addressing the call for longitudinal studies on corporate offending, the current article utilises register data on regulatory offending 1 by ships and businesses 2 in Dutch inland shipping recorded between 2015 and 2020. Using these data, the current study examines the distribution of corporate offending in Dutch inland shipping and its development, identifying multiple trajectories reflecting the criminal careers of both ships and businesses. Additionally, the extent to which different ship and corporate characteristics are associated with each of these corporate offending trajectories is assessed. Describing trajectories in corporate offending and the corporate characteristics associated with them constitutes the first steps towards understanding the drivers of corporate crime over time. Moving beyond the offending-compliant dichotomy also allow for more targeted prevention and intervention.
The article proceeds as follows. First, the longitudinal approach of corporate offending is outlined, followed by a discussion on risk-based regulation. Next, previous studies on the distribution and longitudinal development of corporate offending and associated characteristics are reviewed. The current study and context are introduced before proceeding with methodology, results, and discussion, in which further detail is given on future directions of research and the value of a life-course approach to corporate offending for regulatory practice.
A life-course analogy of corporate offending
Life-course criminology aims to describe and explain developments in criminal behaviour over time (Blokland & Nieuwbeerta, 2010). Although life-course studies often pertain to the development of individuals, theories and methodologies are also applicable to the study of offending by corporations (Kluin et al., 2018). Key to a longitudinal approach to corporate offending is the distinction of various dimensions of the corporate criminal career (e.g., onset, frequency, diversity, duration) and the notion that these dimensions might be susceptible to different outside influences, resulting in distinct developmental trajectories of corporate offending (Blokland et al. 2021).
Analogous to the life-course approach to individual criminal development, external influences shaping corporate offending careers can be thought of as events and transitions that may constitute ‘turning points’ in corporate (non-)compliance (Hunter, 2021). Patterns of non-compliance may also align with different phases of the corporate life-cycle, each characterised by different corporate challenges (Wu et al., 2024), while the effects of transitions may also be conditional on the knowledge and resources available to corporations during different parts of their life-cycle (Blokland et al. 2021).
In short, rather than focusing solely on differences between corporations, the life-course approach emphasises differences within corporations over time. Not simplifying or omitting the developmental patterning of offending can potentially offer a better understanding of corporate offending and the factors driving it (Jennings & Reingle, 2012). A longitudinal approach, in turn, may also aid inspection and intervention practice, as interventions can be formulated to fit the subpopulations’ changing risks and needs.
Risk-based regulation
In general, regulation attempts to control and manage risks through intentional intervention (Almond & Van Erp, 2020; Hutter, 2001). Risk-based regulation, specifically, aims to provide ‘rational, objective, and transparent ways of prioritising work, and the deployment of limited regulatory resources’ (Hutter, 2016: 103, See also: Black, 2005). In other words, the key premise of risk-based regulation is that risks are not evenly distributed across the population. Enforcement should therefore allocate resources where they have the highest impact, and determine which regulatory strategy best fits the regulated (sub)population's risks and needs. For instance, low-frequency offending corporations may benefit from self-regulation or minor criminal deterrence, while high-frequency offending corporations may benefit from stricter command-and-control policies (Chambliss, 1967; Hodges, 2015; Sparrow, 2000; 2020; Van Wingerde, 2016). Instead of a one-time categorisation as low or high risk, a longitudinal approach allows for the continuous re-evaluation of corporations’ risks and needs, enabling the complementary deployment of regulatory (sub-)strategies both across and within corporations over time.
Regarding the distribution of risks, Van der Heijden (2019) notes that attention is often focused at risks with exceptionally low occurrence and high impact (i.e. major incidents) instead of risks with higher occurrence and lower impact (i.e. work accidents, collisions; Human Environment and Transport Inspectorate, 2023). However, (offending) behaviour with high occurrence and low impact risks can accumulate to a higher overall risk or be a precursor to low occurrence and high impact risks. In this light, Black and Baldwin (2012a; 2012b) state that risk-based regulation should consider the volatility and accumulation of risks as well as whether risks are low intrinsically or due to risk management and control measures; changes in these dimensions may acutely alter the risks involved. Observed regulatory offences can be regarded as materialised risks. The distribution of these regulatory offences in the population therefore mirrors the distribution of past risks. Insofar as past behaviour is related to future behaviour, the distribution of observed offences may foreshadow future risks (Paternoster et al., 1997).
Previous studies
On the distribution of corporate offending
Ever since the landmark study of corporate crime by Sutherland (1949/1983), studies find corporate offending to be unevenly distributed. Covering different regulatory contexts and time frames, studies consistently find a small percentage (ranging from 6.3% to 25.4%) of companies being responsible for a disproportionate percentage (ranging from 22.2% to 52.0%) of all registered corporate offences (for instance: Clinard & Yeager, 1980/2017; Dalton & Kesner, 1988; Baucus & Near, 1991; Hill et al., 1992; Alalehto, 2010; Kluin et al., 2018; Hunter, 2023). Based on these prior findings, an uneven distribution of violations in the Dutch inland shipping data is expected. More particularly, it is expected that a small group of offending corporations is responsible for a disproportionate share of regulatory offences.
Prior studies typically describe offending distributions based on cross-sectional data aggregation (i.e. Clinard & Yeager; 1980/2017; Sutherland, 1949/1983). Such static snapshots, however, fail to account for potential changes in corporate behaviour over time. Consequently, for regulatory practice they are but crude indicators of risks. To fully capture the dynamics of corporate offending and allow for effective risk-based regulation, a longitudinal perspective on risks and offending is pivotal (Custers, 2014; Van der Heijden, 2019).
On the development of corporate offending
Distinct trajectories of offending have long been studied for individual crime (Piquero, 2008) and, more recently, for white-collar crime (Van der Geest et al., 2017; Van Onna et al., 2014). However, thus far only Kluin et al. (2018, 2024) and Simpson et al. (2024) describe the longitudinal development of corporate offending.
Kluin et al. (2024) estimate the trajectories of corporate offending in the Dutch chemical industry from 2007 to 2021. In their sample of 567 corporations, they distinguish seven trajectory groups, with three groups (together constituting 59.6% of the sample) continuously showing less than 2 violations per year during the 15-year follow-up period. The other groups (together constituting 40.4% of the sample) show a marked slope – downward or upward – in their offending frequency over time; the yearly average frequency of offending in these groups across the follow-up varies from 9.5 to 3 and from 1 to 5.5 respectively. Importantly, the rank ordering of the trajectory groups changes over time; a finding obfuscated when only cross-sectional aggregations would have been considered.
Simpson et al. (2024) analyse the development of financial and environmental offending in 3385 large companies between 1996 and 2013. They distinguish two trajectory groups showing stable low levels of offending and a third group showing high initial levels of offending followed by a strong decrease. As these trajectories do not intersect, the initial rank order of these groups in terms of offending frequency does not change during the observation period.
The current study adds to the extant longitudinal studies of corporate offending. Based on the findings of Kluin et al. (2024) and Simpson et al. (2024), the expectation is that several latent offending groups in inland shipping can be distinguished. Furthermore, given the skewed distribution typically found in corporate offending, it is expected that at least one of the trajectory groups distinguished will show a stable, highly frequent offending pattern. Developmental changes in the frequency of offending and the intersection of trajectories would indicate that development is related to dynamic factors (Simpson et al., 2024). Alternatively, stable trajectories would indicate a ranking related to static factors (cf. Gottfredson & Hirschi, 1990).
On the characteristics associated with corporate offending
A division in trajectory groups allows for the comparison of corporate characteristics associated with each of these trajectories. Earlier comparisons were mostly based on the dichotomy between offending and non-offending corporations (e.g. Clinard et al., 1980/2017). While informative, this broad distinction leaves potentially relevant information on differences between companies in the frequency of offending and divergent developments therein unused. Trajectory modelling enables comparisons between offending groups that differ in both the level and the course of their offending over time (Jennings & Reingle, 2012; Nagin, 2005).
Earlier research finds various corporate characteristics to be associated with corporate offending (for reviews see: Huisman, 2016; Pusch & Holtfreter, 2021; Simpson, 2013). Conversely, characteristics associated with compliance can be interpreted as protective factors (e.g. Schell-Busey, 2022). Combined, these studies show that possible predictors of corporate offending can be identified at various levels: (1) industry-level characteristics, such as the regulation regime (legislation, inspection, enforcement), industry competitiveness, and industry structure (Orudzheva et al., 2020; Pusch & Holtfreter, 2021; Schell-Busey, 2022); (2) organisational or corporate-level characteristics, such as the corporate strategy (goals, goal-attainment pressure, performance measures), structure (size, type of organisation, complexity, and internal control), culture, and internal controls (Clinard & Yeager, 1980/2017; Gibbs & Simpson, 2009; Kluin, 2014; Kramer 1982; Schell-Busey, 2022; Simpson, 1986; Vaughan, 1999); and (3) personal or individual-level characteristics, such as demographics, personality traits, and self-control of those making corporate decisions (Pusch & Holtfreter, 2021).
There is, however, ample variation in the types of variables included in prior studies, which in part is due to the fact that much corporate crime research uses official or secondary data sources (Simpson, 2019; Simpson et al., 2014; Thorne, 1998). As a result, the selection of predictor variables is therefore typically heavily constrained by their availability in the data at hand. The current study is no exception in this regard. Additionally, organisational characteristics may be industry-specific. For instance, Kluin et al. (2024) compare trajectory groups on characteristics that result from the specific legal context and practical requirements in the chemical industry. Industry-specific organisational characteristics may also be relevant but are hardly studied.
Finally, Simpson (2013) notes that the association between corporate characteristics – such as structural complexity and diversification – and corporate crime on the plant-level, may be different or even absent on the firm-level, something Simpson refers to as the level-of-analysis problem in corporate crime research (See also: Denzin, 1977). While these different levels are sometimes mentioned (e.g. Bartlett et al., 2020; Orudzheva et al., 2020), they are rarely empirically examined in the same study. Cognizant of the levels-of-analysis problem, the present study differentiates between the ship and the business-level.
Current study
This study applies life-course methodologies to large-scale longitudinal register data on corporate offending. The current study offers new insights in three primary ways. First, by using industry-specific data on Dutch inland shipping, the present study builds on prior research on the distribution of corporate offending in other jurisdictions and industries, subjected to different regulatory regimes, speaking on the generalisability of these findings across countries and industries. Second, the longitudinal approach taken will provide insight into the development of corporate offending over time and the potential differences therein between companies allocated to different trajectory groups. By linking these trajectories to corporate characteristics, the extent to which these variables are associated with the way corporate offending evolves over time is explored. Finally, cognizant of the levels-of-analysis problem in corporate crime research, the data will be analysed on both the business level and the ship level. In some cases, the ship and business level coincide. In other cases, a particular business may own multiple ships. In these cases, each ship is regarded as a separate business location. A separation in aggregation levels implies the possibility for different developmental trajectories on each level, and for different characteristics to be associated with these trajectories. More generally, differentiation between levels examines the propriety of either the business or the business location as the unit of analysis. Furthermore, to the extent that different trajectories are distinguished at each level, enforcement and intervention strategies may also need to vary between these levels.
Dutch inland shipping: Risks and regulation
The Netherlands is a leading country in inland shipping transport (Harbers, 2022; Kotowska et al., 2018). Its 6300 km of inland waterways are actively used by an estimated 5000 Dutch inland vessels and an unknown number of international vessels (Statistics Netherlands, n.d.), transporting approximately 345 million tonnes in 2022. That is 74.08% of the annual tonnage of all (registered) EU-countries combined (Statistics Netherlands, n.d.; Eurostat, 2024). Inland shipping transport, however, is not without risks. Risk analyses by the main regulatory enforcement agency for this sector, the Human Environment and Transport Inspectorate (ILT), show that physical, economical, and environmental damages, through incidents, (illegal) disposal of materials, leakage of substances, and emissions in inland shipping can amount to more than 60 million euros yearly, excluding incalculable costs of certain environmental impacts or impacts on the health and well-being of people (Human Environment and Transport Inspectorate, 2023). Risks increase in (sub)urbanised areas (Government of the Netherlands, 2020). As sector expansion and urbanisation progress, inland shipping risks continue to increase even further (Harbers, 2022; Statistics Netherlands, n.d.).
The ILT aims to reduce these risks and minimise damages using a data-driven and risk-based enforcement strategy known as the Dutch national enforcement strategy (Bestuurlijk Omgevingsberaad, 2014). This strategy, based on the concept of responsive regulation, allows for the selection of inspection cases and helps determine adequate enforcement (Ayres & Braithwaite, 1992; Black & Baldwin, 2010; Custers, 2014; Sparrow, 2020). Although the inspector is increasingly aided in their decision by data-driven risk assessments (Human Environment and Transport Inspectorate, 2021), in current practice a ship is mostly selected for inspection based on its availability and the inspector's discretionary power.
Method
Sample
This study uses Dutch inland shipping inspection data from the ILT, Rijkswaterstaat (RWS), the National Police (NP), the Port of Rotterdam (PoR), and the Port of Amsterdam (PoA). Collectively, these agencies monitor around 40,000 (inter)national inland shipping objects (Human Environment and Transport Inspectorate, 2023). The data are registered in Inspectieview Binnenvaart (Inspection-view Inland Shipping). This digital application enables data sharing, data analysis and decision management. The dataset covers all inspections (n = 40,681) from March 2015 up until March 2020. Due to missing identification numbers, 79 inspections are excluded. The remaining 40,602 inspections are first analysed on the ship level and then on an aggregated business level. These inspections were carried out by the ILT (n = 6565), Rijkswaterstaat (n = 3733), the National Police (n = 7987), the Port of Rotterdam (n = 19,429), and the Port of Amsterdam (n = 2888).
Ships are identified using their European Number of Identification (ENI). On the ship level, the data entail 40,602 inspections of 7874 unique ships, totalling 17,925 registered violations. This amounts to, on average, 5.16 inspections per ship (range: 1–78), 2.28 violations per ship (range: 1–55), and 0.44 violations per inspection (range: 0.35–0.50).
Inspected ships are nested within businesses based on a Chamber of Commerce number or international alternative. No Chamber of Commerce number or international alternative, needed to aggregate the data on the business level, was registered for 8996 inspections (22.2% of the total of registered inspections) 3 . Data on the business level therefore pertains to 31,606 inspections, 14,206 violations, and 4036 businesses. This averages to 7.83 inspections per business (range: 1–411), 3.52 violations per business (range: 1–118), and 0.45 violations per inspection (range: 0.36–0.52).
As there is no information on the total (inspected and not-inspected) population of inland shipping vessels and companies active in the Netherlands during the follow-up period, the representativeness of the inspected subsample is unknown.
Sample characteristics
Characteristics of the ships are shown in Table 1. Most ships are motor cargo ships or motor tank ships (58.9%). The date of construction ranges from 1875 to 2020 (mean = 1976; modus = 2009). Size classification (based on width*length) ranges from CEMT-size category I to VI. The CEMT size (after the Conférence Européenne des Ministres de Transport) corresponds to the classification of inland waterways based on the largest ship that is allowed on that specific waterway (Rijkswaterstaat, 2020) 4 . Ships outside this size classification are categorised as undersize or oversize. CEMT size V is the most common (maximum: 11.50 m wide * 111.01+ m long). Most ships are registered in the Netherlands (n = 5400; 68.6%) or in another Western European country (n = 1856; 23.6%).
Ship characteristics (n = 7874).
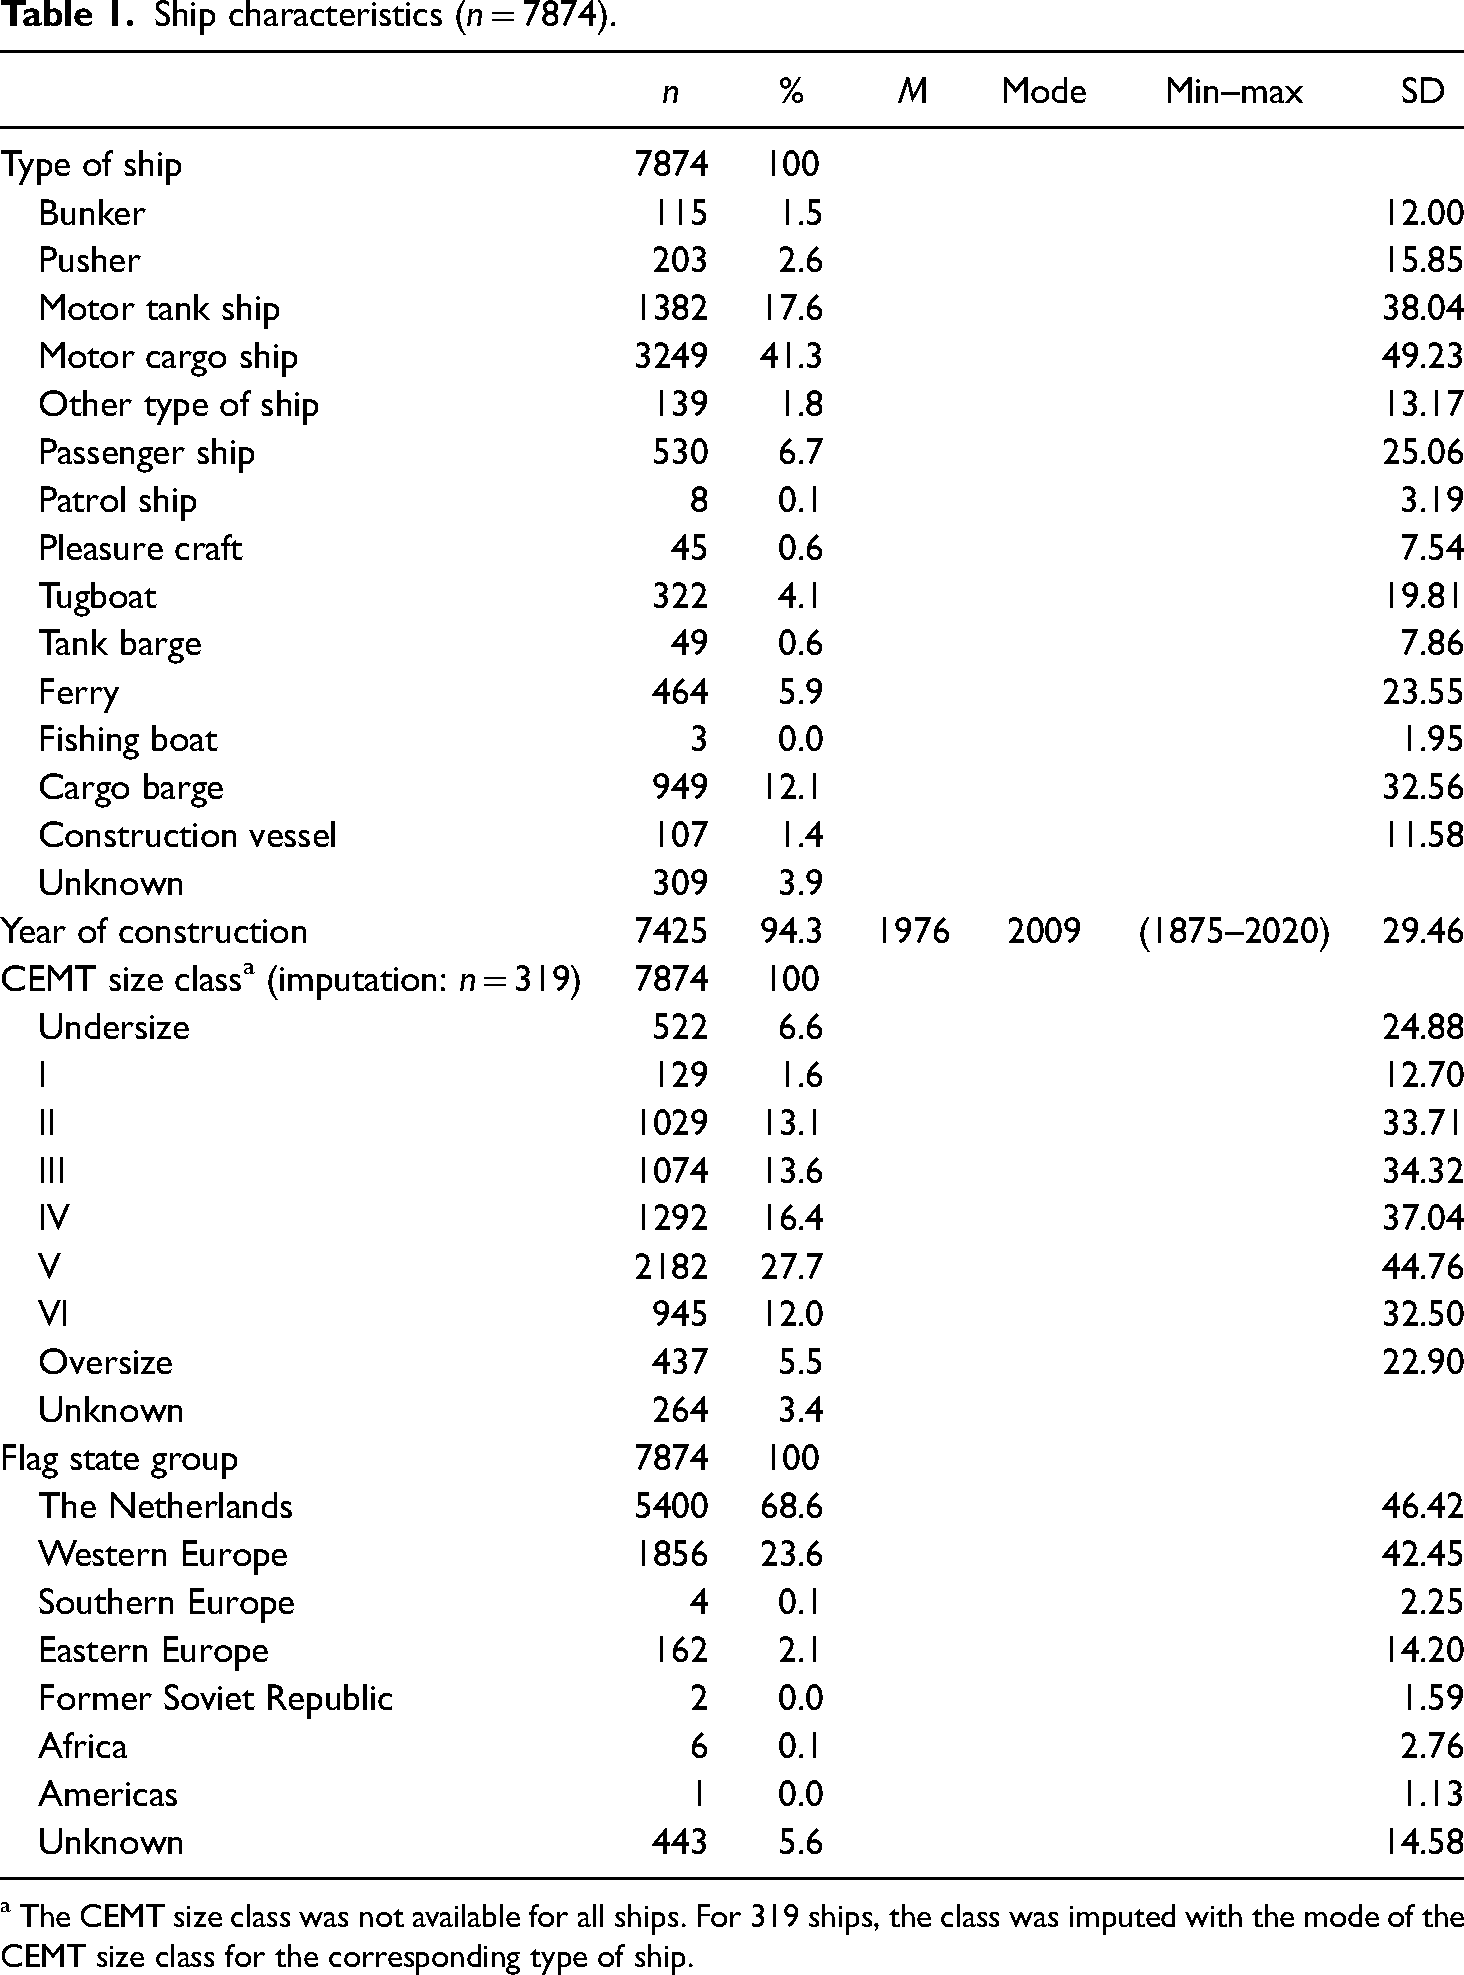
The CEMT size class was not available for all ships. For 319 ships, the class was imputed with the mode of the CEMT size class for the corresponding type of ship.
In Table 2, the characteristics of the businesses are displayed. Of the total of 4036 businesses identified, 41.2% (n = 1661) are registered as a general partnership and 33.1% (n = 1337) as a limited liability company. An average business has 6.8 employees (mode = 2) and is 10.13 years old. A majority of 48.7% (n = 1978) of the businesses are mainly involved in inland shipping (cargo, tank, or towage).
Business characteristics (n = 4036).
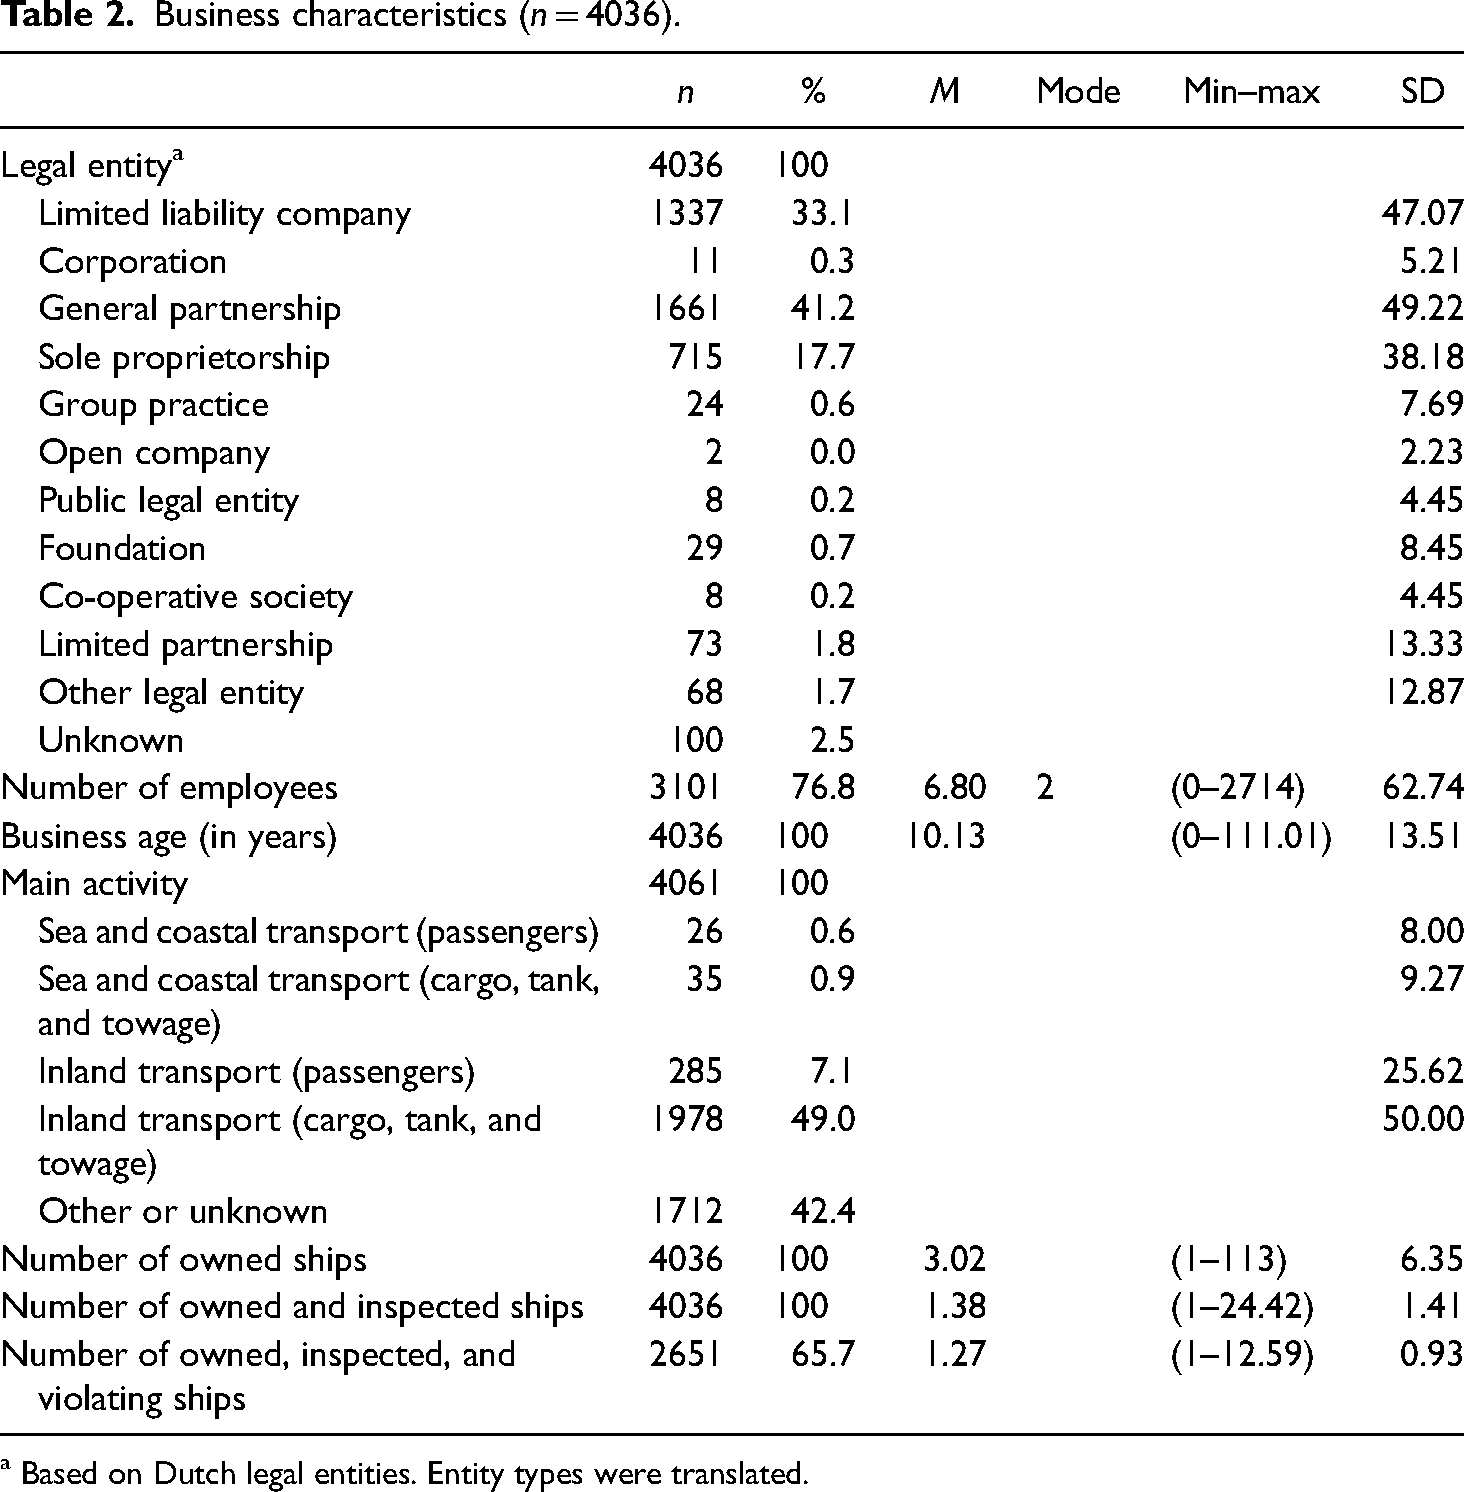
Based on Dutch legal entities. Entity types were translated.
Analysis
The distributions of corporate offending are analysed using Lorenz curves and Gini coefficients. These measures indicate inequality in data. For accurate comparisons, generalised versions of the Lorenz curve and Gini coefficient for the frequency and prevalence of offending in businesses and ships are used (Fox & Tracy, 1988; Martinez et al., 2017). Group-based trajectory modelling (GBTM) is employed to analyse developmental trajectories (Van Dulmen et al., 2009; Nagin, 2005; 2014; Piquero & Benson, 2004) Here, GBTM is used to analyse the development of corporate offending at both the ship and the business level. GBTM assumes the existence of latent groups with differing longitudinal patterns in terms of the level of offending (trajectory height) and the variation in offending frequency over time (trajectory shape). This allows for differentiation between groups with similar offending levels (height) but different developments (shape). It underscores the possibility of behavioural change within groups (Nagin, 2005; Van der Nest et al., 2020; Sweeten, 2014). Traditionally, trajectories are estimated based on the subject's age. In an organisational setting, subjects cannot easily be aligned based on their age. Moreover, how corporate age should best be defined and operationalised is still up for debate (Blokland et al., 2021; Hunter, 2021). In this study, trajectories are therefore estimated based on calendar years. To control for differences in the number of inspections per calendar year, the model is estimated on the average number of violations per inspection.
The GBTM model needs, on average, at least three data points per object (Sweeten, 2014). To account for the large number of ships and businesses without registered violations, a zero-inflated Poisson distribution is used (Van der Nest et al., 2020). The zero-inflated Poisson distribution is meant for data that display intermittency: periods in which no crime occurs (Nagin & Land, 1993; Nagin, 2005). GBTM is regarded as robust for missing data (Nagin & Land, 1993; Niyonkuru et al., 2013). Models will be iteratively estimated for one to ten groups as linear, quadratic, and cubic models. Model selection is based on the Bayesian (BIC) and Akaike Information Criterion (AIC) (Jones et al., 2001; Kass & Raftery, 1995; Neath & Cavanaugh, 2012), and additional – practical – considerations (i.e. parsimony and group probability distributions; Nagin, 2005; Nagin & Odgers, 2010).
Trajectory groups are compared on a selection of available industry characteristics and organisational characteristics (generic and industry-specific). As in previous studies, this selection is primarily based on availability. Potentially relevant information on corporate culture or financial position for example, as well as personal characteristics of business executives and ship captains are not available at this point. Groups are compared using (multivariate) analysis of variance (ANOVA/MANOVA) with GBTM group membership probability as independent variable and group characteristics as dependent variables. Characteristics are being treated as stable over time. Effect sizes (ω2) of 0.01, 0.06, and 0.14 are considered small, medium, and large effects respectively (Ferguson, 2009; Kirk, 1996). Differences between trajectory groups are additionally analysed using individual post hoc tests (Tukey's test or Games-Howell test) for ω2 > 0.01 unless otherwise specified.
Results
Distributions of corporate offending
Figure 1 shows the uneven distribution of violations (n = 17,925) within the population of ships. Most ships have no (39.0%; n = 3074) or few (1 to 5 violations; 44.8%; n = 3529) registered offences. In line with other research (e.g. Alalehto, 2010; Clinard & Yeager, 1980/2017; Kluin et al., 2024; Simpson et al., 2024; Sutherland, 1949/1983), a small minority of ships is responsible for a disproportionate share of all violations. Of all ships, 0.5% (n = 37), those with 20 or more violations each, are responsible for 5.2% (n = 933) of all violations, while 4.6% (n = 362) of ships, those with more than 10 violations, are responsible for more than a quarter (28.1%, n = 5051) of all violations. At the business level, 31,606 inspections of 4036 businesses resulting in 14,206 violations were analysed. Figure 2 shows offences at the business level to be unevenly distributed as well. Most businesses have no (33.8%; n = 1363) or a few (1 to 5 violations; 42.5%; n = 1714) registered offences. Of all businesses, 2.3% (n = 93), those with 20 or more violations, are responsible for 22.2% (n = 933) of all violations. Almost half (49.4%, n = 7014) of all violations come to the credit of a small proportion of businesses (9.6%, n = 389) with more than 10 registered offences each. On both levels, the number of inspections is also disproportionate, but not as disproportionate as number of registered violations. This indicates that the observed skewness in offending does not exclusively stem from a disproportionate allocation of inspection efforts.
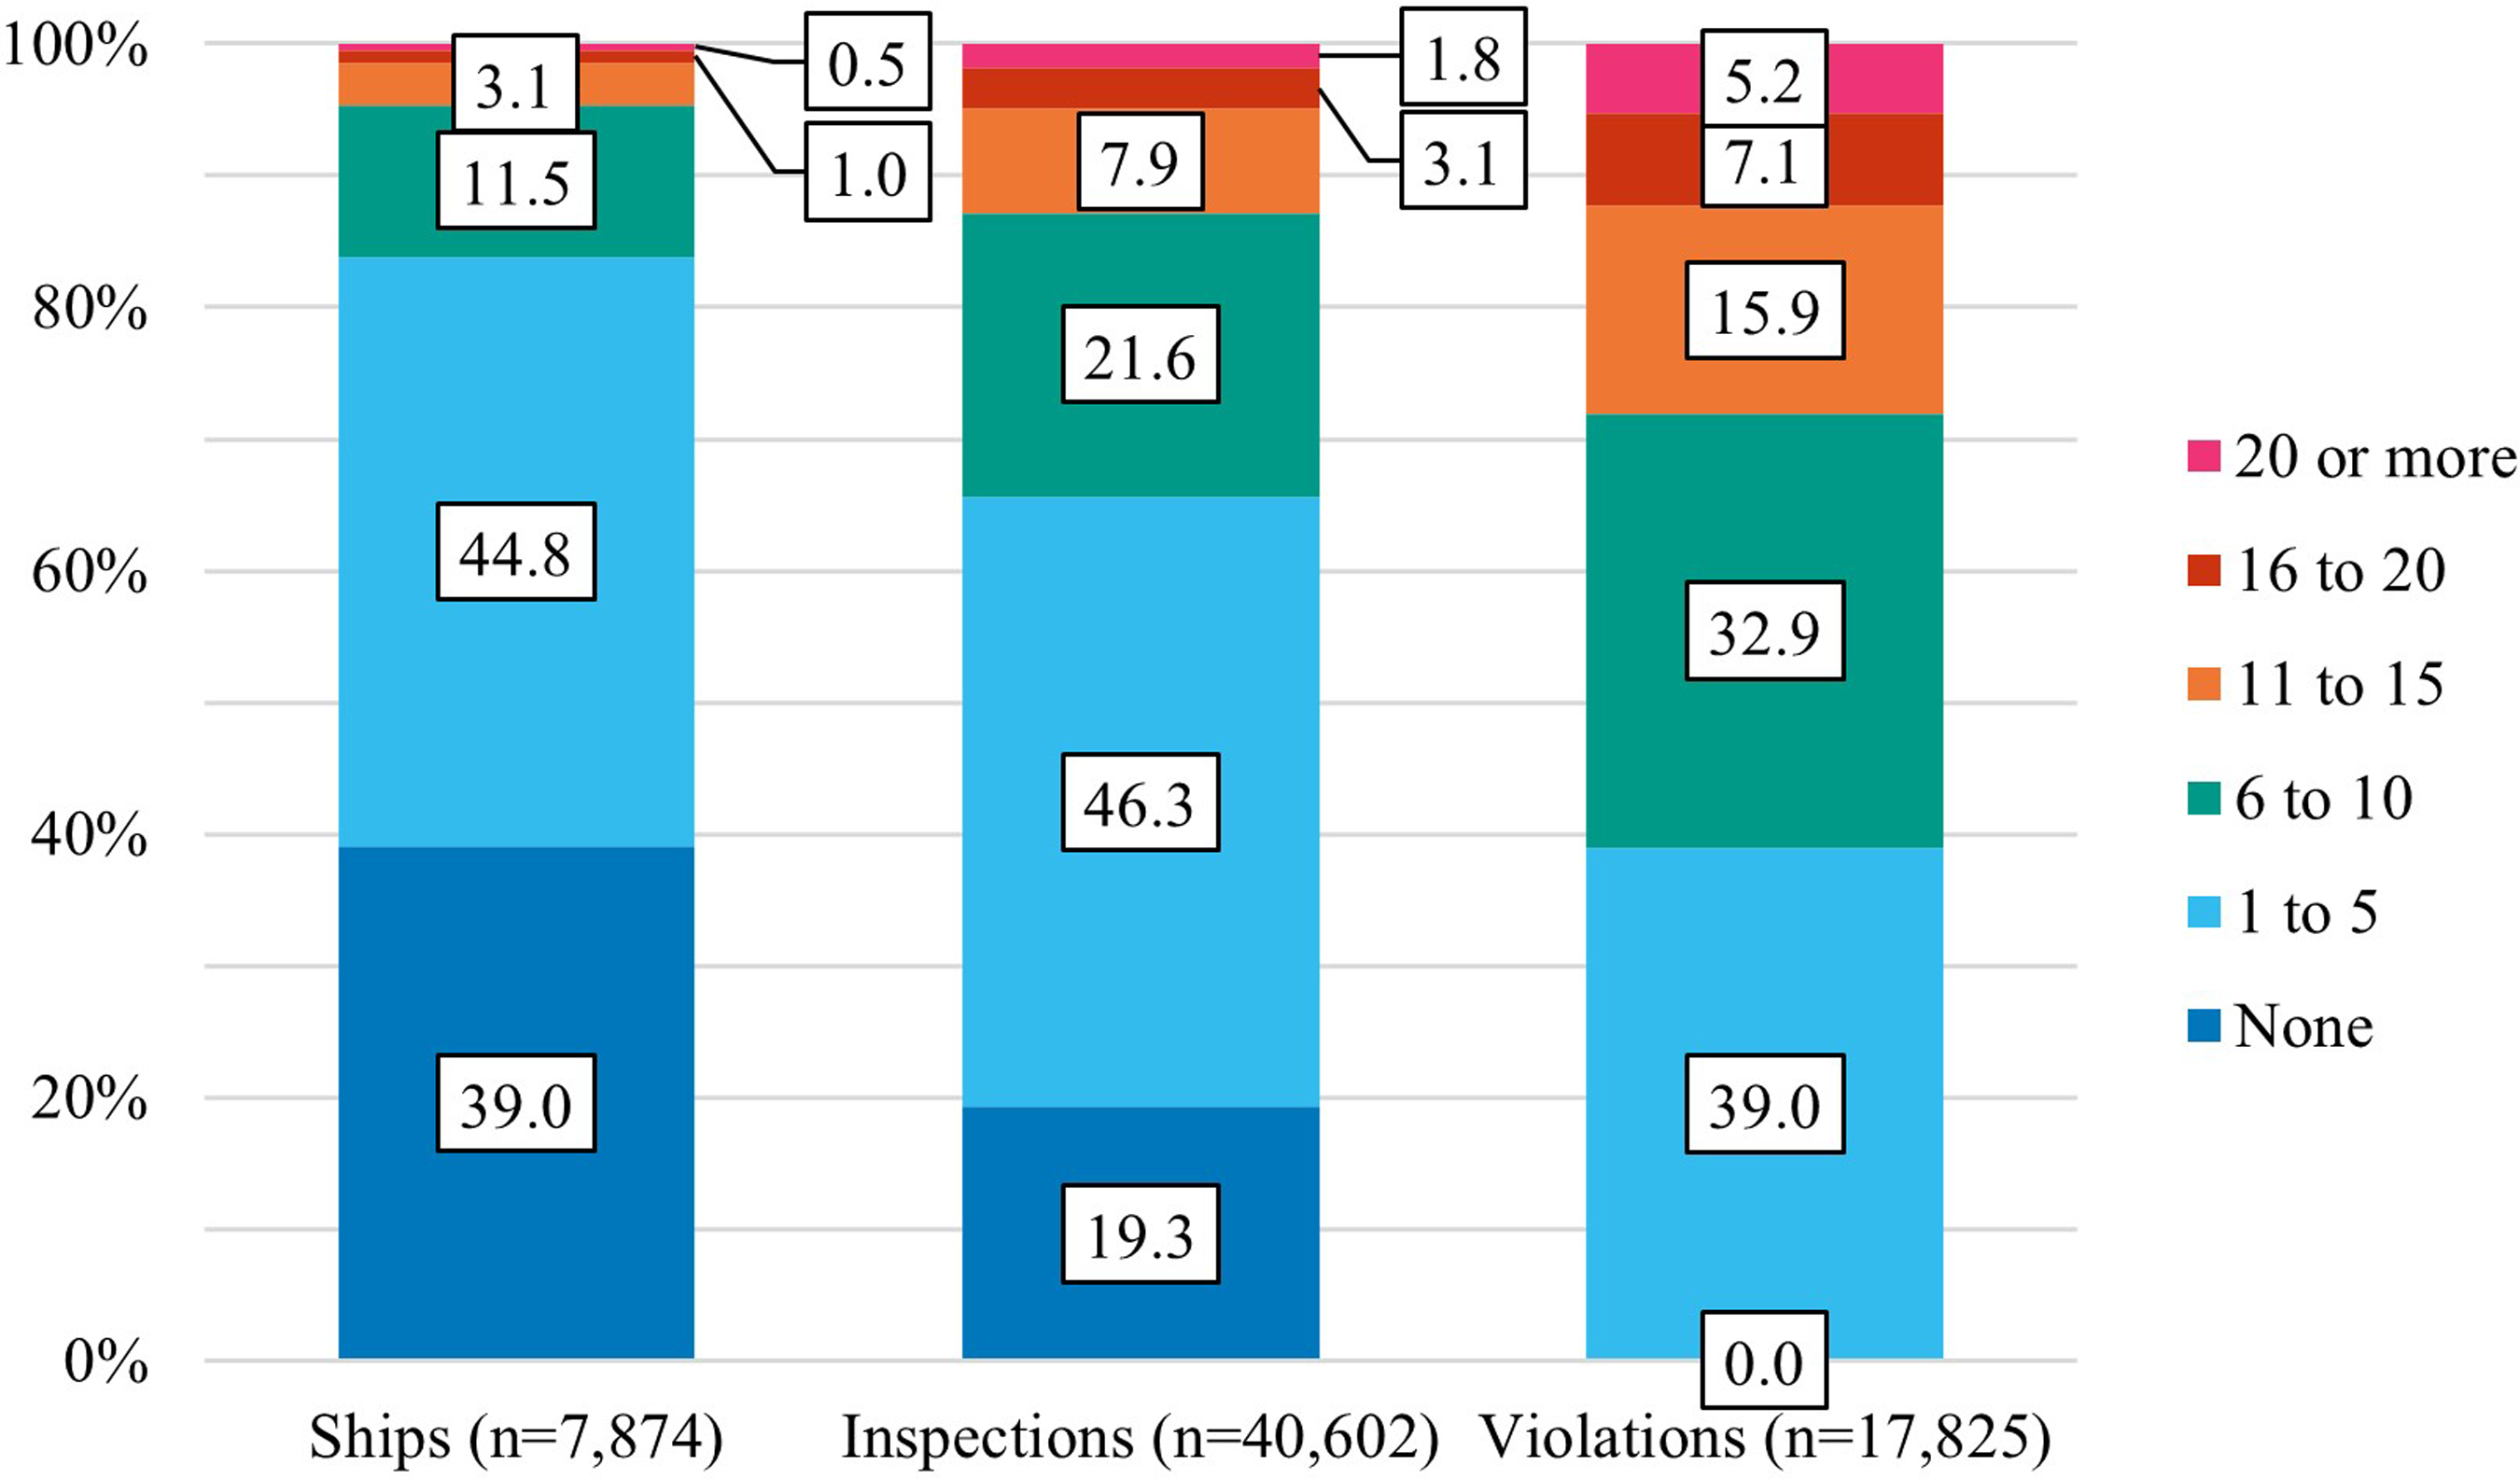
Distribution of ships, inspections, and offences in percentages. Categorised based on the number of offences.
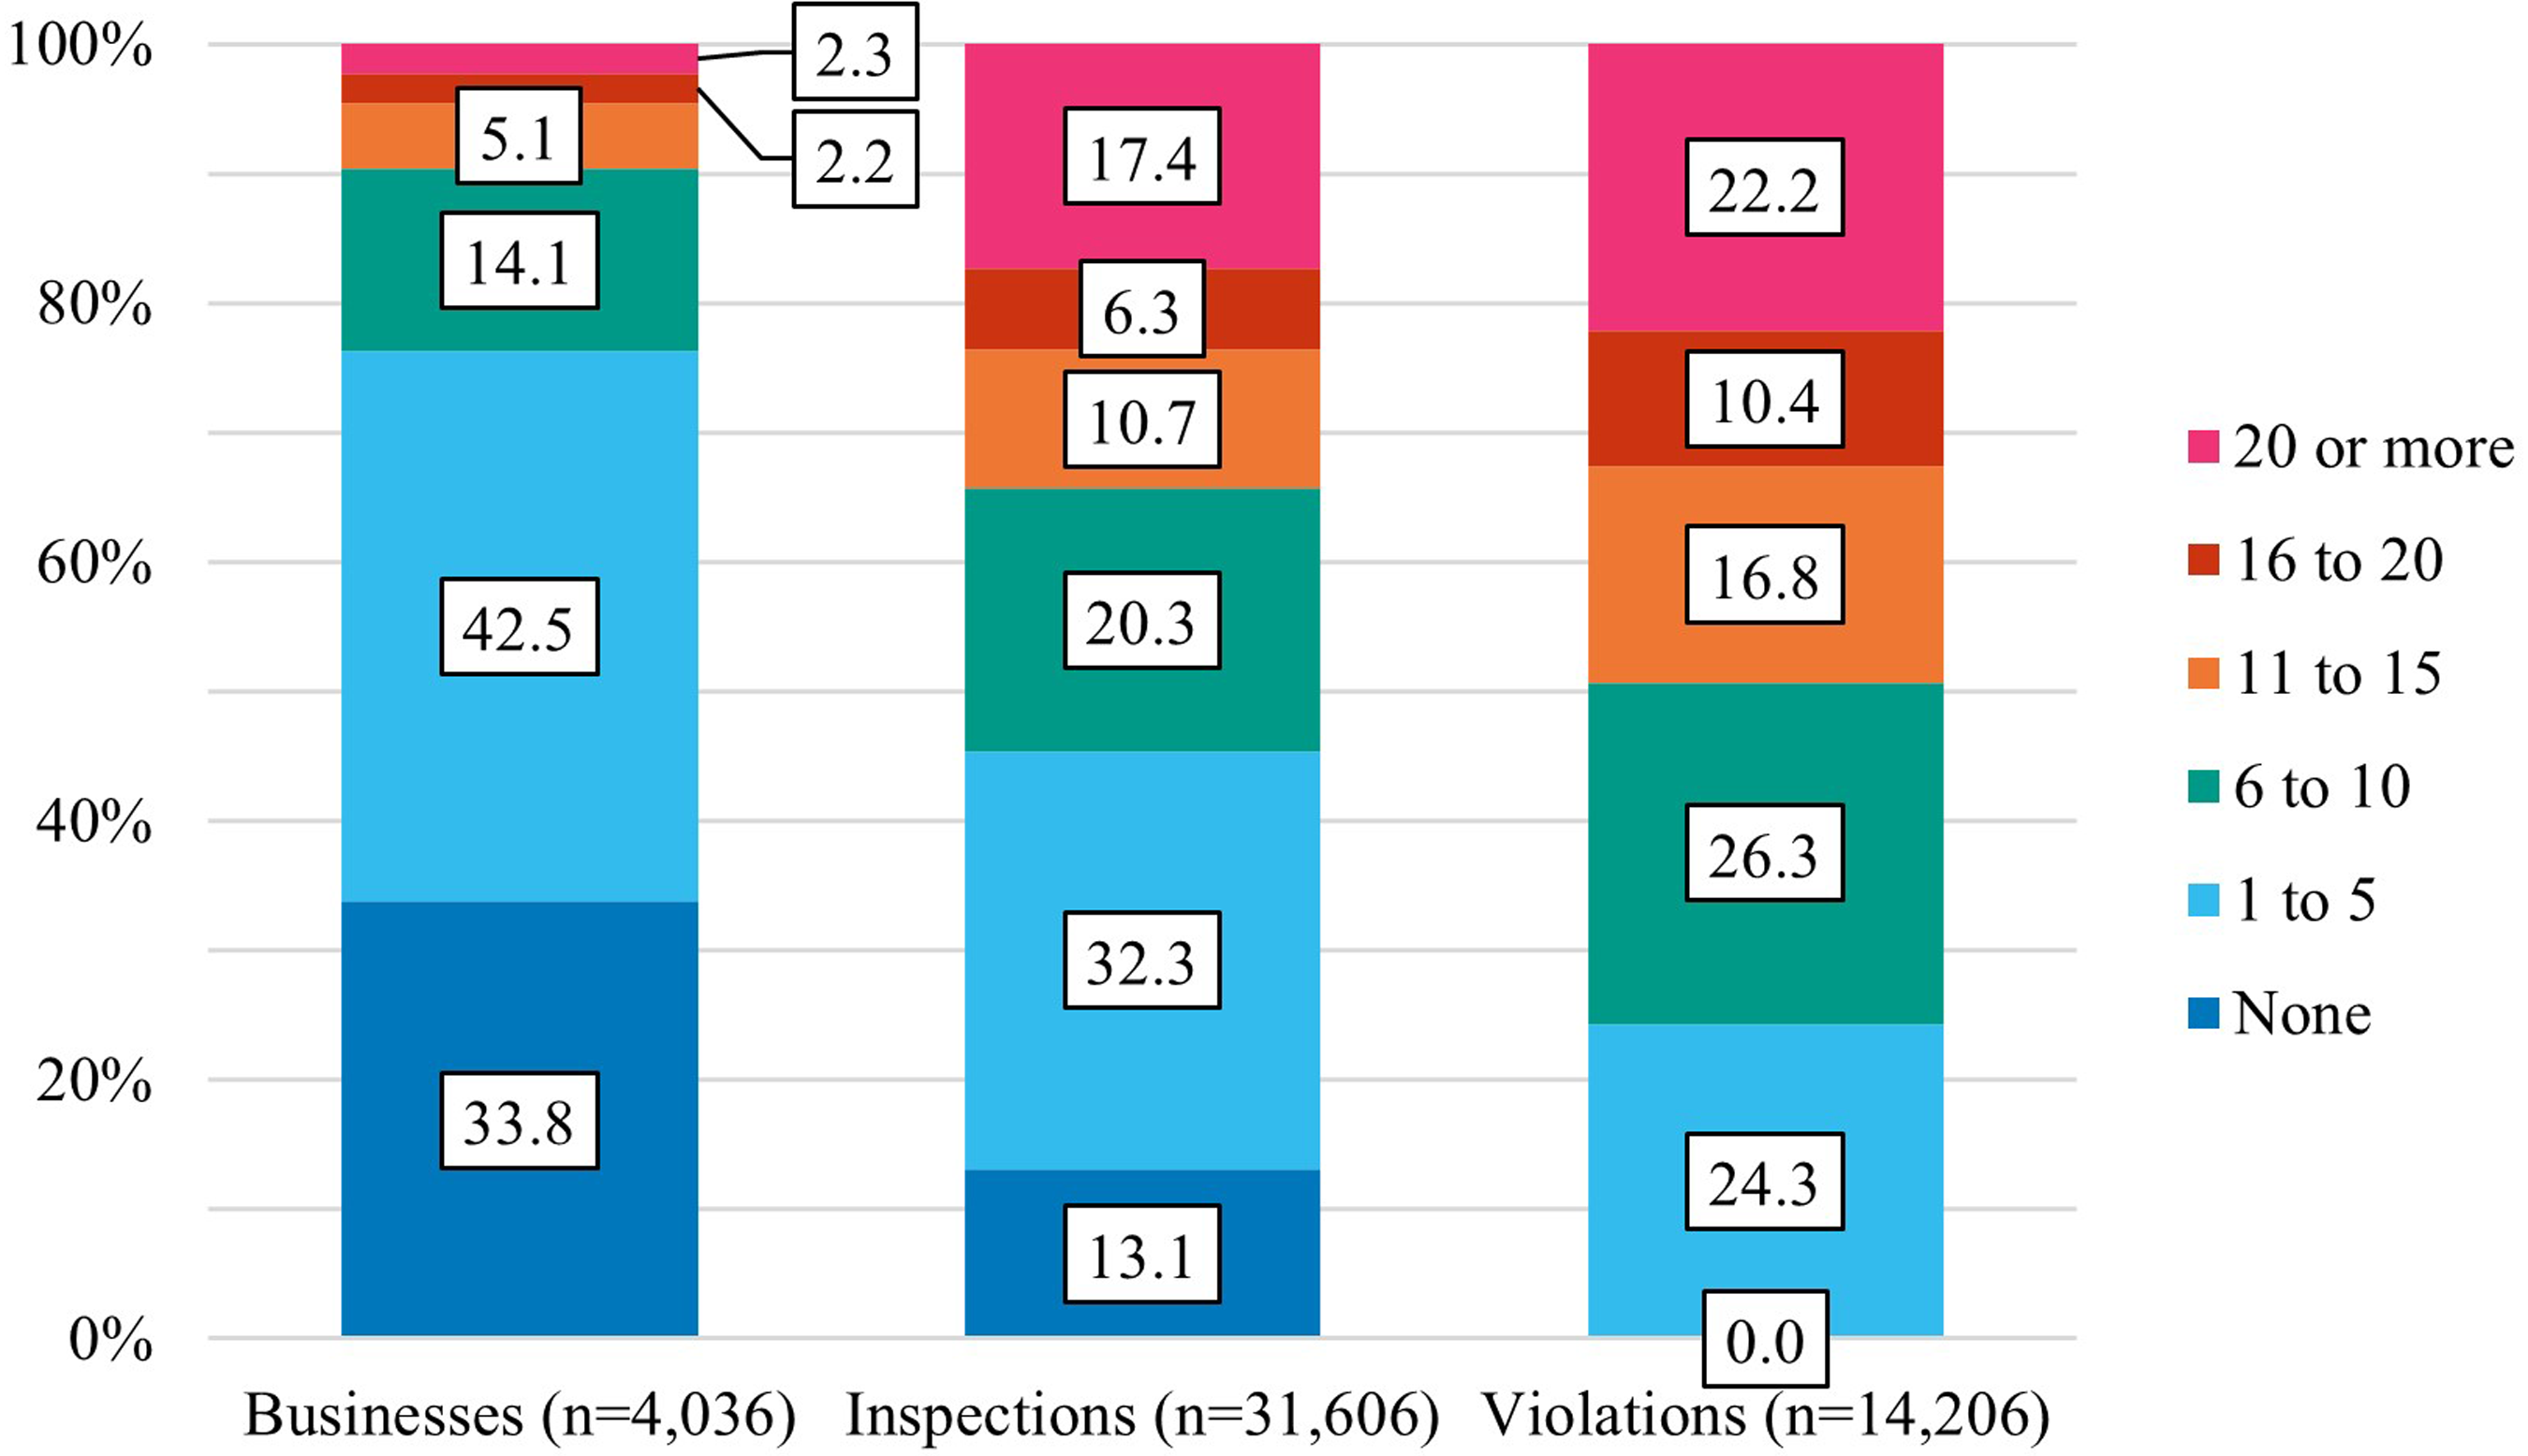
Distribution of businesses, inspections, and offences in percentages. Categorised based on the number of offences.
A further analysis of proportionality at both levels is displayed in Figure 3. Lorenz curves for the prevalence (incl. compliant behaviour) and frequency (excl. compliant behaviour) of offending on the ship and business level are compared to an equal distribution of offending in the population. Offending is most skewed on the business level, as is indicated by the higher Gini coefficient. This also suggests a tendency of highly frequent offending ships to cluster in particular businesses.
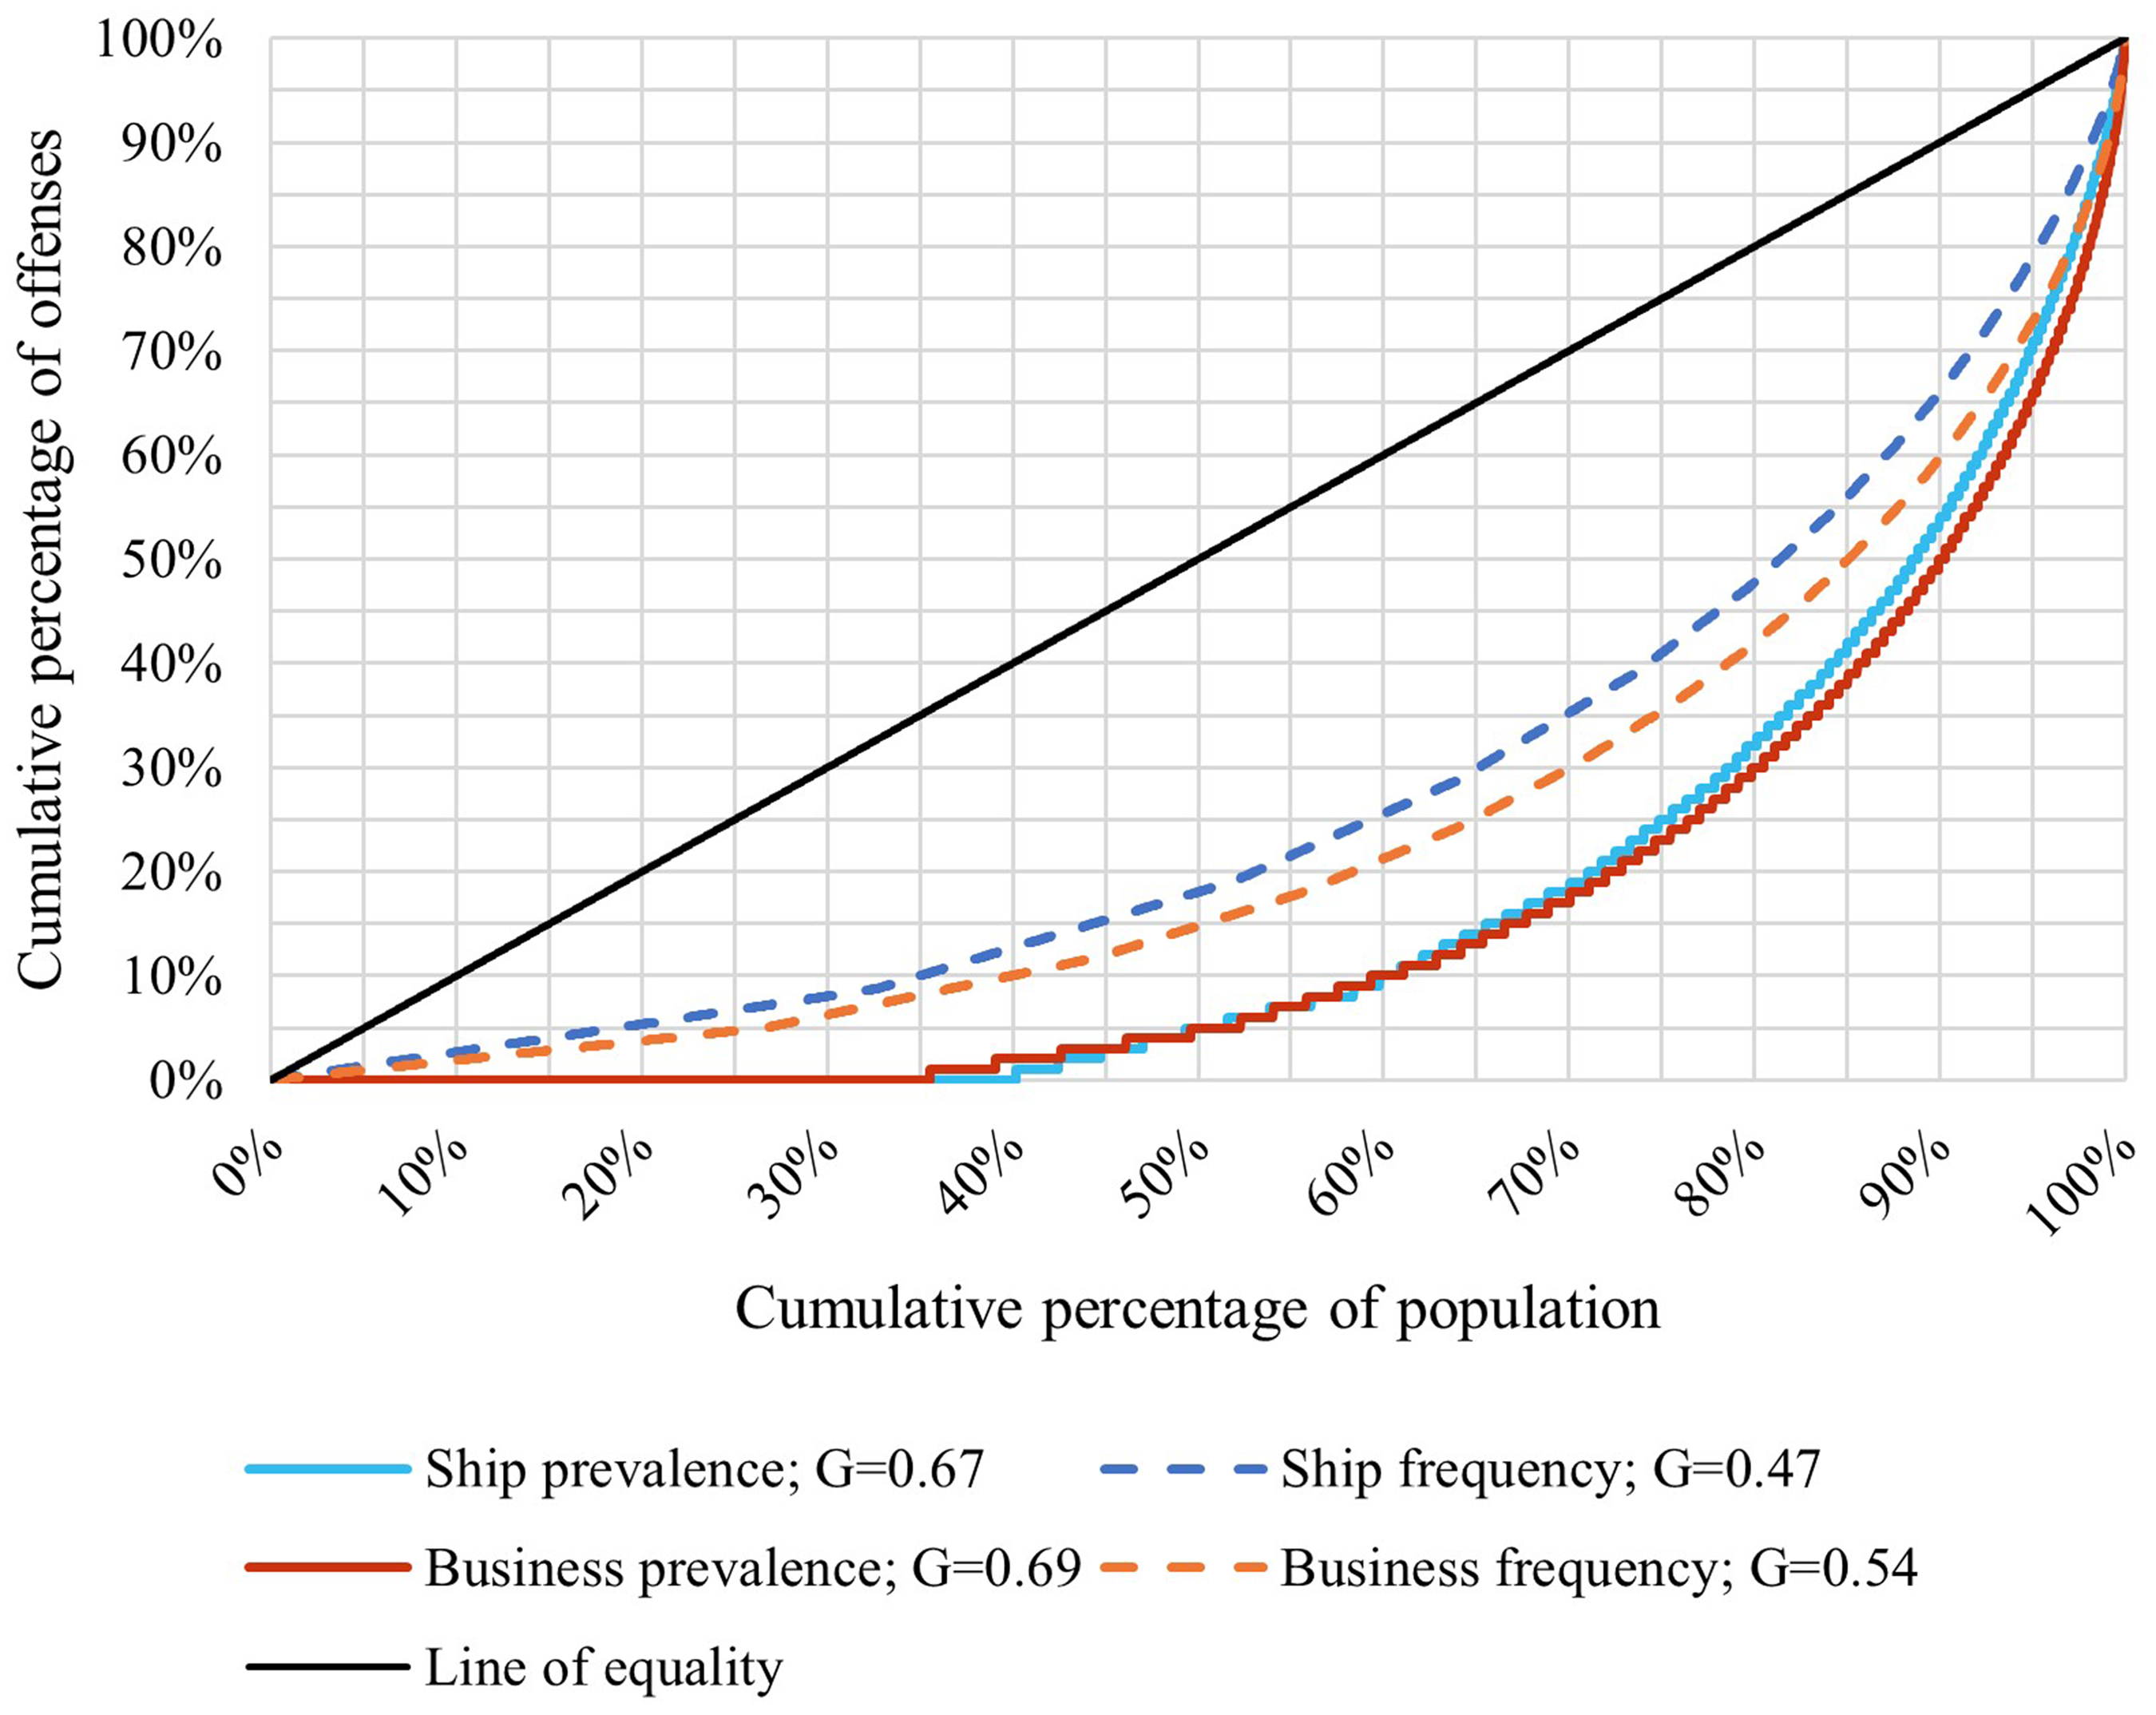
Lorenz curves for prevalence and frequency against the line of equality. G = Gini coefficient.
Offending trajectories
At the ship level, four trajectory groups can be identified, as seen in Figure 4. They can be characterised as a (1) Constant low, (2) Increasing, (3) Decreasing, and (4) Strongly decreasing group. Most ships have little to no registered offences. These ships are classified as Constant low (89.25%; n = 6920). On average, less than 0.31 offences per inspection are registered for this group over the entire observation period. This is below the average for the entire population (0.44). The other, smaller, groups at some point violate more often per inspection than is average, but the direction of their development over the follow-up period differs. The Increasing group (3.93%; n = 304) starts at 0.94 violations per inspection and rises to 2.66 violations per inspection. The Decreasing group (5.64%; n = 437) starts at 3.77 and decreases to 0.14 violations per inspection; less than the population average. The downward slope is steepest in the last group; the Strongly decreasing group (1.19%; n = 92) which starts at 9.31 and decreases to 2.14 violations per inspection, just below the level of the Increasing group in 2020.
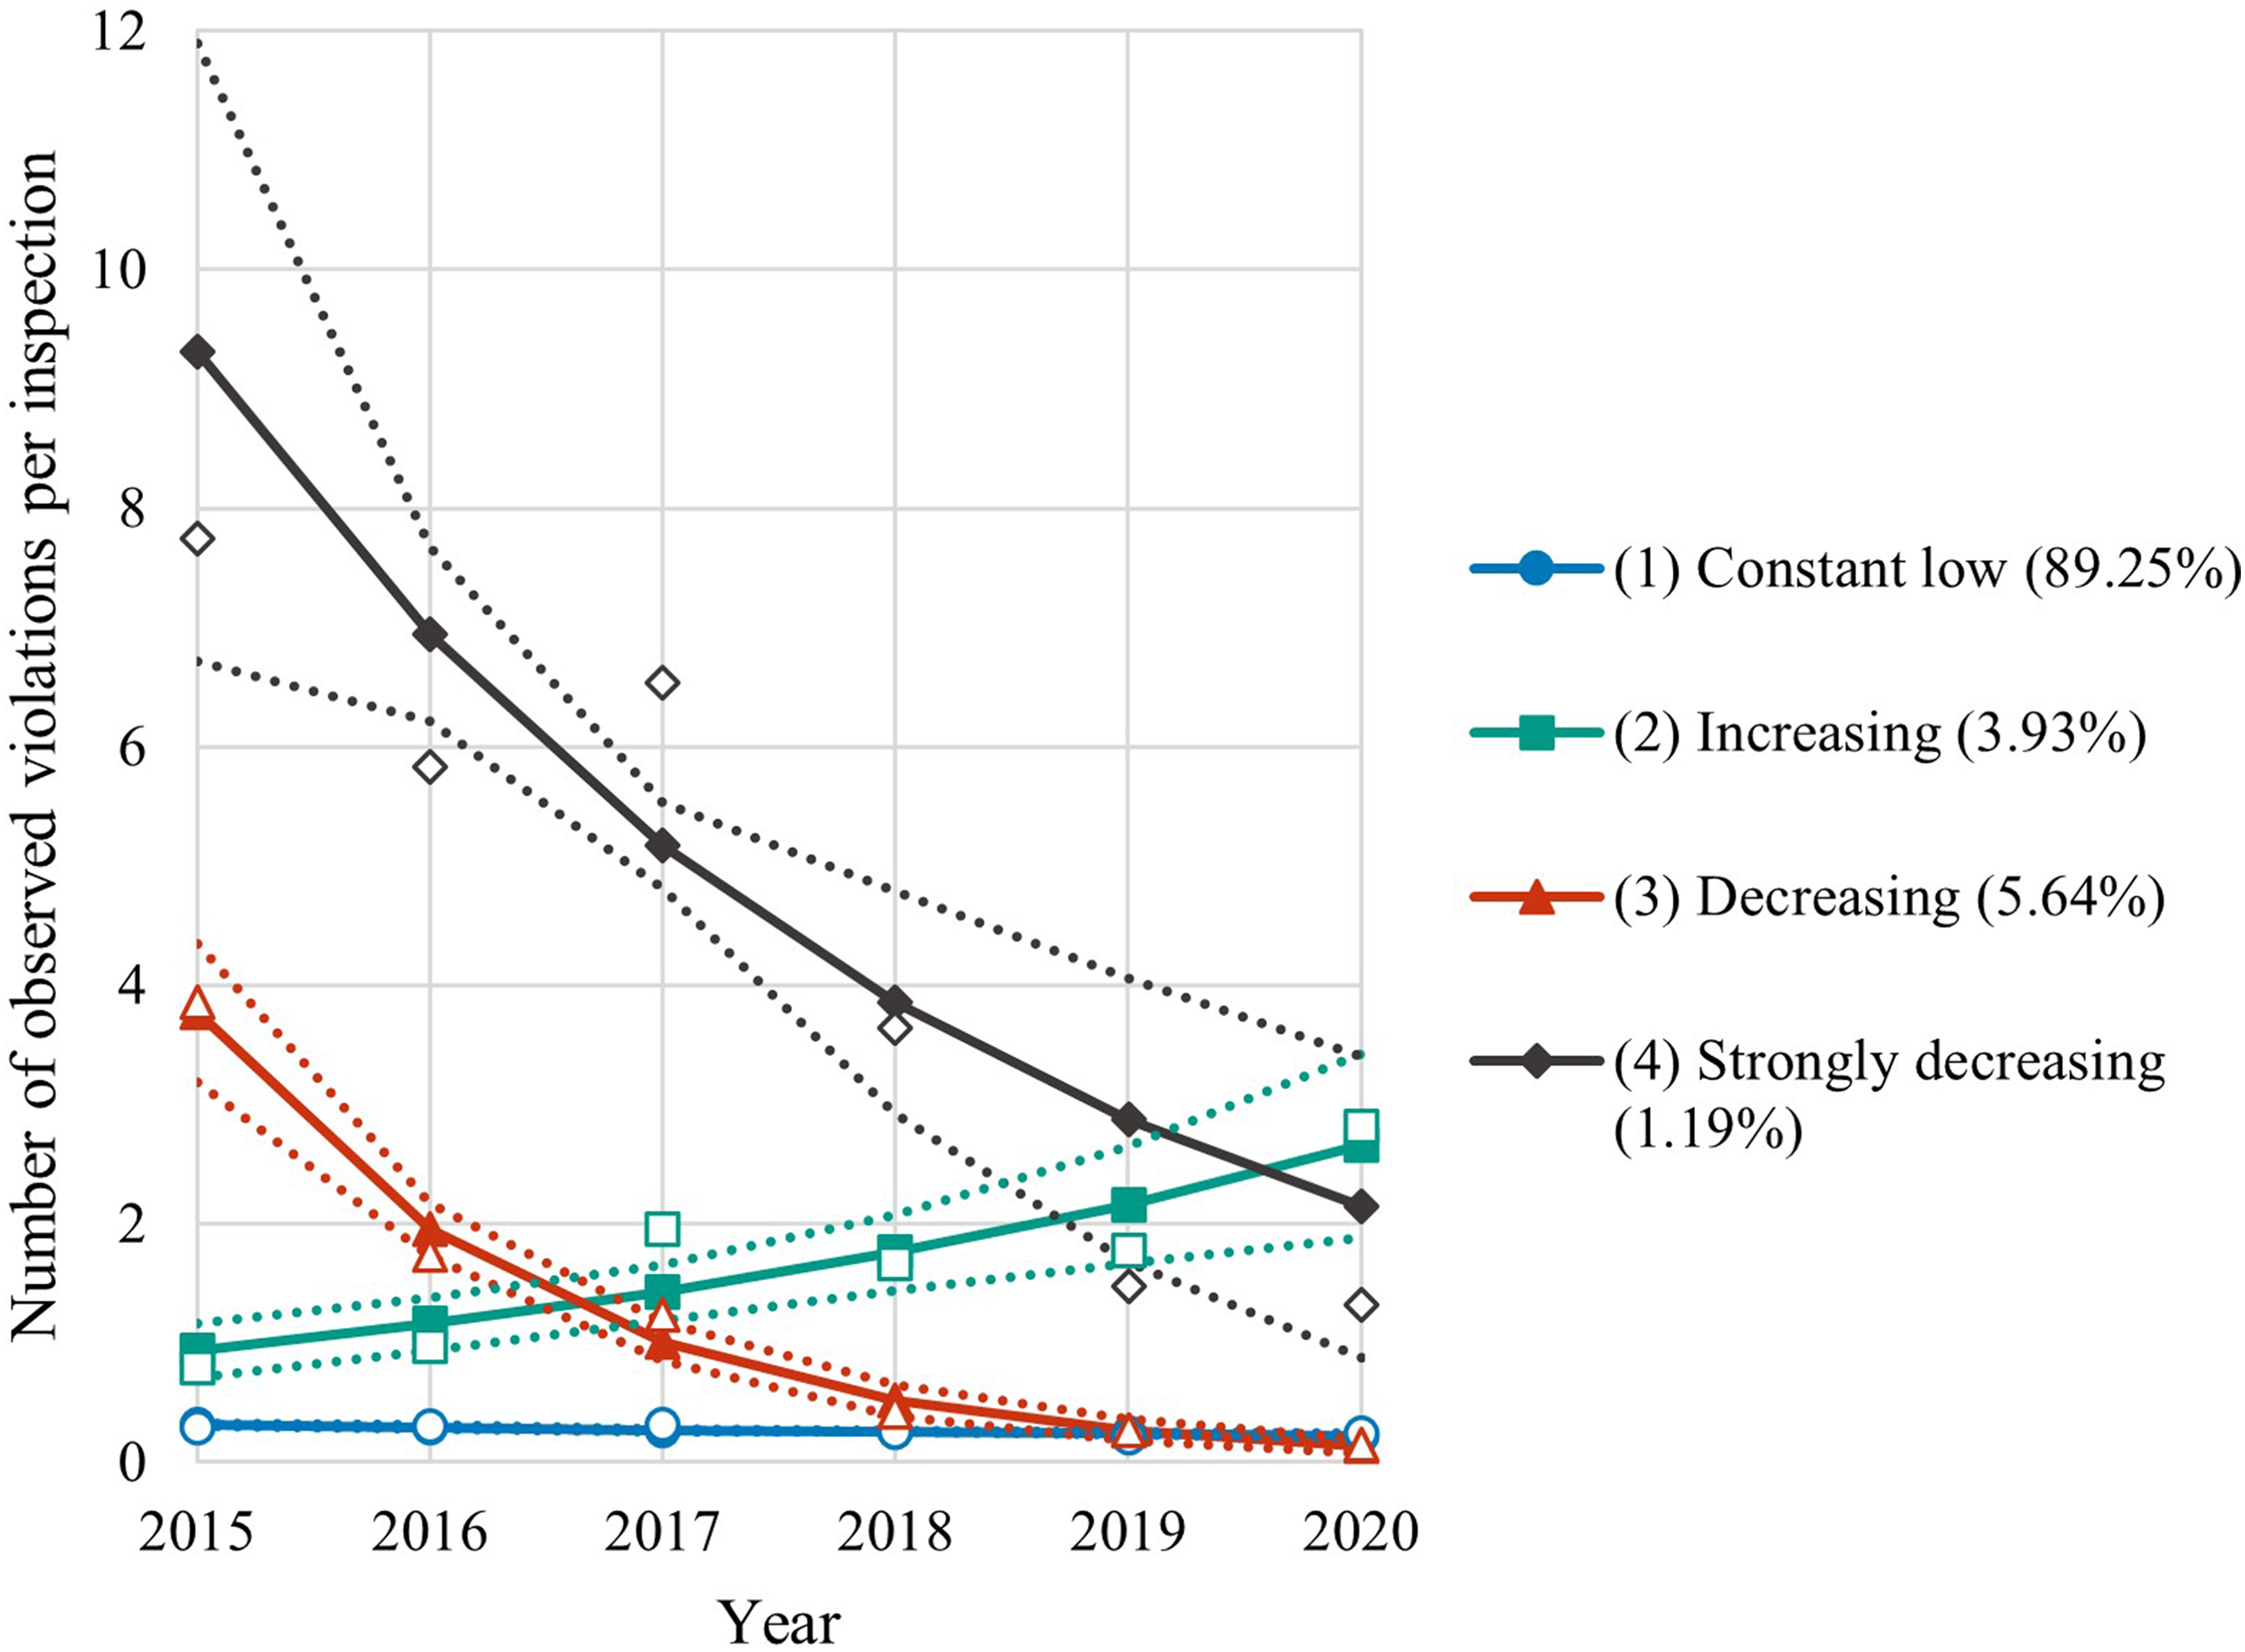
Trajectory groups on the ship level based on the number of violations per inspection over 2015–2020 (n = 7754; BIC = −16,112; AIC = −16,074).
At the business level, again four trajectory groups can be identified. These groups are displayed in Figure 5. They can be characterised as a (1) Constant high, (2) Decreasing, (3) Constant low, and (4) Increasing group. Analogous to the grouping on the ship level, most businesses are classified as a part of the Constant low group (n = 3540; 88.77%). The Decreasing (n = 247; 6.20%) and Increasing (n = 144; 3.62%) groups resemble the development of their namesakes on the ship level. Offending levels for the Decreasing group drop from 3.49 to 0.15 violations per inspection, which is less than the population average of 0.45. Offending in the Increasing group goes from 0.79 to 2.54 violations per inspection. In contrast to the trajectory groups on the ship level, among businesses a Constant high group (n = 56; 1.41%) is identified. This group registers 4.74 violations per inspection on average over the entire period. However, the confidence intervals for this group are wide and the average number of offences per year varies considerably. Despite a tendency for frequent violating ships to cluster in particular businesses, the overall lower number of observed violations on the business level indicates that frequent offending businesses do not exclusively consist of frequent offending ships.
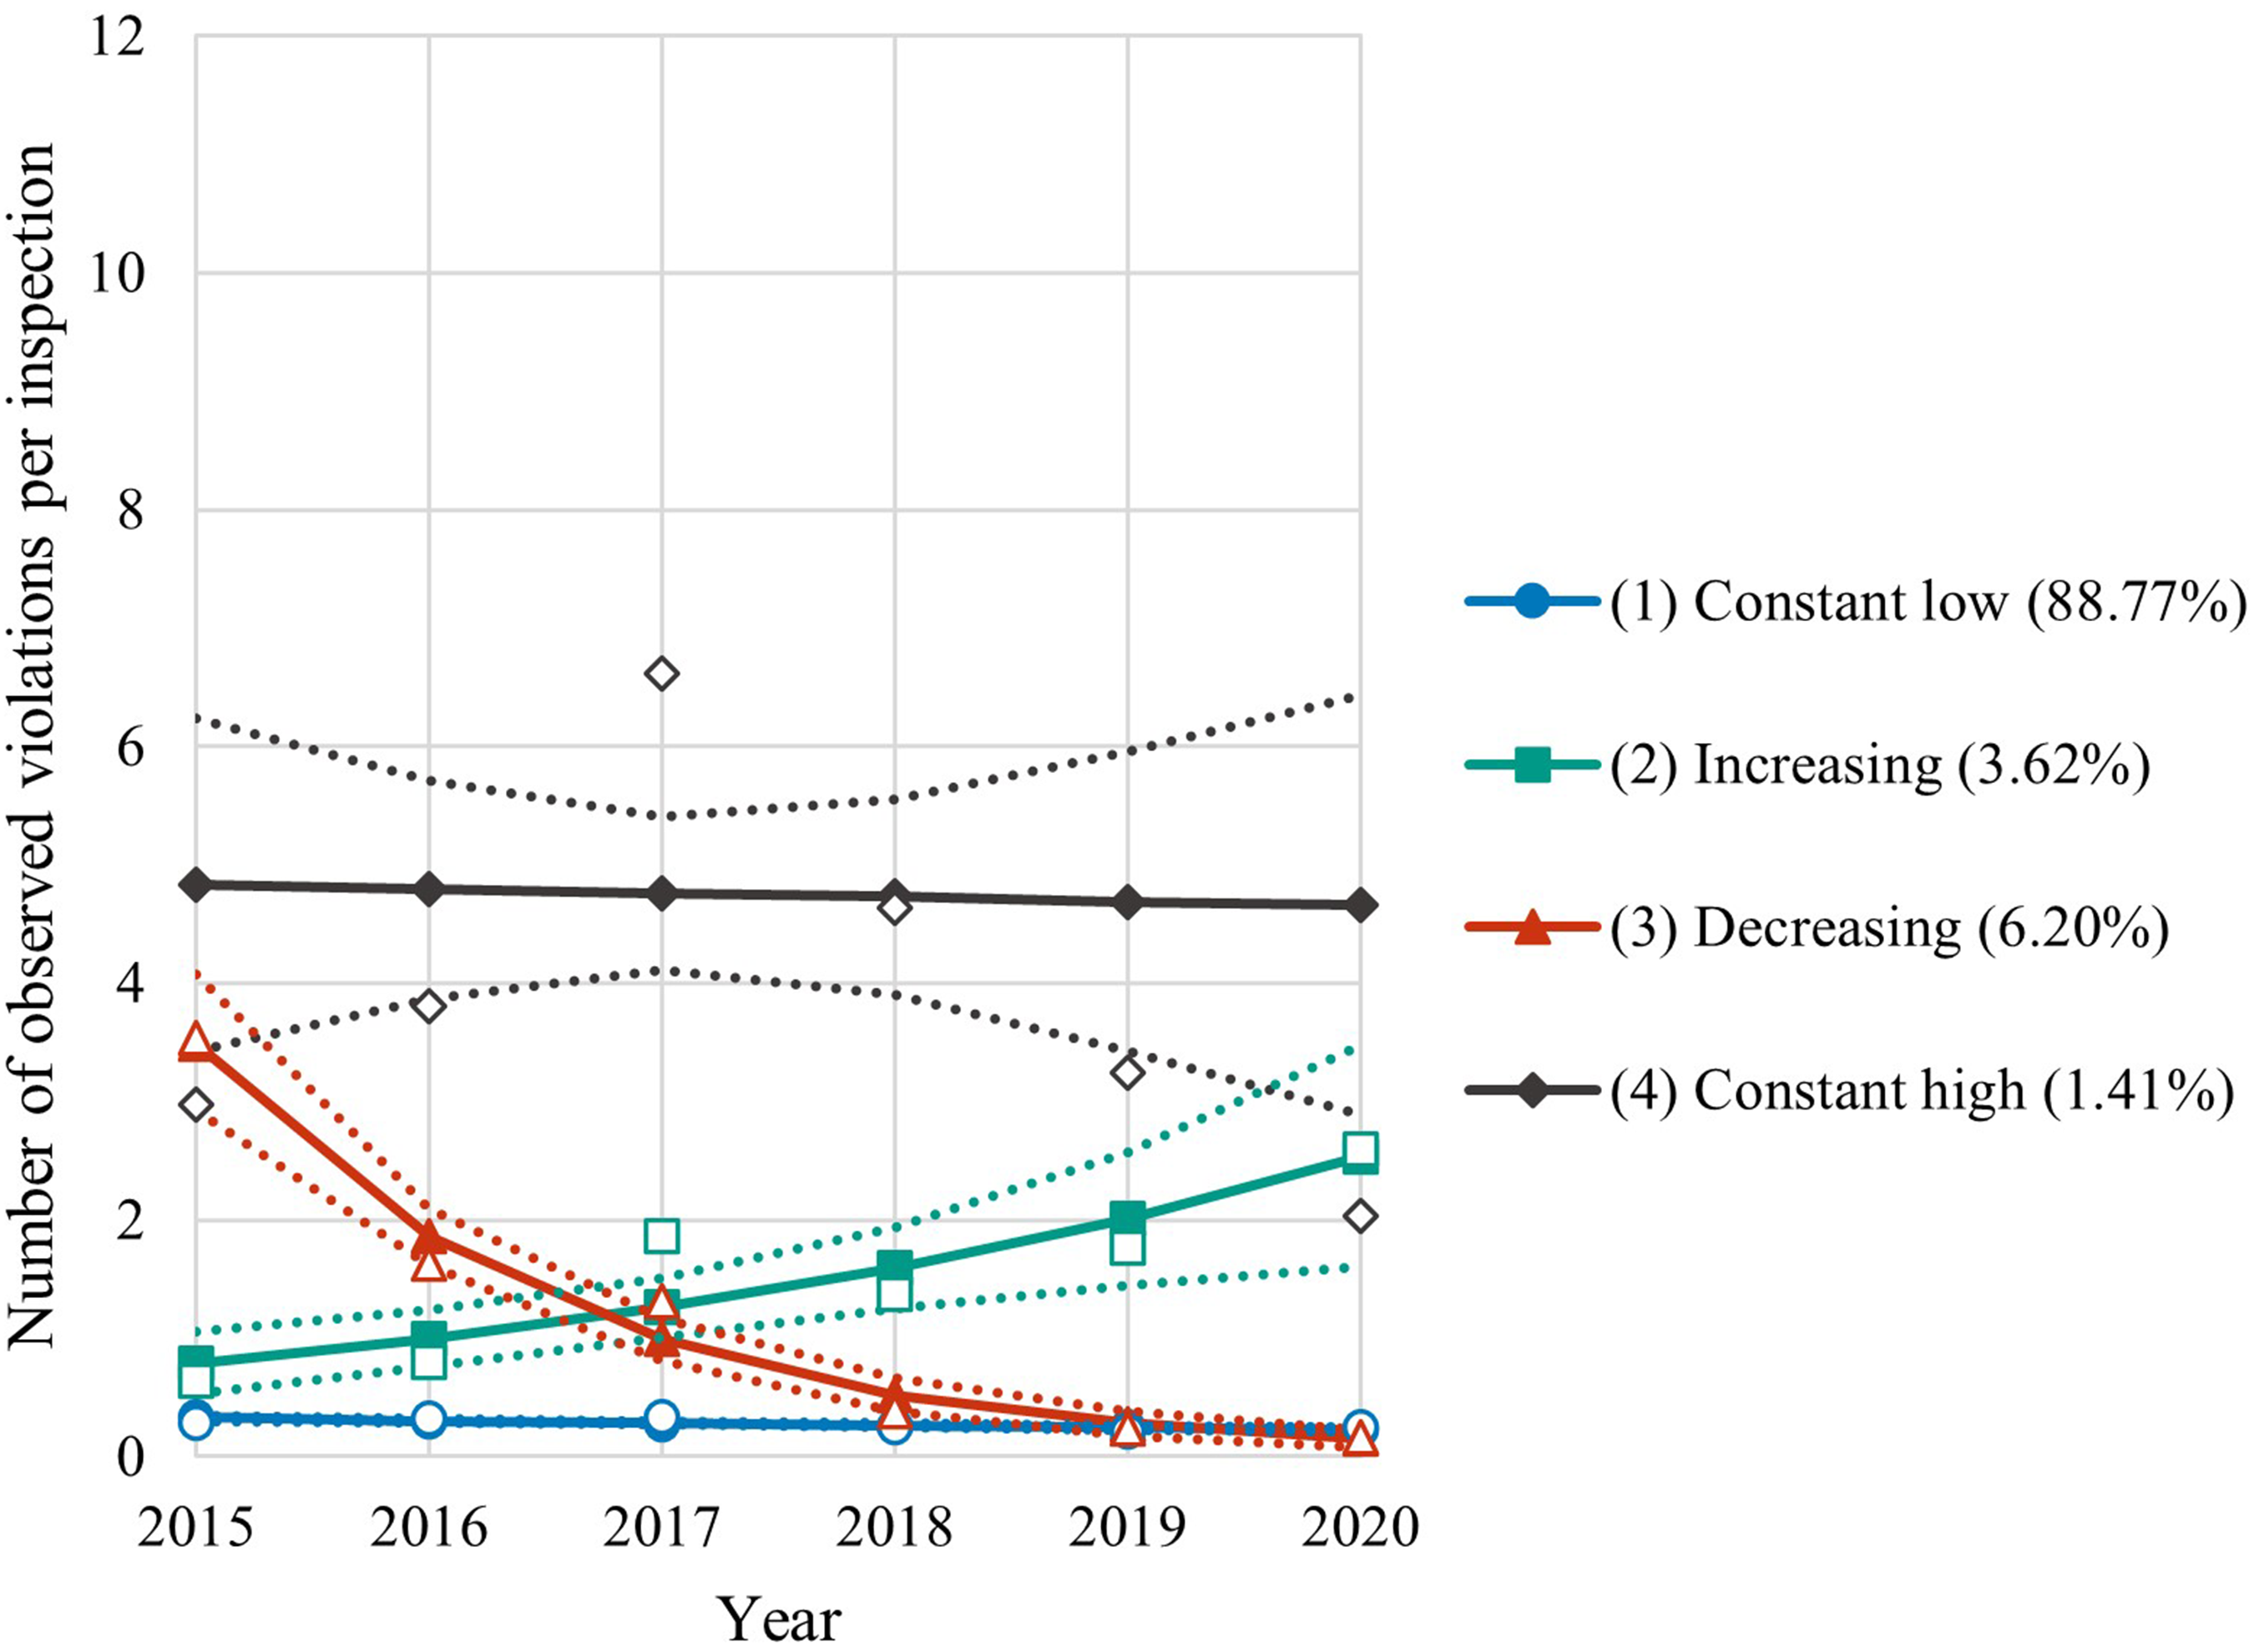
Trajectory groups on the business level based on the number of violations per inspection over 2015–2020 (n = 3988; BIC = −9189; AIC = −9154).
Trajectory group characteristics
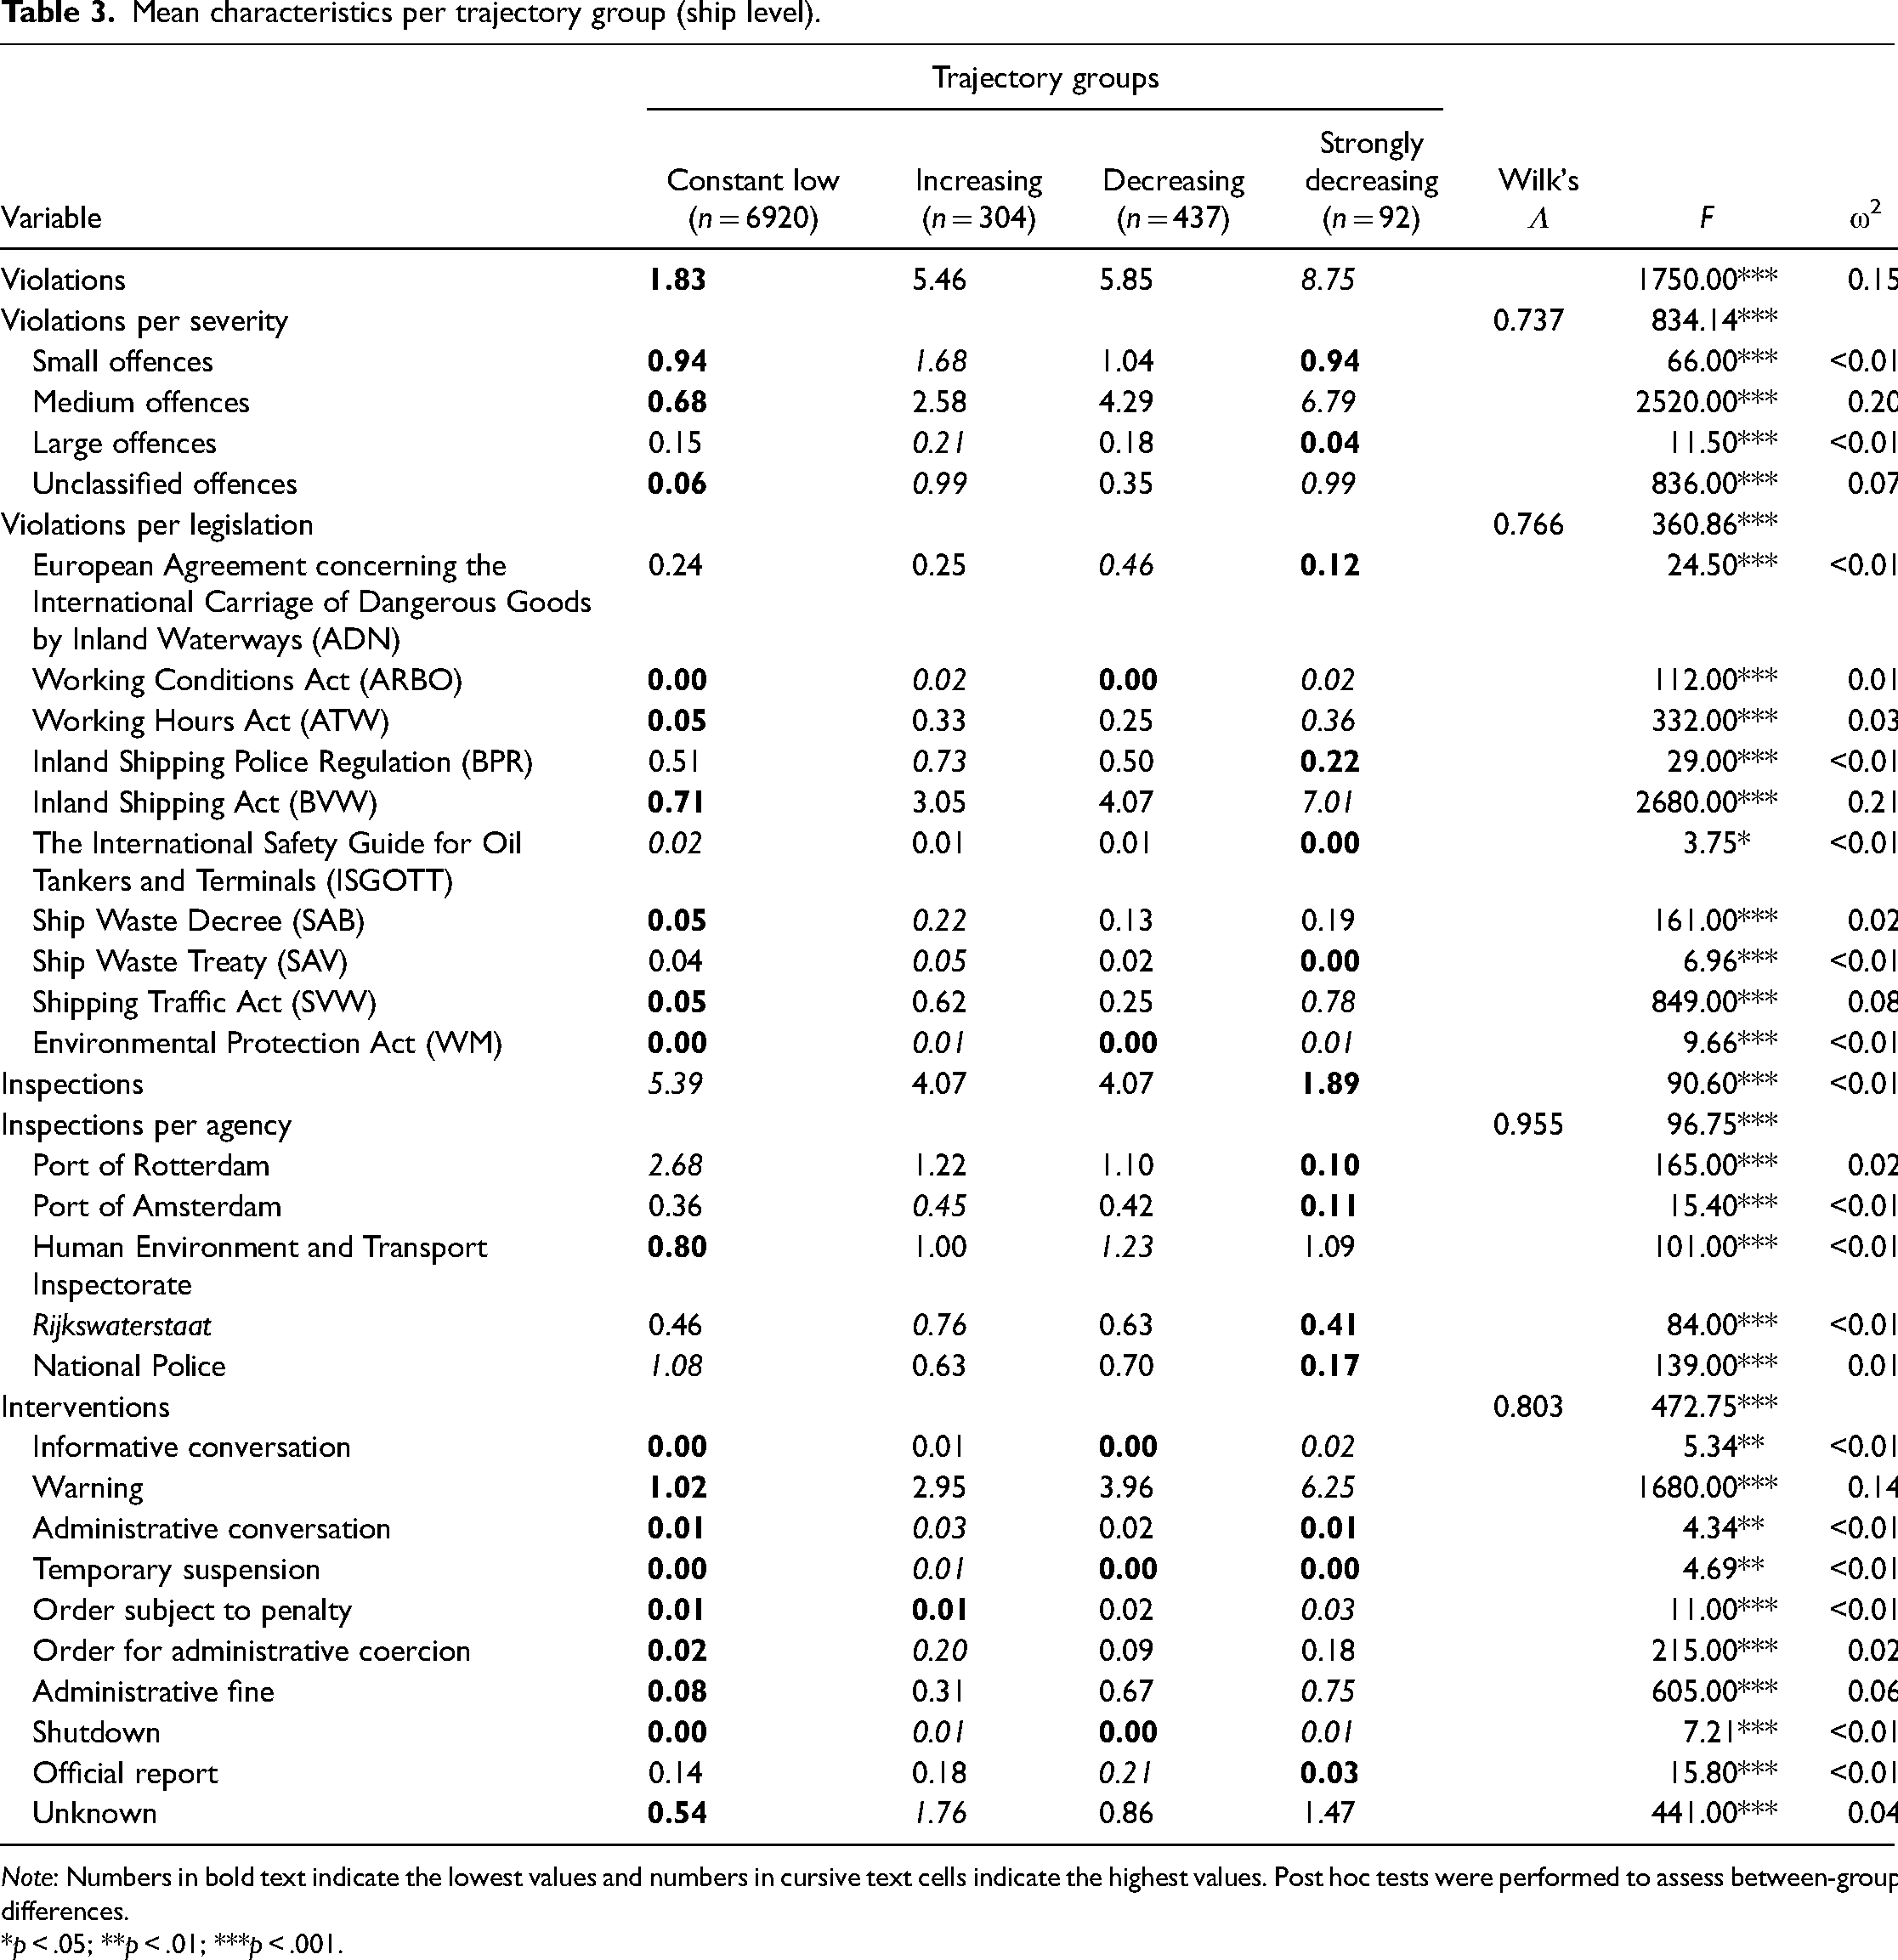
On the ship level, Table 3 compares the industry-level characteristics of the violations, inspections, and interventions for each of the four trajectory groups using (M)ANOVAs (only significant differences are depicted). The MANOVAs show that the groups differ on several variables, including violation severity, violated legislation, inspection agency, and the resulting intervention. The ANOVAs show significant differences between groups in this respect. However, effect sizes (ω2) are small. Characteristics with ω2 > 0.01 or otherwise relevant characteristics are discussed in more detail.
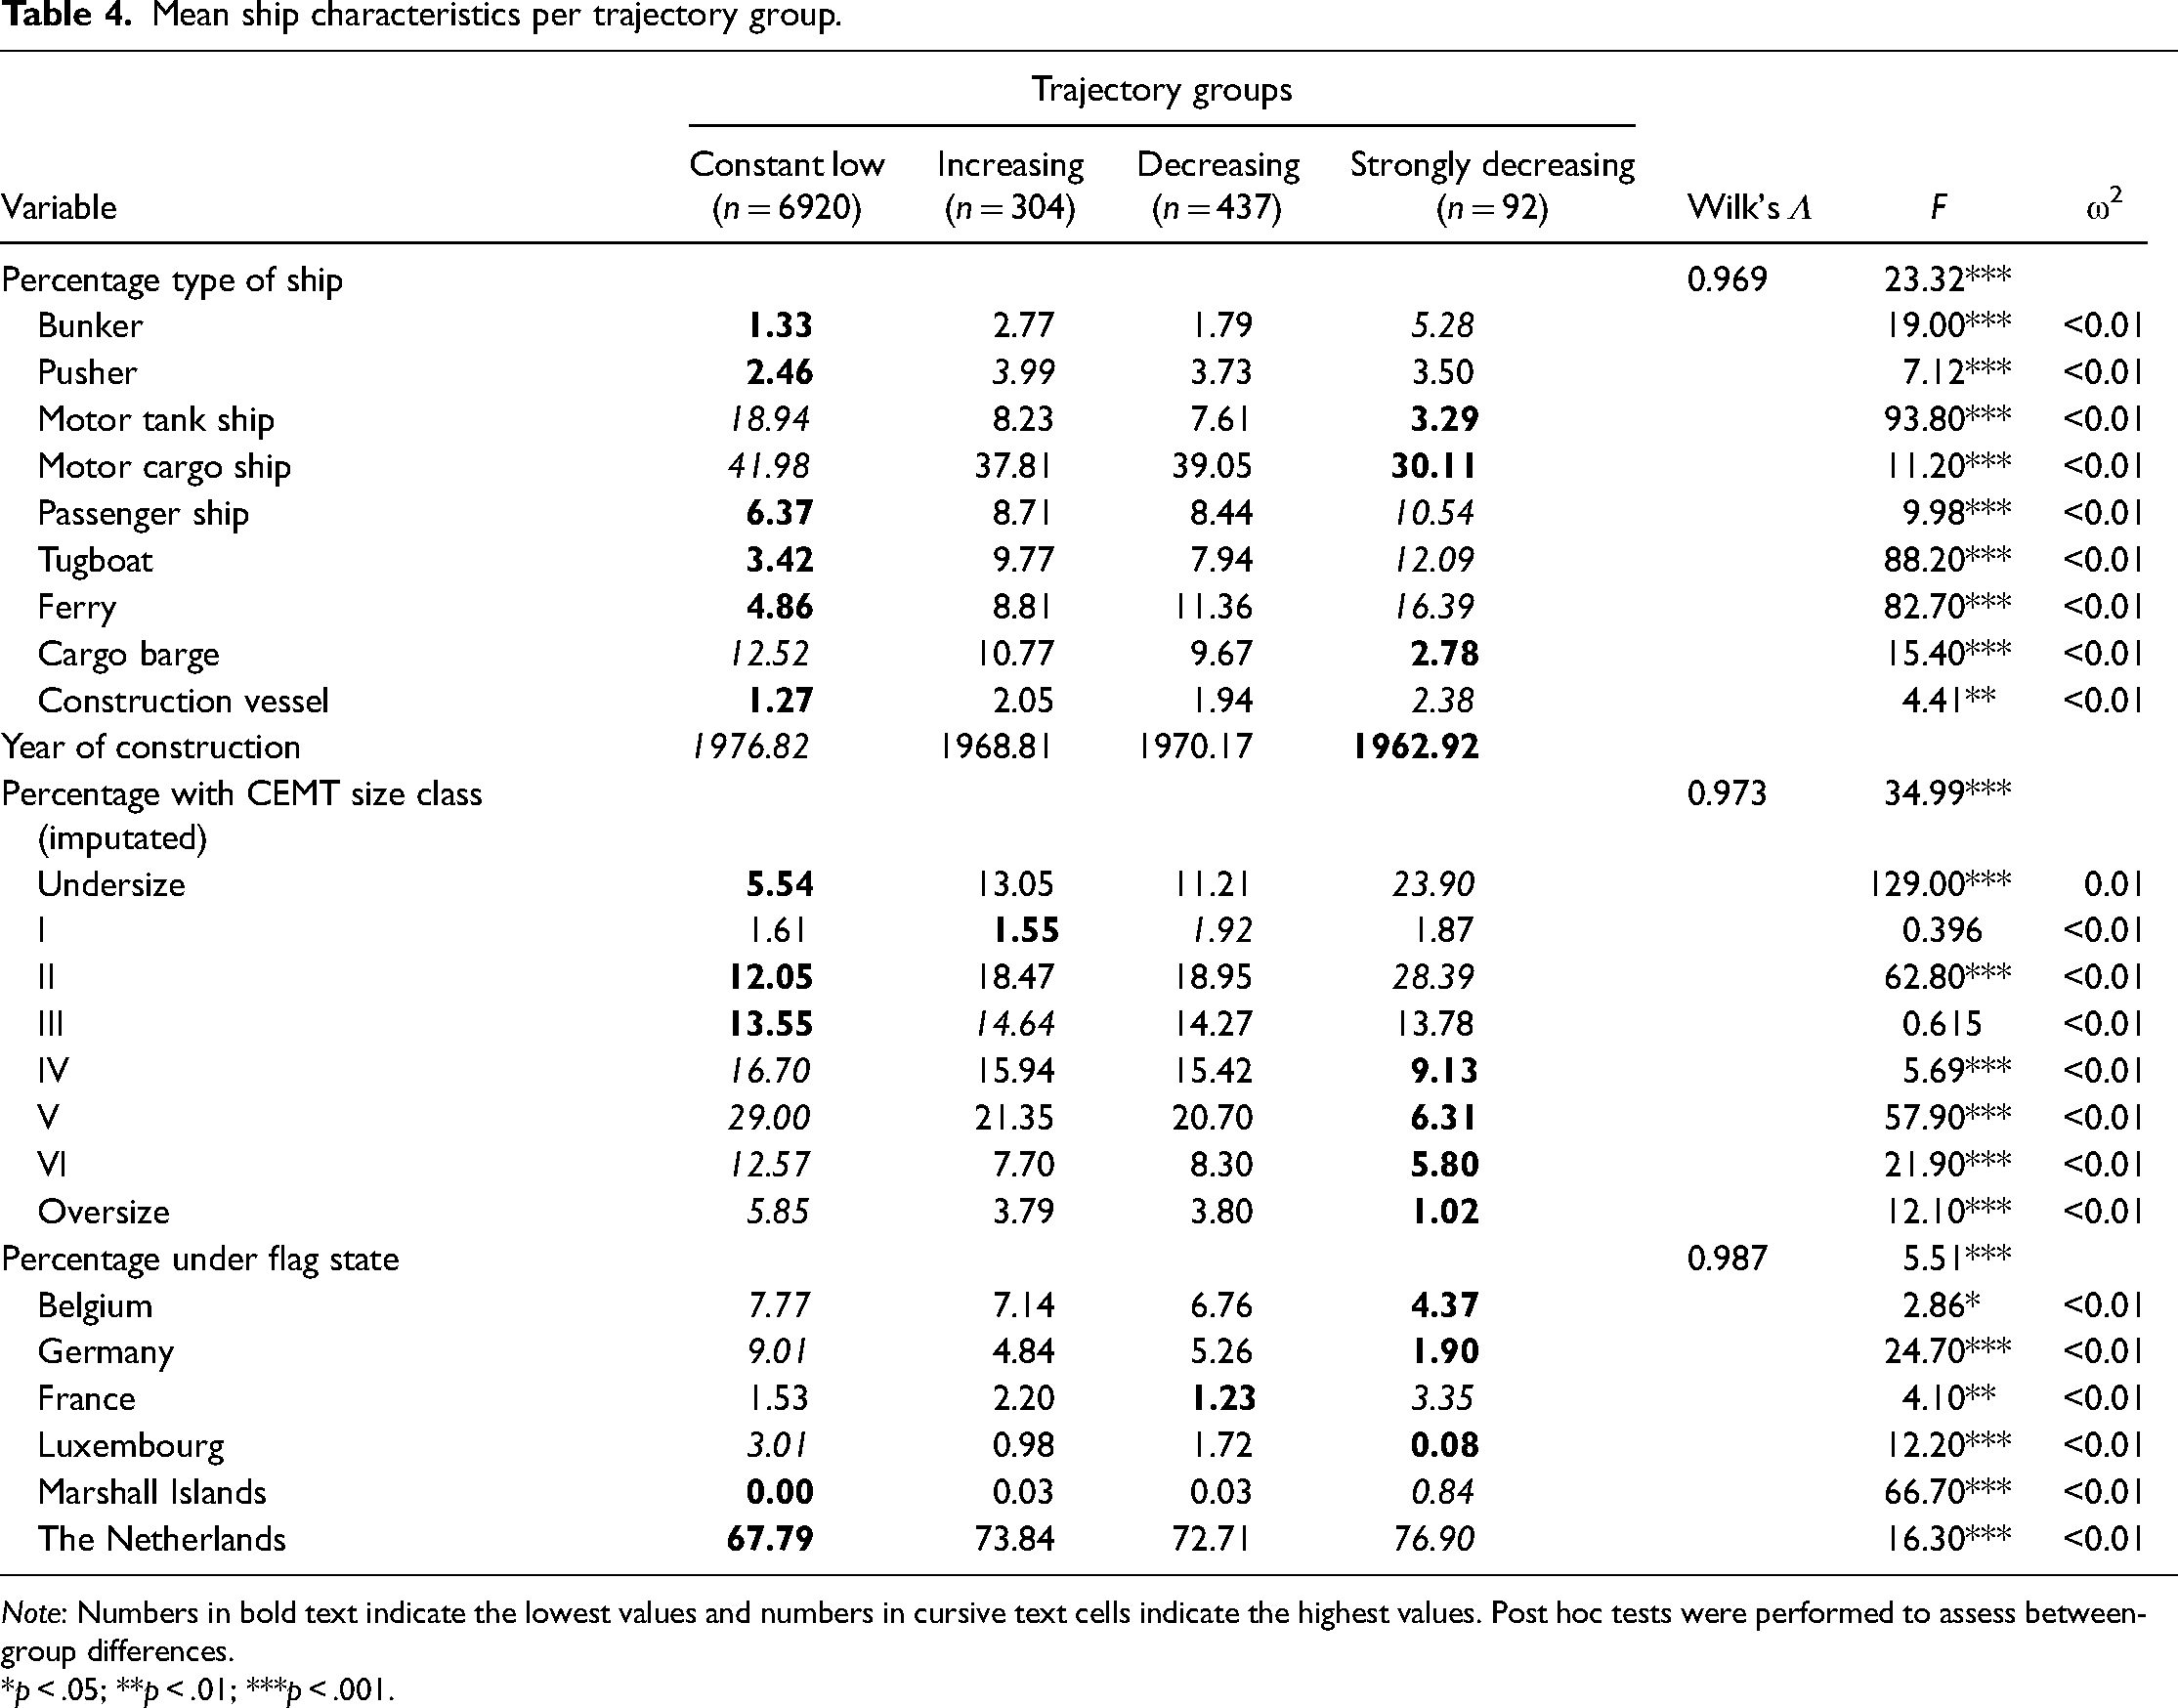
Mean characteristics per trajectory group (ship level).
Note: Numbers in bold text indicate the lowest values and numbers in cursive text cells indicate the highest values. Post hoc tests were performed to assess between-group differences.
*p < .05; **p < .01; ***p < .001.
The lowest and highest values in Table 3 are shaded. Differences are often largest between the Constant low and Strongly decreasing group, with similar intermediate scores for the Increasing and Decreasing group. The Constant low group has the lowest number of violations; the Strongly decreasing group has the highest. The nature of offending also differs per group. The Constant low group has significantly less Working Hours Act and Ship Waste Decree violations than the other groups. All groups had significantly different levels of Inland Shipping Act violations, with the Strongly decreasing group as the foremost offending group. Interestingly, the number of inspections is highest for the Constant low group and lowest for the Strongly decreasing group. This, and the observed differences in the average number of registered offences per legislation, might relate to which agency performed the inspection. For instance, within the Constant low group, significantly more inspections are performed by the Port of Rotterdam and National Police than in the other groups. Finally, in line with the overall low frequency of offending, interventions are least used in the Constant low group.
The groups can additionally be compared on ship-related or industry-specific organisational characteristics. The MANOVAs indicate differences in the type and size of the ship and the flag state, although these individual differences do not seem to have large effect sizes. Table 4 displays the ship characteristics per group. The Strongly decreasing group has more bunkers, passenger ships, tugboats, ferries, and construction vessels than the other groups. The Constant low group has more motor tanks and cargo ships; the Increasing group has more pushers. The ships in the Strongly decreasing group are younger on average than those in the other groups with 1963 as the average year of construction. The ships in the Strongly decreasing group are also smaller (CEMT-size: undersize, II, and III) than those in the other groups. In contrast, ships in the Constant low group are often larger (CEMT-size: IV, V, VI, and oversize). Most ships operate under the Dutch flag. In the Constant low group, a larger number of ships operate under a Belgium, German, or Luxembourgish flag. In the Strongly decreasing group more ships operate under the flag of France or of the Marshall Islands.
Mean ship characteristics per trajectory group.
Note: Numbers in bold text indicate the lowest values and numbers in cursive text cells indicate the highest values. Post hoc tests were performed to assess between-group differences.
*p < .05; **p < .01; ***p < .001.
Business level trajectory groups can also be compared on several variables. Variables with significant differences, ANOVA and MANOVA test results, and effect sizes (ω2) are depicted in Table 5. Characteristics with ω2 > 0.01 or otherwise relevant characteristics are discussed.
Mean characteristics per trajectory group (business level).
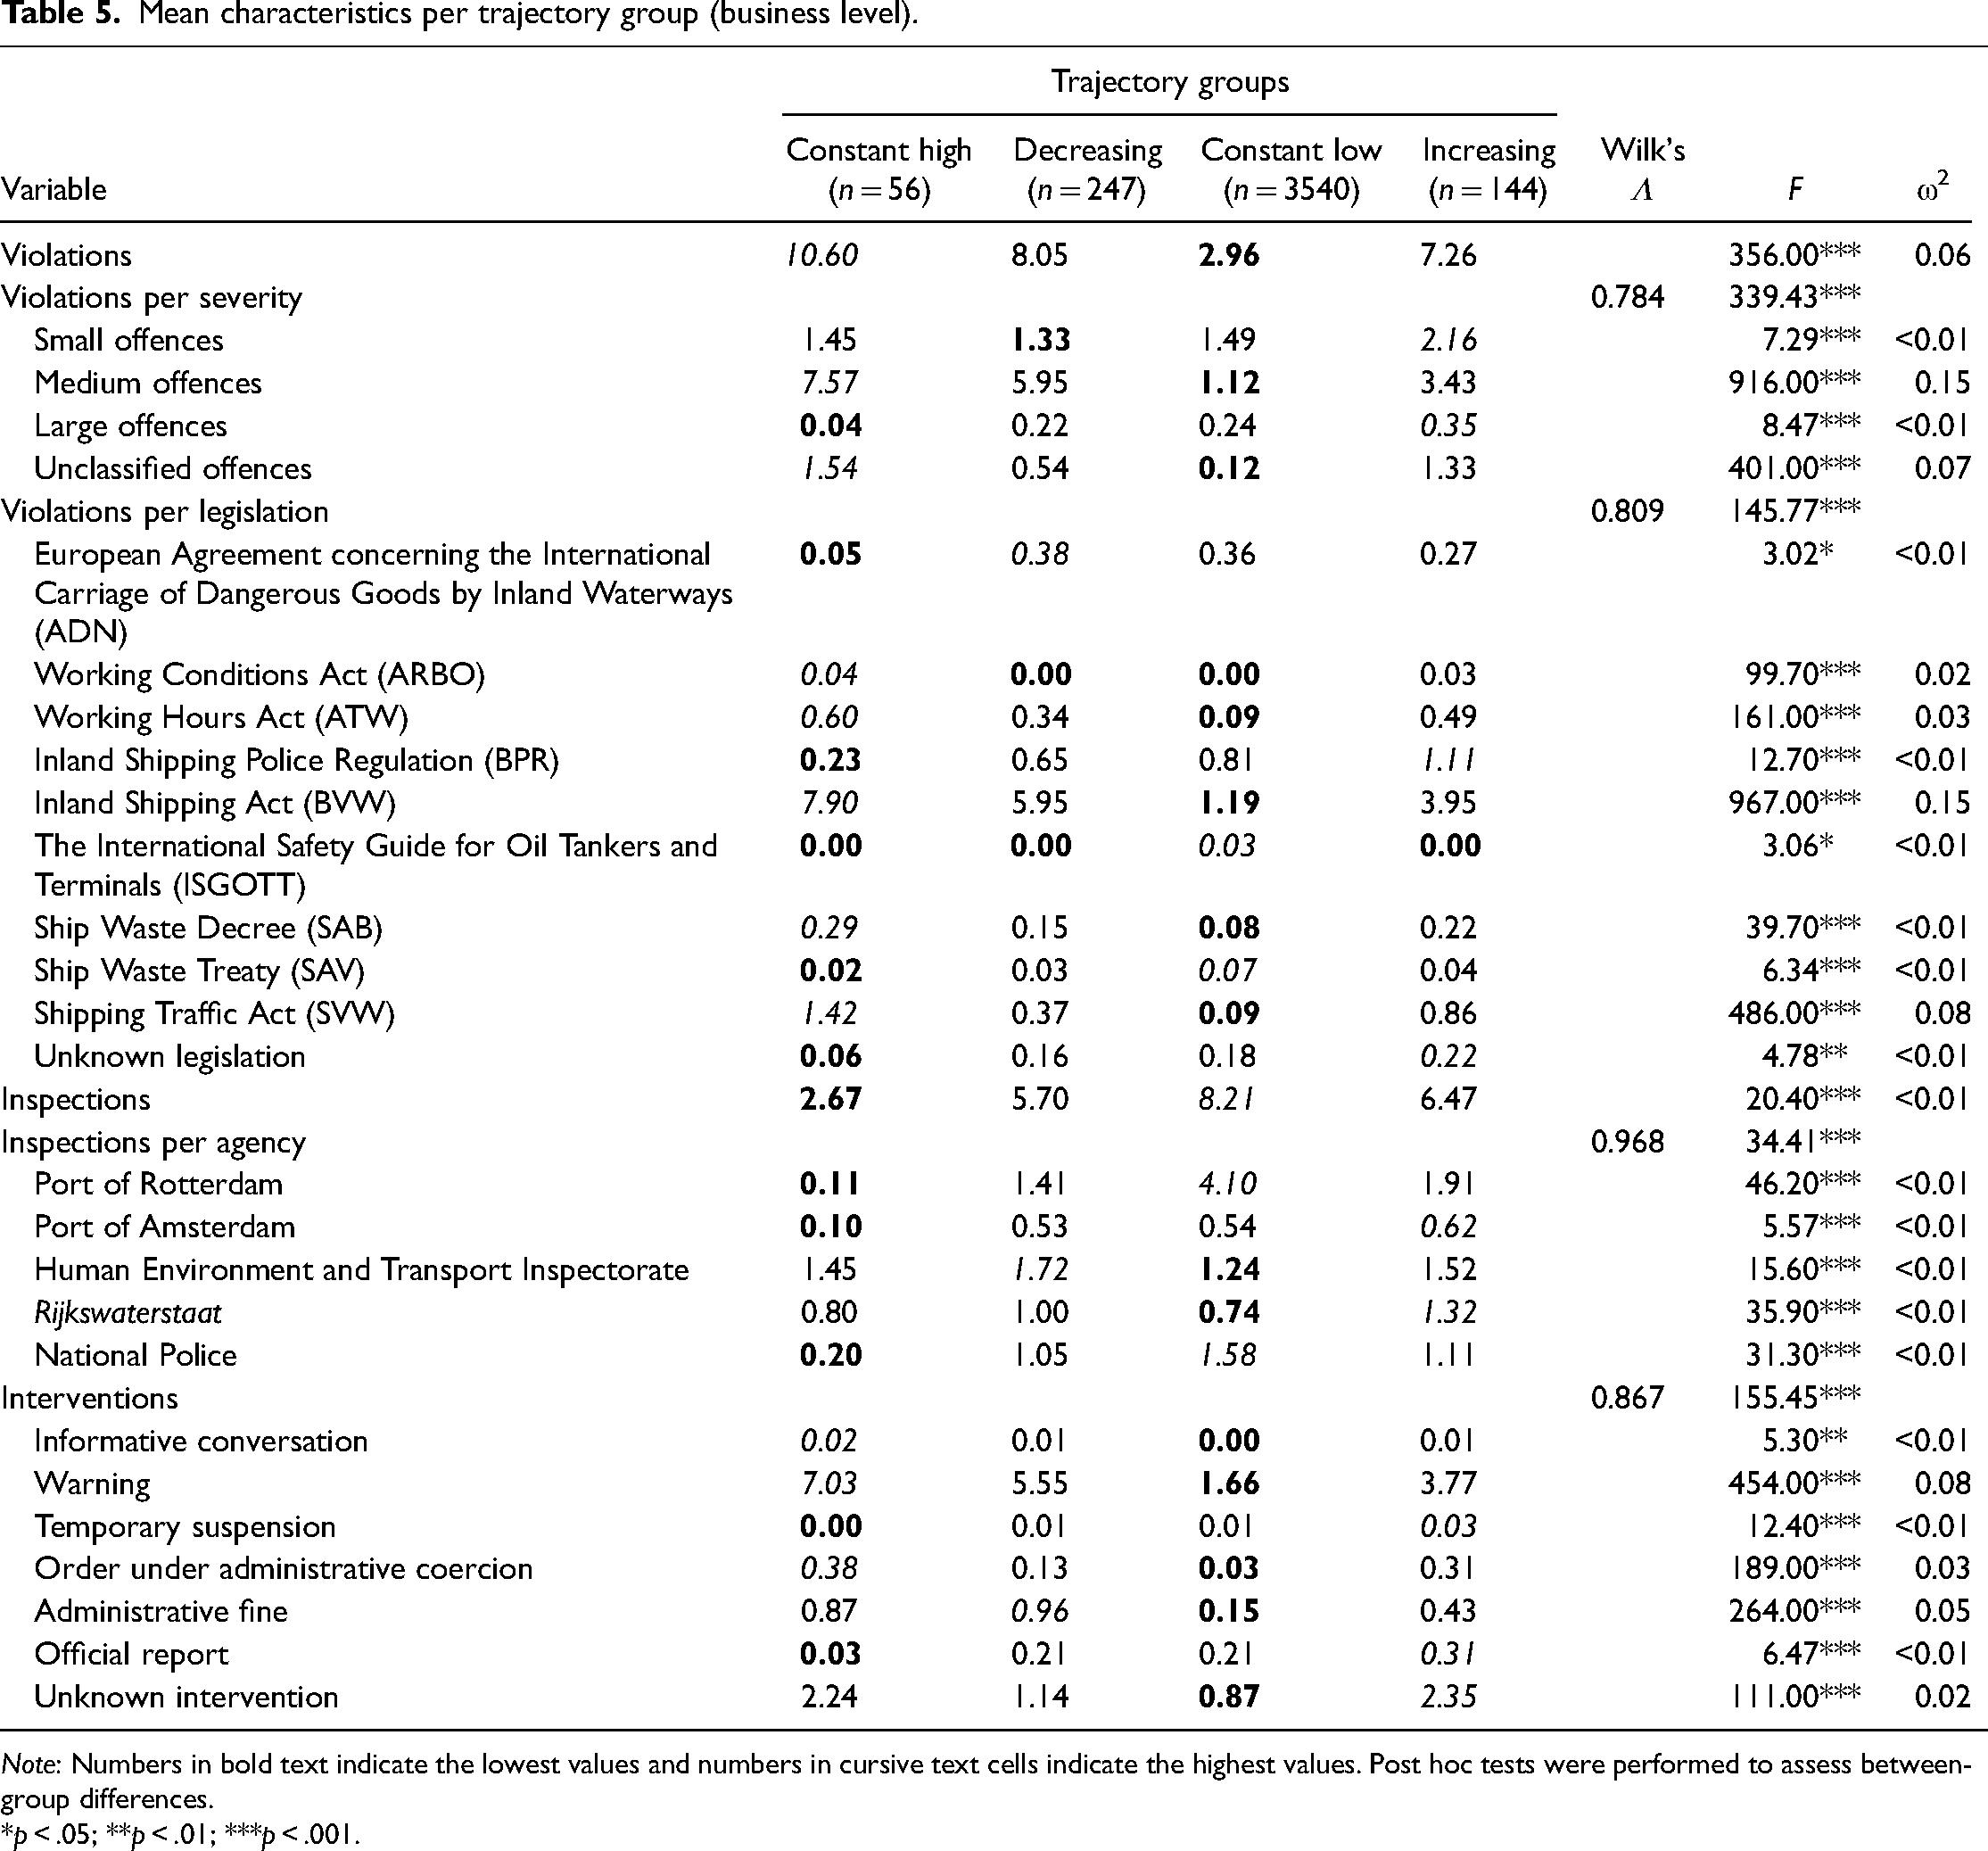
Note: Numbers in bold text indicate the lowest values and numbers in cursive text cells indicate the highest values. Post hoc tests were performed to assess between-group differences.
*p < .05; **p < .01; ***p < .001.
Differences are often largest between the Constant low and Constant high group. These groups have, respectively, the lowest and highest scores on offending. The Increasing and Decreasing groups have intermediate scores. The Constant low group has significantly less Working Hours Act violations than the Constant high, Decreasing, and Increasing group. The Constant low group also has significantly less Inland Shipping Act and Shipping Traffic Act violations. The number of inspections does not differ between the Increasing and Decreasing group and between the Increasing and Constant Low group. However, these groups do differ from the Constant high group. This group was inspected significantly less in comparison to the Decreasing, Increasing, and Constant low group.
Finally, business-level trajectories are compared on organisational characteristics. The results are displayed in Table 6. The MANOVAs show differences in the legal entity and main activity. The ANOVAs show additional differences with small effect sizes. In the Constant low group, there are more general and limited partnerships than in other groups. These legal entities are deemed to be less complex than limited liability companies, which are more prevalent in the Constant high, Decreasing, and Increasing group. In these groups, the main activity is more often inland transport of cargo. Additionally, they have more registered ships than the Constant low group.
Mean business characteristics per trajectory group (business level).
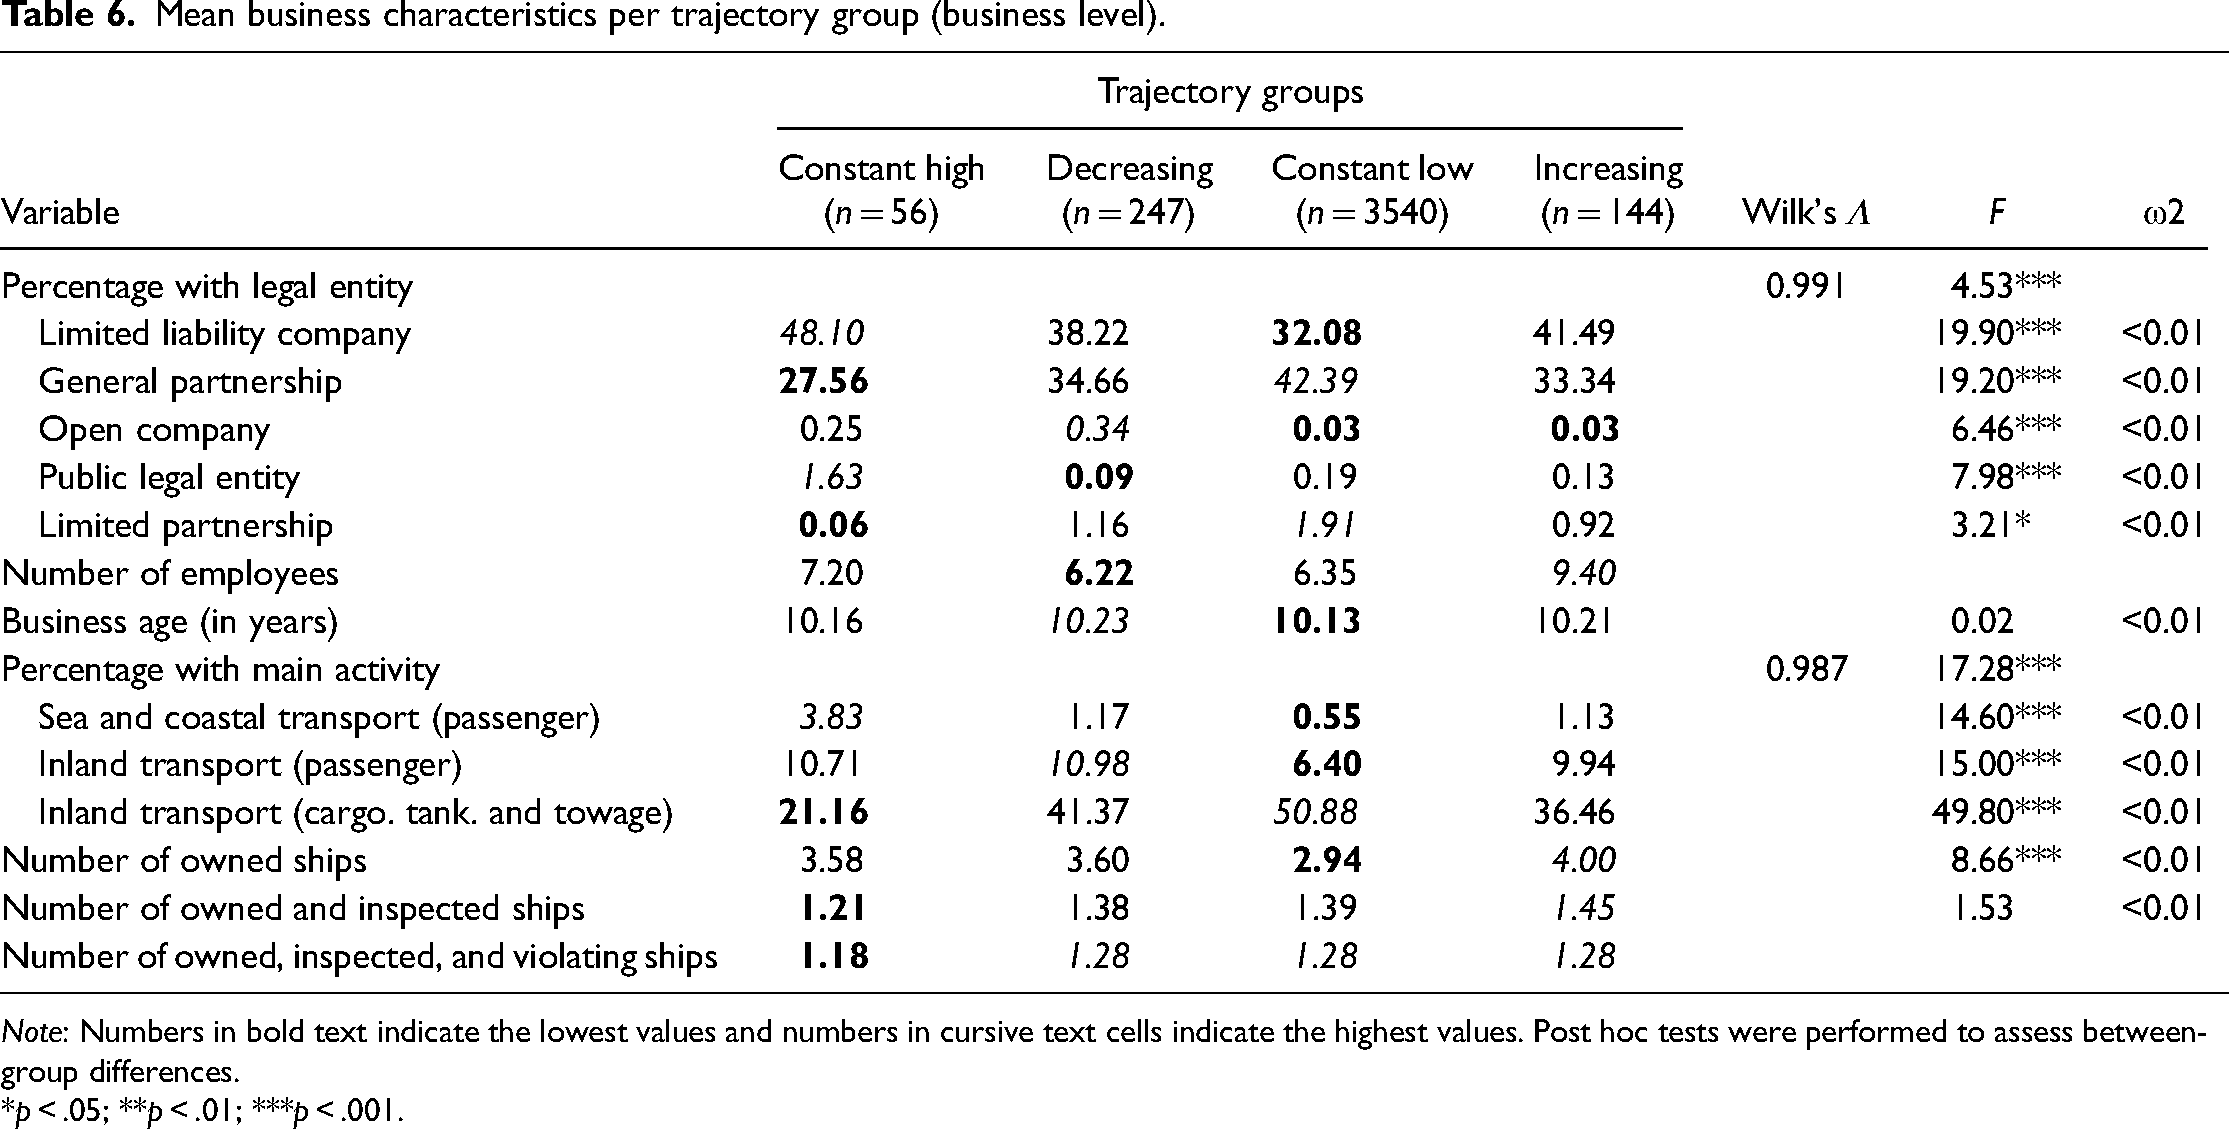
Note: Numbers in bold text indicate the lowest values and numbers in cursive text cells indicate the highest values. Post hoc tests were performed to assess between-group differences.
*p < .05; **p < .01; ***p < .001.
Conclusion and discussion
The current study is among the first to provide an empirical application of a longitudinal, life-course perspective to corporate offending, as previously suggested in theoretical explorations (Blokland et al., 2021; Hunter, 2021; Simpson, 2019; Wu et al., 2024). Using data on over 40,000 inspections of nearly 8000 vessels, owned by over 4000 companies over a 5-year period, the study first finds that, as expected based on previous studies, a small percentage of actors is responsible for a disproportionately large percentage of all registered violations on both the ship and business level of analysis. As the distribution of inspections is less skewed than the distribution of violations, the latter is not merely an artefact of unevenly distributed inspection efforts. To the extent that violations represent materialised risks, risk-based regulation and intervention should consider the disproportionate distribution of offending as it may indicate a similarly disproportionate distribution of future risk (Black & Baldwin, 2012a; 2012b; Van der Heijden; 2019).
Second, using GBTM, four different developmental trajectories could be distinguished on both levels of analysis. On the ship level a Constant low, Increasing, Decreasing, and Strongly decreasing group were distinguished. On the business level a Constant high, Decreasing, Constant low, and Increasing group were distinguished. In contrast to expectations, a trajectory group with a stable, highly frequent offending pattern could only be distinguished on the business level.
Third, the trajectory groups at both levels differ significantly on several variables, including the number of violations, the type of violations, the number of inspections per inspection agency, and the number of applied enforcement activities, although effect sizes were predominantly small. Differences are often largest between the low and high offending groups. Thus, these findings give no clear indication on which available industry and organisational characteristics (generic and industry-specific) are related to the specific offending patterns.
Based on the aforementioned findings and conclusions, five aspects of the study require further consideration. First, most trajectory groups intersect at some point in time, indicating that the offending distribution, and consequently the risk distribution, is subject to change over time, a finding lost in previous cross-sectional descriptions of corporate offending disproportionality. Importantly, the current findings indicate that change in offending is both possible and prevalent. Thus, in regulatory practice, risks need to be re-identified continuously. Identified trajectory groups can function as input for both future research and data-driven inspection and risk-prediction models that are currently being developed (Koid, 2022; Toezine, 2017). At present however, in most industries a lack of high-quality longitudinal data hampers the temporal analysis of corporate offending and the potential application of risk prediction based on longitudinal offending patterns (Van der Voort et al., 2020).
Second, though violating businesses do not solely consist of violating ships, the tendency for frequently violating ships to cluster within businesses gives rise to a persistent trajectory group on the business level that seems less susceptible to change. A similar group could not be identified on the ship level. These findings underscore the importance of the level of analysis in corporate crime research (Simpson, 2011).
Third, the differently shaped trajectories identified suggest that corporate offending is susceptible to external influences. Whether the development of corporate offending is best explained by events and transitions taking place in the corporate life course, a specific corporate life phase, or by industry or macro-level factors remains a question for future rese,arch. The largest differences in characteristics are observed between the compliant group and the offending groups. This is in line with conclusions drawn by Bartlett et al. (2020), who found that rule violating companies are relatively homogeneous. Illustrating the levels-of-analysis problem, on the ship level vessels in the offending groups were smaller in size. Businesses in the more frequently offending groups on the other hand, were more likely to be larger, more complex corporations instead of sole proprietors (Dalton & Kesner, 1988; Van Dooren et al., 2019; McKendall & Wagner, 1997). While contrasting prior findings (Gibbs & Simpson, 2009; Kluin et al., 2018), this is in line with expectations based on Huisman (2016) and Pusch and Holtfreter (2021), stating the importance of organisational structure for corporate crime. More substantive data from which the complexity of a business can be derived, such as relationships between parent and subsidiary companies, may be added in future research to further explore these patterns.
Fourth, effect sizes of differences between trajectory groups at both the ship and business level were found to be predominantly small. Future research should actively seek out additional data on key characteristics theorised to be associated with corporate offending and compliance and assess their effect on compliance levels. These can be industry-level (e.g. industry competitiveness, industry structure), corporate-level (e.g. corporate strategy, structure), or individual-level characteristics (business executive and/or ship captain characteristics). As the impact of events, transitions, and macro-level changes may be conditional to a particular corporate life phase, future research may also want to test the applicability of organisational life-cycle theories by adding variables informative of the corporate life-cycle (Levie & Lichtenstein, 2010; Simpson, 2019; Wu et al., 2024).
Fifth, differences between the findings of the current and prior studies may be – in part – explained by the nature of the inland shipping industry. Inland shipping has a high level of volatility; the sample of inspection subjects is constantly changing due to the international and mobile nature of the transport industry. In other industries, corporate locations are a fixed factor. Additionally, inland shipping is characterised by a large range of competing legal entities, from sole proprietorship to limited liability companies. Differences with other industries might also stem from limited options regarding the planning of inland shipping inspections by the ILT due to the constantly changing availability of ships.
In addition, the application of life-course theories and methodologies to corporate offending raises some important empirical and conceptual issues that still need to be resolved. First, the ‘age-range’ of corporations is typically much wider than that of humans as corporate existence can persist across multiple human generations. For future studies on the development of corporate offending, longer follow-up periods than the 5 years under scrutiny here are therefore recommended. Second, corporate development may not always be linear but could be cyclic in nature. Whereas subsequent life phases in humans coincide with their increasing age, the relation between the organisational life-cycle and age is far less obvious. This emphasises the importance of operationalising the corporate life phase beyond its age in calendar time (Blokland et al., 2021; Hunter, 2021). Such operationalisations, in turn, could draw on extant organisational life-cycle theories (Levie & Lichtenstein, 2010; Simpson, 2019; Wu et al., 2024). Thirdly, business sites, installations, and vehicles all have their own age, which can deviate largely from the corporate age. For instance, in the current study businesses are 10 years old on average while ships are 50 years old on average. The likelihood of rule violations may be affected by the ageing of assets, in addition to the ageing of the company itself (Hansler et al., 2022). Finally, as trajectory groups are an after-the-fact, statistical data summary of behavioural development and characteristics (Nagin & Piquero, 2010), the added value of a life-course analogy of corporate offending for corporate crime, regulation and governance studies and for practice will eventually lie in the extent to which research is able to both determine whether these trajectory-groups are indicative for the risks of future offending and to theoretically explain these trajectories with the associated group-specific characteristics (Nagin & Odgers, 2010).
Notwithstanding these theoretical challenges, the present results also have implications for practice. Identifying trajectory groups allows inspections and interventions to be tailored to particular offending patterns and targeted at associated characteristics as potential drivers. Such a data-driven approach will help regulatory agencies to act ‘really’ responsive, enabling the complementary deployment of regulatory (sub-)strategies across and within corporations over time (Black & Baldwin, 2010), and to achieve its ambition of risk-based regulation (Bestuurlijk Omgevingsberaad, 2014).
In summary, the current study identified disproportionality in offending in the inland shipping industry; a minority of the population is responsible for a disproportionate share of violations. It finds different offending pathways, distinguished at both the ship and business level. Only on the business level, a group of persistent offenders can be identified. The trajectories identified tend to intersect, which shows that ships and businesses can and do change their violating behaviour over time. In turn, this means that estimates of those companies who present ‘high risk’ must continuously be updated.
Footnotes
Declaration of Conflicting Interests
The author(s) declared the following potential conflicts of interest with respect to the research, authorship, and/or publication of this article: During the time of this study, two of the co-authors of this article (Dr. Margje C. M. Schuur and Dr. Stephanie I. Wassenburg) were employed by the Human Environment and Transport Inspectorate.
Funding
The author(s) disclosed receipt of the following financial support for the research, authorship, and/or publication of this article: This research project is being funded by the Dutch Research Council (NWO) (grant number 406.18.R8.039).