
Abstract
In this study, we examine Russian millennials’ attitudes toward migrants—an estimated 10 million legal and four million illegal migrants, who work in construction, service, and retail industries. More specifically, we examine the influence of various factors such as perceived fear of migrant crime, economic, and cultural competition on explaining xenophobia measured by social distance and ethnic exclusionism. Drawing from a survey of 944 university students in St Petersburg, Vladivostok, and Rostov-on-Don, Russia, our findings suggest that fear of migrant crime along with perceived cultural threats are strong predictors of xenophobic attitudes toward migrants. However, the economic threat did not appear to be a strong predictor of xenophobia. Variations existed between cities on dimensions of a perceived threat from migrants, suggesting that geographic and city characteristics are important factors.
Introduction
In recent decades, topics on prejudice, racial and ethnic bias, and anti-immigrant attitudes have received considerable scholarly attention, particularly in immigrant nations with histories of colonization (Melossi, 2008). Much of the earlier work on the fear surrounding foreigners and anti-immigrant sentiments was built upon the body of work on group conflict theories and perceived threats (Blumer, 1958; Schneider, 2008). Four important areas were identified as factors that shape anti-immigrant sentiments. These attitudes emanate from perceived threats to physical (crime), economic (jobs), and cultural (dilution of values and traditions) security, as well as physical well-being (spread of disease). Findings suggest mixed support for fear of immigrant crime and the group threat hypothesis shaping anti-immigrant sentiments, though it is less substantiated in some countries (e.g. Brouwer et al., 2017; Quillian, 1995; Semyonov et al., 2006) in explaining xenophobic and anti-immigrant attitudes as well as policies.
Most prior research has been centered on the European Union, the UK, and their former colonies in the Americas and Australasia (Melossi, 2015). Russia has received scant attention in these discourses despite having the largest number of migrants, second only to the United States (Bessudnov, 2016; United Nations, 2016). The presence and visibility of migrant labor from the Commonwealth of Independent States (CIS) have become routine in everyday Russian life in almost all cities (Libman and Obydenkova, 2020). According to the Organization for Economic Co-operation and Development, 7 percent of Russia's population constitutes illegal migrants while legal migrants comprise 2.5 percent of the population (Migrants-Refugees, N.D.).
Reports of hostility, intolerance, extremism, and violence in the later 1990s (following the demise of the Soviet Union) targeting migrant minorities in Russia increased (Alexseev, 2010; Bessudnov and Shcherbak, 2020). Opposition to migrants was primarily grounded in exclusionary attitudes based on national membership, race, and ethnicity (Bessudnov and Shcherbak, 2020; Levada-Center, 2016). For example, over four million non-ethnic Russians from Central Asia continue to be depicted as diseased and criminal by the state apparatus, which easily transforms into cultural stereotypes (Cheliotis, 2017; Round and Kuznetsova-Morenko, 2017).
Given this background, we seek to contribute to the current literature by examining the antecedents of prejudice and ethnic intolerance among millennials in Russia. Our first objective is to expand the currently limited empirical work that has explored factors contributing to prejudice and xenophobia toward non-natives in Russia. The second objective is to test the theory that relates fears of a ‘deviant migrant’ to xenophobic attitudes, while at the same time controlling for the factors related to economic and cultural threats. Finally, given the vast size of Russia, our work offers an opportunity to examine regional differences. Thus, our research focuses on survey data drawn from three large cities in Russia that have unique and distinct characteristics.
Background
Xenophobia: Social distance and ethnic exclusionism
Xenophobia is ‘a form of attitudinal, affective, and behavioral prejudice toward immigrants and those perceived as foreign’ (Yakushko, 2009: 43), an irrational fear that makes people ‘dislike all foreigners and their otherness’ (Soldatova, 2007: 105). However irrational it may be, fear prompts individuals to adopt defensive behaviors to handle danger or threat (Mineka and Ohman, 2002) and direct hostility toward other group members (Duckitt, 2001). Other terms such as prejudice, bias, fear of the other, social distance, and ethnic exclusionism also express xenophobia and anti-immigrant attitudes. This study focuses on two similar but distinct variables of xenophobia—social distance and ethnic exclusionism.
Social distance refers to closeness or rejection of another social group. Robert Park (1924) noted that social distance refers to ‘the grades and degrees of understanding and intimacy which characterize personal and social relations generally’ (p. 339). Emory Bogardus (1933) defined social distance as the ‘sympatric understanding that exists between two persons or between a person and a group’ (p. 268) and developed the social distance scale, which is one of the most widely used measures of prejudice (Duckitt, 2003; Triandis and Triandis, 1960). Social distance measures prejudice by estimating people's closeness or distance toward diverse social groups in a range of hypothetical personal interactions with foreigners in various roles such as legal spouse or partner, a close friend, as neighbors on the same street/building/floor, or co-workers in the same occupation (Bogardus, 1925). The construct is still a commonly used method of measuring prejudice against ethnic or religious groups and groups that are stigmatized (Parrillo and Donoghue, 2013; Wark and Galliher, 2007).
While social distance measures of xenophobia reflect psychological attitudes toward migrants, the construct of ethnic exclusionism refers to citizens’ opposition to the idea of legal inclusion of migrants (Scheepers et al., 2002). It reflects views relating to granting civil rights to migrants who legally reside in the country and implies social non-integration and inter-ethnic tension. The ethnic exclusionism scale was tested in the Eurobarometer survey and was found to be valid and applicable in 15 different countries (Scheepers et al., 2002; Canetti-Nisim et al., 2006, 2009).
Fear of migrant crime and xenophobia
Migrants bring different cultures and practices that put them at odds with the dominant culture, raising concerns about safety and crime (Blumer, 1958; Sellin, 1938). These concerns can be realistic (i.e. threats to physical or material well-being) and symbolic (i.e. threats to morals and values) (Stephan and Stephan, 2000). Fear of migrants (FMC) is often measured as a proxy for citizens’ fear of immigrant crime (Jacobs et al., 2017; Killias, 2011).
Migrants are often blamed for increasing crime (Melossi, 2008) though these claims are unsubstantiated (Hooghe and de Vroome, 2015). Research has shown that rates of crimes committed by migrants are similar to the natives (Bianchi et al., 2012; Ousey and Kubrin, 2018) that migrants are less likely to commit a crime (Jung, 2020) and more likely to be victims of crime (Knight and Tribin, 2020). However, the general public tends to equate rising immigration with growing crime (Stupi et al., 2016), resulting in mounting punitive attitudes toward migrants (Melossi, 2015; Stupi et al., 2016). Perceived criminality of legal migrants and undocumented foreigners is a strong predictor of xenophobia (Stupi et al., 2016).
Sometimes, FMC is driven by media portrayals of ‘criminal immigrants’ (Lawlor, 2015). However, while some studies found a positive relationship between media depictions and fear of migrant crime and anti-immigrant sentiments (Jacobs et al., 2017), others have not found any support for this relationship (Brouwer et al., 2017). Media reports of increased crimes committed by undocumented immigrants occurred in Russia in 2008, and the reports vastly overestimated the figures (Kingsbury, 2017), further legitimizing FMC. The 2012 crime data shows that immigrants were responsible for only 3.5 percent of the total reported crimes, of which nearly a fifth were reported from Moscow and a similar fraction from the outlying areas of Moscow (Golunov, 2014), suggesting a gap in perceptions between the perceived and actual crime by the foreign-born. Interestingly, most crimes by foreigners are non-violent (e.g. use of false documents), while crimes against immigrants are often serious (Chudinovskikh, 2018).
Research on FMC in Russia from the early 2000s shows an increasing hostility toward migrants and growing anti-migrant vigilantism (Alexseev, 2010; Leviyeva, 2005). Drawing data from 2005 to 2007 national surveys, Alexseev’s (2010) work on citizens’ views about deporting migrants and the integration of foreigners shows that ethnic Russians, compared to ethnic non-Russians, were more hostile and less tolerant toward migrants.
Drawing from this research, we hypothesize:
Hypothesis 1: Residents who believe migrants cause more crime are more likely to (1) maintain social distance with migrants and (2) have exclusionary attitudes toward migrants.
Economic competition and xenophobia
Since migrants and minorities consume public goods, services, and resources (e.g. education, accommodation, and healthcare), native and indigenous 1 populations are more likely to perceive that they have to compete with migrants for these resources. Chief among these perceptions is the fear of scarcity and unequal distribution of economic resources (Esses et al., 1998), which can explain perceived threats and subsequent prejudice (Quillian, 1995), views held among the lower-wage employees (Hjerm and Nagayoshi, 2011; Ruhs, 2015) and better-educated natives alike (Dustman and Preston, 2007).
Exclusionary attitudes toward immigrants in Russia appear to be grounded in the context of national membership versus all foreigners (irrespective of race or ethnicity) or purely based on race and ethnicity (Gorodzeisky and Semyonov, 2009). The Russians’ fear of vulnerability to out-group immigrants is driven by competition for scarce resources, and this fear is particularly strong toward non-Slavic groups from Central Asia, Uzbekistan, Tajikistan, Azerbaijan, and Armenia (Gorodzeisky and Glikman, 2018; Gorodzeisky and Semyonov, 2009; Gorodzeisky et al., 2015; Raijman and Semyonov, 2004), a finding similar to those found in studies in many countries around the world.
Drawing from this research, we hypothesize:
Hypothesis 2: Residents who believe migrants pose an economic threat are more likely to (1) maintain social distance with migrants and (2) have exclusionary attitudes toward migrants.
Cultural competition and xenophobia
Various perspectives suggest that group differences regarding morals, values, and norms are related to developing prejudice (Ruhs, 2015; Stephan et al., 1999). Dominant groups perceive migrants as threats to cultural norms and traditional values. The dominant group's hostile attitudes are a response to a perceived fear of losing national identity (Quillian, 1995), and cultural purity (Raijman and Semyonov, 2004). Dominant groups exaggerate perceived cultural differences related to out-groups (Pettigrew and Meertens, 1995), labeling these differences as ‘bad, disruptive, threatening, immoral, deviant, and disliked’ (Duckitt, 2001: 85).
Similar findings have been found in studies conducted in post-Soviet Russia regarding immigrant flows from areas represented by non-Russian ethnic former Soviet states (e.g. Central Asia, Uzbekistan, and Tajikistan) (Gorodzeisky, 2019; Gorodzeisky and Glikman, 2018; Gorodzeisky et al., 2015).
Drawing from this research, we hypothesize:
Hypothesis 3: Residents who believe migrants pose a cultural threat are more likely to (1) maintain social distance with migrants and (2) have exclusionary attitudes toward migrants.
Other predictors of xenophobia
Fear of immigrant-spread disease (medical xenophobia) has always played a central role in national political debates of countries that opened their doors to immigrants (Armus, 2019). The fear of migrants spreading disease and anti-immigrant sentiments are always linked (Faulkner et al., 2004), not just in developed countries but in emerging democracies as well. Prior research has also found that gender and income are predictors of anti-immigrant sentiments and xenophobia. Research suggests males have a higher propensity for exhibiting authoritarian personalities, reflecting their anti-immigrant sentiments in general (Quillian, 1995; Wagner and Meyer, 2017), and scoring higher on social distance measures (Semyonov et al. 2006). However, others have not found any gender differences in attitudes toward ethnic exclusion (Scheepers et al., 2002) or anti-immigrant attitudes (Sides and Citrin, 2007). Research also shows that vulnerable populations, such as the unemployed and manual laborers, are more likely to exhibit exclusionary attitudes than other, more secure groups (Schylter and Wagner, 2008) while others have found a negative relationship (Jetten et al., 2015), or no relationship (Hooghe and de Vroome, 2015). Research specific to Russia on income and xenophobia supports the economic vulnerability hypothesis (Bessudnov, 2016).
Drawing from this research, we hypothesize:
Hypothesis 4: Residents who perceive migrants as spreading diseases are more likely to (1) maintain social distance with migrants and (2) have exclusionary attitudes toward migrants. Hypothesis 5: Males are more likely to be more likely to (1) maintain social distance with migrants and (2) have exclusionary attitudes toward migrants. Hypothesis 6: Higher-income groups are more likely to (1) maintain social distance with migrants and (2) have exclusionary attitudes toward migrants.
Present study
Method, data, and analysis
Survey data was gathered for this study using measures based on prior research exploring citizen perceptions of migrants and xenophobia. The survey was written in Russian and pilot-tested with a sample of 37 students. The final survey was refined based on the student sample's comments and feedback. Survey questions sought responses from the students on a variety of demographic and attitudinal questions pertaining to measures of social distance, ethnic exclusionism, fear of migrant crime, and perceived economic and cultural threats. The attitudinal questions were designed to measure opinions on a 7-point Likert scale (1 = strongly disagree, 7 = strongly agree).
The participants for the present study came from a convenience sample of university students attending two leading universities in St Petersburg, one in Rostov-on-Don, and another in Vladivostok. Although these universities offered diverse academic disciplines, the survey was distributed in the social sciences and liberal arts departments because of the established connections with faculty members in these units. The survey was disseminated to students in the fall semester of 2017.
One of the co-authors was responsible for survey administration in St Petersburg, and two instructors volunteered as survey administrators for the other two locations. The surveys were administered during class periods after obtaining the instructor's permission and informing the students of the voluntary nature of study participation. Surveys were also administered in the common areas (cafeterias and student lounges) during class breaks. In all, 400 surveys were distributed in St Petersburg, 400 in Rostov-on-Don, and 600 in Vladivostok. A total number of 944 participants returned the surveys, representing a response rate of 67 percent. Of these, St Petersburg yielded 255 (27%), Rostov-on-Don 253 (26.8%), and Vladivostok 436 (32%).
Measures
Dependent variables: Social distance and ethnic exclusion
In this study, we measure our dependent variable, xenophobia, with two dimensions—social distance and ethnic exclusion. This approach is similar to measurements used in prior research in Russia that examined the influence of nationalist ideas on exclusionist reactions to two dependent variables: social distance and negative stereotyping (Hagendoorn and Poppe, 2017). Questions measuring social distance are framed in a personal way by describing hypothetical interactions with foreigners, while ethnic exclusionism measures focus on generic national policy matters and less on respondents’ immediate interactions with migrants.
For the social distance scale, we drew on Bogardus's (1925, 1933) scale, which is one of the most widely used instruments to measure prejudice (Duckitt, 2003; Parrillo and Donoghue, 2005; Triandis and Triandis, 1960; Wark and Galliher, 2007). It estimates people's closeness to or distance from diverse social groups in a range of personal interactions, such as with a legal spouse or partner, a close friend, neighbors on the same street/building/floor, co-workers in the same occupation, etc. This first dimension of our dependent variable consists of five questions: (1) I could date or marry an immigrant; (2) I don't have much in common with migrants to be friends (reverse coded); (3) I do not want to live on the same floor with immigrants (reverse coded); (4) an immigrant is acceptable as a colleague/classmate; and (5) I prefer to be served by a Russian waitress and not a migrant waitress (reverse coded), a question that was tailored to the Russian context. In our view, the wording of these five questions allows for measuring the social distance to or from immigrants through milder expressions of xenophobia that revolve around the everyday acceptance of immigrants.
Though prior research on social distance in Russia was measured using four items (Hagendoorn and Poppe, 2017), we have modified it in a couple of ways. First, we added a question to capture social distance to assess their perceptions regarding interactions with servers (waiters and waitresses) in restaurants, and second, we have weighted the items following Guttman's scaling technique and improved upon by Mather et al. (2017). Following Mather et al. (2017), we weighted dating/marriage (*1), a friend (*2), living on the same floor (*3), acceptable as a colleague/classmate (*4), and served by Russian waiter (*5). Recall that some of the questions were reverse coded to keep the scale in the same direction.
The scores for the variable ranged from 5 to 105. Higher values mean a higher level of acceptance of migrants and less xenophobia. Principal component analysis (PCA) was conducted to see if they loaded on one scale. The factor loadings were above .68 for the items except for acceptance as a colleague/classmate, which loaded at .47, and dating/marriage, which loaded at .55. While the loading of .47 is low, some suggest that it is the lowest acceptable threshold (Matsunaga, 2010). The Cronbach's alpha for the scale was .62.
For the second dimension of xenophobia, we used the ethnic exclusionism scale (Canetti-Nisim et al., 2009; Scheepers, et al., 2002) and modified the questions slightly to adjust them to the Russian context. Ethnic exclusionism consisted of four questions: (1) migrants should not have the same social rights as citizens; (2) migrants should not be allowed to bring their relatives to Russia; (3) unemployed migrants should be sent back; and (4) migrants should not be granted citizenship even if they stayed in Russia legally.
All the questions were reverse coded to maintain uniformity in the direction of both dimensions of our dependent variable. Higher scores represent more favorable attitudes toward immigrants, less favorably inclined toward ethnic exclusion, and less xenophobic. PCA was again conducted to see if they loaded on one scale. The factor loadings were above .73, with the lowest loading of .66. The Cronbach's alpha for the scale was .74.
Independent variables
All the questions measuring various independent variables were drawn from prior research. Perceived fear of migrant crime (FMC) was measured with four questions: ‘Migrants are responsible for the rise in violent crime’; ‘Migrants commit rape more often than Russians’; ‘Migrants are responsible for rise in property crime’; and ‘Migrants are a source of social disorder in the neighborhood.’ All the items had PCA loadings ranging from 0.78 to 0.83, with a Cronbach's alpha of 0.83. The total scores were expected to range from 4 to 28. Higher values mean a higher level of perceived fear of migrants committing a crime.
Two items measured perceived economic threat: ‘Migrants are taking away jobs’ and ‘Migrants cost too much.’ All the items had PCA loadings ranging from 0.82 to 0.86 and a Cronbach's alpha of 0.86. The total scores were expected to range from 2 to 14. Higher values mean a higher level of perceived cultural threat.
Two questions measured perceived cultural threat: ‘I am afraid that with the rise in migration our way of life will turn for the worse’ and ‘I am afraid our culture will be lost with the increase in migration.’ All the items had loadings ranging from 0.72 to 0.84 and a Cronbach's alpha of 0.71. The total scores were expected to range from 2 to 14. Higher values mean a higher level of perceived cultural threat.
Migrants' spread disease was measured by a single question, coded on a scale of 1 (strongly disagree) to 7 (strongly agree). Lastly, gender and income level variables were also included in the survey as control variables.
Findings
Descriptive statistics are presented in Table 1. Forty-six percent of the sample were from Vladivostok, and the remaining came from St Petersburg (27%) and Rostov-on-Don (27%). In terms of gender, there were more females than males in the St Petersburg sample (55.3%) and Rostov-on-Don (56.1%), while the genders were relatively evenly distributed in Vladivostok. The respondents’ ages ranged from 17 to 25 years, with most respondents (59%) aged 20 years and less. The majority of students from the three cities were in the age group of 19 to 20 years with St Petersburg leading the way with nearly 62.7 percent followed by Vladivostok (58.3%) and Rostov-on-Don (56.5%). Most of the respondents in the age group of 21 years and above represented in the samples were from St Petersburg (24.3%) and Rostov-on-Don (17.4%) compared to Vladivostok (3.4%) which had the smallest group. Close to about a half of the respondents came from families earning an average monthly household income (e.g. the average monthly income in St Petersburg is 49,000 Rubles [about €572]) in Rostov-on-Don (56%) and Vladivostok (49%), and St Petersburg (42%). About a fifth of the responders reported below-average incomes, and the rest reported above-average incomes. Other participant characteristics that were not presented in Table 1 are educational level and prior victimization. While interesting for fear of crime studies, they were not central to our research question. A vast majority of respondents from all three cities were first- and second-year students, followed by third year and above (St Petersburg, 59.6%, 31.6%; Vladivostok, 83.1%, 16.6%; and Rostov-on-Don, 64.6%, 30.1%). A very small group of students in St Petersburg (5.5%), Vladivostok (3.2%), and Rostov-on-Don (3.2%) were a victim of violent crime while a fifth of the group in all three cities reported prior property crime victimization (St Petersburg, 22.5%, Vladivostok, 16.5%, and Rostov-on-Don, 27.5%). Prior victimizations were not central to our research question and thus were not included in our analyses.
Demographic characteristics of respondents (N = 944).
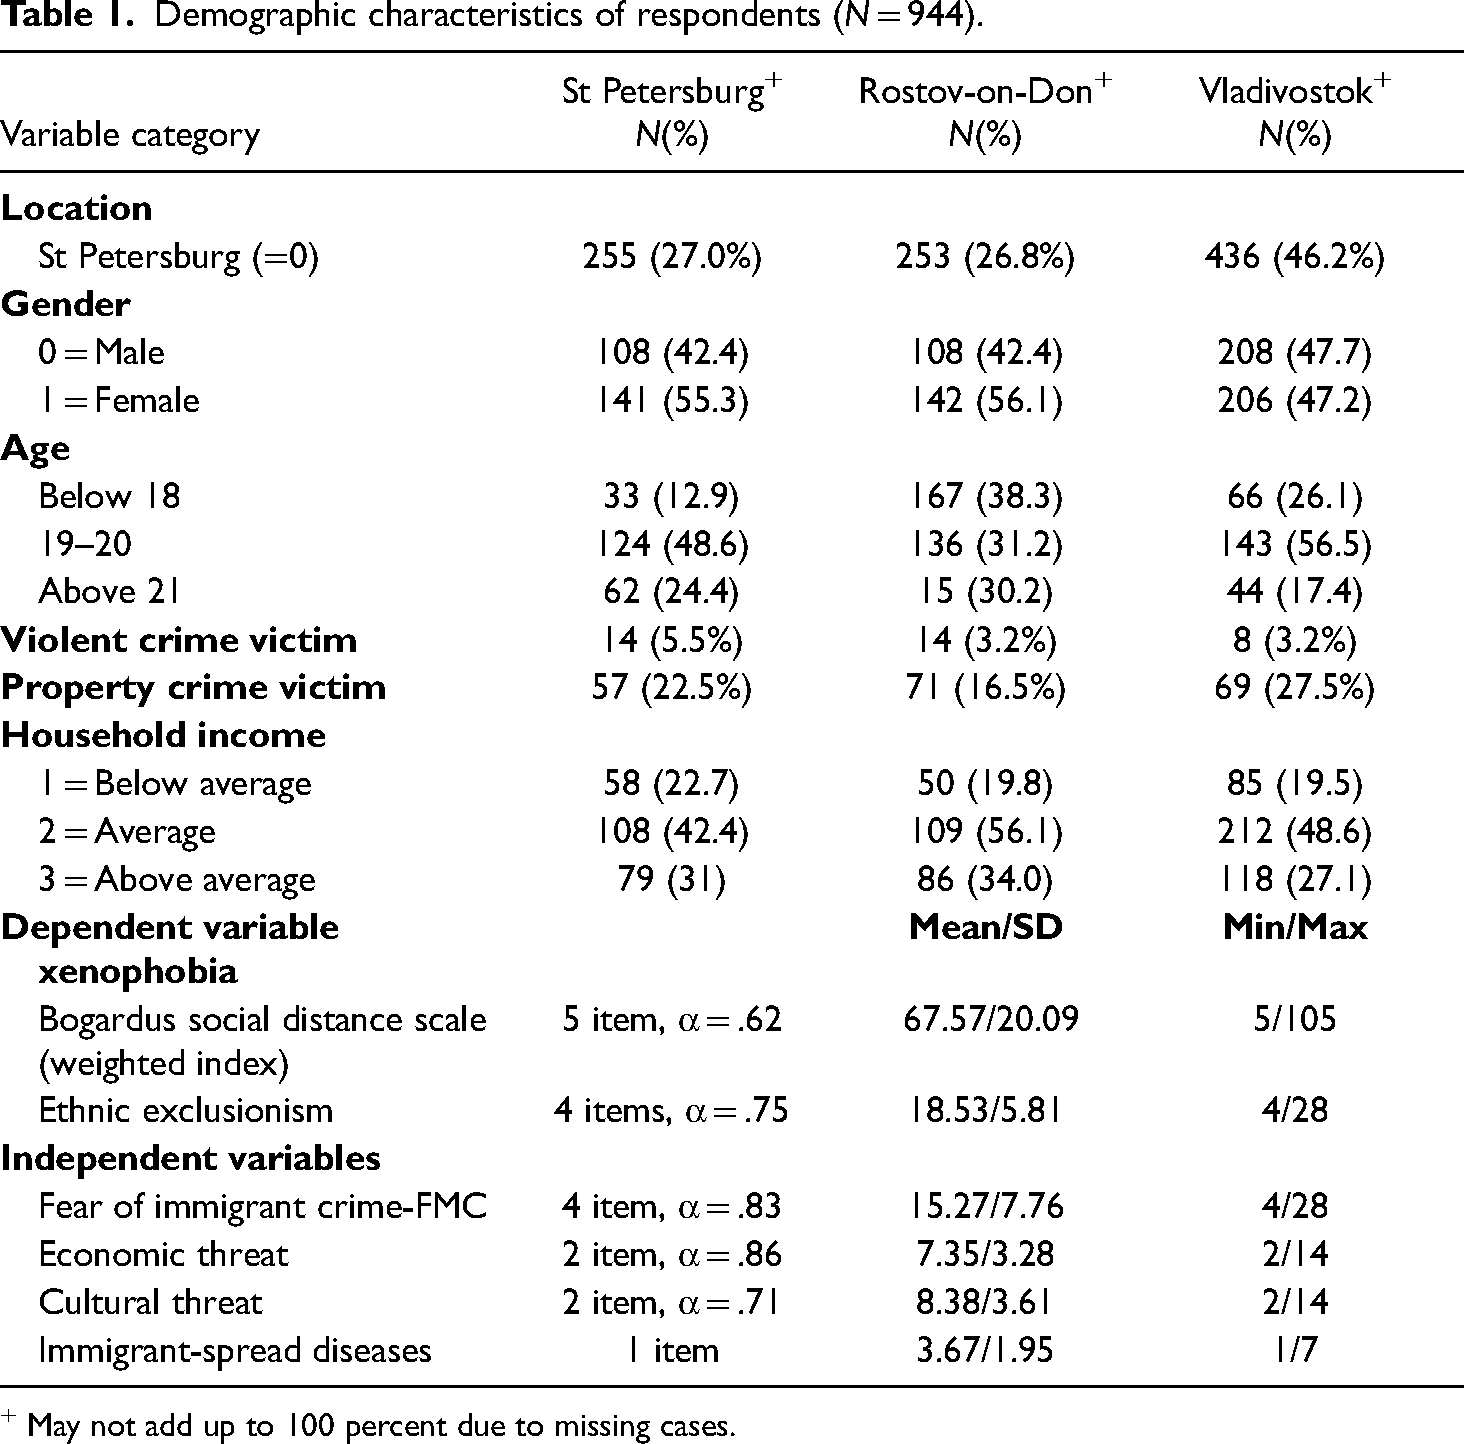
May not add up to 100 percent due to missing cases.
Analysis
Ordinary least squares (OLS) analysis was employed to assess the influence of various independent variables on the dependent variables of social distance and ethnic exclusionism. Our dependent variables of social distance and ethnic exclusionism are constructed from Likert scale questions, which raises the issue of whether OLS is an appropriate analytical tool. It has been argued that logistic regression or ordinal regression is more suitable for this type of variable (Cohen et al., 2014). However, according to Kromrey and Rendina-Gobioff (2002), the use of OLS is appropriate even for discrete-continuous variables (such as individual Likert items) and produces results similar to those obtained by using the two other techniques. Further, Likert scale data is often used in research on xenophobia and assumes that an ordinal metric exists in the measurement of xenophobic attitudes (Weinfurt and Moghaddam, 2001).
The assumptions of normality, linearity, and homoscedasticity were all met in the analysis. The mean variance inflation factor (VIF) scores for all three cities ranged from 1.08 to 1.49, suggesting no multicollinearity issues.
We presented unstandardized betas as well as standardized (β) to look for the slopes’ relative strengths in each of the models, respectively. OLS findings for social distance are presented in Table 2 and ethnic exclusionism in Table 3. As noted earlier, higher scores of explanatory variables on the dependent variable represent less social distance and lower support for ethnic exclusion suggesting more favorable attitudes toward immigrants and less xenophobia. In contrast, negative coefficients suggest xenophobia and greater social distance, and stronger ethnic exclusion attitudes. The findings show that our results are robust in terms of signs of coefficients to model specification.
Regression coefficients of demographic and contextual variables on social distance (N = 944).
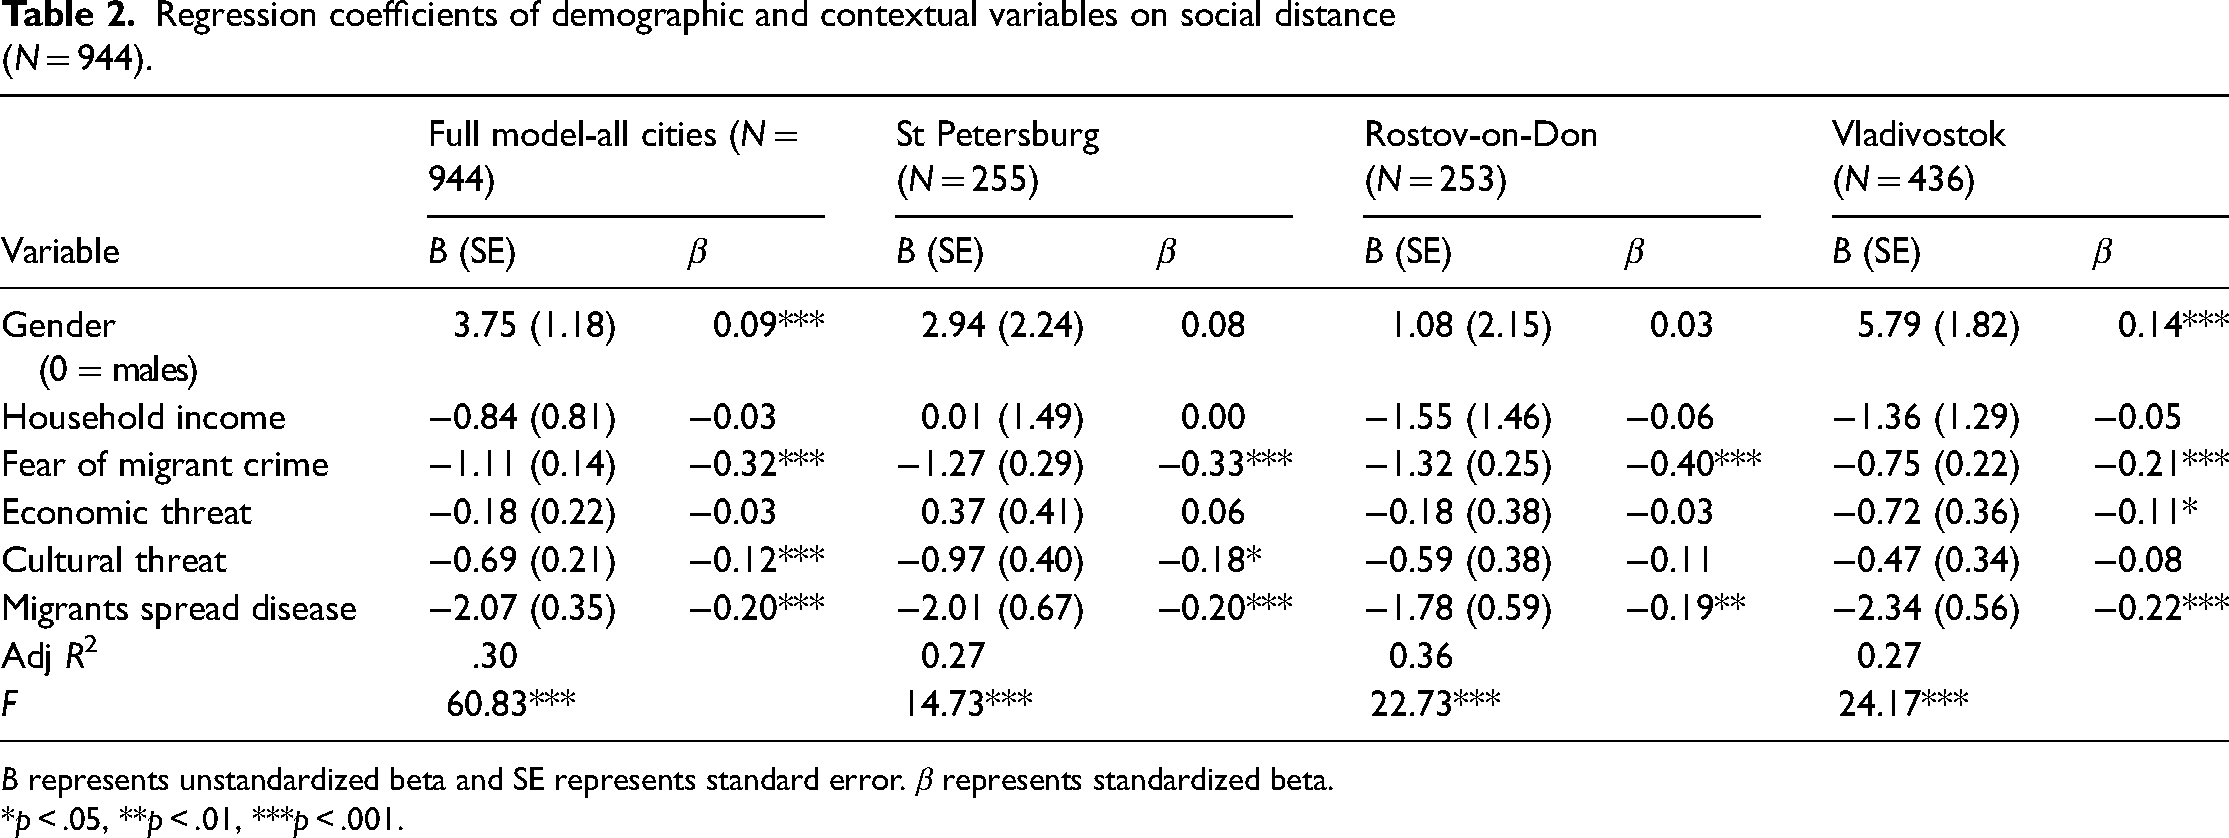
B represents unstandardized beta and SE represents standard error. β represents standardized beta.
*p < .05, **p < .01, ***p < .001.
Regression coefficients of demographic and contextual variables on ethnic exclusionism (less support for ethnic inclusion) (N = 944).
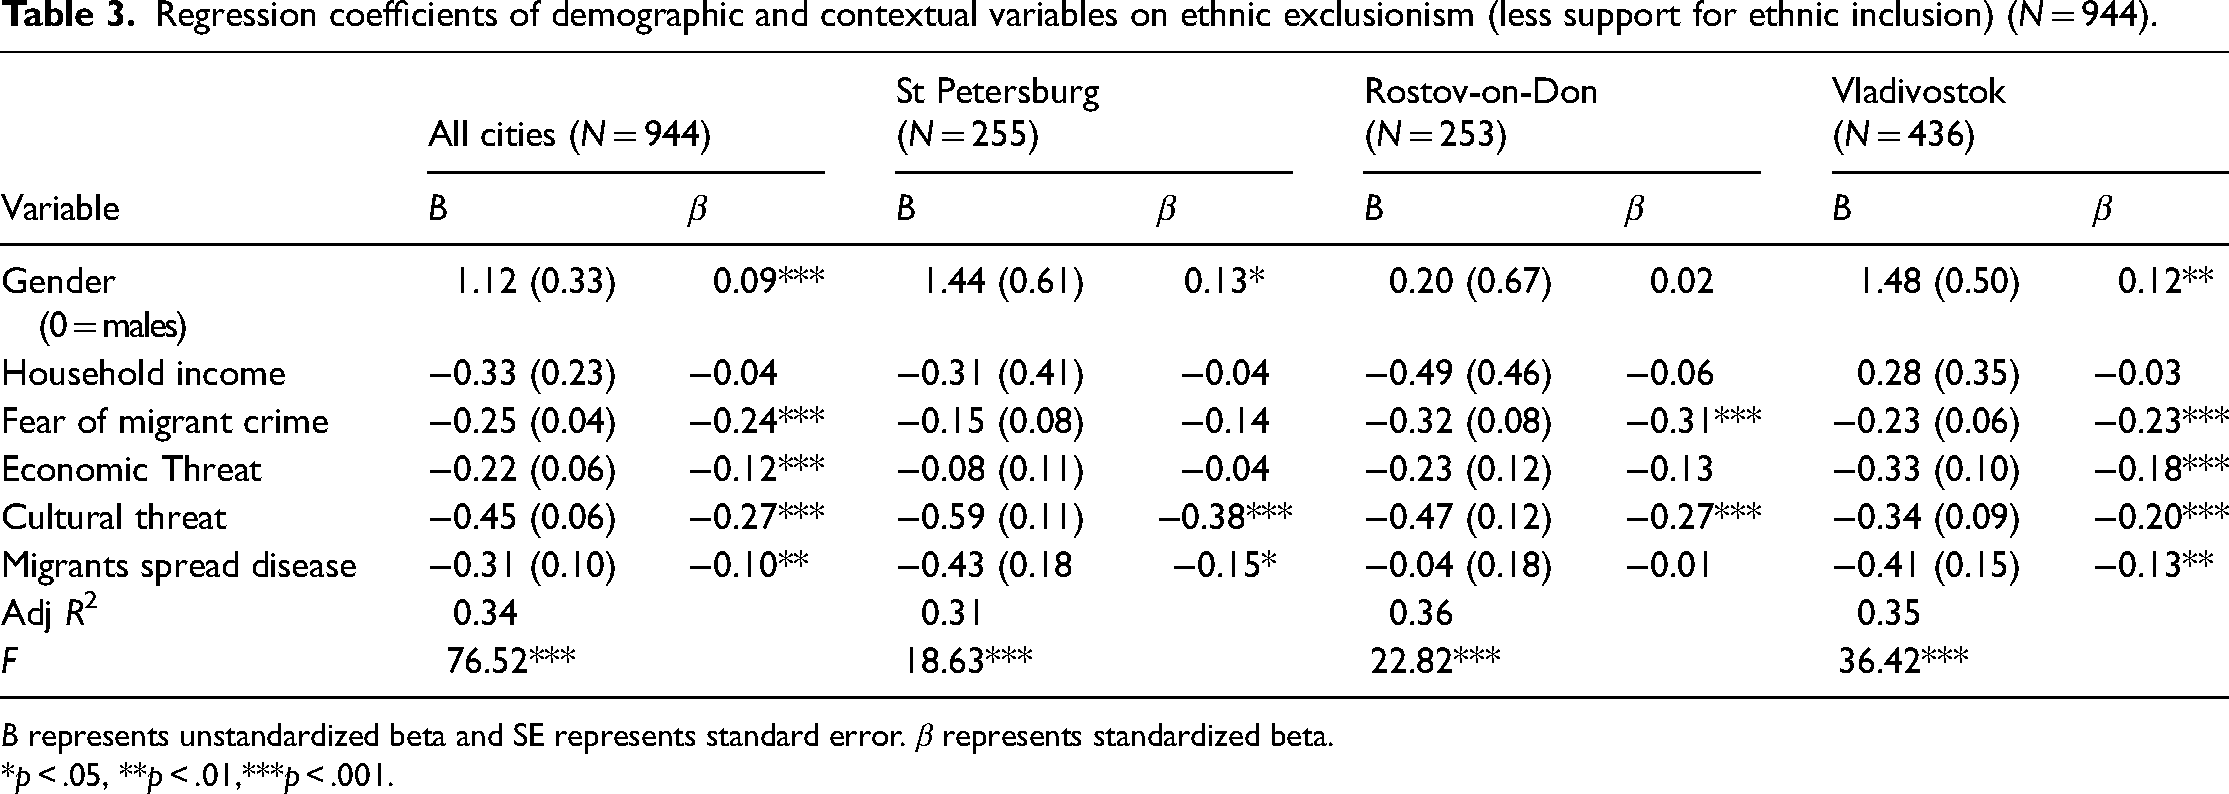
B represents unstandardized beta and SE represents standard error. β represents standardized beta.
*p < .05, **p < .01,***p < .001.
The findings on social distance in the full model for all three cities suggest that the independent variables explain 30 percent of the variance. A comparison of the separate models for the three cities shows that the explanatory power of the model is stronger for Rostov-on-Don (Adjusted R2 = .36) compared to St Petersburg (Adjusted R2 = .27) and Vladivostok (Adjusted R2=.27).
Among the key predictor variables, FMC is negatively related to social distance, suggesting anti-immigrant sentiment in the full model (β = −0.32, p < .001), a statistically significant finding. FMC was also found to be the strongest predictor of xenophobia in terms of social distance for St Petersburg (β = −0.33, p < .001), Rostov-on-Don (β = −0.40, p < .001), and Vladivostok (β = −0.21, p < .001).
The perceived economic threat does not influence social distance in the full model in St Petersburg and Rostov-on-Don cities. However, the perceived economic threat is negatively related to social distance in Vladivostok (β = −0.21, p < .001) suggesting economic concerns propel anti-foreigner sentiments in that city. The perceived cultural threat is negatively related to social distance in the full model (β = −0.12, p < .001), suggesting that perceived threats to cultural values may cause xenophobia among Russian millennials. Interestingly, a statistically significant relationship between social distance and the perceived cultural threat was found only in the St Petersburg sample (β = −0.18, p < .05). This effect was modest compared to the FMC, however, suggesting that this city's millennials may be more sensitive about immigrants posing a cultural threat to their society and thereby creating more social distance compared to the other cities in our study.
Finally, yet another strong predictor of xenophobia in the full model was the belief that migrants spread disease in society (β = −0.20, p < .001). A similar finding was reflected in St Petersburg (β = −0.20, p < .001), Rostov-on-Don (β = −0.19, p < .001), and Vladivostock (β = −0.22, p < .001).
Among the control variables, females were less xenophobic in terms of social distance and anti-immigrant sentiments than males (β = 0.09, p < .001) in the full model. Curiously, a similar statistically significant gender effect was found only for Vladivostok (β = 0.14, p < .001). Household income did not have any statistically significant relationship with ethnic exclusion in either the full model or any city.
Ethnic exclusionism
The findings on ethnic exclusionism (Table 3) in the full model for all three cities suggest that the independent variables explain 34 percent of the variance. Explained variance in separate models was 31 percent for St Petersburg, 36 percent for Rostov-on-Don, and 34 percent for Vladivostok.
As before, females in our sample were less xenophobic than males in terms of anti-immigrant sentiments in the full model (β = 0.09, p < .001). A similar statistically significant gender effect was found only for St Petersburg (β = 0.13, p < .05) and Vladivostok (β = 0.12, p < .01). Household income did not have any statistically significant relationship with ethnic exclusionism in either the full model or any city.
Among the key predictor variables, as in social distance, FMC is negatively related to ethnic exclusionism, suggesting anti-immigrant sentiment in the full model (β = −0.24, p < .001). However, unlike findings from a social distance, FMC was found to be a statistically significant predictor of xenophobia in terms of ethnic exclusionism for only Rostov-on-Don (β = −0.31, p < .001), and Vladivostok (β = −0.23, p < .001), but not for St Petersburg.
Of the two variables representing group conflict, the perceived economic threat is negatively related to ethnic exclusionism in the full model (β = 0.12, p < .001), and unlike in the social distance model, the relationship is statistically significant. However, as in the social distance model, the economic threat variable is negatively related to ethnic exclusionism only in one city, Vladivostok (β = −0.18, p < .001), suggesting anti-foreigner sentiments are enhanced by the fear of migrants posing an economic threat. The second group conflict measure, perceived cultural threat, is negatively related to ethnic exclusionism in the full model, suggesting that perceived threats to cultural values cause xenophobia among Russian millennials. Interestingly, however, a statistically significant relationship between ethnic exclusionism and the perceived cultural threat was found not just for St Petersburg (β = −0.38, p < .001) as in social distance, but for Rostov-on-Don and Vladivostock (β = −0.27, p < .001; β = −0.20, p < .001), respectively. Of all the variables in each of the OLS models for ethnic exclusionism, cultural threat and FMC had the largest effect on the dependent variable.
Finally, yet another strong predictor of ethnic exclusionism was the belief that migrants spread disease in society. As in social distance, sentiments of ethnic exclusionism were explained by the fear of migrants spreading disease in the full model (β = −0.10, p < .01). Similar statistically significant findings were seen in the St Petersburg (β = −0.15, p < .05) and Vladivostok (β = −0.13, p < .01) samples, but not in the Rostov-on-Don sample.
Discussion
In this research, we assessed factors that determine Russian millennials' xenophobic attitudes as measured by Bogardus’ social distance (1958)) and Scheepers et al. (2002) ethnic exclusionism measures toward migrants in three cities with diverse historical, cultural, and economic characteristics. We drew from fear of migrant crime and group threat perspectives to assess factors that contribute to anti-immigrant perceptions. These factors include FMC, perceived economic and cultural threats, and fear of diseases carried into the country by migrants.
Overall, our hypotheses are partially supported. However, we observed differences in some variables’ predictive power for some cities and variation in the strength of the explanatory power for the two dependent variables. Among the statistically significant findings, FMC's effect and fear of migrants spreading disease had the strongest predictive power for social distance, and FMC and cultural threat had the strongest predictive power for ethnic exclusionism. Only Vladivostok had all the key explanatory variables statistically and significantly explained their relationship to ethnic exclusionism at the city level. Hypotheses for other cities were partially supported.
This study's findings offer support for Hypothesis 1, suggesting a relationship between FMC and xenophobia, as defined by our measures. The effect is significant in the full model on both measures of xenophobia—social distance and ethnic exclusionism. It is well established that fear of crime makes citizens lose trust in their communities (Ferraro and Grange, 1987) whether it is in racially diverse communities (Liska et al., 1982) or ethnically diverse countries (Bianchi et al., 2012). In many countries in Europe, FMC and its connection with growing xenophobia are also well established (Skardhamar et al., 2014). The findings from this study are consistent with this prior research, demonstrating an association between FMC and anti-immigrant sentiments and adding a Russian context to the existing studies that have found similar associations in other countries in Europe and elsewhere (Visser et al., 2013).
These results further support the findings from Russia that have shown linkages between FMC and hostility toward migrants (Alexseev, 2010, 2011; Leviyeva, 2005), particularly hostility toward those immigrants from the Caucasus and Central Asian Republics. As in the full model, the findings are similar but not identical in all city samples for the relationship between FMC and ethnic exclusionism. However, findings for FMC's relationship with social distance were established in all three cities, but the findings for ethnic exclusionism were not uniform across cities—no such result was found for St Petersburg. Most of the migrant labor that comes from the Central Asian Republics constitutes low-paying work (e.g. janitorial, gas stations, supermarkets, etc.), yet fills an important area of the service sector. Millennials in St Petersburg see migrant laborers regularly and perhaps recognize the labor market's supply and demand, and this may stir less xenophobia at a structural level of ethnic exclusionism. However, it may have a more substantial effect on personal matters as measured by questions included in the social distance scale with migrants.
Our results do not support the economic threat thesis (Hypothesis 2) for social distance. However, it strongly predicts Russian millennials’ xenophobic feelings of ethnic exclusionism. This finding is consistent with research in other parts of the world (Ceobanu, 2011; Esses et al., 1998; Quillian, 1995). This finding is also consistent with prior research from Russia that established economic threat as a critical indicator of support for the deportation of migrants (Alexseev, 2011), a dimension included in the ethnic exclusionism scale. A perceived economic threat has also been found to be partially related to the percentage of minorities in the respondent's community (Quillian, 1995; Semyonov et al. 2006; Wilcox and Roof, 1978).
City-wide comparisons suggest that perceived economic threat may predict both social distance and ethnic exclusionism, but our data only found this association in Vladivostok. The lack of support for economic threat for any form of anti-immigrant sentiment in St Petersburg or Rostov-on-Don may be a function of cultural stereotypes, for example, most migrants are generally employed in low-wage industries. At the same time, however, the respondents in this survey are mainly university students set in an aspirational trajectory and expecting to pursue jobs in which most migrants are not seen as competition.
On the other hand, Vladivostok has in recent years experienced an economic transformation that created employment opportunities for a growing number of Central Asian migrants, Chinese, and Koreans (Gorian, 2017) who possess competencies in digital, electronics, and communications, and these migrant workers are mostly drawn from the college-educated population. Russian millennials’ economic conditions in Vladivostok are qualitatively different from those in St Petersburg, which may account for some hostility, social distance, and ethnic exclusionism. Thus, based on our results, a perceived economic threat does not appear to have a uniform impact on millennials’ xenophobic sentiments across Russia and seems to be dependent on current local economic conditions.
Findings from this research find support for the second group conflict variable based on the cultural threat hypothesis (Hypothesis 3). Our results show it as a strong predictor in the full models of both of our dependent variables of xenophobia. This finding is consistent with prior research from other countries that suggested the dominant group's negative and hostile attitudes were a consequence of differing cultural values, and this disparity in values shapes perceptions of threat to group identity and cultural purity (Duckitt, 2001; Raijman and Semyonov, 2004; Rokeach et al., 1960). Similar conclusions were drawn from research conducted in Russia (Gorodzeisky, 2019; Gorodzeisky and Glikman, 2018; Gorodzeisky et al., 2015).
Between the two measures of xenophobia, the perceived cultural threat is a strong predictor of social distance in the full model and the individual cities for ethnic exclusion. However, for social distance, it is only a strong predictor in the full model and only in the St Petersburg sample. This is an interesting yet curious finding. In terms of population size and city demographics, St Petersburg is the second-largest city in the country and it has a unique social and economic culture. Compared to the other two cities, St Petersburg has been historically viewed as a more liberal city relative to Russian cities. Yet in a comparison between Rostov-on-Don, a southern landlocked city, and Vladivostok, a border city adjacent to three major economic powers (China, Korea, and Japan), St Petersburg millennials perceived fear of migrants coming from the Caucasus and Central Asian republics as a threat to their cultural values. While 89 percent of St Petersburg millennials in our sample do not mind accepting a migrant as a colleague, only 21 percent indicated that they would date or marry a migrant.
Hypothesis 4 is supported by data across all three cities. Our results show a clear relationship between respondent views that migrants spread diseases and our measurements for social distance and ethnic exclusionism. This finding is consistent across all three cities and on both dimensions of xenophobia. These results are similar to findings from prior research that suggested that fear of migrants spreading diseases is a strong predictor of xenophobia (Faulkner et al., 2004).
Our next hypothesis on gender (Hypothesis 5) is supported by the full social distance and ethnic exclusionism models for one city (Vladivostok). Compared to males, females appear to be less xenophobic, supportive of less social distance, and moreopposed to ethnic exclusion. This finding is also consistent with prior research that has shown that males exhibit stronger anti-immigrant sentiments (Gorodzeisky and Semyonov, 2009; Semyonov et al. 2006; Quillian, 1995). However, St Petersburg's results did not show any significant relationship between gender and social distance, a finding not consistent with Semyonov and Glikman’s (2009) work. Such a non-significant finding on social distance may possibly be attributed to women's regular interactions with migrants who work in the service industries, which may foster a perception that migrants are filling a niche occupation that is well below the expectations of any local residents seeking employment.
Finally, our last hypothesis relates to income (Hypothesis 6), and xenophobia was not supported by our findings. These economic variables are in some ways inconsistent with prior research that found migrants as ‘social ills’ (Ceobanu, 2011: 114) and a threat to social resources (Esses et al., 1998). The lack of support for the hypothesis may in part be driven by the sample in our study, who are millennials attending college, suggesting that they are still dependent on their parents and not currently in the labor market.
Limitations
We draw attention to a few limitations in our study that future research could address. First, it utilizes a convenience sample, with all the attendant problems this poses for generalizability. Second, this research has focused on global perceptions rather than prior victimization experiences to capture the affective and cognitive perceptions of the dimension of fear of migrant crime. Third, we caution that data is limited to the extent that its coverage was with young Russian citizens and therefore not representative of the cities’ populations. Future research will be needed to get a more comprehensive sample, as well as to explore further the nature of knowledge of and interaction with migrants as vital control variables to understanding xenophobia.
Additionally, the Cronbach’s alpha for the social distance scale was 0.62, which may be considered low. However, while interpreting our results, we followed Taber (2018), who called the level of 0.70 somewhat arbitrary and suggested that despite many authors following a rule-of-thumb that the alpha should reach this level, the grounds for adopting this heuristic are limited. Also, Schmitt (1996) indicates that there is no general level when alpha becomes acceptable and justifies using instruments with lower levels. Further, while Confirmatory Factor Analysis (CFA) is a preferred method over PCA for factor analysis, we have used the latter because our objective was to reduce the observed variables from our study to a smaller set of independent composite variables and not to test a theoretical model of latent factors causing observed variables for which CFA would have been more appropriate. Finally, our findings are limited by the absence of data on inter-ethnic crime rates in these three cities to assess the threat hypothesis (Liska et al., 1982) by controlling for fear of migrant crime on social/ethnic exclusion.
Conclusion
This research contributes to the xenophobia literature in a few areas. First, unlike prior research that measured xenophobia with one variable, in this research, we measure it with two dimensions that are similar, yet distinct. Second, this research focuses on Russia, once part of the Soviet Union, where people with their unique cultures, distinct characteristics, and identities moved across vast terrain and time zones. After the fall of the Soviet Union, the internal movement of people from among the various CIS continued, bringing in its wake a wave of anti-immigrant sentiments. While our results support many of the findings drawn from Europe and other countries with high migration rates, we also found mixed or lack of support for some of the hypotheses. One such finding is the absence of widespread support for the relationship between the perceived economic threat and xenophobia. This lack of finding is interesting, particularly among young citizens getting ready to enter careers who are not troubled or impaired by rhetoric about losing jobs to low-paid migrant workers. Finally, our findings show that cultural threats, the fear of migrant crime, and migrants spreading diseases are stronger predictors of multiple dimensions of xenophobia than economic indicators.
While these fears are perceptually driven, they are very real in their impact on an individual's belief system. These findings raise implications for the importance of public awareness programs. Sovereign states might consider adding diversity and ethnic inclusion to schools’ curricular development, as well as focusing attention on media responsibility in educating the public. Cold, unwelcoming hostility and negative attitudes toward migrants are not without implications for the lives of those who are allowed into the host country (Fussell, 2014) or, indeed, for the country as a whole. Migrants often face discrimination in the criminal justice system, and prisons flooded with migrants may drive initiatives for adopting further punitive measures and fostering mistreatment of migrant labor (Melossi, 2000, 2008). Migrants being accepted into the host country may experience what Esses (2021) refers to as ‘downstream effects,’ relating to the treatment of immigrants setting the tone for intergroup relations (Fussell, 2014) and offering immigrants a sense of belonging and helping integrate them socially and culturally into the host country. Toward this end, the state and the media could do more to enhance positive imagery of migrants and their contributions to society, which may, in turn, have the potential to reduce xenophobia. Finally, the media has a critical yet often neglected role in presenting crime stories and incidents objectively, carefully giving the facts on indigenous- and migrant-committed crimes and crime rates. This focus on objectivity could act as an inhibitor to some perceptions of xenophobia discussed here.
Footnotes
Declaration of conflicting interests
The authors declared no potential conflicts of interest with respect to the research, authorship, and/or publication of this article.
Funding
The authors received no financial support for the research, authorship, and/or publication of this article.