
Abstract
The spatial distribution of light within one’s field of view plays a moderating role in both visual and non-visual effects. Besides the main vector of light direction, another aspect of the luminous spatial distribution is the perceived size of the light source expressed in a solid angle. In this project, we investigated the effect of frontal light exposure with two different solid angles and luminance settings. The vertically measured illuminance was similar in both settings at ca. 510 lx, corresponding to a melanopic Equivalent Daylight Illuminance of 580 lx. In an early afternoon laboratory study in a within-subject design, 39 participants underwent a 2-h protocol consisting of cognitive performance tasks, and subjective assessments of sleepiness and visual comfort. The data showed mixed results, with the light exposure from the source of higher luminance and smaller solid angle leading to decreased subjective sleepiness, however, at the cost of decreased reaction speed in a cognitive task.
1. Introduction
The spatial distribution of light in the field of view affects the performance of visual tasks, as light coming from specific angles can cause glare, leading to discomfort or partial impairment in completing these tasks. This phenomenon is well-documented and incorporated into lighting standards. 1
In addition to the impact on visual tasks, the levels of light and its spatial, spectral and temporal patterns 2 also affect the non-image forming (NIF) responses. In our previous work, 3 we analysed the impact of a spatial pattern, by investigating the NIF response to the change in light direction in three settings, with the light sources positioned on the periphery of the visual field with light either from above, below or the side. The distance and size of the light source (and thus the solid angle) were kept constant and realised the same vertical illuminance and melanopic Equivalent Daylight Illuminance (melanopic EDI) at the eye in all conditions. The results have shown beneficial effects of light originating from above, reflected in the subjective alertness and reaction speed in a simple reaction-time task.
In this publication, the focus was on varying the light source size with the position directly in front of the eyes. The effect of size source was addressed in 2013 by Novotny et al. 4 in a small study with a large 18 000 K light source positioned above a small 11 000 K light source in the field of view of the participants. Their results indicate that the large light source seems more effective at suppressing melatonin than the smaller light source. More recent research confirms that the intrinsically photosensitive retinal ganglion cells (ipRGCs) are spread across the retina, thus increasing the size of the luminous area could potentially result in more effective NIF-effect stimulation.5,6 This topic has recently gained attention in studies from the automotive context. Weng et al. 7 investigated two bright light conditions of matching melanopic EDI at the eye of ca. 120 lx, but with varying solid angle sizes of 0.393 sr in the large solid angle condition and 0.051 sr for the small solid angle, and with the light sources positioned in the upper part of the visual field. Despite the differences in solid angles, and consequently, the luminance of sources, the results have shown a stimulating effect on subjective alertness and melatonin concentration reduction in both settings, but not on cognitive performance, as compared to the dim light condition. There was no significant difference in subjective alertness and melatonin concentration due to source size, but the setting with the smaller solid angle of higher luminance was significantly less pleasant and more glaring in the visual comfort assessment.
In another study with a similar set-up, 8 the authors investigated the influence of morning exposure to light panels positioned in the upper part of the visual field, with two solid angles of either 0.05 sr or 0.44 sr, and matching illuminance at the eye of 200 lx (168 lx melanopic EDI). They did not find significant differences in cognitive performance or levels of subjective alertness. In the examples discussed above, as well as in this study, the subjective alertness term refers to the subjective sleepiness assessed with a questionnaire.
Nevertheless, research shows that glare negatively impacts visual comfort,9–11 which in turn can manifest in impaired cognitive performance.12,13 As such, the results of the automotive studies discussed above could have manifested in a significant decrease in cognitive performance should more glare-inducing settings have been implemented, especially taking into consideration research showing lower reported sensitivity to glare with light originating above the line of vision.14,15
In this experiment, we investigated the impact of a light source size manipulation on the NIF effects. We compared two light source sizes, however, with few essential differences in the experimental design compared to the aforementioned studies. Firstly, the light sources in our experiment were positioned in front of the participants as there was no requirement for an unobstructed field of view directly in front of the participants to perform visual tasks, nor were there spatial constraints typically encountered in automotive settings with limited interior space. Secondly, the light dose in our experiment was noteworthy higher, intending to exceed the recommended minimum of 250 lx melanopic EDI for the NIF effects stimulation during daytime. 16 Finally, the timing of exposure in this study was in the early afternoon, as the focus was on the post-lunch dip when a natural drop in alertness occurs.17,18 We expected a reduced visual comfort of the setting with high luminance and a small solid angle and hypothesised that such conditions in line with Weng et al. 7 might increase subjective alertness. However, due to increased objective glare in our settings, we also expected to observe an effect on cognitive performance. Therefore, the hypothesis was that a light source with a smaller solid angle and of higher luminance impairs visual comfort, which consequently has an effect reflected in the magnitude of NIF responses in cognitive performance and subjective alertness, all while keeping an equal ipRGC stimulation between the settings and while keeping the position – thus the main vector of light direction – constant.
This experiment was conducted within the same study series that also included the experiment on the directionality of light as presented in our previous publication. 3
The two ‘source size’ conditions were offered to the participants after finishing the three ‘directionality of light conditions from the previously published study, with a one-week wash-out period between the experiments. The two experiments had the same methodology, experimental set-up, protocol, participant group and a matching light dose in terms of melanopic EDI and spectral power distribution (SPD) measured vertically at the eye in all the experimental light conditions.
2. Method
2.1 Experimental set-up
Two lighting conditions (also referred to as lighting scenes (LSs) A and B – LSA and LSB, respectively) were created in two custom-built, mirrored chambers. Both LSs utilised a light source positioned directly in front of the gaze of the participant at a 128-cm distance, representing a frontal, majorly foveal illumination. The solid angle occupied by the light source in LSA was 0.40 sr and 0.18 sr in LSB, and in both scenes, the light sources were completely within the field of view as per the CIE S026 model. 4 In both conditions, the extent of the light source reached an angular distance of 10° or beyond, counted from the gaze vector. That is to accommodate for the highest perceived brightness following Guth’s Position Index and follow-up studies regarding brightness perception in the field of view.15,19
The conditions were viewed binocularly and provided a similar light dose measured vertically at the eyes of test subjects with a spectroradiometer. The light dose was set at the illuminance of 510 lx photopic, at a blue-enriched SPD with a correlated colour temperature (CCT) of 6400 K, realising a melanopic EDI of ca. 580 lx and colour rendering index of >80. To achieve the required dose, the luminance of light sources of different sizes had to vary. Furthermore, the mean luminance of the light source in LSA was ca. 1300 cd m−2 and 2930 cd m−2 for LSB. The calculation of Unified Glare Rating 1 (UGR) using the standardised formula (Equation (1)) shown below resulted in 33 for LSA and 37 for LSB. The position index in the formula was equal for both settings, as the luminaires were centrally located in front of the participant’s gaze.
where Ls is the source luminance (cd m−2), Lb is the background luminance (cd m−2), ω is the subtended size of the source (sr) and p is the Guth Position Index.
2.2 Setting and apparatus
The experiment was conducted at the Technische Universität Berlin (TU Berlin) in the laboratory of the Chair of Lighting Technology. The walls, ceiling and floor surfaces were black, and the laboratory was shielded from external light. The set-up consisted of two areas: Area 1 used for the questionnaires on the computers and for the lunch, and Area 2 with the two custom-made chambers with mirrored layouts, where participants were positioned for the cognitive tasks (Figure 1 for layout and dimensions). The dim light condition in Area 1 provided <18 lx photopic, with a CCT of 2700 K, measured vertically at the eye of participants. In the first stages of the cognitive tests, a dim light (<1 lx) condition with a CCT of 2700 K was provided in Area 2. Figure 2 shows the SPD of both dim light conditions and the experimental light conditions. SPD for the experimental light conditions was the same for all the LSs.
Plan of the laboratory. Dimensions in millimetres
Spectral power distribution of the light sources used in this experiment normalised at 555 nm
The lighting condition in the test chambers in Area 2 was realised with a rectangular light source (RIDI NOREA-QA SPECTRAL) at 128 cm from the eyes to the centre of the luminaire. The condition with the large solid angle (LSA) utilised the complete, uncovered light source of 600 × 600 mm2, and the condition with the smaller solid angle (LSB) used the same light source with a black-out filter frame, covering the perimeter of the luminaire and effectively creating a smaller light source of 340 × 340 mm2. The lighting conditions provided, measured vertically at the eye of participants, are presented in Table 1, with their luminance pictures displayed in Figure 3.
Overview of the light dose provided at each lighting scene
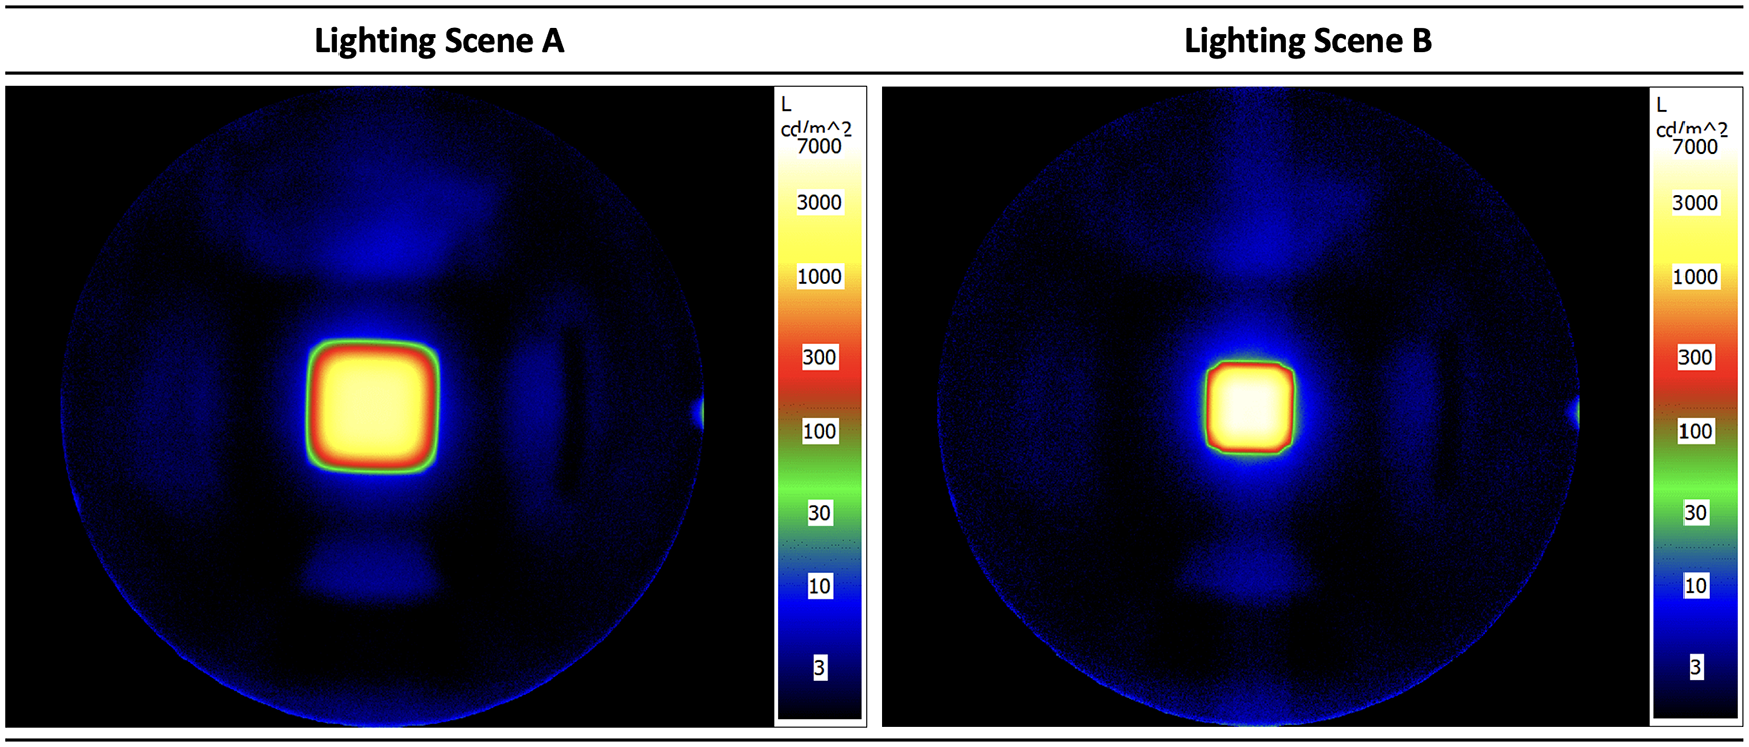
Fish-eye luminance images of the lighting scenes, taken from the position of the participant’s eyes for LSA – with the large light source (left), and LSB – with the smaller light source (right)
The testing chambers were equipped with cameras used by the researcher to control the gaze direction and opened eyes of the participants. The footage was not recorded and stored due to data protection, and participants were informed about the purpose of the cameras.
2.3 Participants
Forty participants (24 men, 16 women; mean age = 27.5 y, range = 20 y to 37 y) were recruited for this study, out of which 39 completed all the visits. The participants were selected based on the following inclusion criteria probed in the registration questionnaire:
– Good mental and physical health, assessed with the SF-12 questionnaire (mental health score >34, physical health score >33) 20
– No significant indication of depression, probed with the Patient Health Questionnaire-9 (score < 10) 21
– Normal or corrected vision
– No colour blindness assessed with the Ishihara test 22
– No travel through multiple time zones up to 2 months prior to the experiment
– No extreme chronotype, assessed with the German version of the Morningness-Eveningness Questionnaire (score between 30 and 70) 23
– Fair sleep quality, assessed with the PIttsburgh Sleep Quality Index Questionnaire (score < 8) 24
– No regular or excessive alcohol use (more than three times a week)
2.4 Procedure
The total timeframes of the two-part experiment were between 7 November 2022 and 27 February 2023. The experiment was performed in a within-subject design, where the participants went through each of the two LSs in separate sessions (visits to the lab), with a one-week wash-out period between the sessions. The participants came in pairs, and LSs were offered to four participants per day for two consecutive weeks. During each visit, the participants were randomly assigned to one of the two experimental LSs. Participants were asked not to consume food and drink coffee or other stimulating products up to 3 h before the session and to maintain a regular and healthy sleeping schedule throughout the experimental period. The experiment was performed in the early afternoon hours, starting either at 12.00 or 14.00, to benefit from the so-called post-lunch dip phase, when a natural decline in alertness occurs. A meal was provided to further enhance the post-lunch dip effect.17,18,25 The experiment was approved by the Ethics Committee of the Faculty of Electrical Engineering, TU Berlin.
Each session (Figure 4) consisted of an introduction and initial questionnaire with lunch (also referred to as a testing block, or TestBlock 0, abbreviated to TB0), a baseline TestBlock (TB1), an active-listening task, two more TestBlocks (TB2 and TB3), a closing questionnaire (TB4) and a debriefing. A set of similar tasks was repeated in consecutive TBs to observe the effect of light exposure over time. One full session lasted a maximum of 120 min. The participants were well acquainted with the session’s protocol from the preceding experiment. Consequently, a learning effect bias was minimised. During the first 20 min, the participants filled in the initial questionnaire, which probed the following:
– Momentary sleepiness (Karolinska Sleepiness Scale, KSS), 26 allowing the participants to read the description of the scale’s steps, to prepare for verbal assessments in TB1 to TB3
– Sleep quality on the day of the session (PSQI questionnaire) 24
– Light history of the 24 h preceding the visit (Harvard Light Exposure Assessment questionnaire) 27
– Momentary mood state (Multidimensional Mood State Questionnaire) 28
– General well-being on the session day
– Food and beverage consumption on the day of the session
– Time spent outside and activities performed until the session
– Height and weight for the body mass index (BMI) calculation to check for the effect of the covariable Food Factor (caloric intake of the consumed lunch divided by BMI of a participant) on the main response variables
After the initial questionnaire, participants remained in Area 1 for an additional 10 min to 20 min, where they consumed a lunch meal. After the meal, participants moved to Area 2 and took a seat in the experimental chambers. Their positions were adjusted as per Figure 5.
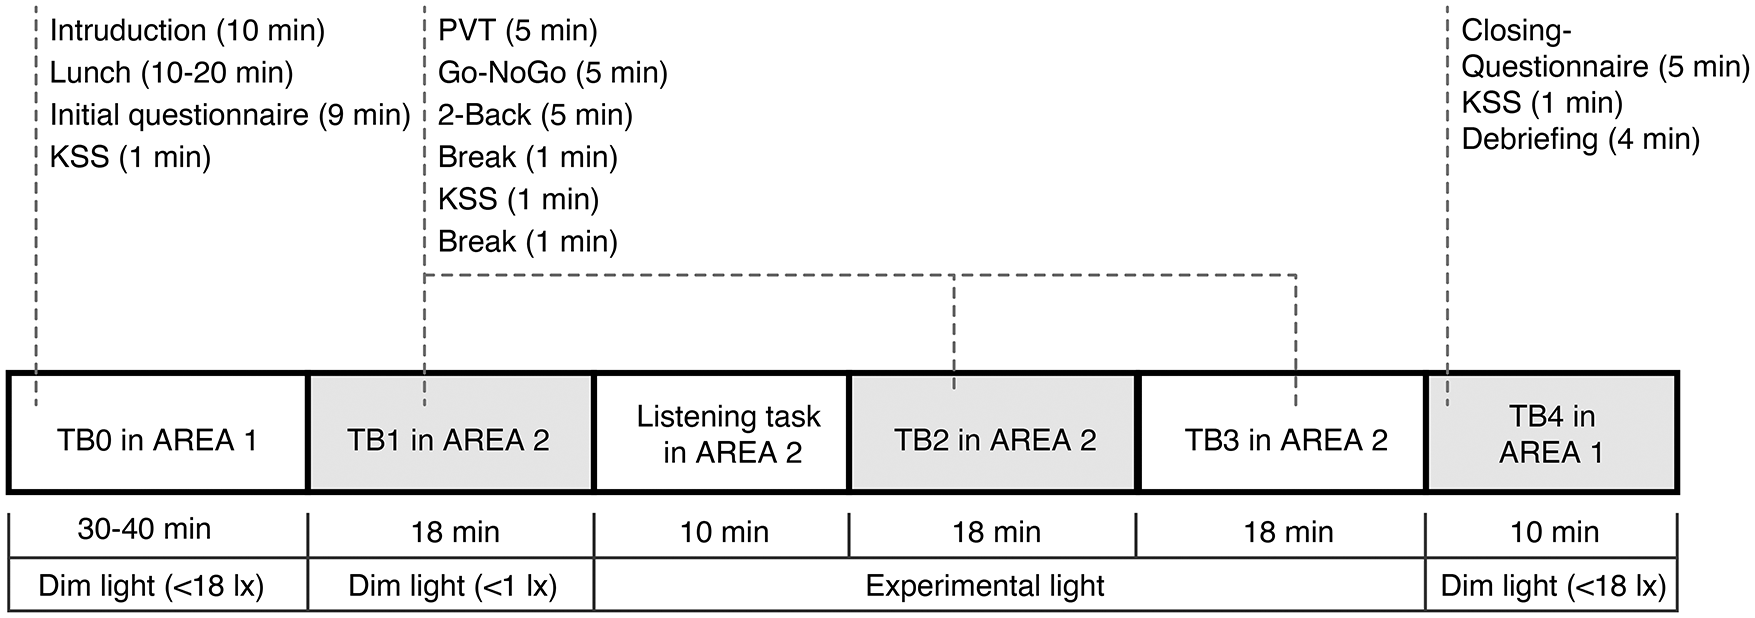
Protocol for each session
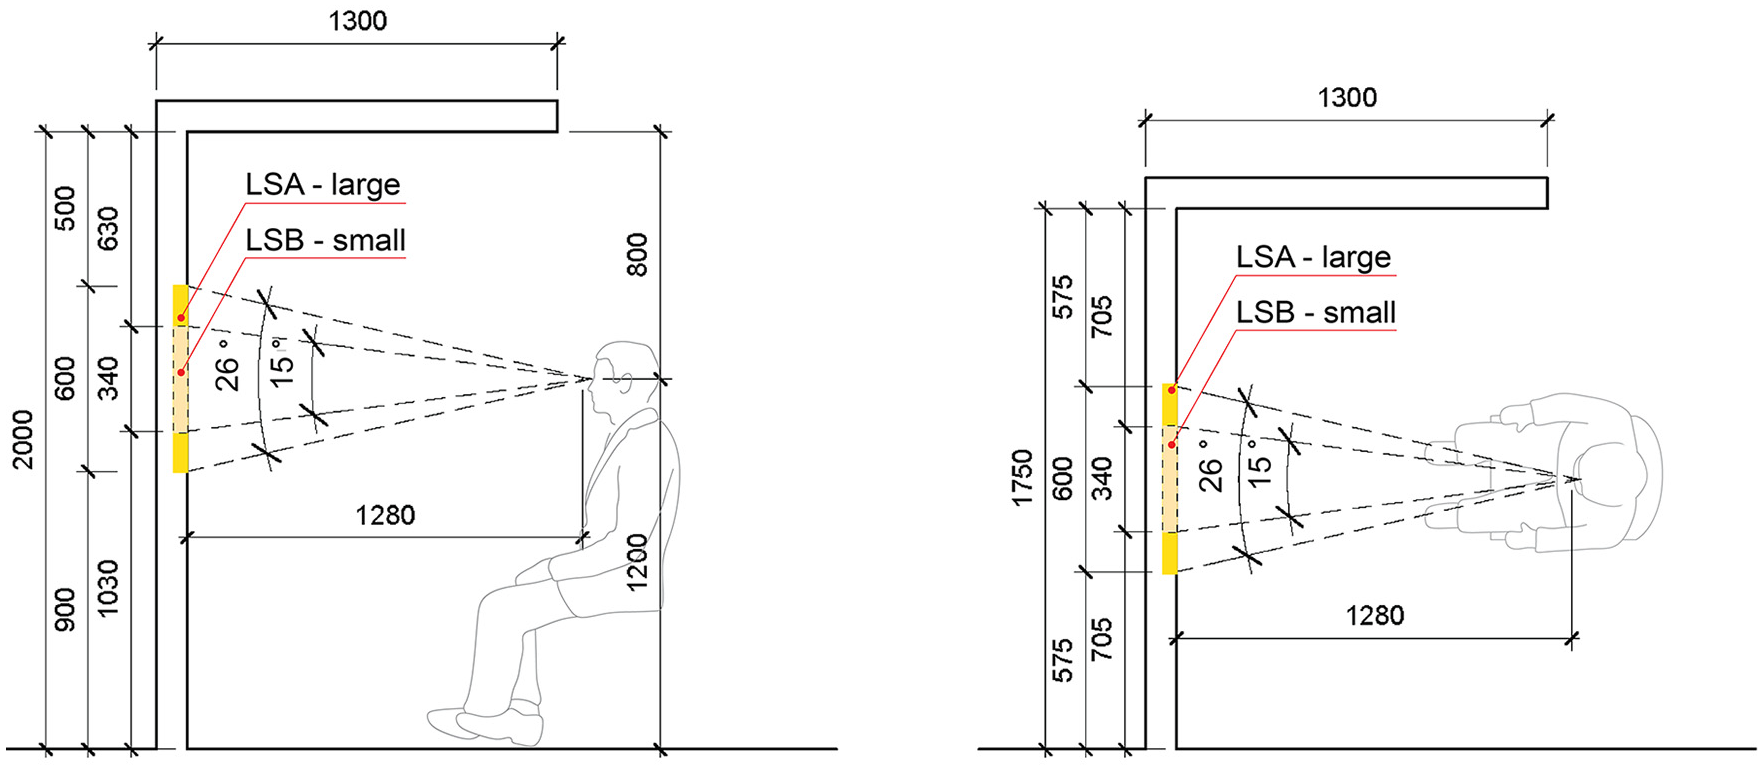
Section (left) and plan (right) sketches showing the position of participants and light sources for the two LSs (LSA and LSB). Dimensions in millimetres
As all the cognitive tasks were auditory to limit the visual stimuli in the experimental set-up, the participants received headphones and hand-held buttons (LICHIFIT Mini Keyboard) for their responses to perform the cognitive tasks on an AuRETim device. 29
Each TB1 to TB3 consisted of:
– 5-min version of the Psychomotor Vigilance Task (PVT) 30 for assessing objective alertness and sustained attention.
– 5-min Go–NoGo task 31 for assessing inhibition capacity and reaction time. In this test, the participants heard two types of sounds – a target sound (similar to the PVT) and a non-target sound.
– 5-min 2-Back digit task 32 to assess short-term working memory performance.
After the sequence of three tasks, there was a 1-min break, followed by a verbally asked question about the level of sleepiness (KSS), and afterwards another short 1-min break. The time of each TB1, 2 and 3 was 18 min.
To establish the baseline measurement for each session, TB1 was performed in dim light conditions. After TB1, the experimental lighting condition was turned on, and the lighting condition within one session was kept the same. The participants were asked to keep their eyes open and fix their gaze on a 4 × 4 cm2 cross-glued at the centre of the luminaire. In the first 10 min of the LS, the participants performed an active-listening task, listening to an audiobook about the solar system. 33 The participants were afterwards asked control questions; however, the answers were neither reported nor considered in the further analysis. It was a way to keep the subjects mentally engaged and activated during the initial light exposure. After the active-listening task, the participants went through TB2 and TB3, resulting in a total of 46-min exposure in the experimental lighting condition. After TB3, participants were asked to return to Area 1 and perform the closing questionnaire on the computer stations (TB4). This questionnaire asked about the level of sleepiness (KSS) for the fifth time in one session. In addition, it probed lighting quality, visual and room comfort (Likert-type 7-point scales), and final comments and observations.
2.5 Dependent variables
The performance tasks were chosen following the frequently occurring tasks in the literature on cognition and NIF effects of light.34–36 The subjective assessments of mood, room comfort and visual comfort were probed in the initial or closing questionnaire, out of which the visual comfort variables are the subject of analysis in this publication.
2.5.1 Performance tests
The measured marker in the auditory PVT was reaction speed (1/mean reaction time in seconds). The markers in the Go–NoGo task were reaction speed (1/mean reaction time in seconds) and percentage of correct responses (pressing the button at target stimuli and ignoring the non-target stimuli). The marker of the auditory 2-back task was the percentage of correct responses.
2.5.2 Subjective assessments
The level of subjective alertness was assessed with the KSS. 26 It is a 9-point scale where number 1 on the scale means ‘extremely alert’, and number 9 equals ‘very sleepy, doing great efforts to stay awake’. The level of visual comfort was assessed with four 7-point Likert-type scales probing the perceived lighting qualities: Glare, Brightness, Pleasantness and Colour temperature acceptance.
2.6 Covariables
The remaining responses to the various questionnaires were used to check for their role as potential covariables affecting the measured outcomes and to check for differences in participant states prior to the sessions.
2.7 Statistical analysis
To test the hypothesis, multivariate and univariate linear mixed model (LMM) analyses were performed to analyse the effects of categorical variables on the numerical response variables of the cognitive tasks and subjective sleepiness (Overview of variables in Tables A1.2 to A1.3 in Supplemental Material). In addition, a set of univariate models was computed to determine the effect of LS on the glare marker of visual comfort. All models included data from all five LSs, thus including the three ‘directionality of light’ from the preceding experiment
3
and the two ‘source size’ conditions from the present study. In this paper, the focus is on the analysis of the latter two, LSA and LSB. The significance of differences between estimated marginal means (EMMs) for categorical variables was calculated using contrast analysis without adjustment except for the KSS variable, where Tukey’s adjustment was applied due to a more compound analysis. For all LMMs, the subject ID was added as a random effect. Cohen’s d was calculated to analyse the effect sizes within TBs between LSs in the multivariate LMM models and the effect size within LS categories in the univariate models examining the effect on response variables. In the analysis using multivariate models, the focus was on observing the effect over time, therefore on the comparison of the effect sizes wherever significant contrasts between the test blocks (TBs), conditioned on light scenes (LSs), occurred. A pairwise comparison between LS with grouped data from all TB was not performed. The effects within the ± 0.2 difference were considered similar when comparing effect sizes. The significance level of all statistical tests was set at a = 0.05. Interpretation of the results of the model effect sizes (d,
2.7.1 Multivariate models for cognitive performance and subjective sleepiness
To estimate the effects of the categorical explanatory variables (LS and TB) on the numerical response variables (PVT reaction speed, Go–NoGo accuracy, Go–NoGo reaction speed, 2-back accuracy and KSS), multivariate LMMs were fitted in the form of a factorial design with Restricted Maximum Likelihood and Boundary Optimiser Based on Quadratic Approximation. 38 The exploratory step of analysing the results of the response variables Go–NoGo accuracy and 2-Back accuracy revealed a singularity effect in the response data of these variables, so it was not possible to fit them in LMMs (too good of a performance of the participants); thus, their analysis is omitted. However, summary statistics of these two variables are included in Section A of the Supplemental Material. The LS explanatory variable had two categories (LSA and LSB) for each of the response variables, whereas the TB categorical explanatory variable had five categories (TB0–TB4) for the KSS response variable and three categories (TB1 to TB3) otherwise. Estimation of the target interaction effect in the model was performed using contrast analysis within TB categories conditioned on LSs.
2.7.2 Univariate models with covariates
The effects of the covariates PSQI score, food factor, CO2 level, humidity level, room temperature, LED light history (time counted in hours spent under LED lighting within the 24 h before the session), indoor daylight light history (time counted in hours, spent under daylight indoors, within the 24 h before the session), time outside light history (time spent outdoors before the session, counted in hours) on the response variables KSS, Go–NoGo reaction speed and PVT reaction speed were analysed using univariate LMMs. The analysis of the influence of covariates on depend revealed a significant impact of the light history, food factor, sleep quality and air quality in the lab on the reaction speed and sleepiness. Nevertheless, the magnitude of impact represented by beta values was smaller in comparison to the impact of the lighting conditions where significance was reached; therefore, it was considered negligible.
2.7.3 Univariate model for the variables of visual comfort
The effect of the categorical explanatory variable LSs on the four numerical response variables of Visual Comfort was analysed using univariate LMMs, where the LS explanatory variable had two categories (LSA and LSB).
2.7.4 Statistical environment
Analyses were conducted using the R Statistical language on Windows 10 pro 64-bit (build 19045).
3. Results
This paper focuses on the impact of the light source size on the dependent variables. The questionnaires in this experiment also assessed momentary mood state, visual and room comfort and lighting quality, of which visual comfort is included in this publication.
The overall explanatory power of each of the multivariate LMMs for the response variables, Go–NoGo reaction speed, PVT reaction speed and KSS, was substantial, with an intraclass correlation coefficient (ICC) of 0.37 or higher (Table C1.1, Supplemental Material). The large difference between the coefficients of determination, together with the high value of the ICC, indicated a significant differentiation in the variation of the dependent variable between subjects, NsubjectID = 39. The results of the contrast analysis can be found in Supplemental Material (Tables B1.1 to B2.26).
3.1 Go–NoGo reaction speed
The EMM range of Go–NoGo reaction speed values for LSA and LSB was [2.74 to 2.91]. The largest Go–NoGo reaction speed values (the fastest reaction times) within each LS were for TB1. Reaction speed decreased over time between TB1 and TB2 for both LSs, and between TB2 and TB3 for LSB. For LSA, the reaction speed remained almost identical between TB2 and TB3 with a marginal <0.01 difference (Table 2). A significant difference in Go–NoGo reaction speed was found between the TB1 and TB3 EMMs under LSB.
Contrast analysis of the Go–NoGo reaction speed model
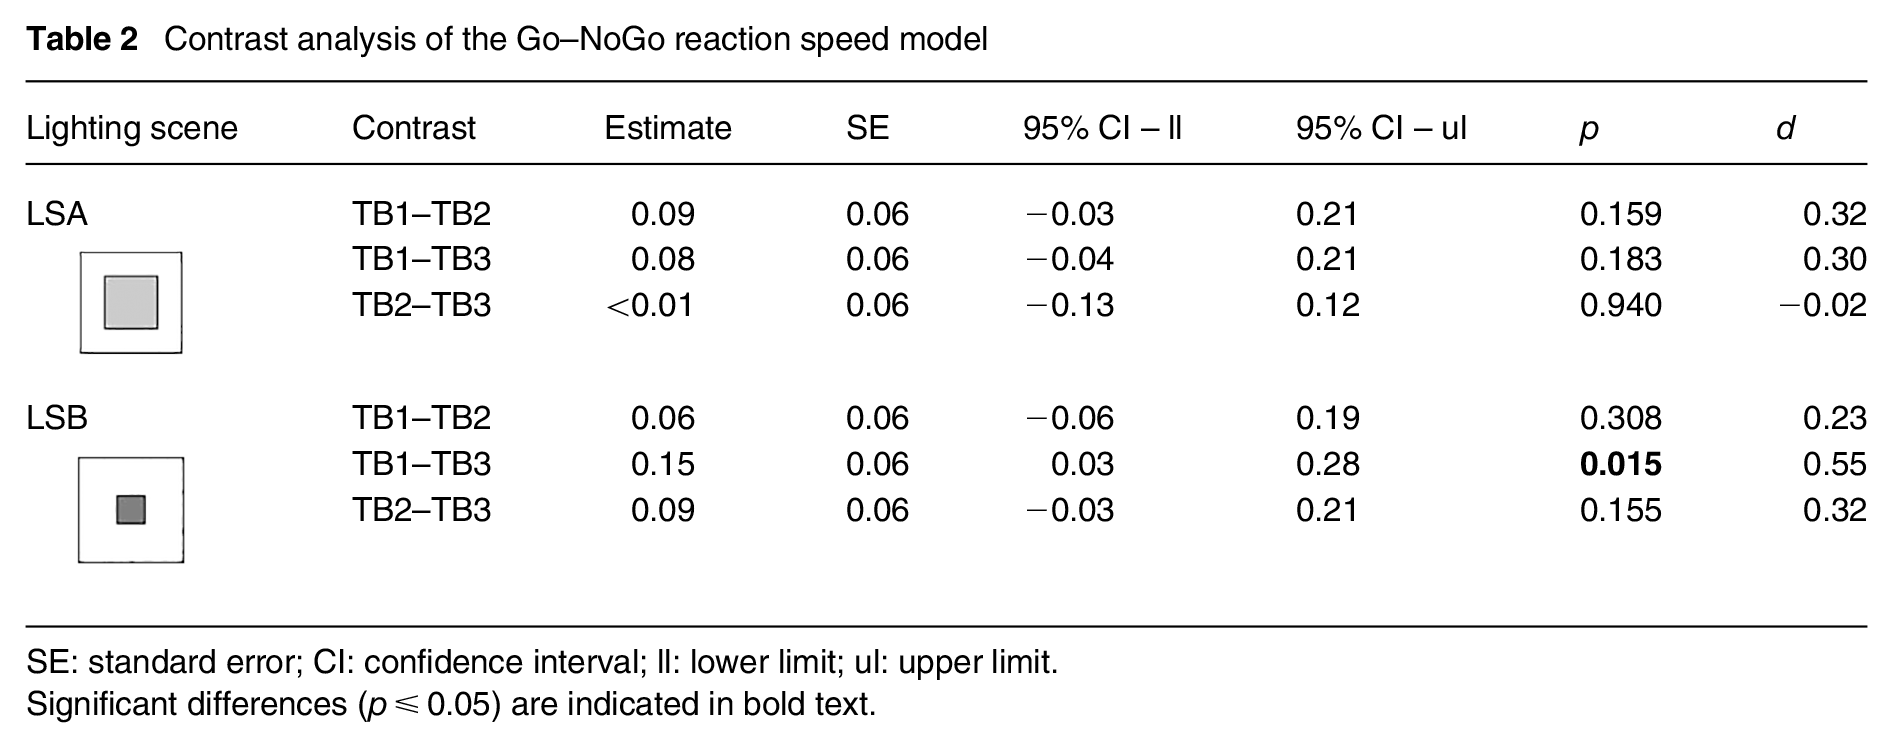
SE: standard error; CI: confidence interval; ll: lower limit; ul: upper limit.
Significant differences (p ≤ 0.05) are indicated in bold text.
3.2 PVT reaction speed
The EMM range of PVT reaction speed values was [3.64 to 4.20] The largest PVT reaction speed values (i.e. fastest reaction times) within each LS were for the first TB level in both LSs. Reaction speed values decreased over time, with the lowest EMM values for the last level of TB (Table 3). Under both LSs, there were significant differences in PVT reaction speed within the TB category in every contrast, with the reaction speed slowing over time. The differences in effect sizes between the LS in the corresponding contrasts were less than 0.2; thus, the effect sizes are considered similar in both the LSs.
Contrast analysis of the PVT reaction speed model
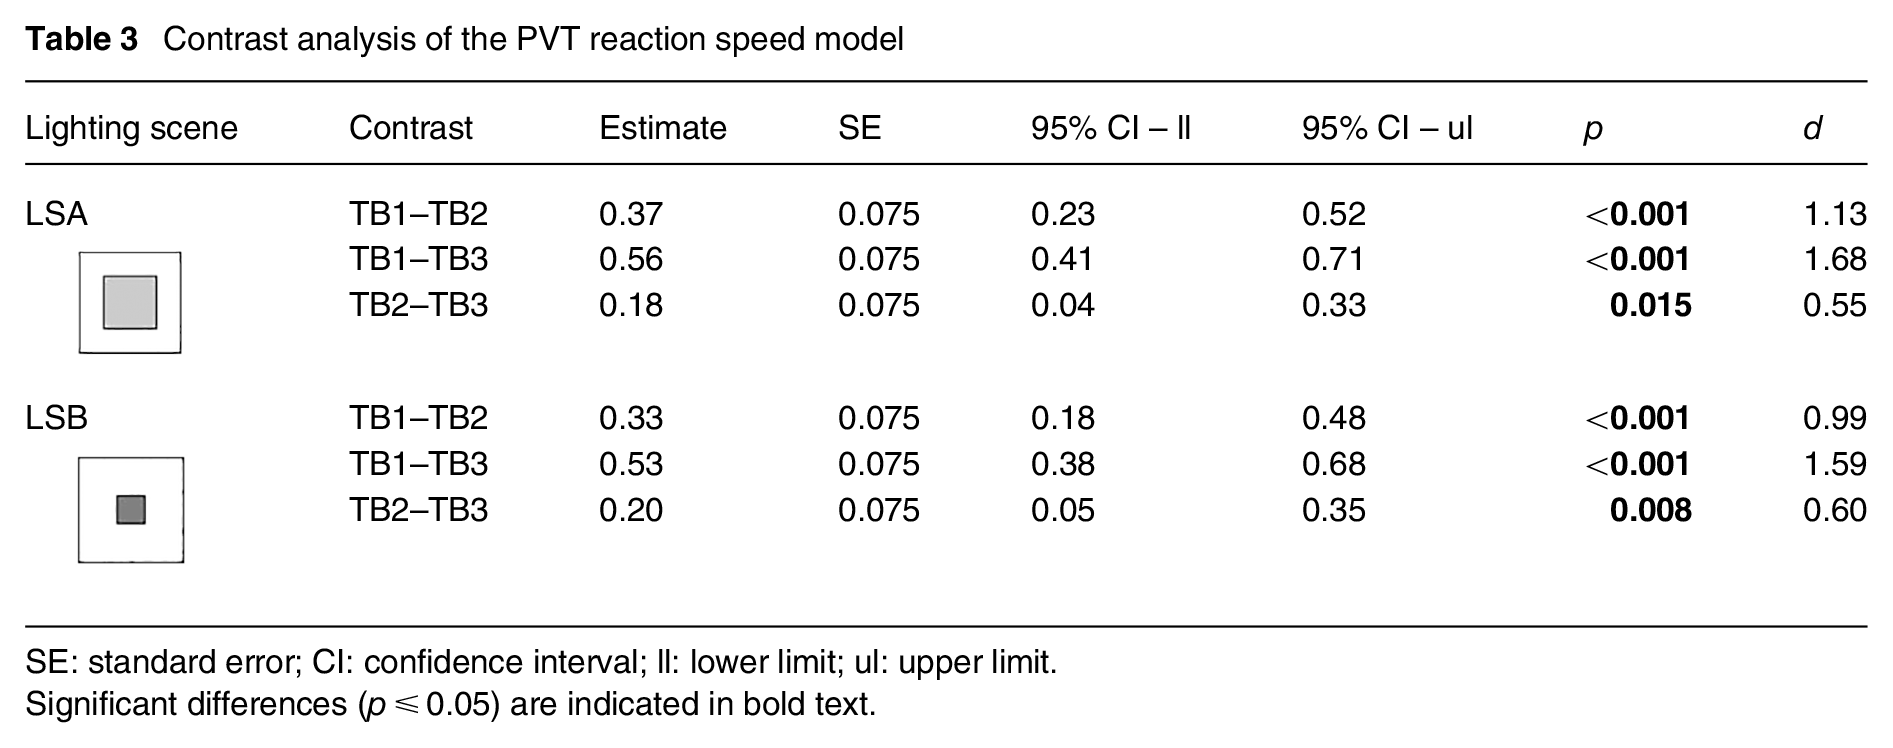
SE: standard error; CI: confidence interval; ll: lower limit; ul: upper limit.
Significant differences (p ≤ 0.05) are indicated in bold text.
3.3 Karolinska Sleepiness Scale
The EMM range of KSS values in LSA and LBS was [3.41 to 5.08] The smallest KSS values for both LSs were noted for TB0 category. The KSS values increased over time, with the highest EMM values for the TB4 for each LS. The results of the contrast analysis show the significance of the differences in KSS scores within TB categories under both LSA and LSB. The data in Table 4 show that there were significant differences in KSS between TB0 and TB4 in both LSs, with the larger effect found in LSA (d = −1.19). In addition, significant differences in EMMs were found between TB1 and TB4 only in LSA (LS4), which is the main interest of the analysis, as TB1 was the last measurement under dim light conditions before the light intervention. In LSB, this contrast was not significant, showing that under this lighting condition, the participants were kept at the same level of subjective sleepiness.
Contrast analysis of the KSS model
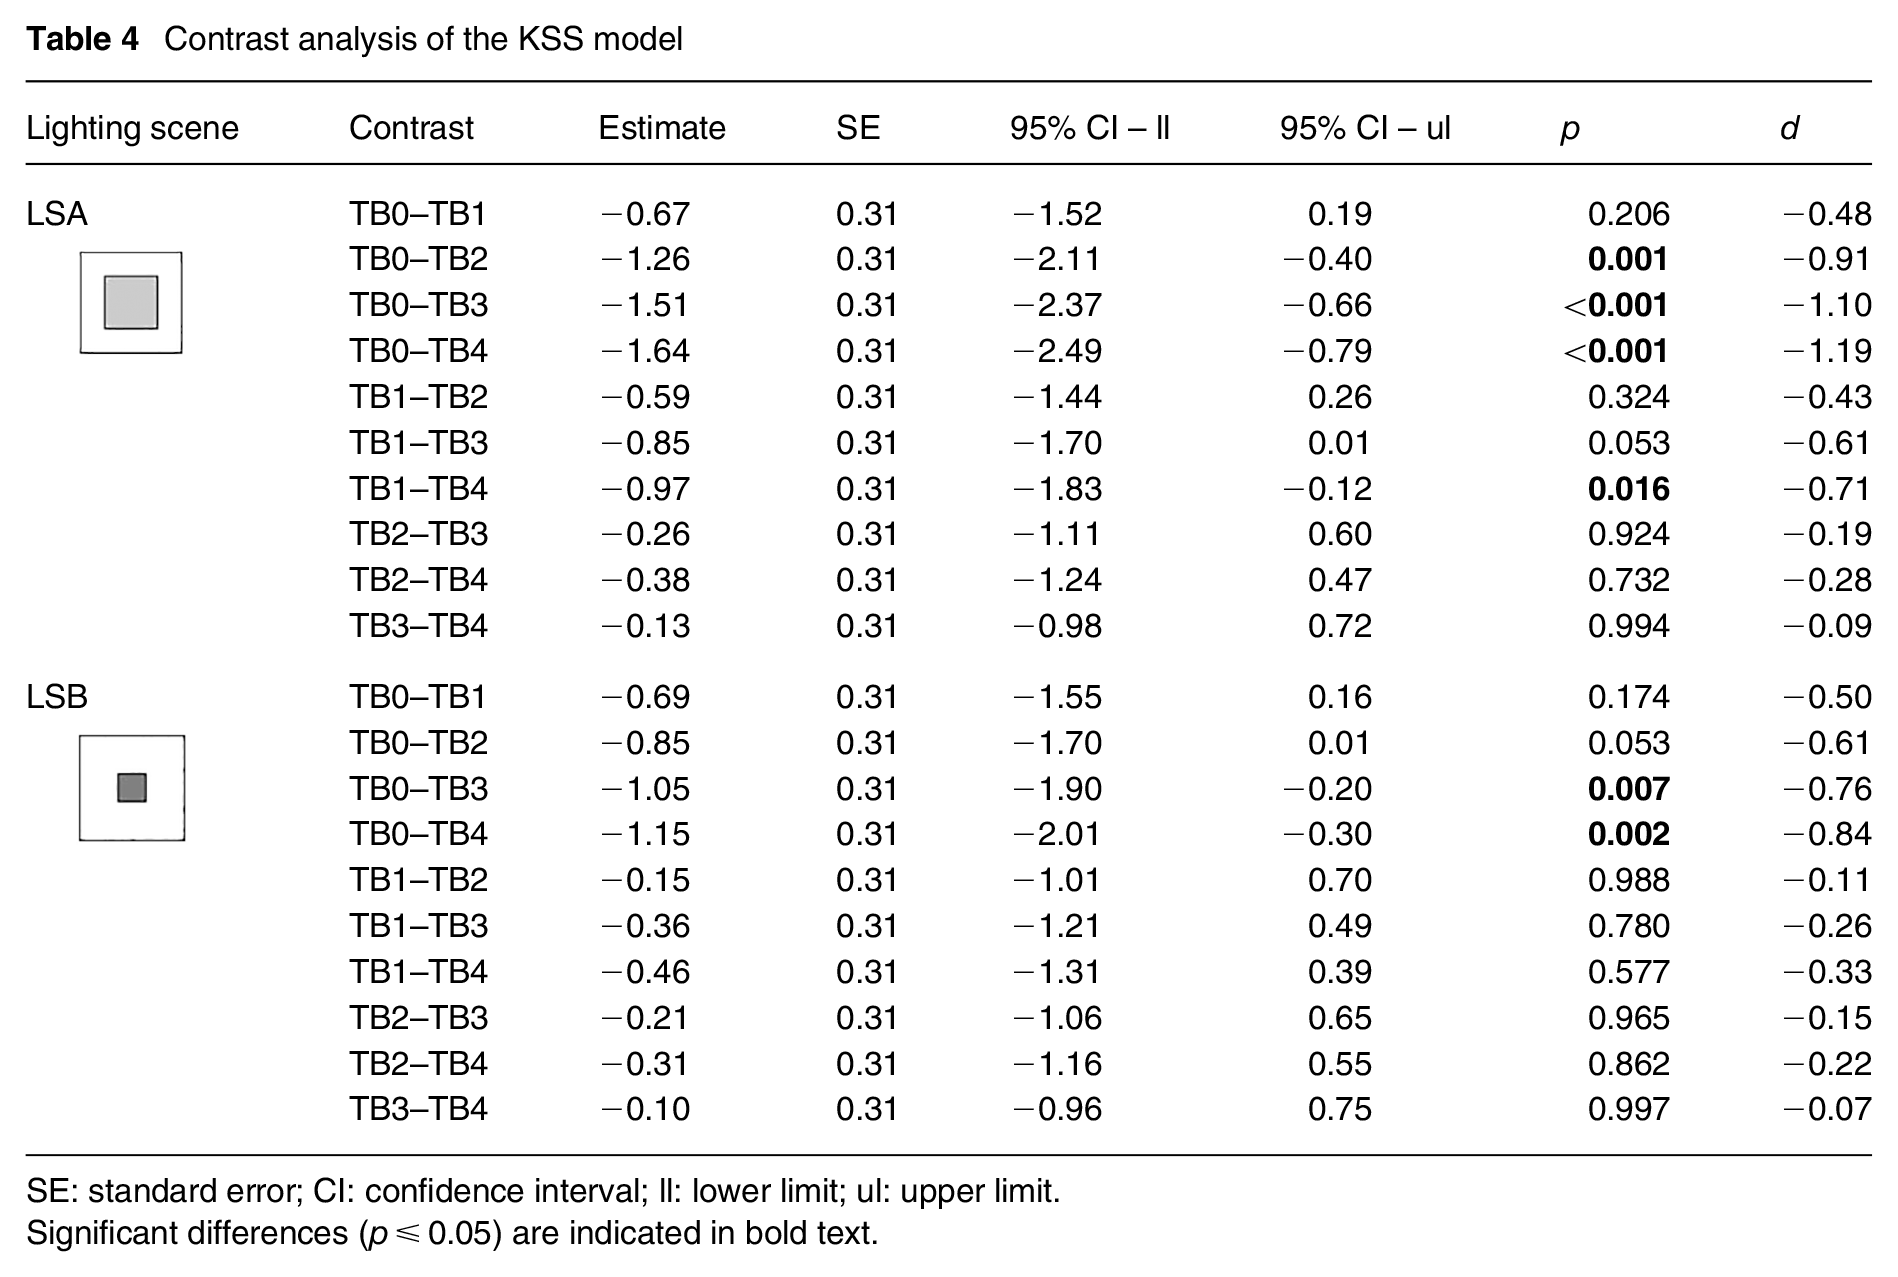
SE: standard error; CI: confidence interval; ll: lower limit; ul: upper limit.
Significant differences (p ≤ 0.05) are indicated in bold text.
3.4 Visual comfort
The EMM values for the scores in Visual Comfort markers were the following: 3.26 for LSA and 3.03 for LSB in Pleasantness, 5.49 for LSA and 5.82 for LSB in Brightness, 5.21 for LSA and 5.49 for LSB in Glare and 2.95 for LSA and 3.15 for LSB in the Colour temperature acceptance. The contrast analysis has shown no significant differences between the LSs (Table 5).
Contrast analysis of the Visual Comfort models
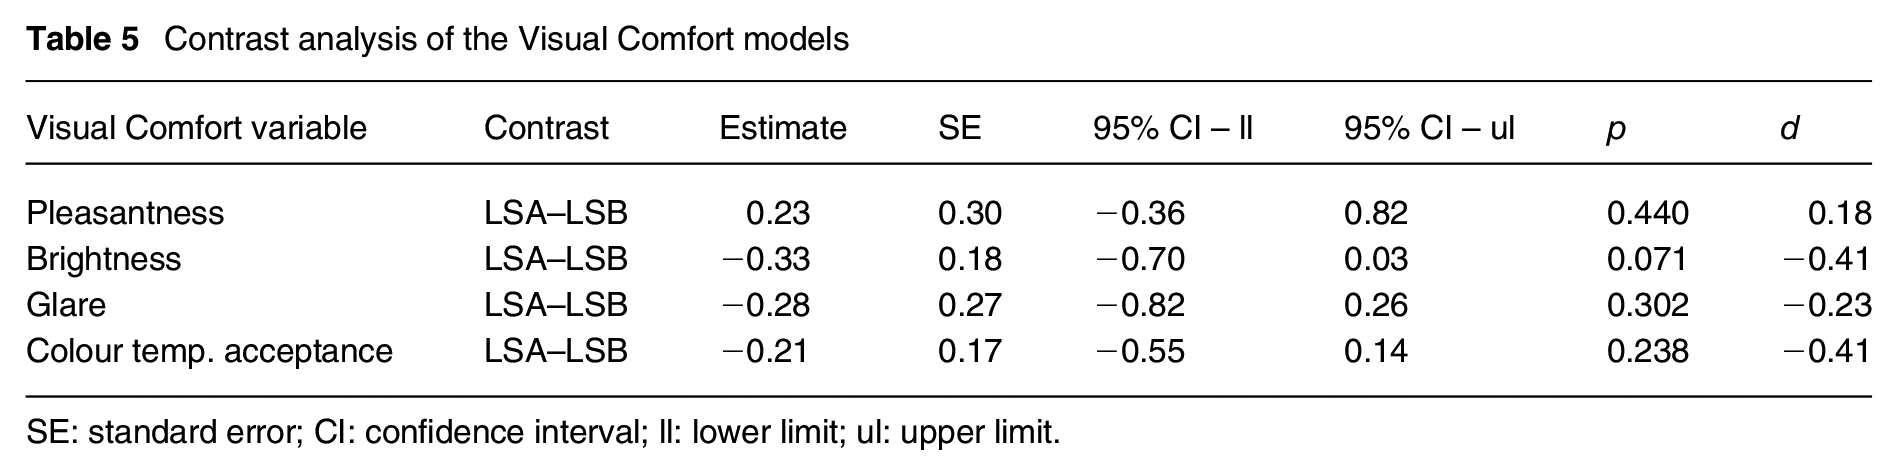
SE: standard error; CI: confidence interval; ll: lower limit; ul: upper limit.
4. Discussion
This investigation focused on comparing the effect of changing the solid angle of a luminous source on subjective alertness and cognitive performance, while keeping the light dose constant between the conditions. The hypothesis was that a smaller solid angle of higher luminance would impair visual comfort, which would consequently have an effect reflected in the magnitude of both NIF responses, despite the equal ipRGC stimulation.
Concerning visual comfort, the results have shown no significant differences in the four analysed variables – glare, brightness, pleasantness and colour temperature acceptance. That was unexpected, considering a 3-point difference in the objective quantification of glare in the form of UGR, and more than a two-fold difference in source luminance between the settings while keeping the background luminance similar. One explanation could be that in both settings the calculated UGR was already in the range categorised as ‘intolerable glare’, according to the standard, 1 and thus the settings were not contrasted enough in terms of categories. A larger sample group, a larger difference in the UGR between the settings, or a more refined scale for scoring could have shown a more defined difference.
Concerning the effect on subjective alertness, the results have shown a significant increase in sleepiness under the condition with the larger light source of lower luminance (LSA), but not under the condition with the smaller light source of higher luminance (LSB). The difference was observed despite the similar realised light dose at the eye of the participants. As such, the results presented here provide contradicting evidence to the findings from the previously mentioned study from the automotive context, in which manipulation of the solid angle did not affect subjective sleepiness. Nevertheless, it is important to bear in mind the differences in the study designs, the most important being the location of the light source in the field of view (upper part, as opposed to frontal used here) and the nocturnal exposure timing, contrary to this experiment where it was in the early afternoon, which is characterised by naturally different base levels of alertness. 39 Here, the question arises as to what duration such an effect prevails. The exposure under the experimental lighting was limited to 46 min, during which a less comfortable setting kept the participants more awake; however, in a longer sitting, a fatigue factor might come into play and result in an increase in sleepiness. It is a topic for further exploration. Considering the stronger visual discomfort in this setting, future research could investigate if this can induce an activating effect over the course of a short experiment.
Regarding the reaction speed analysis for the Go–NoGo task, the participants scored significantly slower over time under the LSB condition with the higher luminance-smaller solid angle setting. An interpretation of these results could be that although the participants felt more awake in this condition and did not subjectively perceive a difference in visual comfort, the higher objectively evaluated glare still had an effect. It goes along with literature suggesting a deteriorating impact of glare on task performance, even in the case of auditory tasks.12,13 Another explanation could bypass the effect of light and link to the nature of the task itself, which requires both quick reaction and more complex information coding compared to the simple reaction-time task (PVT). A combination of such functions could be negatively affected by an excessively increased state of alertness, as the literature40–43 points out that certain tasks can benefit from a heightened state of alertness while others do not, in both visual and auditory task types. One could say that current results concur with the findings on performance-detrimental effect on auditory tasks42,43; however, it is important to underline that in the present investigation the heightened alertness was triggered by light-specific stimuli, while in the other mentioned studies, this was not a factor. From the perspective of other literature on the effect of light on cognitive performance, there are visible discrepancies in the results of experiments that utilised the auditory Go–NoGo task, making it difficult to form a definitive conclusion on the relationship between light and performance in this task.44–46
It was not possible to fully explore the results of the cognitive tasks due to the singularity effect in the data on the response accuracy in the Go–NoGo and 2-Back tasks. While it was possible to analyse the reaction time, the participants scored too well in the accuracy marker of these tasks, creating a ceiling effect. It was one of the limitations which this study shares with our first investigation, 3 as it followed the same protocol and methodology, with the same participant group.
In summary, the results of this experiment show that while providing a similar ipRGC-stimulating light dose at the eye, a changing solid angle and luminance of the light source can moderate the subjective alertness and the reaction time in Go–NoGo, an inhibition-capacity-based cognitive task. A smaller light source of higher luminance can lead to decreased feeling of sleepiness and declined cognitive performance. Contrary to the expectations, perceived visual comfort was not significantly different between the conditions despite the difference in objectively quantified glare rating. Thus, a direct link between glare and cognitive performance and subjective alertness was not confirmed, indicating that further research is required. Nonetheless, the presented findings provide further insights into the relevancy of spatial distribution of light in the field of view on moderating visual and NIF responses to light.
Supplemental Material
sj-doc-1-lrt-10.1177_14771535251335976 – Supplemental material for A controlled lab experiment on the effect of light exposure of different source sizes on subjective alertness and cognitive performance during the post-lunch dip
Supplemental material, sj-doc-1-lrt-10.1177_14771535251335976 for A controlled lab experiment on the effect of light exposure of different source sizes on subjective alertness and cognitive performance during the post-lunch dip by N Derengowski, M Knoop and S Völker in Lighting Research & Technology
Footnotes
Acknowledgements
The design of this study was registered to OSF.io on 7 November 2022. Different stages of this study were presented during Licht’23 and SLTBR 2023 conferences and can be found in their proceedings. Special thanks to Kai Broszio and Moritz Christian Dölle for all the help with the project.
Declaration of conflicting interests
The authors declared no potential conflicts of interest with respect to the research, authorship, and/or publication of this article.
Funding
The authors disclosed receipt of the following financial support for the research, authorship, and/or publication of this article: This research was performed within the European Training Network LIGHTCAP (project number 860613) supported by the Marie Sklodowska-Curie actions framework H2020-MSCA-ITN-2019.
Supplemental material
Supplemental material for this article is available online.
References
Supplementary Material
Please find the following supplemental material available below.
For Open Access articles published under a Creative Commons License, all supplemental material carries the same license as the article it is associated with.
For non-Open Access articles published, all supplemental material carries a non-exclusive license, and permission requests for re-use of supplemental material or any part of supplemental material shall be sent directly to the copyright owner as specified in the copyright notice associated with the article.