
Abstract
Commercially available presence sensing technologies for smart home lighting are often driven by energy efficiency. However, they struggle to accommodate user’s dynamic behaviours, especially in small houses where multiple activities overlap within compact layouts. Small houses, with mixed-function spaces require sensors that can accurately detect short-range or overlapping activity zones, calling for more user-centric presence sensing that is responsive to user’s behavioural needs and energy efficient. An exploratory study was conducted in a test facility simulating a small house, investigating optimal sensor placement to improve presence detection and minimise unnecessary lighting in unoccupied zones. It examined the performance of 2 conventional and 12 short-range radar sensors, positioned at varying heights and angles. Radar’s potential as a non-wearable sensing solution for health monitoring was also explored. Seventy participants performed three tasks, representing active, sedentary and passive behaviours, under controlled home lighting conditions. Results reinforced that optimal sensor placement in a small house enhanced user presence detection and minimised false triggers. Compared to the conventional sensors, radar-based micro-location sensing presented prospects for accommodating dynamic user behaviours and overlapping activity zones in small houses. It enabled localised lighting based on fine-grain user activity recognition from the respiratory signal, thereby reducing unnecessary lighting energy usage. Notably, it synchronised lighting with user’s ‘sleep-state’ activity and offered a non-wearable solution to monitor user’s health via vital sign detection. These findings lay the foundation for developing adaptive and responsive user-centric home lighting systems for small houses and assistive living environments.
1. Introduction
Smart home lighting is increasingly expected to support not only energy efficiency but also user convenience, comfort, 1 preferences and behavioural needs. 2 Commercially available presence sensing technologies often struggle to accommodate dynamic behaviours, resulting in unnecessary energy use or diminished user satisfaction, especially in small houses where multiple activities may overlap within compact layouts. 2 These calls for alternative presence sensing for small houses that are more user-centric, responsive to user’s behavioural needs and energy efficient.
Small houses have become increasingly common due to urbanisation, land scarcity, rising land costs and changing lifestyles. Small houses refer to small-sized dwellings (around 14 m2 to 65 m2), 2 often house one to two members, 3 as single-family 4 and combine multiple functions within compact layouts. Intuitively, small houses would use less energy due to their size; however, data from Sweden contradicts this assumption. In 2023, small houses had the highest household electricity consumption 5 and were the second-largest consumers of electricity nationwide, reaching approximately 24.5 terawatt-hours (TWh). 6 At the end of 2024, Sweden’s most prevalent housing type was the ‘one- or two-dwelling’ category, followed by ‘multi-dwelling’ buildings with average floor areas ranging from 35 m2 to 48 m2 and predominantly occupied by one- to two-member households.3,7,8 These sizes of small houses are comparable to small houses in other EU countries (31 m2 to 65 m2) and slightly larger than those in high-density Asian cities such as Hong Kong, Japan and Singapore (14 m2 to 31 m2).9,10 It has been expected that household electricity consumption will increase further with the prevalence of hybrid work models and extended home occupancy post-pandemic.11,12
Lighting plays a crucial role in household electricity consumption. In 2014, residential lighting accounted for circa 34% of global electricity consumption, decreasing to 27% in 2022, with projections estimating a further decline to 24% by 2030. 13 According to Eurostat data from selected EU countries, lighting and electrical appliances together accounted for approximately 14.51% of distributed household energy consumption in 2023, ranking third after space heating (62.51%) and water heating (15.05%). 14 The Eurostat data specifically for Sweden revealed that household electricity consumption by lighting and electrical appliances (21.64%) came second after space heating (57.74%). 14 While the grouped data limits the isolation of lighting alone, several studies reported that lighting accounts for approximately 15% to 30% of household electricity use.15–17 These data reinforce lighting as a distinct and substantial contributor to household electricity consumption, underscoring the need for user-centric and more efficient, adaptive lighting systems.
Advancements in adaptive lighting (also known as smart lighting) technologies have enabled significant energy savings and improved user comfort. 1 Paradoxically, growing lifestyle economies, higher user demands for quality lighting and rebound effects as a result of affordable and more versatile adaptive lighting technologies have led to greater overall consumption.13,18 For example, Swedish households have the highest number of lamps per home in Europe, nearly double those in the United Kingdom or Denmark. 19 Approximately two-thirds of Swedish homes sparsely turn off their lights, deliberately leaving them on in unoccupied rooms to support their psychological well-being, safety and social needs, such as brightening the interior, creating a welcoming and comfortable ambience upon entry when there is a lack of natural daylight and mimicking that someone is always at home.15,20
Such socio-cultural lighting preferences reveal that more light is used, often less consciously, highlighting the tension between user’s behavioural needs, preferences and energy conservation, as exemplified by Swedish households. Studies indicated careless behaviour can increase energy consumption by up to one-third, whereas conservation-conscious behaviour would save a third.21,22 Balancing sustainability with socio-cultural lighting norms has driven research into user-centric lighting solutions. Experts emphasised the need for lighting control systems to be more user-centric, evolving beyond simplistic rules such as ‘IF presence THEN keep lights on’. 23 A user-centric lighting control system adapts dynamically to user behaviour and preferences through zoned (localised) lighting and incorporates user-responsive approaches, enhancing both user satisfaction and energy efficiency.18,24
However, automating user-centric lighting control in residential settings, especially in small houses, presents significant challenges. Small houses often have mixed-function spaces requiring sensors that can accurately detect short-range or overlapping activity zones. The dynamicity or randomness of user activities and behaviours adds difficulty in predicting occupancy patterns from typical to edge-case scenarios.2,25–27 Furthermore, there is an increasing demand for lighting controls that support user’s health and well-being (visual and beyond-visual needs) by adapting to, for example, circadian rhythms. People are typically at home during dawn and dusk, periods when lighting has the most pronounced effects on human circadian function for healthy sleep hygiene and well-being. 28 A pilot study in Swedish homes found that pre-programmed dawn/dusk lighting interventions positively influenced adults’ wake- and bedtimes, promoting more consistent sleep schedules. 29
For user-centric home lighting control to be responsive to user’s behavioural needs, preferences and support energy efficiency, adaptive and reliable presence sensing solutions are required. The developed solution must function accurately in diverse conditions, adapting to both typical and edge-case scenarios while minimising false triggers and catering to mixed-function, small house implementations. Transitioning from coarse, room-level presence detection to fine-grained micro-location sensing is key to optimising lighting control. 30 The goal is to provide the appropriate lighting dose precisely when and where it is needed, based on user activities and circadian requirements. Current presence sensing technologies are predominantly binary, detecting only user presence or absence without recognising specific activities. The effectiveness of presence sensors depends on sensor type, placement and coverage range (field of vision) – factors influencing their reliability in user-centric lighting applications.2,31 Radar sensors have emerged as potential solutions, capable of detecting user’s vital signs such as respiration and heart rate, offering a non-wearable, non-intrusive, privacy-preserving alternative for micro-location sensing and health monitoring.2,32 However, the placement of these sensors is critical; inappropriate positioning can lead to frequent false triggers, frustrating users and undermining energy-saving efforts. Optimal sensor placement requires careful consideration of spatial layouts, furniture arrangements and user movement pathways to enhance detection accuracy.
Therefore, this paper has two aims: firstly, to examine the optimal placement of short-range presence sensors to minimise false triggers and unnecessary wastage in lighting up unoccupied zones in a mixed-function, small house. Secondly, to critically assess radar’s detection capabilities, limitations and potential for recognising activity and quantifying the user’s respiration as a non-wearable recommendation for user-centric lighting control. The energy efficiency of the presence sensing solutions will be reported in a separate publication. The findings contribute to the advancement of adaptive and reliable presence sensing solutions for user-centric home lighting that balance user’s well-being with energy efficiency.
2. Method
An exploratory study, hereafter referred to as the Daylight and Occupancy Sensing Environments (DOSE) project, was conducted in August 2023. An existing laboratory was transformed into a test facility mimicking a small house (open-plan layout), comprising a Study, Kitchen and Bedroom as test zones, and Dining and Living as non-test zones. The optimal placements and detection capabilities of conventional and radar sensors were explored as a pilot experiment in a controlled laboratory environment that mimicked a full-scale, small house (Figure 1(a)). Different sensor positions by horizontal distance, vertical distance and angle (Figure 1(b) and (c)) were tested to gain insights into each position’s accuracy in detecting the user’s presence under home lighting conditions as they performed three specific tasks. The 35-min experiment procedure per participant involved tasks like ‘watching emotional video clips’ in the Study zone, ‘arranging groceries from a bag into cupboards’ in the Kitchen zone and ‘resting on the bed while listening to acoustical music’ in the Bedroom zone (Figure 2). The indoor environmental conditions were controlled, and all participants had similar home lighting exposure from the non-test lamps (Figure 1(a)). The average indoor conditions measured every 10 min for temperature ranged from 21.4°C to 22.8°C (Mean ± SD = 22.0 ± 0.3°C); horizontal illuminance at task level ranged from 60.9 lx to 173.4 lx (100.7 ± 21.0 lx), and relative humidity ranged from 44.8% to 62.1% (54.9 ± 3.9%). Temperature and horizontal illuminance were monitored using a Hobo Pendant MX2202 (Onset Computer Corporation, MA, USA) sensor, while relative humidity was recorded with a YoYo YL-M62 (Grant Instruments (Cambridge) Ltd, UK) sensor. All presence sensors and their paired test lamps were screened off from the participants’ direct view to minimise any uncomfortable feelings, consciousness and perceptions (psychologically overwhelmed/cautious) of being observed in the laboratory.
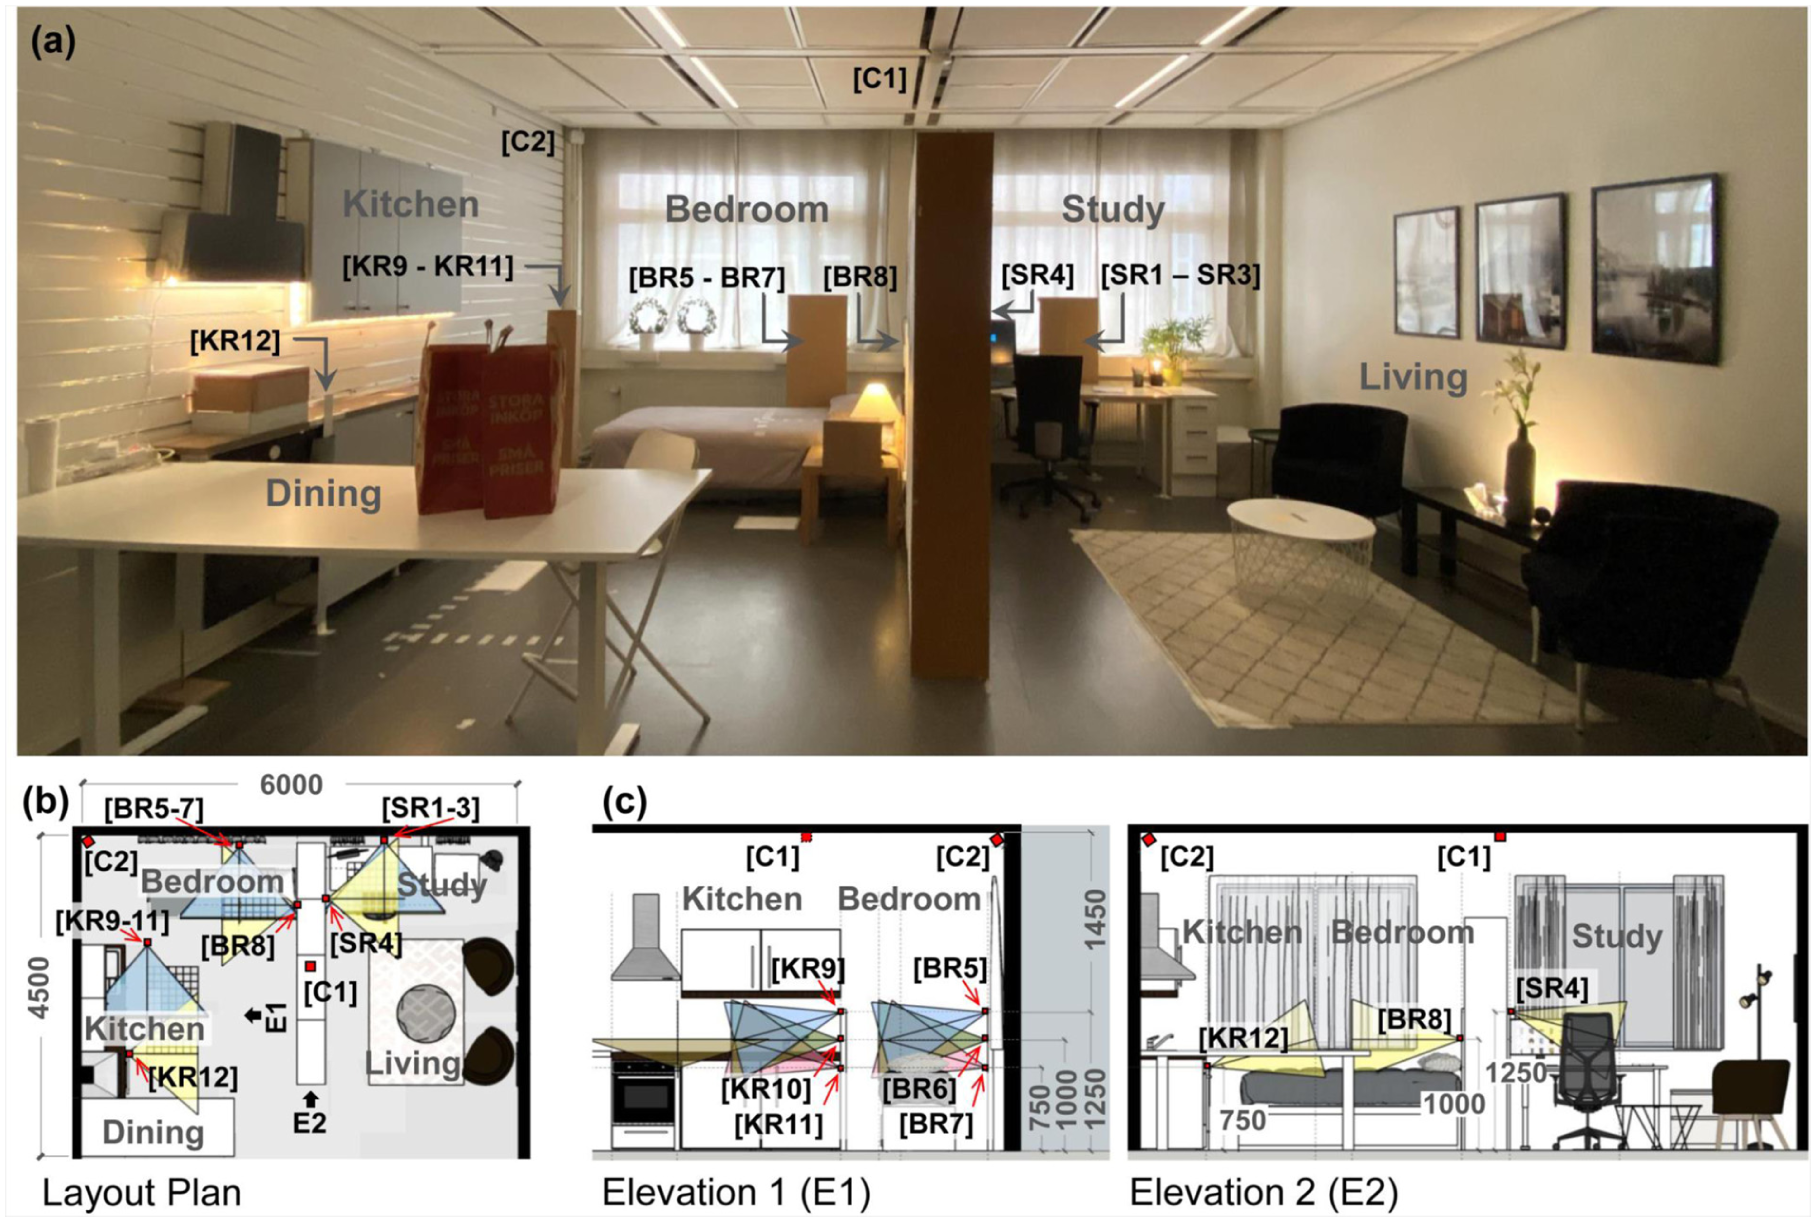
(a) The test facility mimicking a small house comprising sensors in the Study, Kitchen and Bedroom. All participants were exposed to this same home lighting ambience, lit by the visible non-test lamps throughout the procedure. All sensors and their paired LED test lamps were screened off from the participants’ direct view (boxed up) to minimise any uncomfortable feelings, consciousness and perceptions (psychologically overwhelmed/cautious) of being observed in the laboratory. Conventional and radar sensor placements in varying positions as indicated by square parentheses in (b) layout plan and (c) elevation. Refer to the online version for colour figures
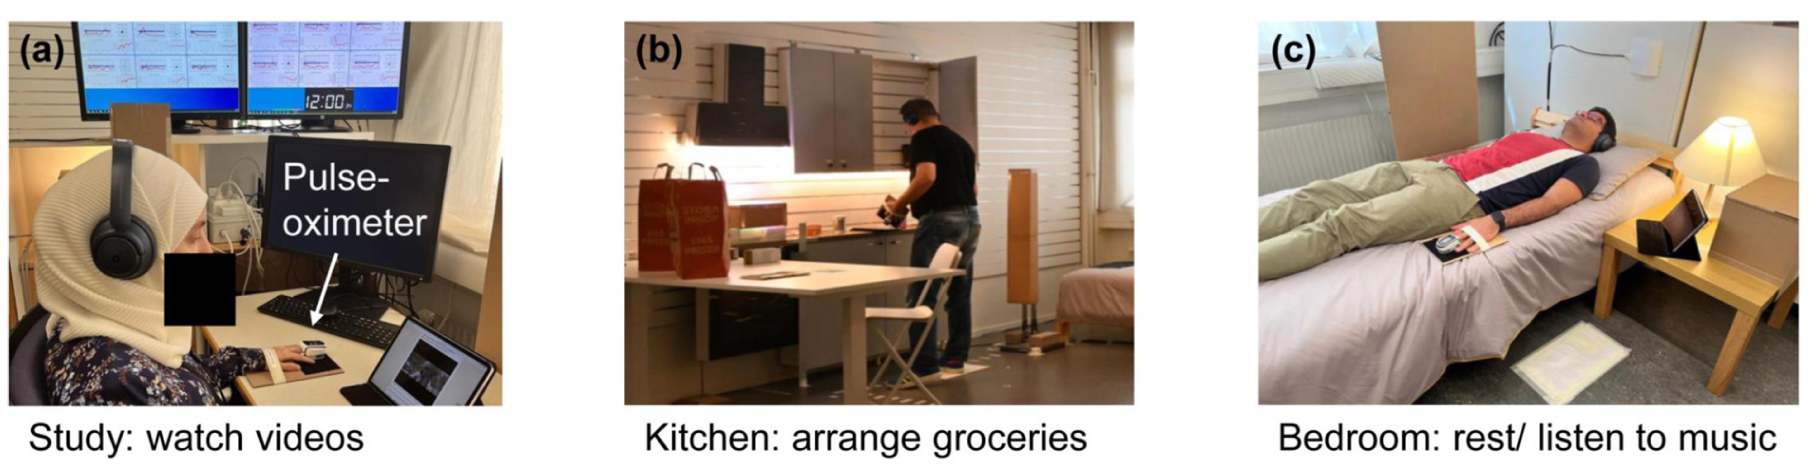
The task in each test zone: (a) Study: watching emotional videos while sitting, a sedentary activity; (b) Kitchen: arranging groceries while standing, an active activity and (c) Bedroom: listening to music while lying down, a passive activity
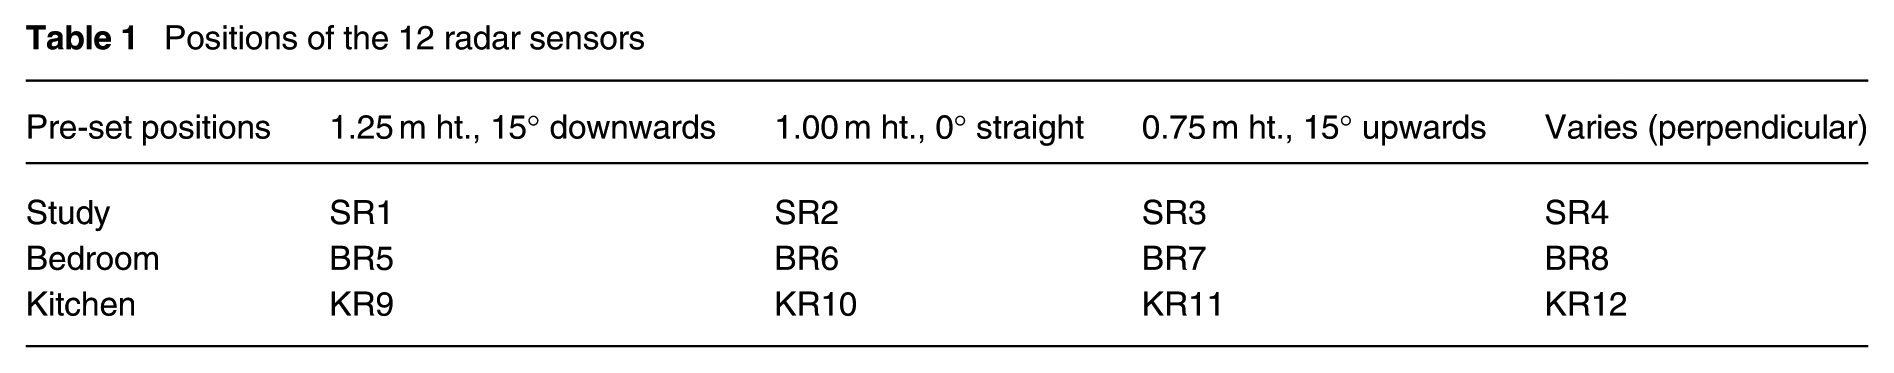
DOSE employed two identical high-frequency conventional sensors (Steinel True Presence COM1 AP, Karl H. Ström, Steinel GmbH, Herzebrock-Clarholz) and 12 identical radar sensors (60 GHz pulsed coherent radar XM112, XB112, Acconeer AB, Lund, Sweden), all hard-wired to switch on/off their paired LED lamps as the participant entered/exited the test zones. The conventional sensors (C1 and C2) recognised user’s presence based on their high-frequency breathing detection feature and were limited to binary on/off output. Sensor C1, configured as wide-range, was centrally positioned (ceiling-mounted at 2.7 m) to cover the entire small house. Sensor C2 had a more localised position (ceiling-mounted at a corner), covering only the Kitchen and Bedroom zones. The 12 radar sensors were configured as short-range sensors to detect the user’s presence (distance up to 1 m) and breathing within each test zone. They were positioned at varied pre-set heights (ht.) and angles (°), as tabulated in Table 1. Each zone had a vertically stacked group of three radar sensors, supplemented by a fourth radar sensor positioned perpendicularly to the stack (at varied positions). All sensors were oriented to monitor the participant’s thoracic region (Figure 1(c)).
Positions of the 12 radar sensors
Each presence sensor was paired with a Philips HUE smart LED lamp (4 W to 6.5 W, Signify, Eindhoven, The Netherlands) and with a MetaMotionR (MMR, Mbientlab, Inc, CA, USA) sensor affixed to each lamp to measure its illuminance level. User presence within the Study, Kitchen and Bedroom zones was inferred indirectly through the status of LED lamps over time. An increase in illuminance indicated that the LED lamp was switched on (presence detected), while a constant reading of 0 lx indicated absence. The status of each LED lamp was precisely measured at a very high sample rate (s) and analysed at every 1-min interval (Figure 3). The user’s presence (detected or not) and LED lamp (on or off) were binary coded (1 or 0) for every minute throughout the tasks in each zone. Table 2 presents the binary categories used to interpret the presence detection results. DOSE observed random occurrences of the LED lamp flickering on/off captured by the MMR’s very high sample rate. Such situations were treated as True Positive with random errors, TPe (1, 1flicker). User presence was detected, and the lamp switched on, but there were sudden signal drops ranging from 1 s to 25 s, delayed signals (13 s to 42 s) or signals cut-short (11 s to 38 s) within 1 min. These random errors suggest that, at times, lags in signal transmission between the presence sensor and LED lamp exist, yet the interruption quickly resumed to True Positive, TP (1, 1) within a minute. TPe was not an effect of the timeout. Situations where the MMR randomly prompted errors and failed to transfer its high sample rate data (status of LED lamp) were treated as data loss.
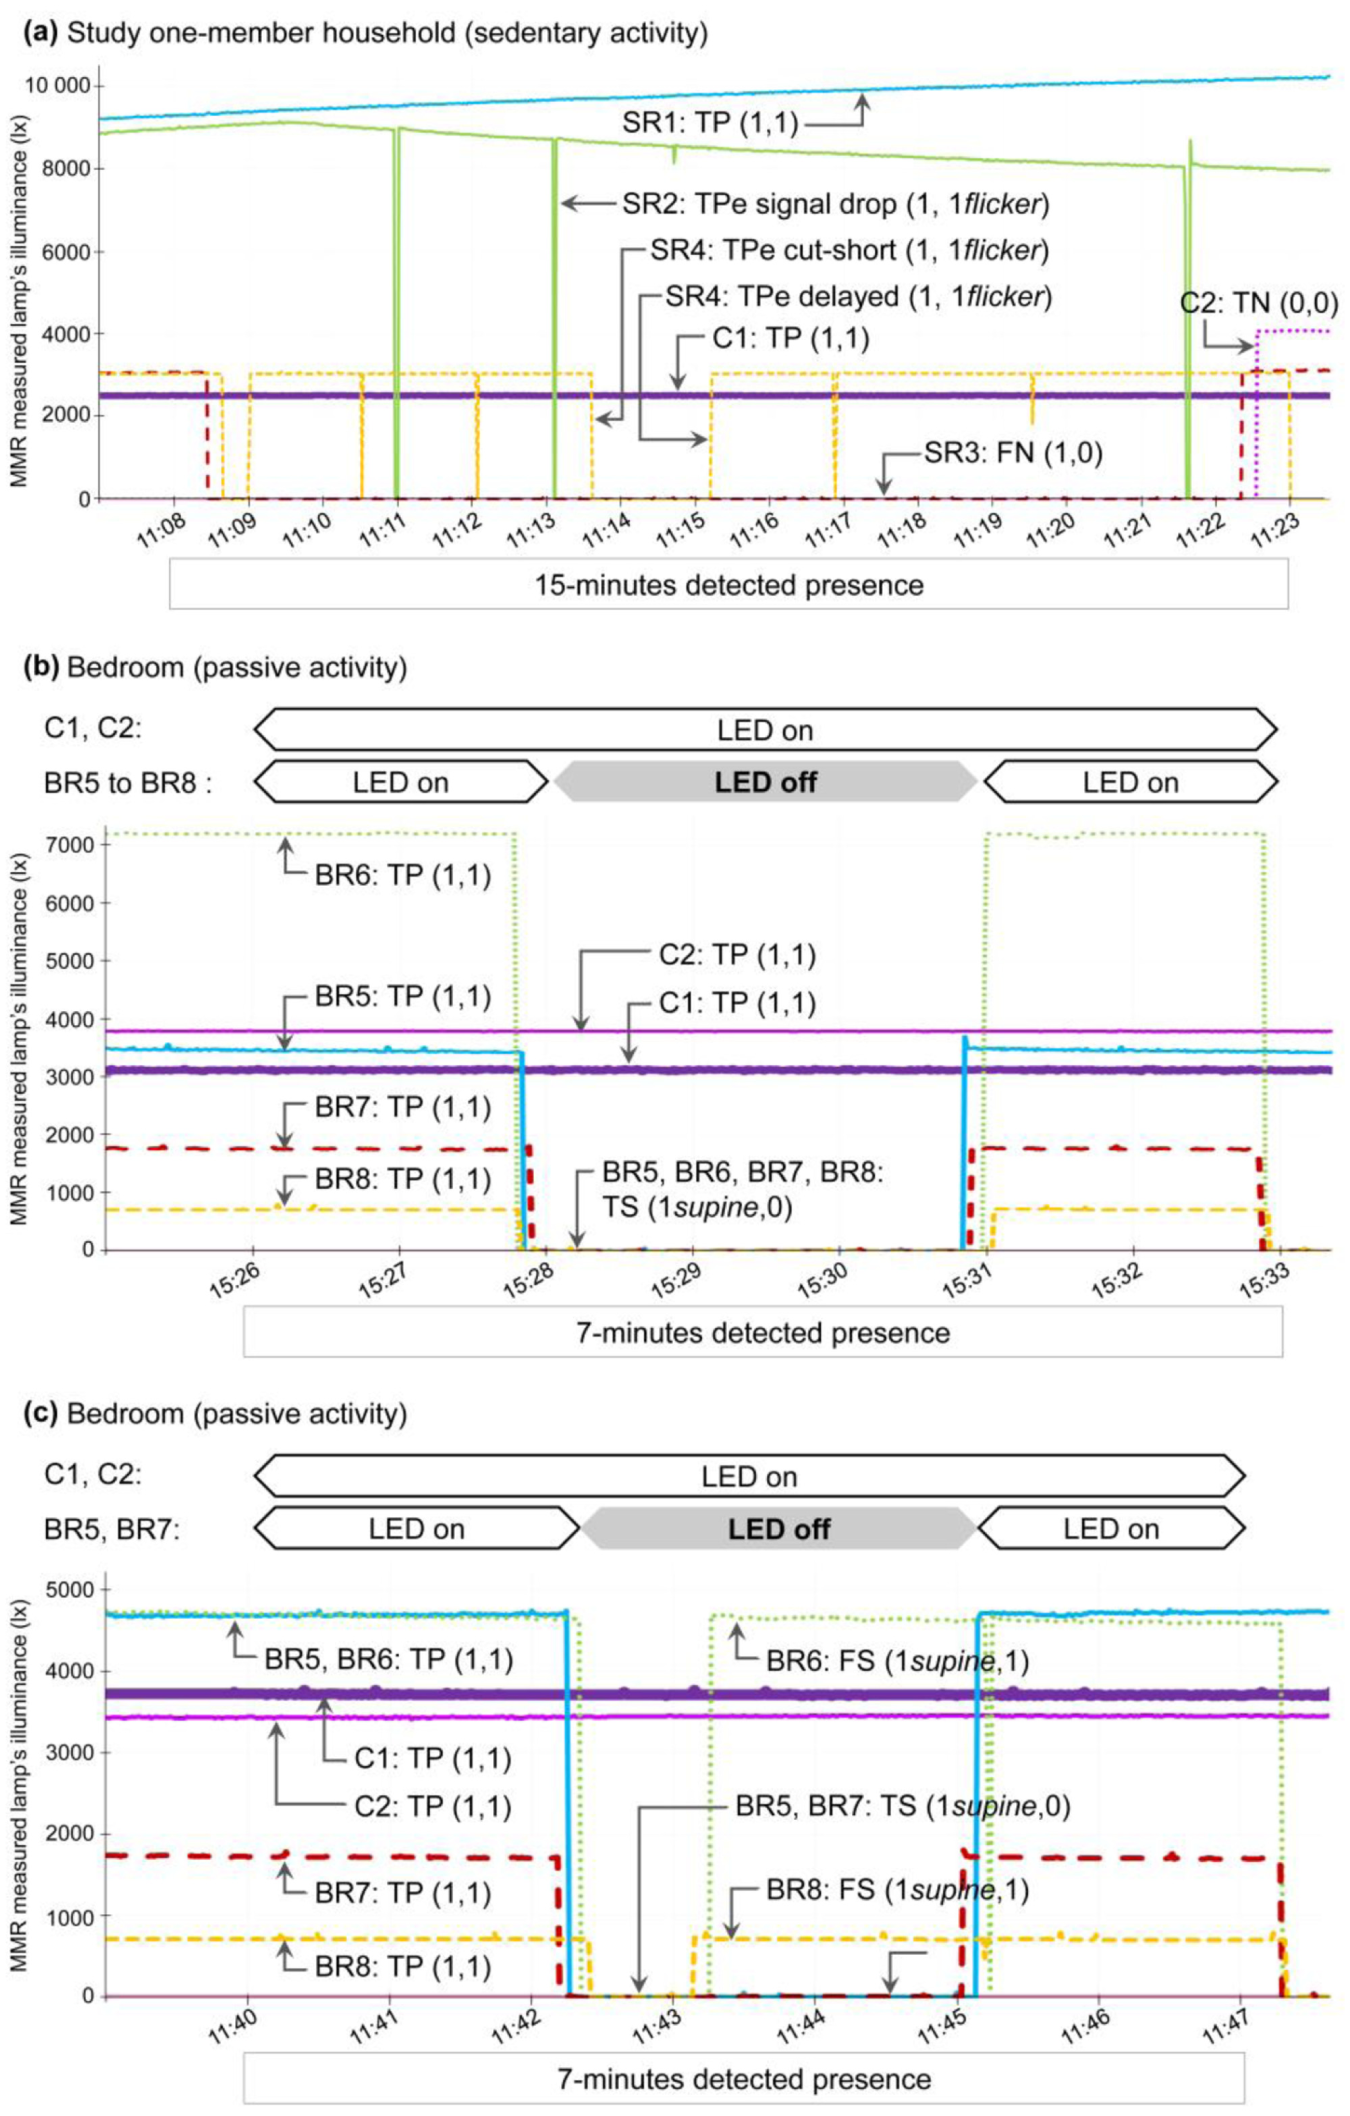
Status of each LED lamp per minute based on the binary categories: (a) examples of TP, TPe, TN and FN; (b) example of TS and (c) example of FS. Refer to the online version for colour figures
Binary categories of presence detection in Study, Kitchen and Bedroom zones
TP: True Positive; TPe: True Positive with random errors; TN: True Negative; FP: False Positive; FN: False Negative; TS: True Sleep; FS: False Sleep.
FP (0, 1) and timeout were not applicable in this paper as analysis was limited to presence detection during the three tasks. Further analysis for periods of detection before, during and after tasks is presented in a separate publication.
Ethics approval was obtained from the Swedish Ethical Review Authority (Ref. 2023-02202-01). Brief information about DOSE and the experimental procedure was shared through poster advertisements in the School of Engineering, Jönköping University, inviting students and staff to participate. Students and staff from other schools in Jönköping University were not actively invited but were also welcome to participate. The ‘Information for Participants’ was emailed to those who registered their interest in participating. It provided additional details about the experiment procedure and the data collected during the three tasks (such as breathing and responses to online questionnaires) under controlled home lighting exposure. The information on the presence sensors, test lamps and randomised group allocation was withheld to safeguard against performance bias, where results on physiological measures and subjective assessments could either be overestimated or underestimated due to prior knowledge of the presence sensing conditions. Written informed consent was obtained from all participants before the start of the experiment.
Seventy participants consisting of students and staff from Jönköping University, aged between 22 and 63 (42 ± 12) years voluntarily participated. By gender, there were 29 females and 41 males, based on participants’ responses. Ten individuals attended the experiment solo (reflecting one-member household), while 60 came in pairs (two-member household) based on their preferred date and time. All were self-reported healthy (fit to work) adults without psychiatric, neurological disease and severe cardiorespiratory conditions. The participants reflected a realistic representation of adults with daily jobs (studying/working) as occupants of a small Swedish home.
The experiment procedure started with a briefing session on the procedure and the fitting of a wearable pulse-oximeter (MightySat Rx, Masimo International Sàrl, Oude Meer, The Netherlands) on the middle/ring finger of the non-dominant hand. Then, each participant was provided with an iPad and noise-cancelling headphones to follow the guided video-voice-over instructions in English, offering step-by-step directions throughout the entire procedure. Participants were randomly allocated to two groups (X and Y). Those in Group X did the Study, Bedroom and Kitchen tasks sequentially, while those in Group Y did the Kitchen, Bedroom and Study tasks sequentially. For two-member households, one participant (Group X) started in the Study, while the other (Group Y) started in the Kitchen/Bedroom, switching upon task completion. Participants were compensated with Swedish coffee and pastries at the end of the experiment, and 10 randomly selected participants received a retail gift card.
Demographic data were descriptively reported as mean and standard deviation (M ± SD) with range. Each sensor’s detection accuracy at the test zones was analysed as the percentage occurrence of the binary categories in Table 2. Additional data extracted from the radar sensors included the user’s micro-location detection by distance (m), respiratory signal (breathing amplitude over time) and breathing frequency (BF, as number of breaths per minute (bpm)). Python-coded algorithms were developed to generate the respiratory signal plots and compute per-minute BF. The respiratory signal plots were visually analysed to identify any distinct waveform trends that could be linked to the different activities. The per-minute radar-detected BF (RBF) was validated with the oximeter-detected BF (OBF). The RBF and OBF were descriptively analysed in two steps. Step 1 compared the mean RBF and OBF to identify which radar positions detected BF within the physiological reference range and had wider micro-location coverage. Step 2 assessed the BF tolerance agreement (%) between the two measuring techniques 33 – non-wearable (radar limited to positions identified in Step 1) and wearable (oximeter).
3. Results and discussion
The participants were allowed to complete the tasks at their own pace to mitigate time-based anxiety that could affect their breathing. The average completion times were 16 ± 2 min (range = 13 min to 21 min, n = 13) for the Study task, 6 ± 2 min (range = 4 min to 10 min, n = 10) for the Kitchen task and 7 min ± 22 s (range = 6 min to 7 min, n = 59) for the Bedroom task. The results are presented in two sections: Section 3.1 discusses the presence detection accuracy of conventional and radar sensors, while Section 3.2 explores radar-based activity recognition and its possibilities for health monitoring as a non-wearable sensor.
3.1 Presence detection (conventional and radar)
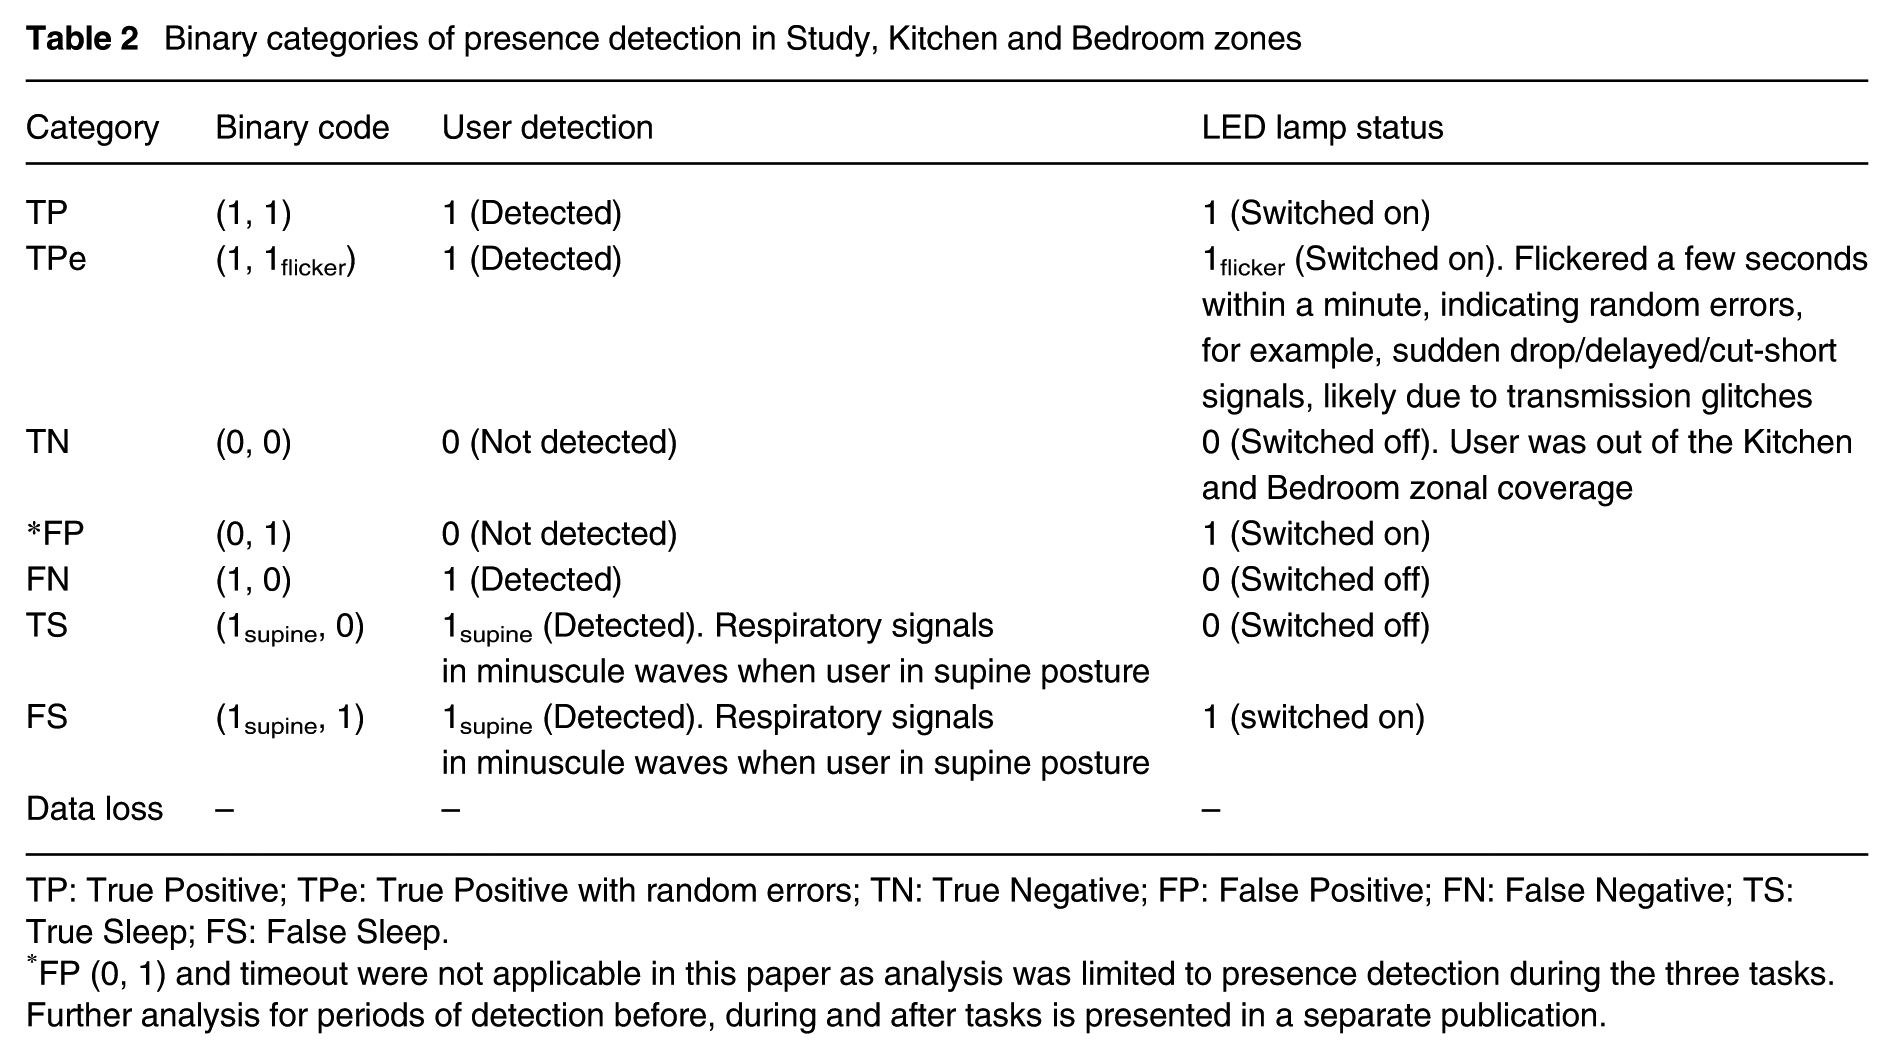
Results showed that the conventional sensor positioned at C1 (ceiling-mounted centrally) was the most stable in continuously detecting user’s presence irrespective of activity type. It exhibited the highest TP accuracy across all tasks compared to all other sensor positions, with ≥91% detection accuracy in the Study, 96% in the Kitchen and 99% in the Bedroom (Figure 4). C1 had a comprehensive wide-range detection that covered both test and non-test zones. The high TP accuracy must be cautiously interpreted because the LED lamps in all three test zones got switched on, regardless of where the user was in the small house. It could be a convenient situation where all the lamps get switched on as the occupant enters his/her small house. However, it raises concern in terms of energy efficiency, as lights got switched on in unoccupied zones, an example of wastage in electricity use. For instance, in a one-member household, entering the Study zone activated lamps in the Kitchen and Bedroom (Figure 3(a): C1 line). While this may not be an issue for two-member households occupying separate zones, simultaneous presence in the same zone would still result in unnecessary energy consumption.
Presence detection accuracies of each sensor based on the binary categories: (a) Study task with one-member household; (b) Study task with two-member household; (c) Kitchen task and (d) Bedroom task. Refer to the online version for colour figures
Next, the conventional sensor positioned at C2 (ceiling-mounted corner) exhibited zonal differentiation, detecting half of the small house. It achieved 93% to 94% TP and TPe accuracy in the Bedroom (Figure 4(d)) and Kitchen (Figure 4(c)), coming second after C1. Interestingly, C2 showed a more energy-efficient approach for the Study zone. In a one-member household, C2 achieved 80% TN accuracy (Figure 4(a)), helping in energy savings by preventing unnecessary illumination in unoccupied Kitchen and Bedroom zones when the user was in the Study (Figure 3(a)_C2: TN line). In two-member households, C2 achieved 81% TP and TPe accuracy, switching on the lamps in the Kitchen and Bedroom when occupied. The 15% TN accuracy (Figure 4(b)) occurred because there were participants who completed the Kitchen and Bedroom tasks faster and were waiting at the Dining zone (out of the C2 detection zone) until their partners completed the Study task, again promoting an energy-efficient approach. Placing the conventional sensor in a ceiling-mounted corner position led to localising the zonal coverage and presented a user-centric sensing feature that kept lamps switched off in unoccupied zones, thereby promoting energy savings.
As micro-location sensors, the radars detected the user’s presence across all test zones, but their performance varied based on their positioning. Radar sensors positioned at ‘0.75 m, 15° upwards’ (SR3, KR11, BR7) and in ‘varies’ (SR4, KR12, BR8) positions exhibited less reliability in short-ranged presence detection due to the frequent occurrence of FN in all test zones, with exceptionally high FN percentages in the Study (Figure 4). More reliable detections came from positions ‘1.25 m, 15° downwards’ (SR1, KR9, BR5) and ‘1.00 m, 0° straight’ (SR2, KR10, BR6). These sensors demonstrated a higher percentage of TPe compared to the conventional C1 and C2 sensors, likely due to their active feature of continuously emitting and receiving waveform signals to process the user’s presence and sensitivity to external signal noise, such as environmental air vibrations. 34 Refining the data processing algorithms to minimise their random signal errors is a prospect for future research.
Nonetheless, the ‘1.25 m, 15° downwards’ and ‘1.00 m, 0° straight’ radars showed that TP and TPe detection accuracy was around 85% (Figure 4(a)_SR2) to 95% (Figure 4(b)_SR1, SR2) in the Study, and almost 99% in the Kitchen (Figure 4(c)_KR9, KR10). Interestingly, in the Bedroom, a TS scenario was observed, where the Bedroom lamps automatically switched off when the users were in a stabilised ‘sleeping’ mode while listening to music over the headphones (supine posture). Considering TP, TPe and TS, the radars demonstrated almost 82% (Figure 4(d)_BR6) to 87% (Figure 4(d)_BR5) detection accuracy. There was also the FS scenario, where the Bedroom lamps got randomly switched on while the users were resting. FS could potentially be caused by minor body movements (e.g. repositioning a hand from the side of the body to the top of the chest) or purely false triggers. DOSE is unable to explain the reasons for this randomness, as body movement was not an observed factor. The occurrence of both TS and FS detections in the Bedroom presents new research opportunities for refining radar algorithms to better distinguish the user’s respiratory signals across different sleep phases. Enhancing this capability could enable adaptive, user-centric home lighting systems to respond selectively to user posture or movement during awake phases, such as by gradually activating or dimming floor-level lighting to support safe nighttime mobility to and from the restroom. While applicable in ordinary houses across age groups, such functionality may be especially valuable in special housing contexts (e.g. assisted living or senior care), where unobtrusive, responsive lighting can significantly enhance user safety and comfort.
Overall, looking at the three zones, radar sensors positioned at SR1, KR9, BR5 (1.25 m, 15° downwards) and SR2, KR10, BR6 (1.00 m, 0° straight) achieved 82% to 99% true detection accuracy (TP, TPe, TS), comparable to the conventional sensors C1 (91% to 99%) and C2 (81% to 94%). The conventional sensors C1 and C2 greatly fit their purpose as presence sensors and detected user presence within their zonal coverage with high accuracy. DOSE presented the benefits of localising the presence sensing coverage in small houses. Improved energy savings were evident in C2 with the existence of TN (lamp switched off in unoccupied zones). However, the conventional sensors, in their current state, were not able to recognise the user’s activity yet, which the radar indicated possibilities. The radar’s TS detection feature supports the user’s ‘sleep-state’ activity in the Bedroom. Hence, implementing micro-location sensing ensures that lighting is only activated when necessary, preventing energy overuse in small house while complementing fine-grain user activity recognition.
3.2 Recognition of user activity and health monitoring (radar)
3.2.1 Respiratory signal analysis
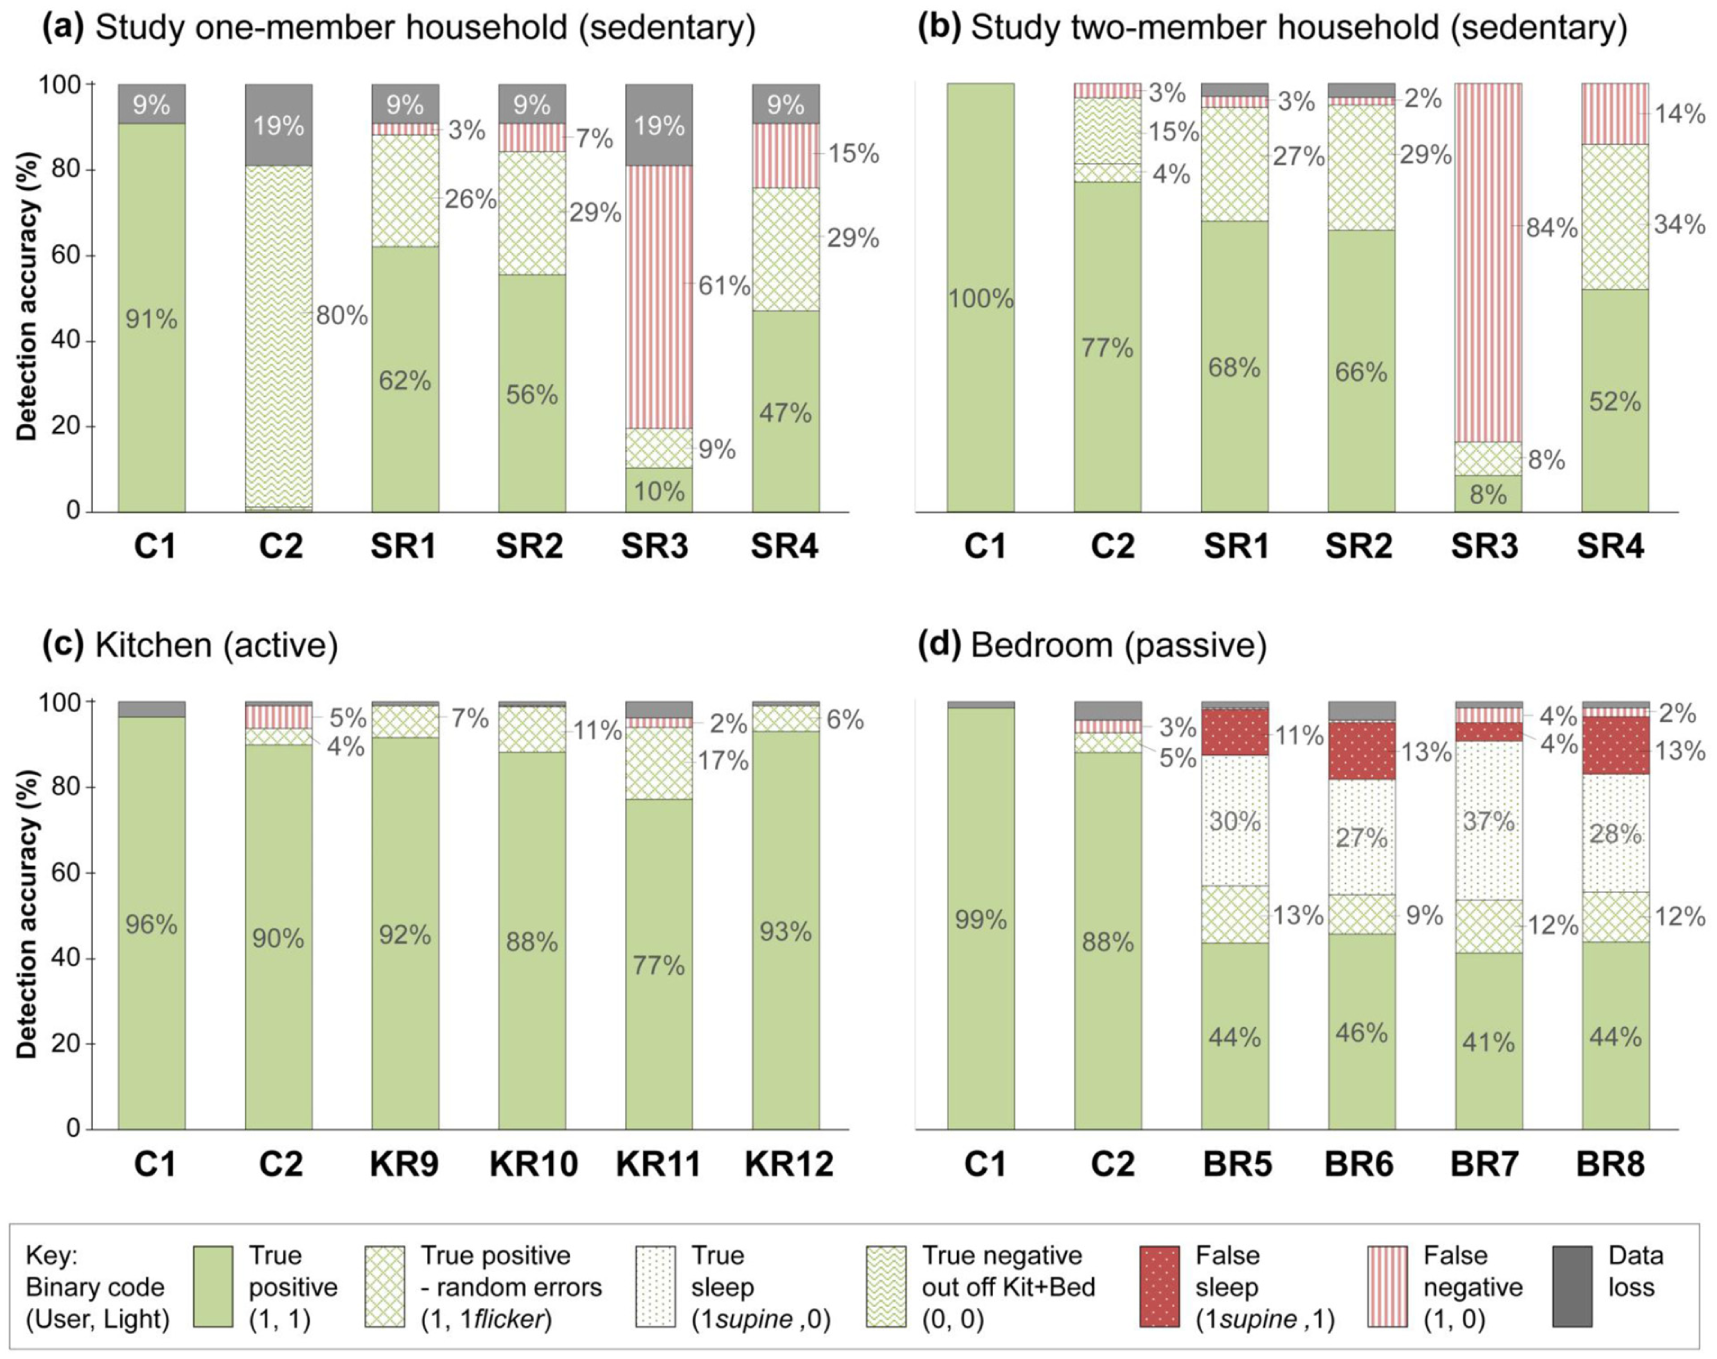
Radar sensors exhibited activity-dependent variations in true detection accuracy (Figure 4 considering TP, TPe, TS). Circa 99% accuracy was observed in the Kitchen active task (Figure 4(c)_KR9, KR10), 85% to 95% in the Study sedentary task (Figure 4(a)_SR2 and 4(b)_SR1, SR2) and 82% to 87% in the Bedroom passive task (Figure 4(d)_BR5, BR6). These results suggest that ‘movement’ enhanced presence detection accuracy, relating to the extracted respiratory waveform trends. Figure 5 presents the respiratory signal for participants completing the tasks within average durations – Study (16 min), Kitchen (6 min) and Bedroom (7 min). Significant inter-individual variance in the amplitude and rhythm of the respiratory signal was observed throughout each task (Figure 5 fine background lines). Python algorithms considering feature selection and extraction were run to derive the average respiratory signal according to the different length epochs taken to complete the tasks.
Radar-detected respiratory signal: (a) Study with busy medium variance waves; (b) Kitchen with busy, large variance waves and (c) Bedroom with busy-minuscule-busy waves. Refer to the online version for colour figures
A closer look at the average respiratory signal (Figure 5 bold black line) revealed distinct amplitude variations corresponding to activity types. The active moving task in the Kitchen (Figure 5(b)) showed a pronounced ‘busy and wider’ waveform trend with clearly large variations (amplitude circa ±8), indicating high respiratory engagement. The sedentary task in the Study (Figure 5(a)) indicated a moderate ‘busy jaggy’ waveform trend with medium variations (amplitude circa ±5). The passive resting task in the Bedroom (Figure 5(c)) revealed a curiously peculiar waveform trend with small variations (amplitude circa ±2). It started with busy waveforms (first to second minutes) as the participant got ready to rest on the bed, followed by an almost visually flat minuscule waveform (third to fifth minutes) when the participant laid flat, and then back to busy waveforms (sixth to seventh minutes) when participant got up/out of the bed. The Bedroom’s ‘busy-minuscule-busy’ respiratory waveform trend also correlated with the radar’s LED lighting pattern on–off–on (Figure 3(b)). The lamp was on for the first 2 min, then got switched off for about 3 min in the middle and switched on again towards the end. The TS period (Figure 3(b)) coincides with the minuscule wave epoch (Figure 5(c)). Overall, this paper demonstrates a clear difference in waveform trends across the three tasks. These findings suggest radar-based respiratory signal analysis could provide insights to distinguish user activity types (active, sedentary or passive), which is a step closer to realising user-centric home lighting.
3.2.2 Micro-location detection
The radars tracked the participant’s micro-location during each task. The mean detected distance showed that the participants carried out the tasks within the zonal grid of 0.3 m to 1.0 m, parallel to the sensors (Figure 6). User’s locations were visually mapped to each zone to display the average occupied locations while performing each task in the Study, Kitchen and Bedroom zones (Figure 7). Despite having the same algorithm configuration for all the radar sensors, positions SR1 and SR2 offered the widest distance detection in the Study zone, KR10 in the Kitchen and BR5 and BR8 in the Bedroom (Figure 7 dashed box). Positions at ‘1.25 m, 15° downwards’ and ‘1.00 m, 0° straight’ maximised the sensor’s zonal coverage within each task zone, thus proving optimal sensor placement for micro-location detection.
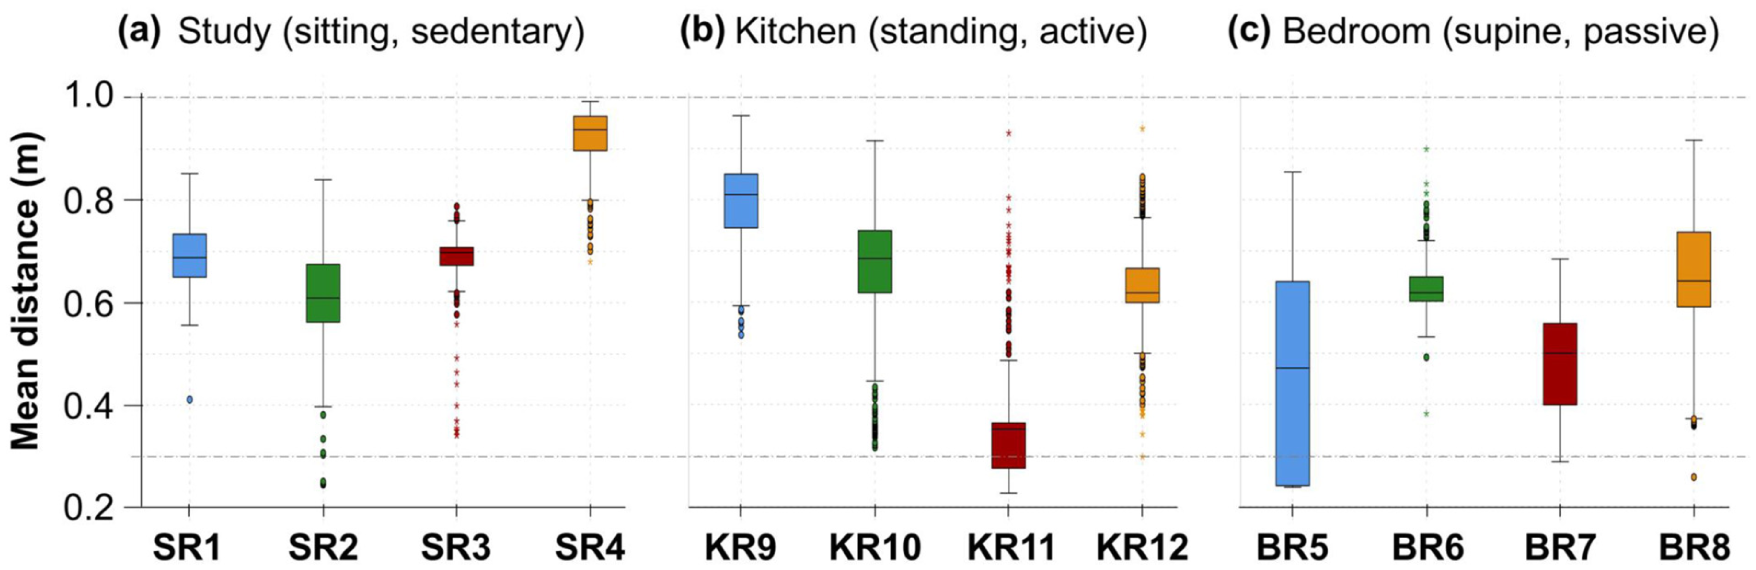
Radar’s mean detected distance (m) during each task: (a) Study (sitting, sedentary), (b) Kitchen (standing, active) and (c) Bedroom (supine, passive)
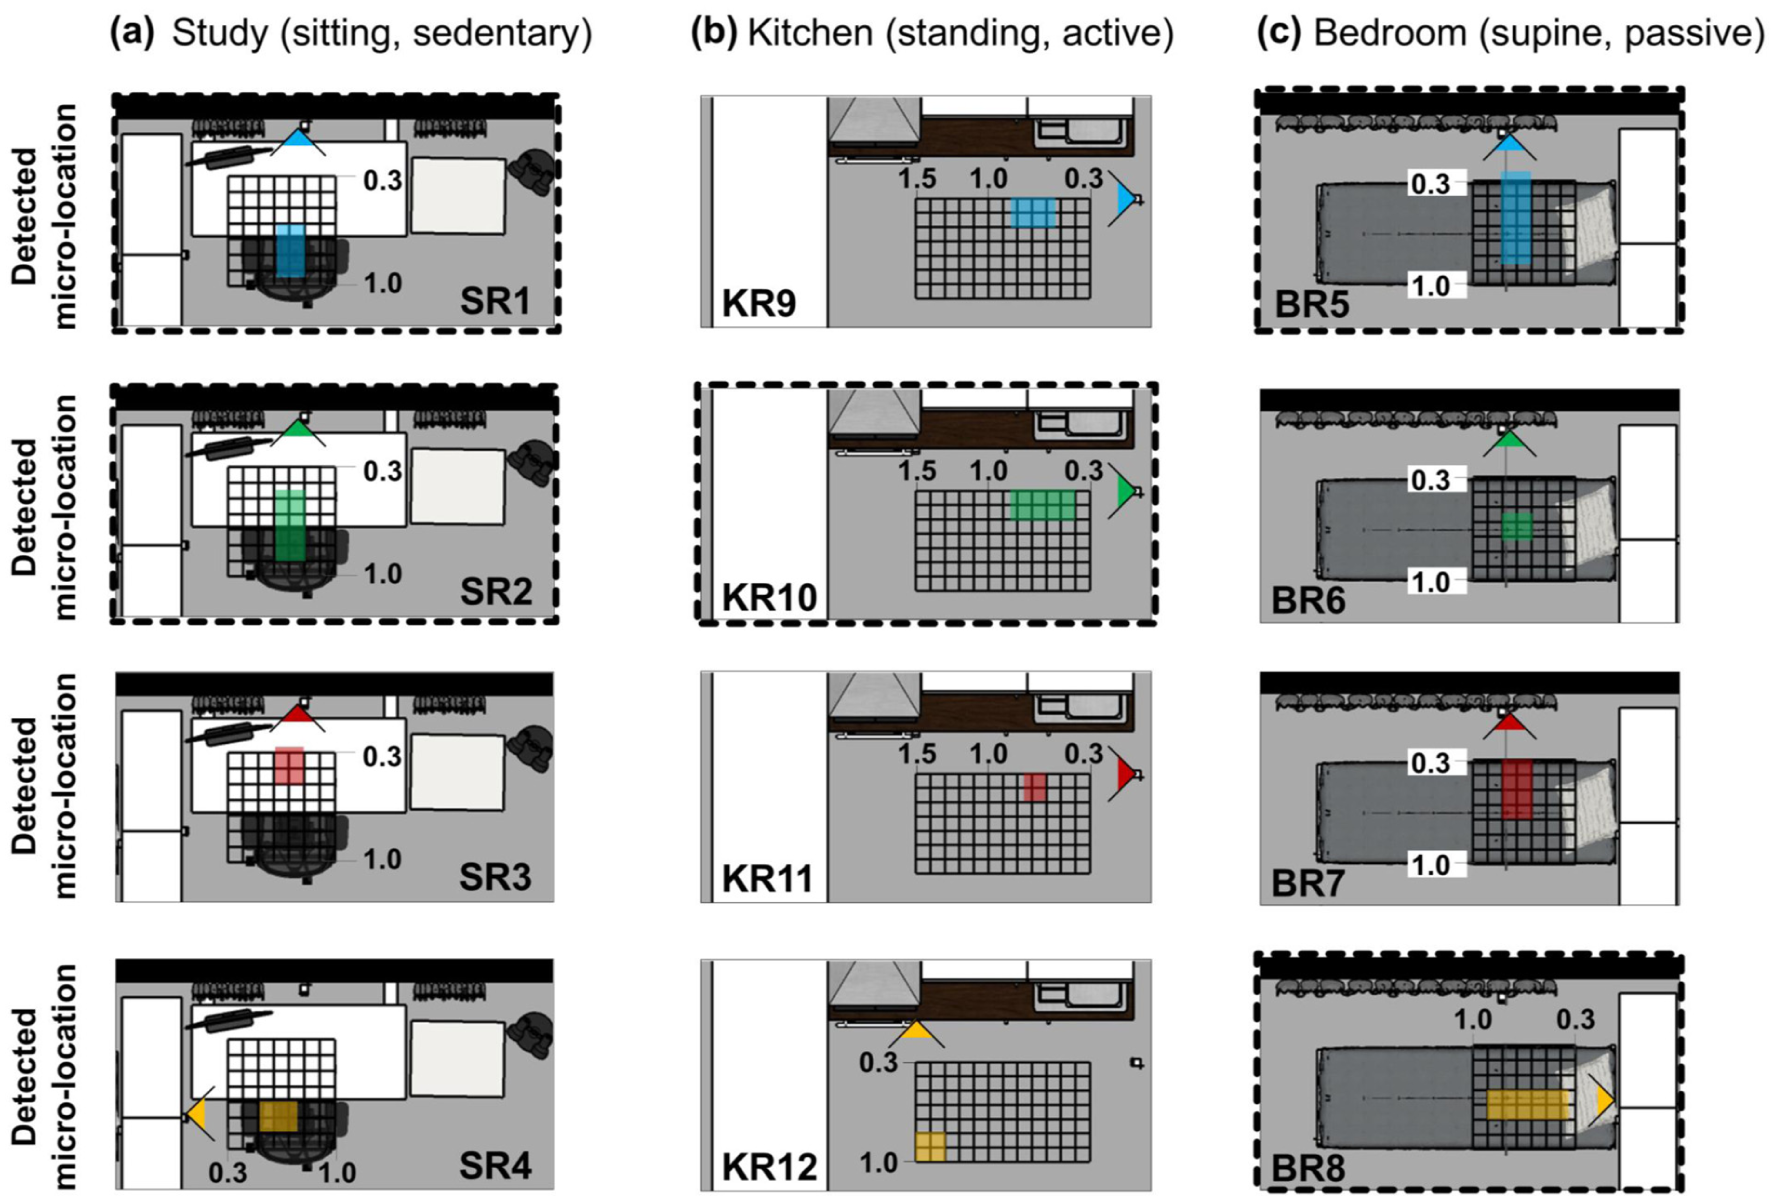
User’s detected micro-location visually mapped onto each zone: (a) Study, (b) Kitchen and (c) Bedroom. The radar’s widest detected distance is indicated as dashed box. Refer to the online version for colour figures
3.2.3 BF detection
The BF detection that involved a two-step analysis is explained below.
Step 1: Figure 8 presents the mean RBF and OBF for each task. A healthy adult’s spontaneous resting BF is usually between 12 bpm and 20 bpm,35,36 with possibilities of a wider range between 9 bpm and 24 bpm. 37 All radar positions recorded an average RBF within this physiological norm. However, caution is raised for radar positioned at ‘0.75 m, 15° upwards’, which recorded relatively higher-than-expected RBF in the Study and Bedroom tasks compared to other positions. It could be that the sensor’s field of view got partly obstructed by the table (Figure 7(a)_SR3) and bed (Figure 7(c)_BR7), as inspection from the visually mapped user’s location revealed rather edge-sided detections. The remaining positions (excluding SR3, KR11 and BR7) demonstrated consistent average BF detection. The mean RBF was around 15 bpm to 16 bpm for the Kitchen task and was slightly higher for the Bedroom (circa 16 bpm to 17 bpm) and Study (circa 17 bpm to 18 bpm). In contrast, the mean OBF was steady at around 15 bpm to 16 bpm for all three tasks. The marginal differences between the mean RBF and OBF should be cautiously interpreted, as it does not reflect an agreement between both non-wearable and wearable measuring techniques but more for identifying which radar positions had higher chances of BF detection in relation to the user’s micro-location. Step 1 identified for all three tasks, radar sensors positioned at ‘1.25 m, 15° downwards’ and ‘1.00 m, 0° straight’ detected within physiology ranged BF and maximised their zonal coverage compared to the ‘varies’ positions. Hence, the ‘varies’ positions scenario was not considered for Step 2 analysis.
Step 2: The difference in BF between RBF and OBF (ΔBF = OBF − RBF) was computed for every minute throughout each task’s duration. The frequency of each ΔBF (Δ0 bpm, Δ1 bpm, Δ2 bpm and so on) was analysed and converted into percentages to assess the tolerance agreement 33 between the non-wearable (radar) and wearable (oximeter) measuring techniques. A tolerance of ±3 bpm was considered acceptable for clinical purposes.38,39 Figure 9 revealed that 70% to 71% of the RBF measurements agreed with the OBF for the Study task, 52% to 57% for the Kitchen and 72% to 76% for the Bedroom tasks. Accuracies between 70% and 90% were considered realistic and common in many real-world applications, considering complex, noisy physiological data. Higher BF agreement was achieved in the passive (supine) and sedentary (sitting) tasks, which is logical and aligns with the good clinical practice of reliably measuring BF in a ‘steady’ condition. However, for an actively moving activity (involving posture movements in the x, y and z-axis over time), the BF agreement dropped to slightly above 50%. The pulse-oximeter is a medical device commonly used to measure vital signs in a relaxed, ‘steady’ posture. The lower agreement in active tasks (52% to 57%) may stem from movement-induced artefacts despite precautions taken for stabilisation by strapping the oximeter to the participant’s palm hand. Nevertheless, the slightly lower RBF agreement with OBF in the active task remains a question of acceptance for user-centric lighting control and further investigations. To the authors’ knowledge, studies assessing BF agreement have predominantly focused on static conditions, highlighting the need for further investigation into radar-based BF detection during dynamic activities.
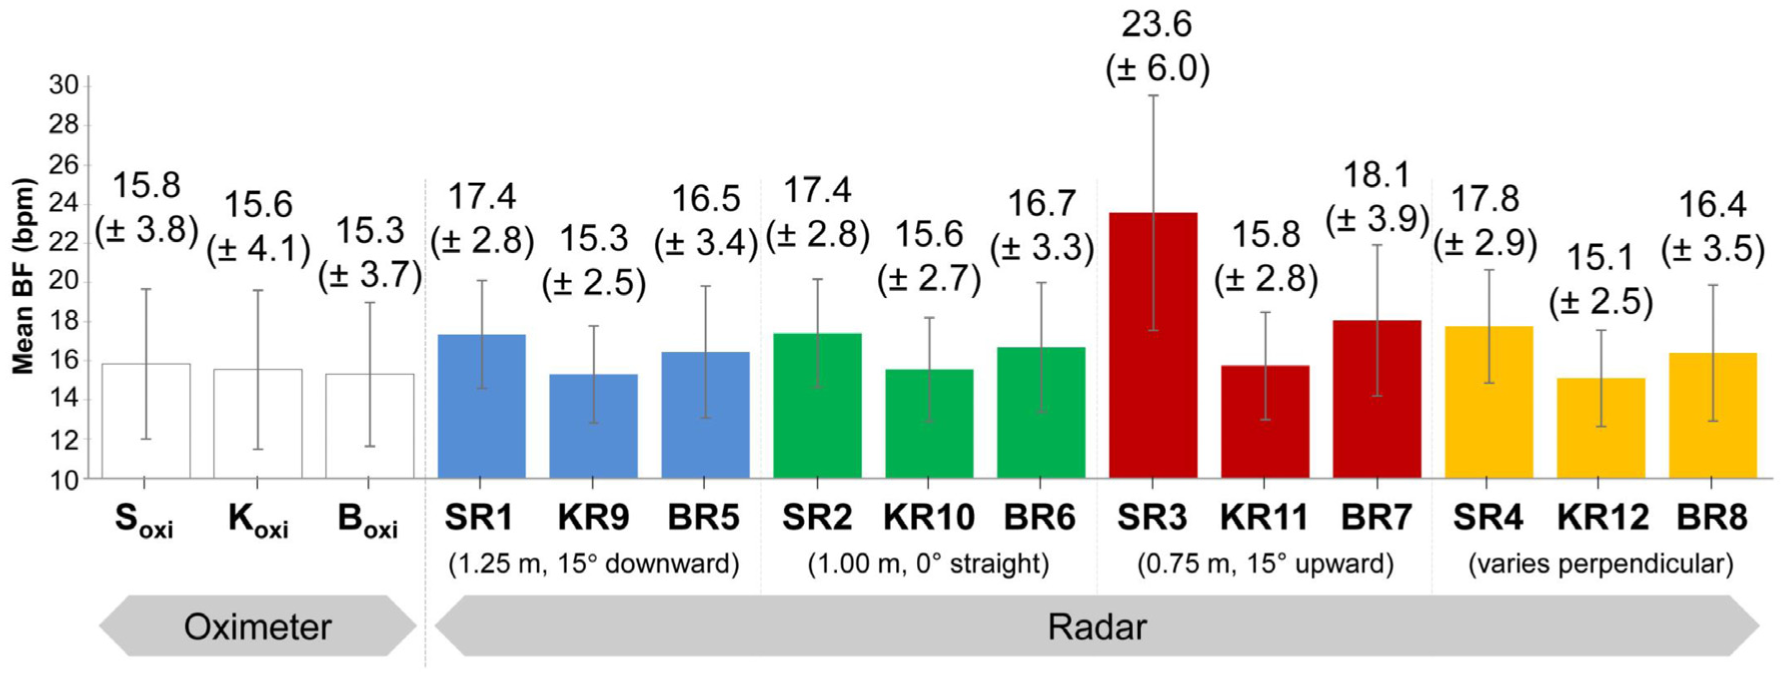
The mean BF in breaths per minute (bpm) during each task
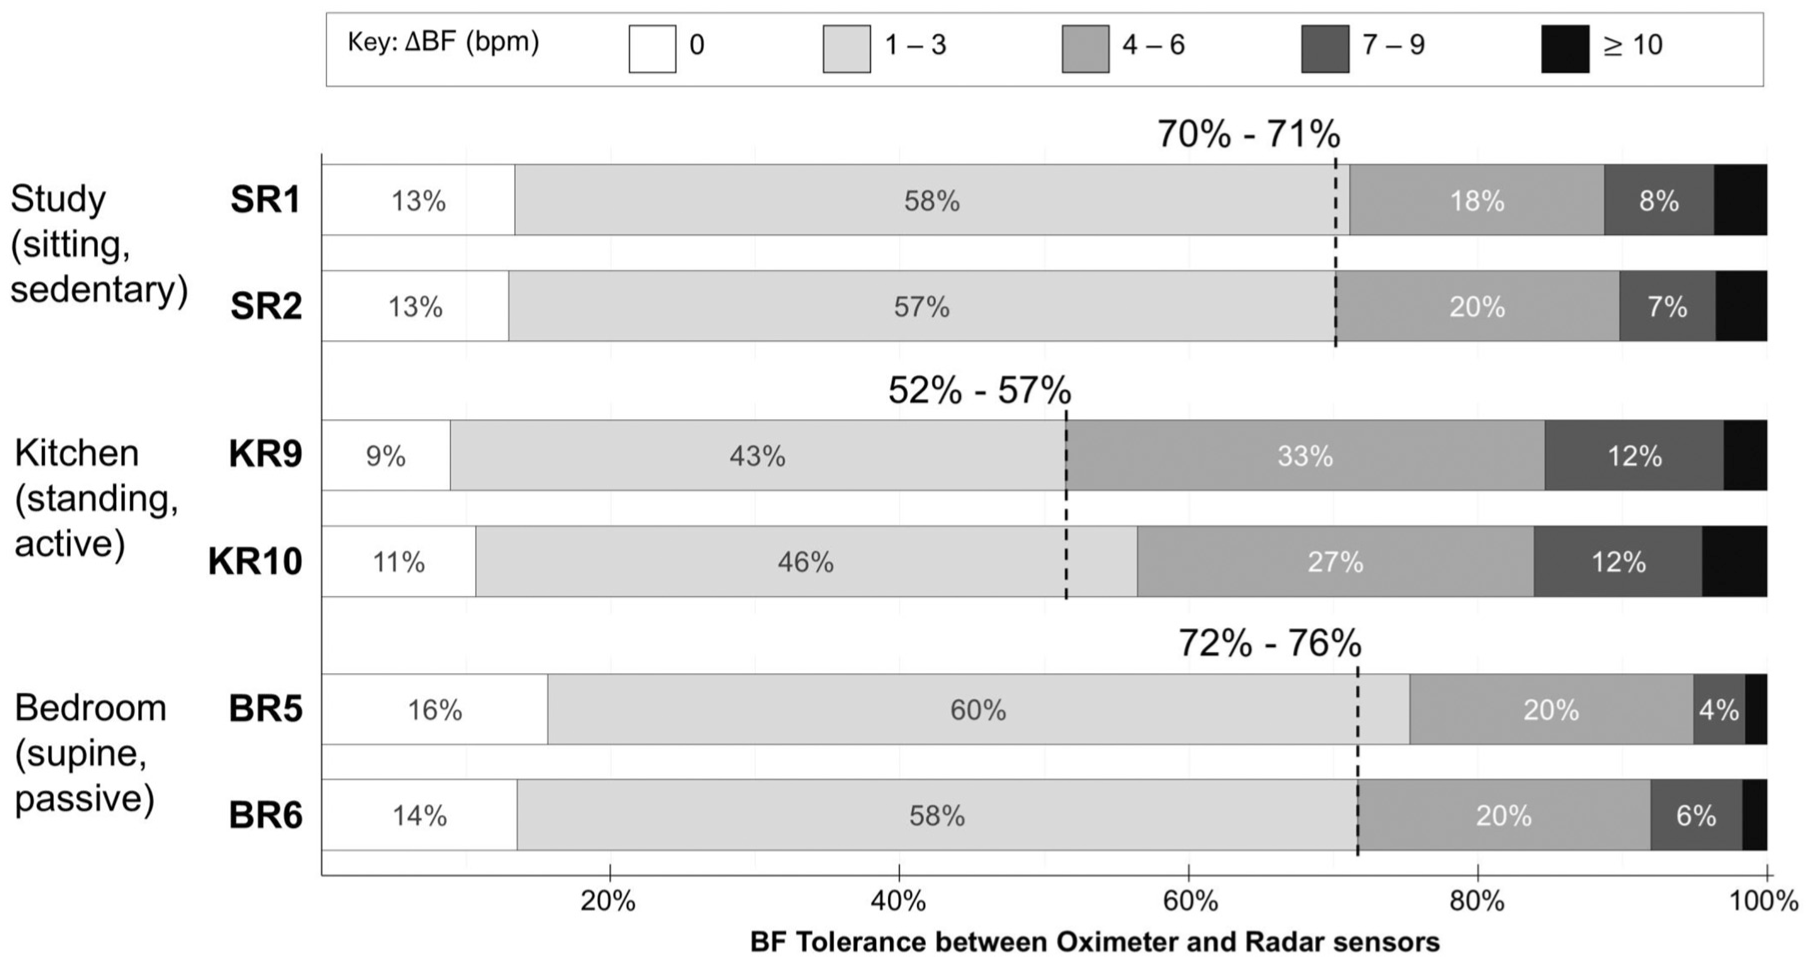
Percentage agreement between the non-wearable RBF and wearable OBF measuring techniques
3.3 Sensor placement for presence detection and activity recognition
The DOSE outcome agrees with previous computational modelling results 31 and strengthens the evidence that optimal sensor placement is key to improving user presence detection with minimal false triggers and recognising user activity. The conventional sensors C1 and C2 greatly fit their purpose as presence sensors and detected user within their zonal coverage with high accuracy. It could detect micro-movements like human breathing to overcome the difficulty in detecting (nearly) stationary postures and differentiate between humans and pets. The ceiling-mounted centrally positioned conventional sensor (C1) provided a stable and comprehensive wide-range coverage of the entire house with high TP accuracy that led to all the LED lamps being continuously switched on irrespective of where the user was in the small house. In contrast, placing the conventional sensor in a ceiling-mounted corner position (C2) led to localising the zonal coverage with 80% TN accuracy that kept lamps switched off in unoccupied zones, hence promoting energy-savings practice in the small house. Localising sensors towards short-range presence detection, especially with radars positioned at ‘1.25 m, 15° downwards’ (SR1, BR5, KR9) and ‘1.00 m, 0° straight’ (SR2, BR6, KR10), achieved 82% to 99% true detection accuracy (TP, TPe and TS) in the test zones. The radar’s presence detection was not only comparable to C1 (91% to 99%) and C2 (81% to 94%) but also offered nuanced insights into energy-efficient lighting interacting with user behaviour.
The ability of radar to recognise distinct respiratory signal waveform trends associated with different activities introduces a new dimension to user-centric lighting control. The DOSE results highlight three significant differences in waveform trends – (i) ‘busy and wider’ with large amplitude variations for dynamic, active activity, (ii) ‘busy jaggy’ with medium variations for sedentary activity and (iii) peculiar ‘busy-minuscule-busy’ with small variations for static passive activity. The conventional sensors, in their current state, were confined to a binary detection system and lacked the capability to distinguish user activity. For example, Bedroom lamps connected to C1 and C2 were always switched on when the user mimicked ‘sleep’ activity (Figure 3(b)). Lights are not needed when a person is sleeping. Alternatively, the radar-detected ‘busy-minuscule-busy’ respiratory waveform recognised the user’s ‘sleep’ activity and correlated with the radar’s LED lighting pattern on–off–on (Figure 3(b)). The DOSE outcome presents the prospects of radar sensor synchronising energy-saving practice into user-centric lighting control for bedtime. With that, the outcomes of the DOSE project advocate for the inclusion of new terminologies (Table 2: TS and FS) that reflect user’s sleep activity/posture to the current binary vocabulary limited to TP, TN, FP and FN in presence detection. TS is a feature that supports the user’s sleep activity in a supine posture relevant for user-centric bedroom lighting.
Additionally, all the radars contextualised the participant’s location during each task, but sensors positioned at ‘1.25 m, 15° downwards’ and ‘1.00 m, 0° straight’ demonstrated better performance with the least false triggers, wider micro-location detection and quantifying the user’s BF. The average detected distance showed that the participants carried out the tasks within the zonal grid of 0.3 m to 1.0 m, parallel to the sensors. The visually mapped micro-location displayed highly occupied spots throughout the task at each zone. Taking this feature to the next level would enable tracking and mapping the user’s common movement path for smarter localised lighting response, reducing unnecessary energy consumption by ensuring that lamps remained off in unoccupied zones while providing input to design supportive visual/beyond-visual user-centric lighting. The radar’s ability to quantify BF with approximately 70% agreement with the oximeter in sedentary and passive activities underscores its potential as a reliable, non-wearable health monitoring sensing. However, further investigations are recommended to enhance BF detection during active tasks, as accuracy circa 50% suggests indeterminacy, reflecting a situation where the results do not lean definitively towards either outcome, akin to a state of uncertainty with the non-wearable approach for dynamic tasks.
3.4 Limitations and future research
Beyond the practical guides for optimal sensor placement, the DOSE results highlight key limitations and challenges. User behaviour in home environments is generally random and unpredictable, but DOSE observed a degree of behavioural consistency within a semi-controlled experimental setting, aligning with previous findings by Gentile. 27 Future studies could explore home users’ natural lifestyles to determine the potential of radar-recognising user activity. Investigating other postures such as half-sits or side-lying, and floor-based/low-height activities like yoga, which are common in the Bedroom or Living is also recommended. To improve ecological validity, the optimised sensor placements identified in the laboratory are recommended to be tested in field studies conducted in real-world small houses. Continuous time-series data over a long period offer opportunities to test different machine learning algorithms for activity recognition or anomaly detection. 40 Additionally, DOSE focused on a micro-level respiratory signal analysis limited to the duration taken to complete the tasks. Analysing the respiratory signal for the full 35-min procedure is time-consuming as all 70 participants had their own uniqueness and needed to be studied attentively on a case-by-case basis. The data may provide additional insights into identifying macro-level waveform trends (if any).
Concerns are raised in mining useful and relevant information from the radar’s humongous datasets of continuous (microsecond) time-series data. It requires advanced signal processing, which could be time-consuming for real-time user-responsive feedback. Lighting control is not about big data; it is about thin data. At its current stage, focusing on respiratory signal waveform trends and micro-location tracking provides greater insights in recognising user activity and commonly occupied spots in a small house, and analysing the RBF promotes its prospects as a reliable non-wearable health monitor more for sedentary and passive tasks than an active task.
4. Conclusions
The DOSE project advances the conversation on adaptive, user-centric lighting control systems by demonstrating practical guides for optimal sensor placement in small houses. Results showed that short-range radar sensors positioned at ‘1.25 m, 15° downwards’ and ‘1.00 m, 0° straight’ reduced false triggers and improved presence detection accuracy. Compared to conventional sensors, radar-based micro-location sensing presented prospects for accommodating dynamic user behaviours and overlapping activity zones in small houses. It enabled localised lighting based on fine-grain user activity recognition from the respiratory signal and offered a non-wearable solution for health monitoring. Notably, the introduction of ‘TS’ highlights radar’s potential to synchronise lighting with the user’s ‘sleep-state’ activity, thereby reducing unnecessary lighting energy usage. These findings lay the foundation for developing adaptive and responsive user-centric home lighting systems, for small houses and also in assisted living environments.
Footnotes
Acknowledgements
The authors thank all participants for their efforts in this study; Mr Marcus Lund and Ms Camilla Grönbladh from Karl H. Ström for their sponsorship of the True Presence sensors; Mr Kåre Agardh and the Acconeer AB technical support team in developing the programming of the radar sensor; Mr Johan Norrgård from Masimo Sweden AB for technical support with the pulse-oximeter; JU Helpdesk and Mr Stephen McCulloch for IT support; JU Caretakers and Höfab for the laboratory maintenance and Ms Elham Rastegari for assisting with data retrieval.
Declaration of conflicting interests
The authors declared no potential conflicts of interest with respect to the research, authorship, and/or publication of this article.
Funding
The authors disclosed receipt of the following financial support for the research, authorship, and/or publication of this article: The Daylight and Occupancy Sensing Environments (DOSE) project is supported by the Swedish Energy Agency (Ref: P50786-1) and additionally by the Bertil and Britt Svensson Foundation for Lighting Technology via the EXtensive Tracking of Respiration Added in Daylight and Occupancy Sensing Environments (ExTRA DOSE; Ref: 2022 höst-17).