
Abstract
Road lighting should support the needs of pedestrians to make interpersonal evaluations after dark, for example, whether it feels safe to walk towards the person ahead or if avoiding action should be taken. In previous studies this has been investigated using a facial emotion recognition (FER) task, but using only full-face views of the person ahead. Other views are possible and this might affect the ability to make FER judgements and thus the impact of changes in light level. Reported here are the results of an experiment investigating FER with full-face and 3/4 views. The results show that while correct expression recognition is reduced with the 3/4 view, there is no interaction between face luminance and face view.
1. Introduction
Road lighting after dark should support the ability of pedestrians to assess whether other people around them are likely to be friendly, indifferent or aggressive.1,2 Sufficient vertical luminance on the human face at an average height is required for a person to make an interpersonal evaluation of someone approaching.3,4 This will support pedestrians to assess potential threats and make decisions about who to approach or trust. 5
Within lighting research, most studies of facial identification or facial emotion recognition (FER) have used only full-face views of the observed face.1,6–13 In other studies,14,15 the observed people were walking around rather than being static, and thus the face orientation at the moment the observer made their decision is unknown.
A full-face view is that where the face is observed from the front, with the direction of observation being perpendicular to the front of the observed face. However, the faces of others are not always seen in full-face mode. The observer may approach the observed person from a peripheral angle and/or the observed face may be rotated, for example, a purposeful change of head direction to avoid eye contact. 16 If face profile has an effect on interpersonal evaluations, this may affect the generalisation of previous studies using only a full-face view.
Here, we consider the 3/4-face view, where the face is rotated by 45° about the vertical axis (the yaw axis 17 ) as shown in Figure 1. There is mixed opinion as to whether full-face and 3/4 views lead to different evaluation abilities, with some suggesting better recognition performance with the full-face view, 17 whereas others found better performance with the 3/4-view, 18 and some reported similar performances with the two views. 19
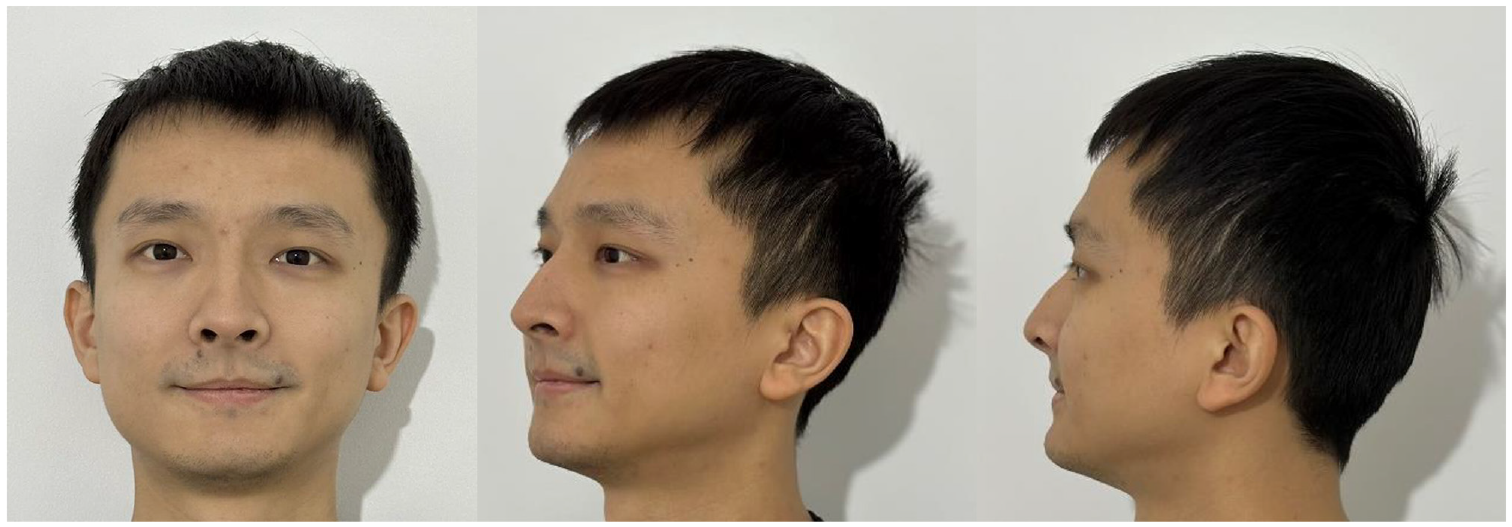
Full-face, 3/4 view and profile view (left to right) of a face (author YM)
One approach to predicting the ability to visually evaluate a face is by using a mathematical model of visual performance. One example is relative visual performance (RVP), 20 which accounts for the size and contrast of the task (here, the face), the age of the observer and the adaptation luminance. RVP was used in recent work to predict the effects of pavement surface reflectance, observer age, and the skin tone and distance ahead of the observed person. 21
We therefore used RVP to predict the ability to see details on faces when viewed in full-face and 3/4 views. This was repeated for faces of light and dark skin tones (labelled as Caucasian and South African in previous studies21,22), for old (65 years) and young (25 years) observers, at a distance of 8 m. The adaptation luminance of 0.64 cd m−2 used for these comparisons corresponds to a road surface illuminance of about 10 lx (assuming a diffuse reflectance of 0.2) which falls within the P-class of light levels. 4 Variations in skin tone (and thus in facial contrast) and in age were used because these are expected to lead to changes in RVP 21 and might affect the relative impact of a change in face view.
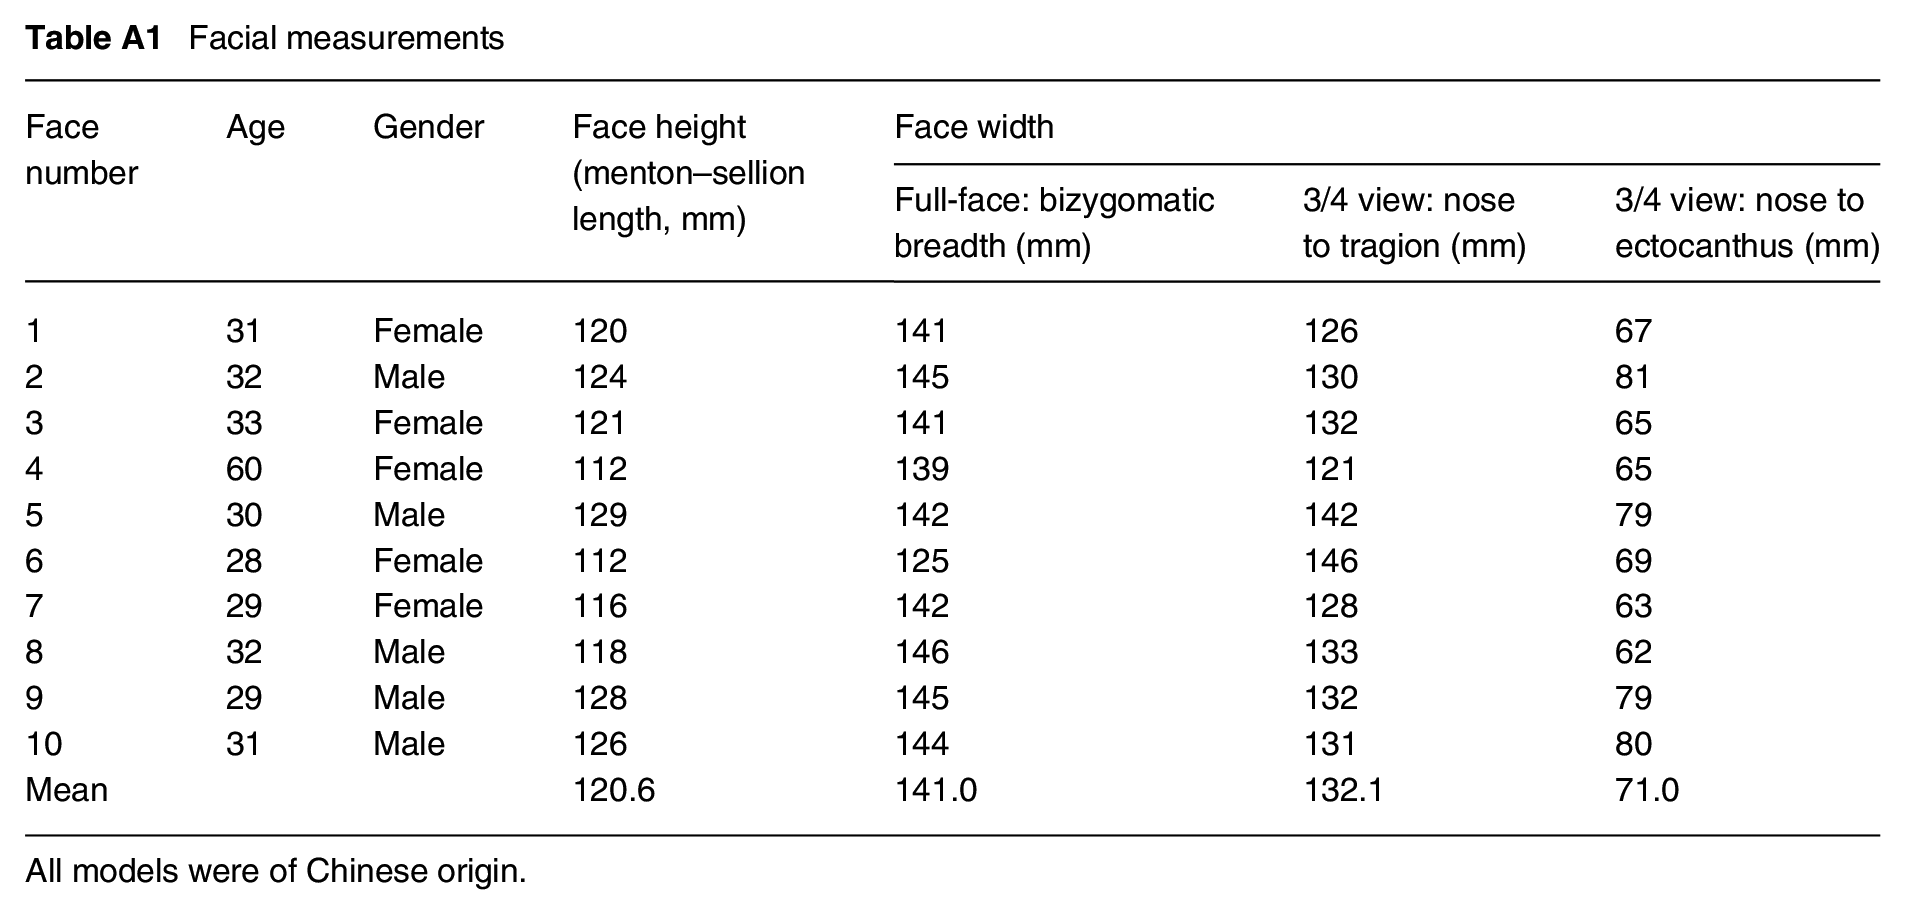
The face was defined as the inner region of the face comprising the eyes, nose and mouth, and for simplicity this was assumed to be rectangular. In previous work, 21 which considered only the full-face view, the relevant dimensions were extracted from British Standards PD ISO/TS 16976-2:2015, 23 with face height defined by the menton–sellion length, and face width defined by bizygomatic breadth. Menton–sellion length is the distance between the bottom of the chin and the deepest point of the nasal root, whereas the bizygomatic breadth is the distance between the zygomatic arches – from one side of the face to the other (Figure 2). That document, however, does not provide dimensions pertinent to the 3/4 view. We therefore carried out measurements of the faces of 10 people (see Appendix A) in full-face and 3/4 views. Although that is a small sample, the mean dimensions thus established are similar to those presented in PD ISO/TS 16976-2:2015 and were thus considered to be sufficiently accurate for the current purpose (Table 1).
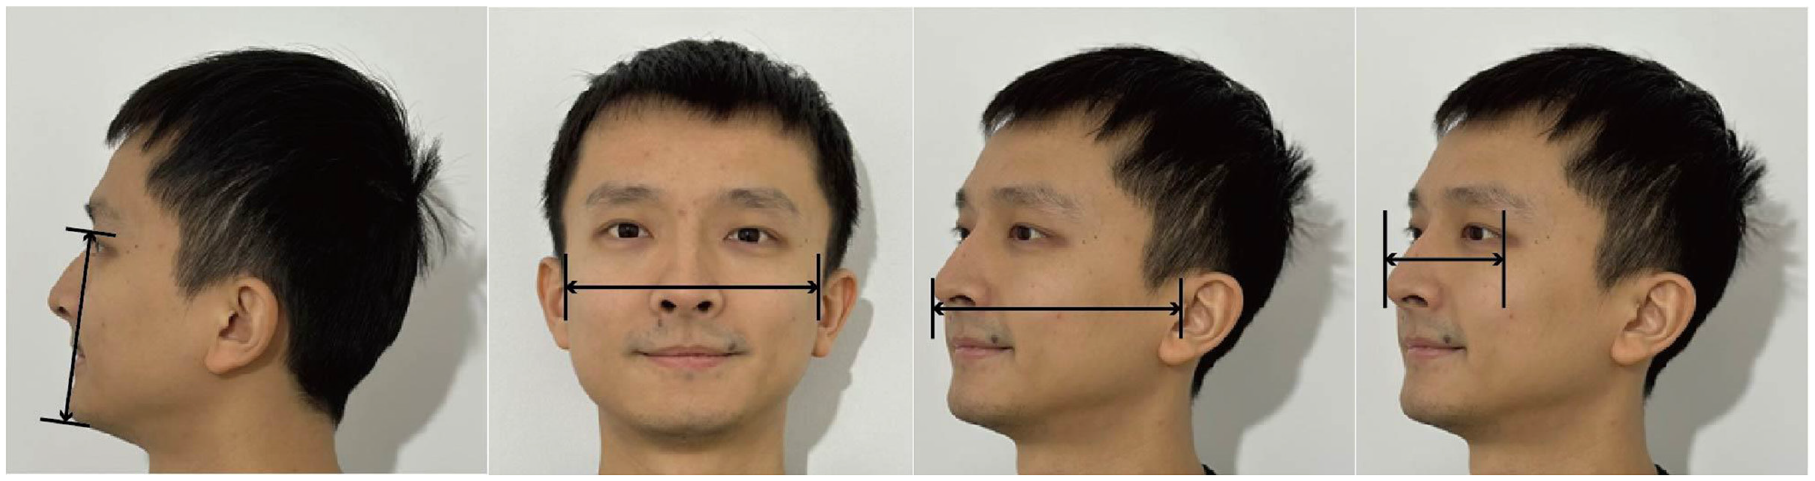
Definition of dimensions used to establish face size in different views. From left to right: menton–sellion length; bizygomatic breadth; width from the outer edge of the nose to the tragion; and width from the outer edge of the nose to ectocanthus in 3/4 view
Face sizes used in RVP analysis of facial expression discrimination
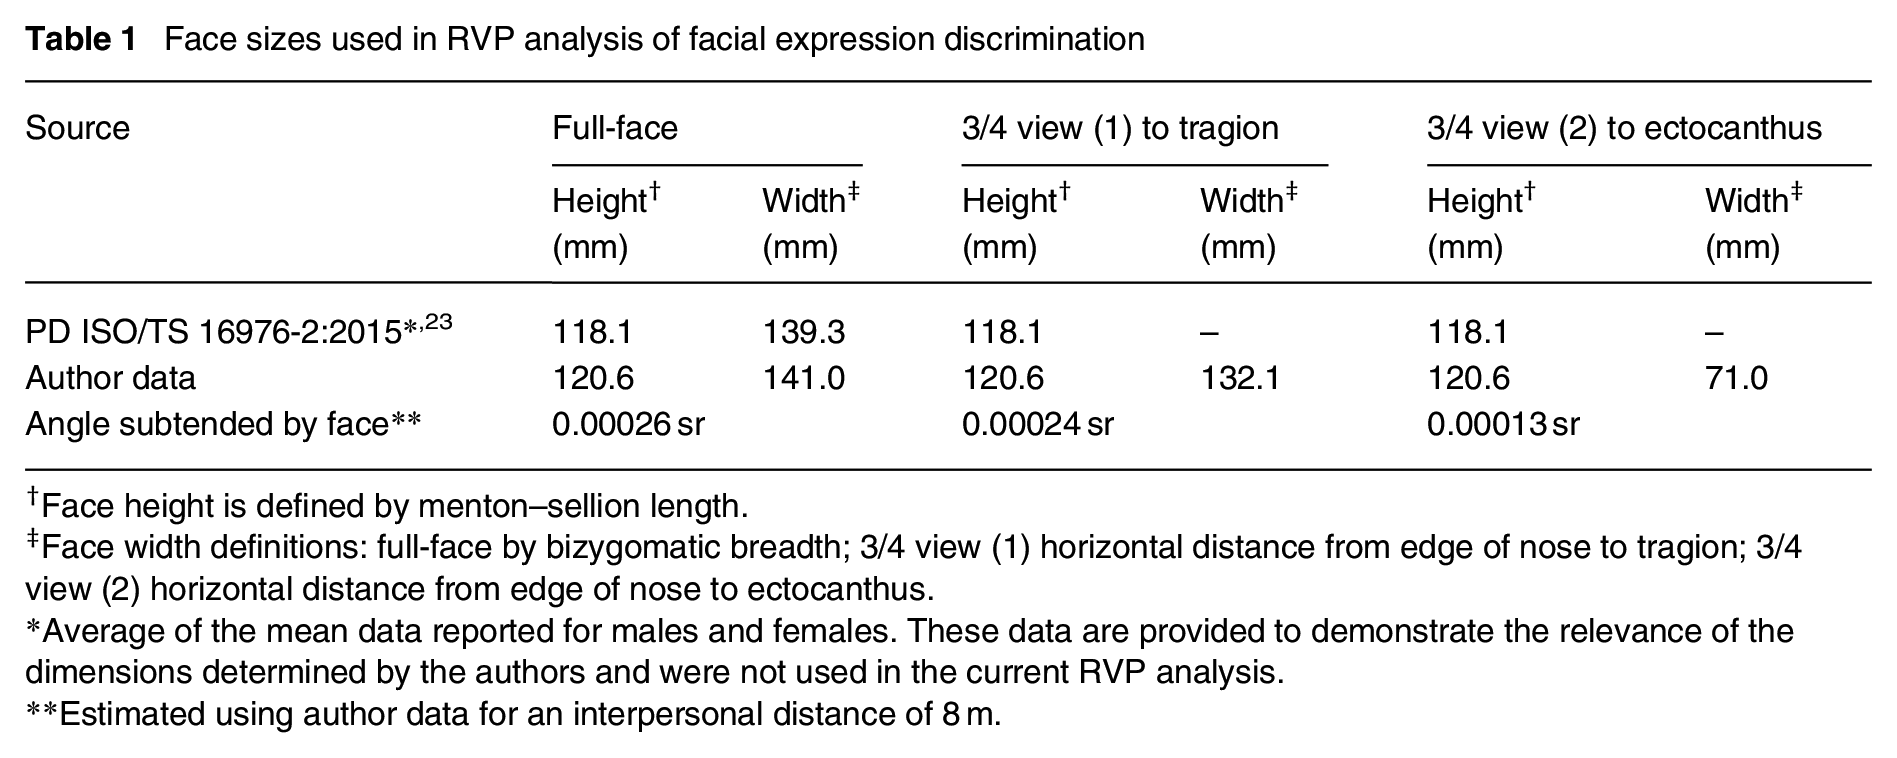
Face height is defined by menton–sellion length.
Face width definitions: full-face by bizygomatic breadth; 3/4 view (1) horizontal distance from edge of nose to tragion; 3/4 view (2) horizontal distance from edge of nose to ectocanthus.
Average of the mean data reported for males and females. These data are provided to demonstrate the relevance of the dimensions determined by the authors and were not used in the current RVP analysis.
Estimated using author data for an interpersonal distance of 8 m.
For the 3/4 view, the menton–sellion length was again used to define face height. For face width, the appropriate dimension is less certain. We therefore adopted two estimates, these being from the outer edge of the nose to (1) the tragion – the front part of the ear, and (2) the ectocanthus – the outside corner of the eye. The tragion and the ectocanthus are defined in PD ISO/TS 16976-2:2015. 23 Table 1 shows the dimensions used to define face size, and hence the angle subtended at the observation point, for the RVP analysis. To determine the angle subtended, it was assumed that the faces were placed at a distance of 8 m. This is the same interpersonal distance as represented by the face models used in the experiment reported below.
Results of the RVP analysis are shown in Table 2. For any one combination of observer age and skin tone, the only change in the RVP analysis is the size of the target. RVP will be similar for face views subtending a similar size, which was found to be the case for the full-face view and the 3/4 view to the tragion. RVP is expected to decrease (i.e. suggest a more difficult task) for face views which present a smaller visual size, which was found for the 3/4 view to the ectocanthus.
RVP prediction for faces of Caucasian and South African skin tone, viewed at 8 m by old and young observers
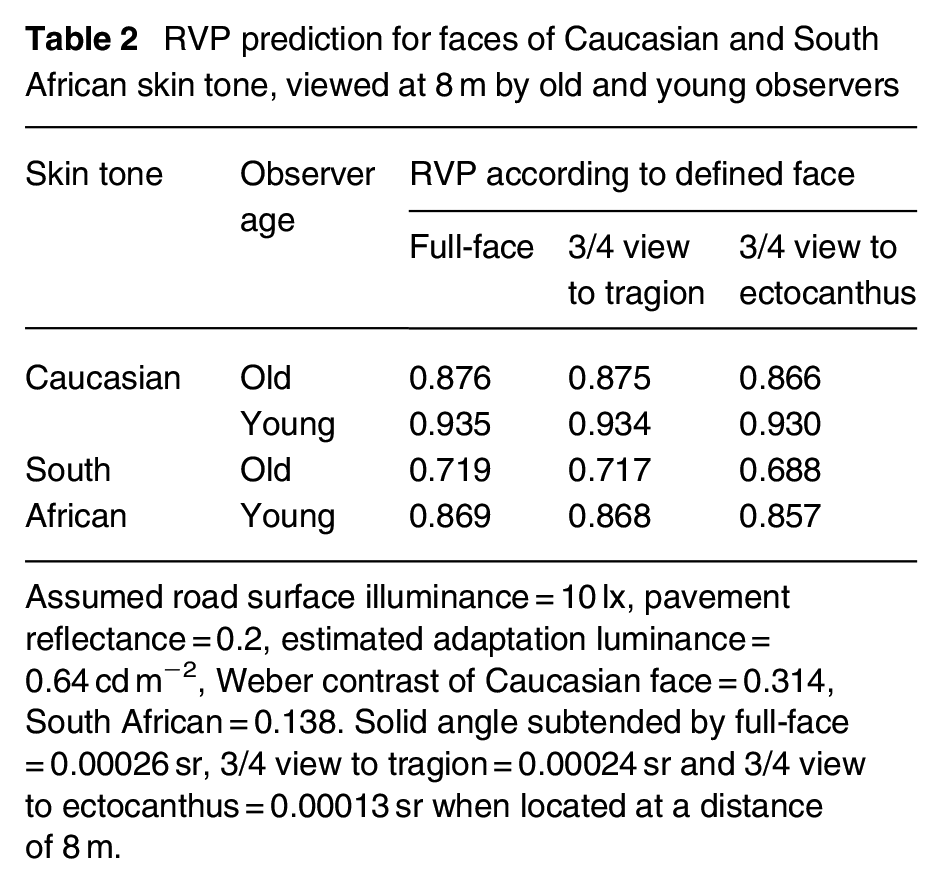
Assumed road surface illuminance = 10 lx, pavement reflectance = 0.2, estimated adaptation luminance = 0.64 cd m−2, Weber contrast of Caucasian face = 0.314, South African = 0.138. Solid angle subtended by full-face = 0.00026 sr, 3/4 view to tragion = 0.00024 sr and 3/4 view to ectocanthus = 0.00013 sr when located at a distance of 8 m.
These two estimates of face size in 3/4 view were used as a sensitivity test, to assess whether the chosen definition of face size had a significant impact on the results of the subsequent analysis. Although they led to differences in RVP for the same experimental condition, it is not obvious whether the reduction in RVP when using the smaller area is important. It can be seen from Table 2 that, for a young person observing a face of Caucasian skin tone, the reduction in RVP when observing that face in 3/4 view as defined by the ectocanthus rather than the tragion is negligible, and is much smaller than the reduction found when observing the same full-face but changing to either the darker skin tone or to the older observer.
Previous studies17–19 employing visual evaluations present mixed conclusions as to the difference between facial judgements made with full-face and 3/4 views. An analysis using RVP suggests that different face views can lead to a small difference in the ability to make facial judgements but that this depends on the assumed size of the facial details. RVP predicts performance according to the size of details and not the nature of those details. Specifically, when the 3/4 view was defined using the ectocanthus, the smaller angle subtended by this view (Table 1) led to a lower RVP than either the full-face view or the 3/4 view defined by the tragion (Table 2). We do not know which details of the 3/4 view are pertinent to observers’ decisions.
An experiment was therefore conducted to compare FER with full-face and 3/4 views. This approach means the results are based on facial details test participants use in their evaluation and not an assumption of the relevant details. FER was used rather than facial identity recognition as that is suggested to be a more suitable method for investigating the impact of lighting on interpersonal evaluations. 24 This is one element of an experiment previously reported, 25 where further details of the method can be found, but that report included only results from trials with a full-face view. That previous work also considered obstacle detection alongside FER to investigate the impact of multi-tasking; here, we report only the FER data.
2. Method
2.1 Apparatus
The experiment was set up in a single booth (Figures 3 and 4) as used in previous studies.25,26 The interior dimensions of the booth were 2090 mm in depth, 1200 mm in width and 1200 mm in height. The vertical surfaces and visible rear section of the ceiling were matt black. The surface of the floor (simulating a pavement for the obstacle detection task) was Munsell N5 matt grey. This has a diffuse reflectance of about 0.2 which is representative of pavement surfaces. The interior was viewable to the participants from the opening at the front of the booth, with a chin rest being used to maintain a constant viewing position during the experiment.
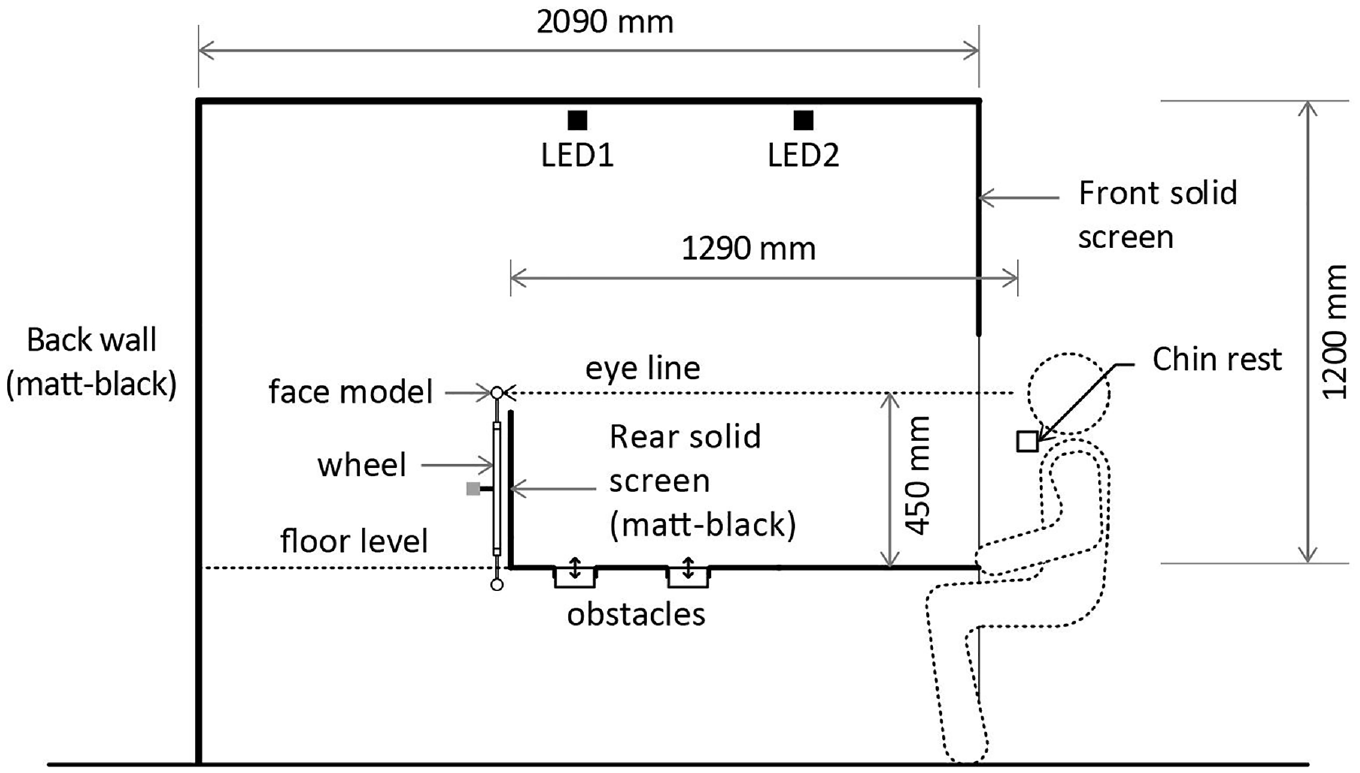
Side elevation of the apparatus
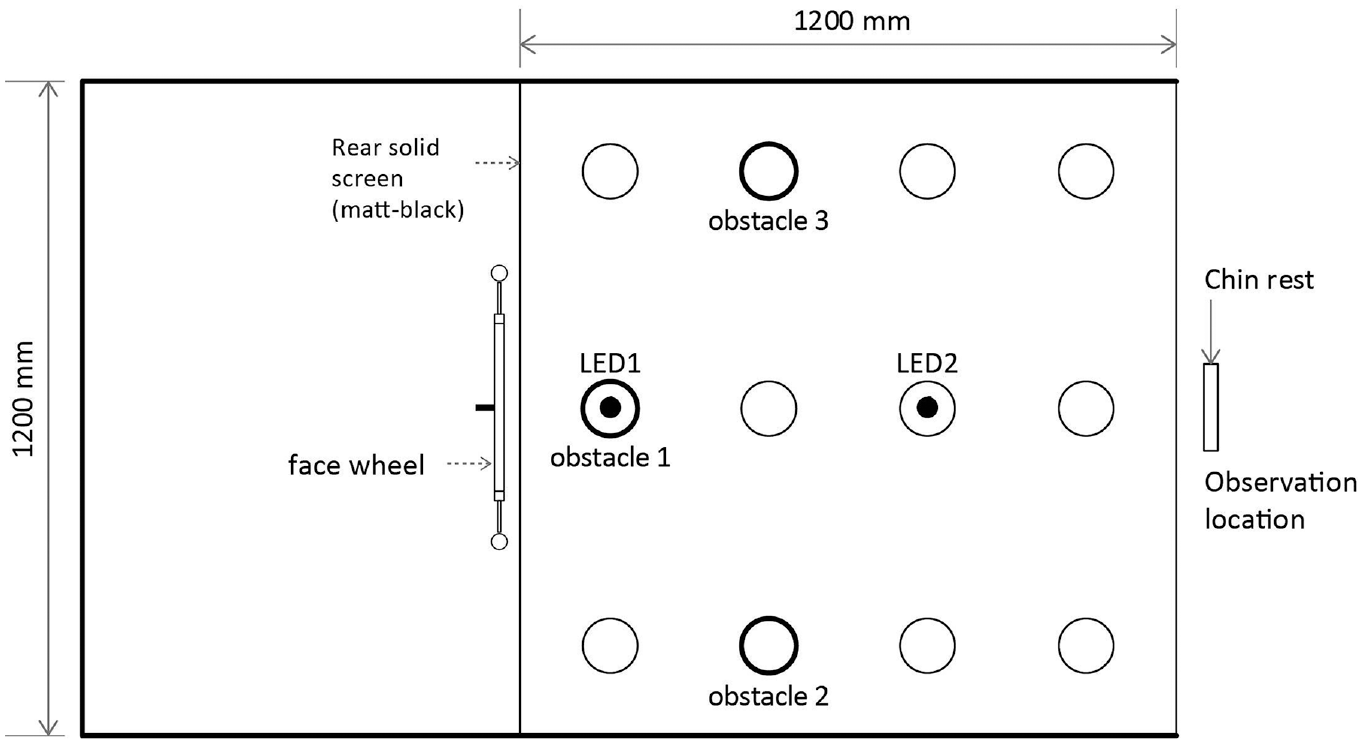
Plan view of the apparatus
A robotic wheel (diameter = 800 mm) with 16 turntable posts was installed behind the matt-black solid screen. The wheel was rotated by a brushless DC motor and 200:1 planetary gearbox, with precise feedback of the angular position via two continuous-rotation potentiometers. A Python program controlled the wheel to present a specific (or none) face for a given trial. The rear wall concealed the rest of the target faces, permitting the observer to see only one target face at a time, at eye level. The horizontal distance between the target face and the observation point was 1290 mm.
The test booth was lit from overhead by two identical tuneable arrays of RGBW LEDs (LED1 and LED2). A lens of diameter 45 mm and a diffuser (3 mm thick opal Perspex) in front of each array promoted colour-mixing, and a small tubular baffle (40 mm diameter, 35 mm long) constrained the light distribution. The two LED arrays were in alignment with the target face and the observation point. A vertical black screen above the participant blocked a direct view of the overhead luminaires. The lighting provided an S/P ratio of 1.6, a correlated colour temperature of 2750 K and chromaticity coordinates of x = 0.47, y = 0.41. Observers viewed the interior of the booth for 500 ms, with this being controlled using occlusion spectacles.
The complete experiment included four modes of target presentation: obstacle-only, face-only, obstacle and face simultaneously, and neither (a null condition). 25 To compare the percentages of correct identification of emotion for full-face and 3/4 views the current analysis used only data from the face-only trials.
2.2 Test variables
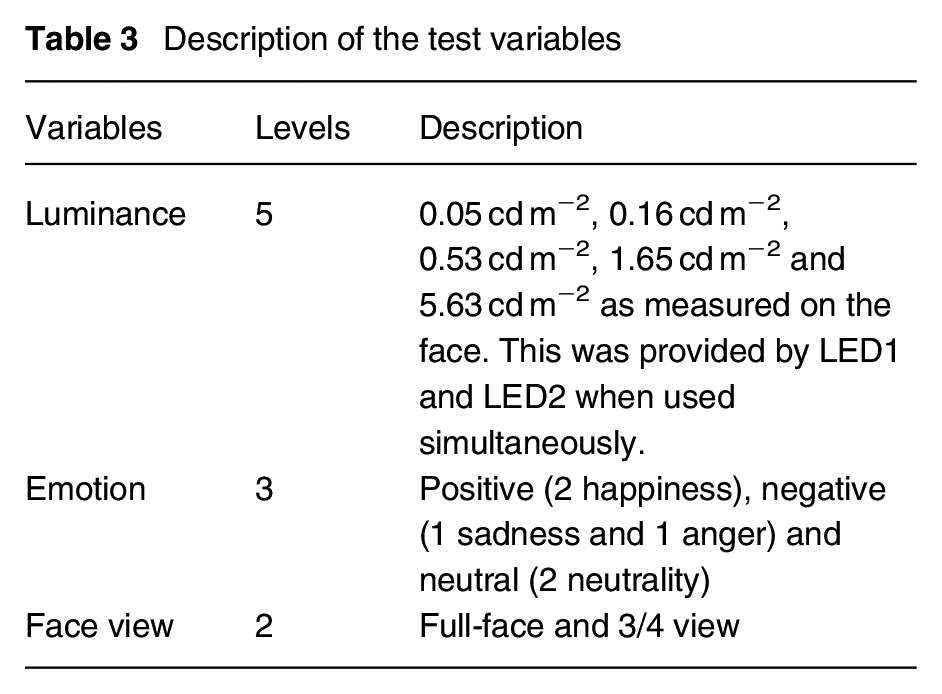
Three independent variables were included as shown in Table 3: luminance on the face, emotion portrayed by facial expression and face view.
Description of the test variables
The faces were 1:6 scale models of human heads, cast in light flesh-coloured resin with a reflectance of 0.78. The average face height (menton–sellion length) of these models was approximately 20 mm and the bizygomatic breadth about 23 mm. At the viewing distance of 1290 mm, this subtended a solid angle of 0.00028 sr at the eyes of the observer representing an interpersonal distance of approximately 8 m.
There were six different face models, varying by the emotion portrayed by facial expression. These were categorised as presenting either a positive emotion (i.e. happiness, with two face models), a negative emotion (i.e. anger or sadness, one model each) or neutrality (i.e. a neutral expression, with two face models) as shown in Figure 5. All face models used in this study comprised male Caucasian faces. The models were fixed on radial posts of the wheel. In addition to the models facing directly to the observer and thus presenting a full-face view, a small proportion of face models were rotated on the vertical axis by 45° to the left or right and thus presenting a 3/4 view (Table 4).
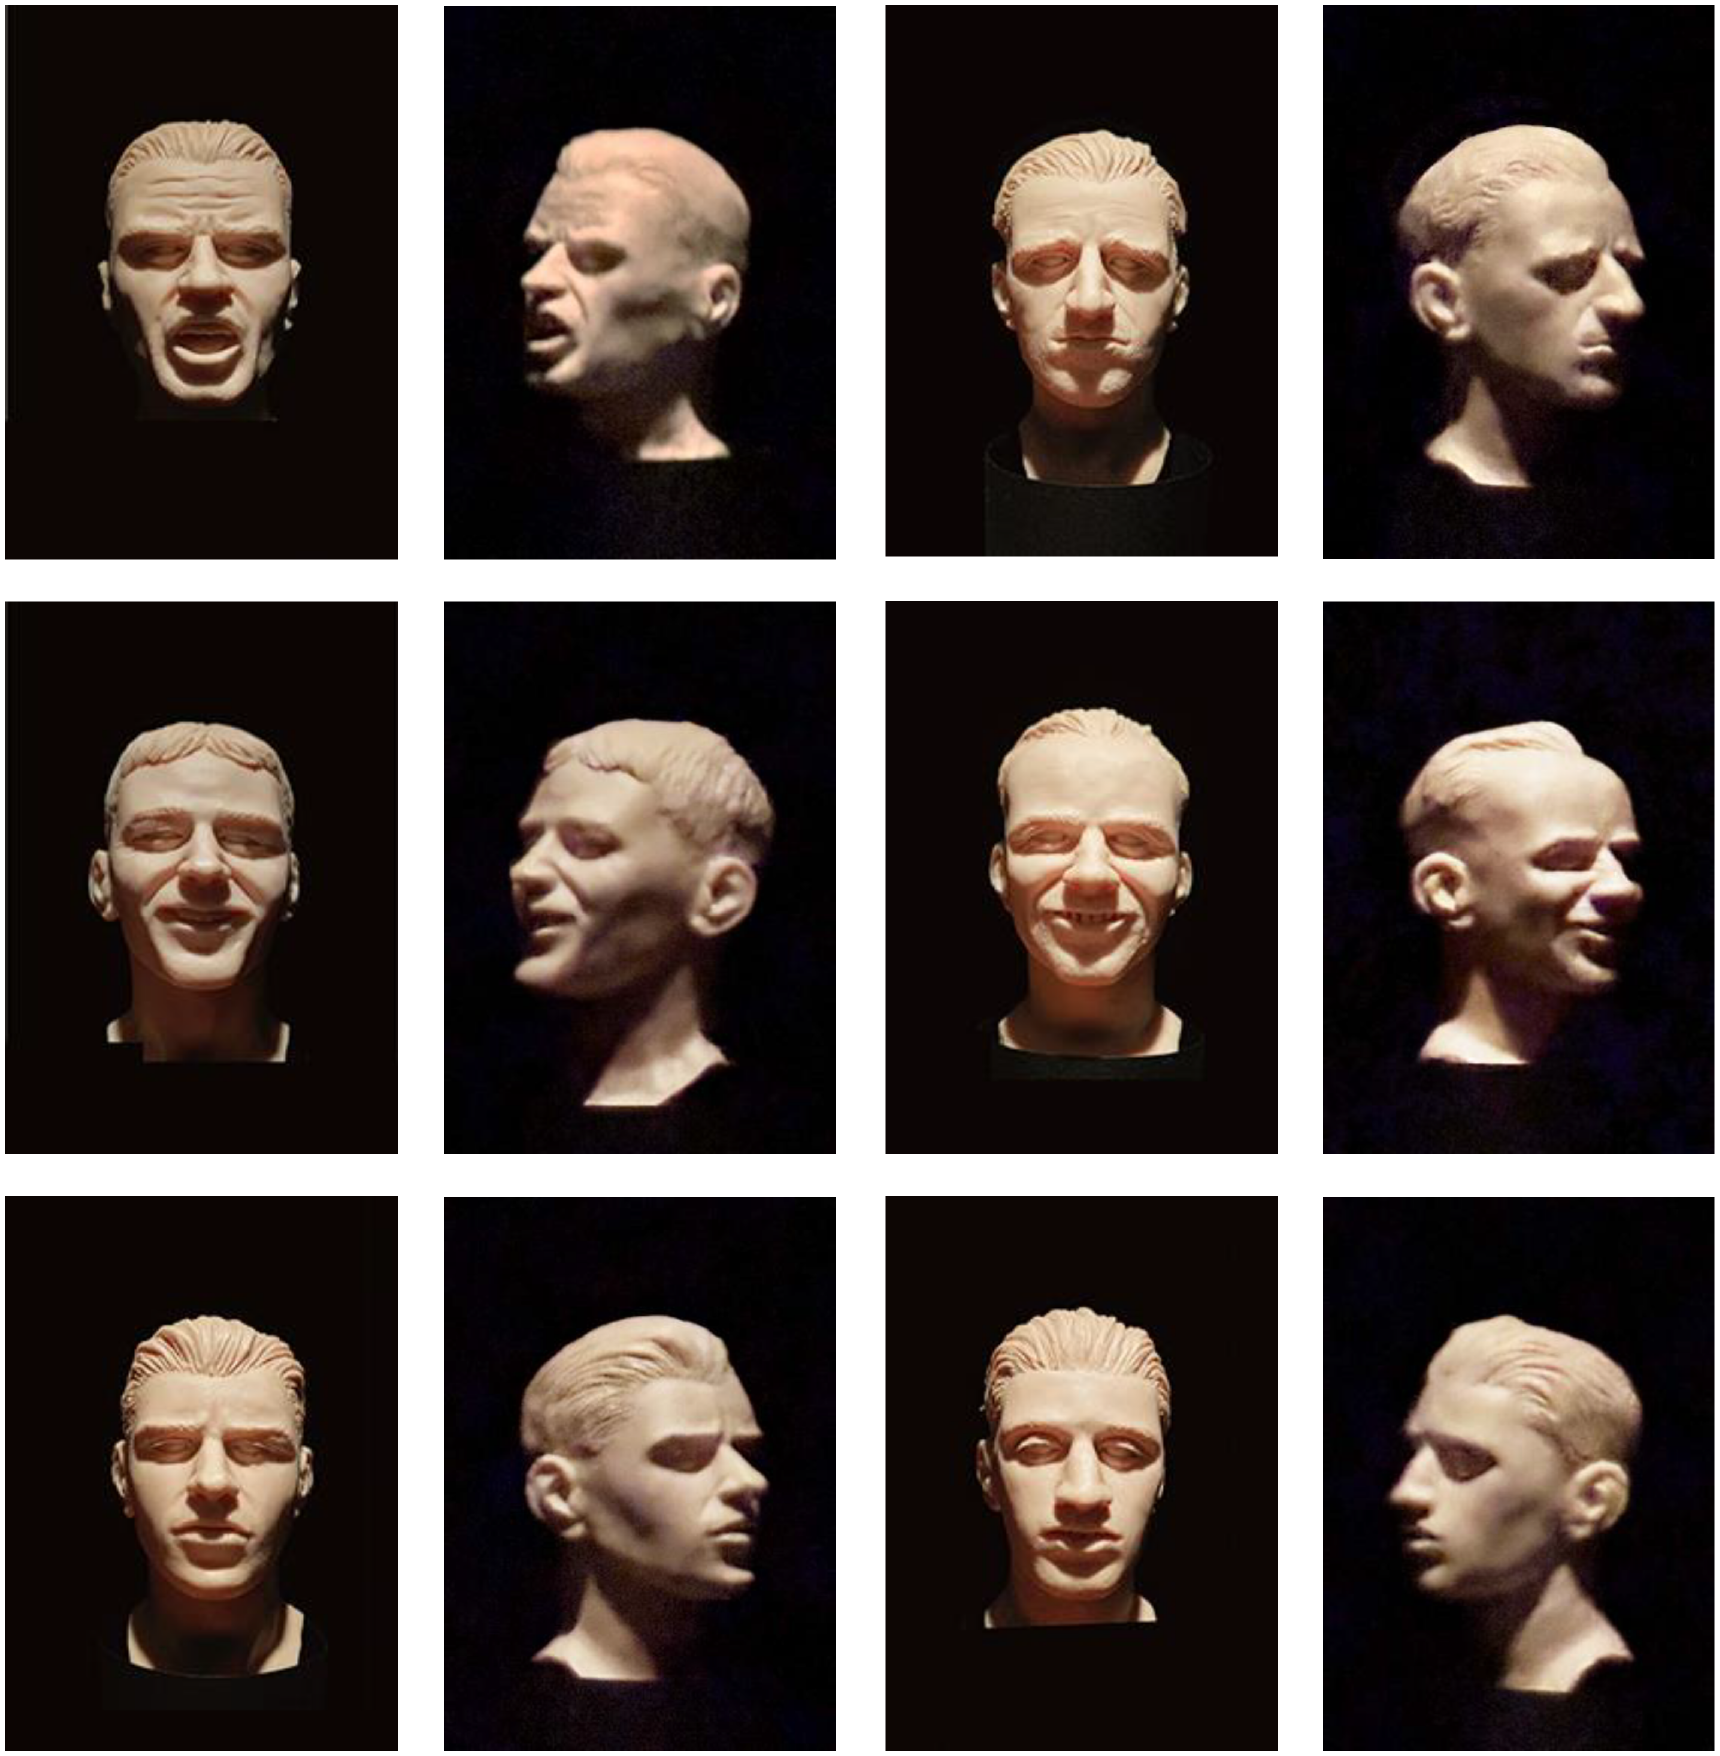
Photographs of the six face models in the full-face and 3/4-views used in trials – see Table 4
The numbers of directions faced by each expression model for trials within each light level block
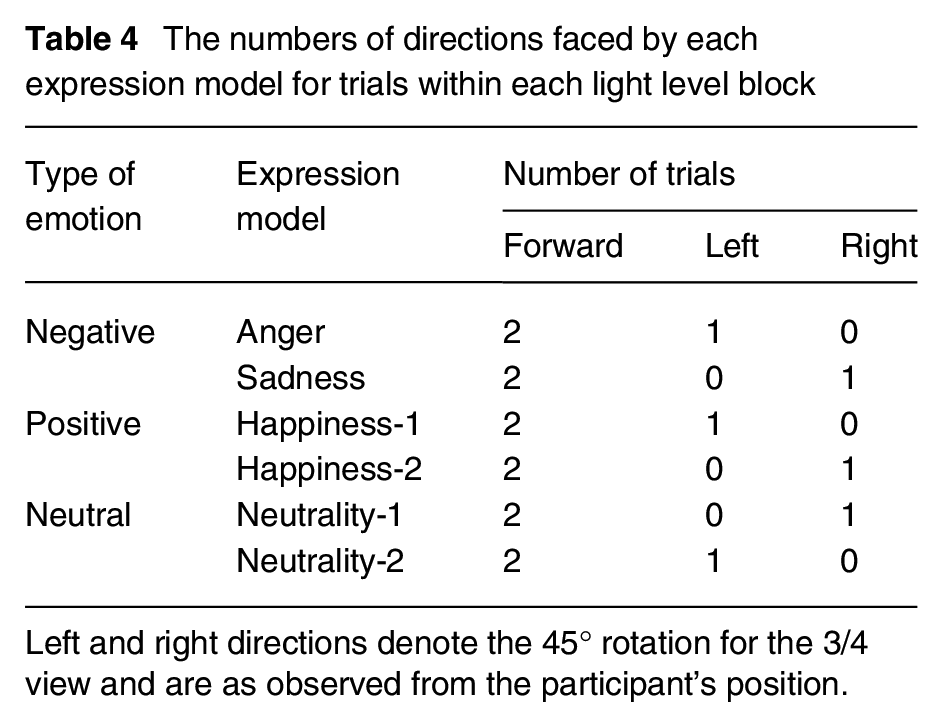
Left and right directions denote the 45° rotation for the 3/4 view and are as observed from the participant’s position.
Five luminances were used (0.05 cd m−2, 0.16 cd m−2, 0.53 cd m−2, 1.65 cd m−2 and 5.63 cd m−2), as measured on the face of the model. The mouth, brow and eye regions are commonly used to characterise facial contrast. 27 In the current experiment, the mean Michelson contrast between the mouth and the chin was 0.1 which is close to the data obtained from 151 Caucasian faces. 27
2.3 Test procedure
Thirty participants were recruited from the students in the School of Architecture of the University of Sheffield. All test participants were young, in the range of 17 years to 31 years, and the male–female gender was balanced. They received a small payment for taking part in this experiment. Ethical approval for this work was granted by the University’s ethical review board (No. 014272).
Before each test, participants gave informed, written consent agreeing to continue the experiment. Under a simulated daylight source (Verivide D65), normal colour vision and normal or corrected-to-normal visual acuity were confirmed. To ensure familiarity with the expressions, full-face photographs of each face model were shown to the participant, one by one, with these photographs stating also the emotion conveyed by expression. At this point, the laboratory lighting was switched off and the apparatus lighting switched on, to begin adaptation of the participant’s visual system to the conditions of the experiment. Over the next 20 min, the experimenter explained the procedure of the test and demonstrated the stimuli. The participants completed a practice run of 12 trials of FER under the 0.53 cd m−2 lighting condition (the middle luminance), with each of the six faces being presented twice, once in full-face and once in 3/4 view.
There were four steps in each trial: (1) with the occlusion spectacles in the closed state, the obstacle was raised/lowered to setting height (or not moved), the chosen face model was moved to the 12 o’clock position on the wheel (or this space left empty for no-face trials). (2) After a beep sound, the occlusion spectacles opened for 500 ms. In this duration, if they detected an obstacle, the participants pressed the corresponding button on a button box. If they saw a face model, the observer stated aloud the emotion. The response required was either happy, neutral, sad or angry, as appropriate. If neither a face nor an obstacle was seen, the participant did not respond. (3) The occlusion spectacles closed for around 4 s. The face model and the face wheel returned to the default position (no obstacle and face model presented). The lighting inside the booth was changed to that to be used in the following trial. (4) The occlusion spectacles reopened for 4 s to assist the participants in relocating the face model position and adapt to the new lighting condition. The spectacles were then closed again, signalling the start of the next trial.
There were 310 trials in total, including combinations of three obstacle locations, five obstacle sizes, six face models and null conditions. The presentation orders were randomised. To reduce participant fatigue, a 5-min break was offered after every block of 42 trials (which took approximately 15 min to complete). Overall, the experiment took approximately 2 h to complete for each participant, including introductions, adaptation, practice, testing and debriefing.
For this analysis we consider only those trials where a face was presented and omit those where an obstacle was presented, either alone or in combination with a face, and null condition trials. For these FER-only trials, each participant carried out 18 trials in each lighting condition. All six face models were presented, once in 3/4 view and twice in full-face view. For the 3/4 view models, within each type of emotion, the number of facing directions were balanced, one facing to left and one facing to right (Table 4). For analyses, the angry and sad face models were combined as negative emotions. Doing so balanced the number of trials with negative, positive and neutral emotions.
As noted in Table 4, the 3/4 view for a specific face model was directed to either the left of to the right, but not both. This was done to simplify the apparatus set up. In further work, we would recommend these directions are better balanced to offset any position bias.
3. Results
The dependent variable is the rate of correct FER identification. The data were suggested to be normally distributed by visual inspection of the histogram and box plots, checking kurtosis and skewness, and conducting Shapiro–Wilk tests. The standard alpha level of 0.05 was used for all statistical tests. The values produced from the following tests were corrected by Holm–Bonferroni adjustment to counteract the error of multiple comparisons. 28
The three main variables were facial emotion, face view and face luminance (Table 3). An ANOVA test revealed a significant effect of all three variables (p < 0.001) on FER detection (Table 5). Interactions between luminance × emotion and between luminance × emotion × face view were suggested to be significant. Interaction between emotion and face view was near significant but interaction between luminance and face view was not suggested to be significant.
Results of three-way ANOVA test of percentage correct identification of emotion on FER, with luminance, emotion type and face view as independent variable and percentage correct identification of emotion as the dependent variable
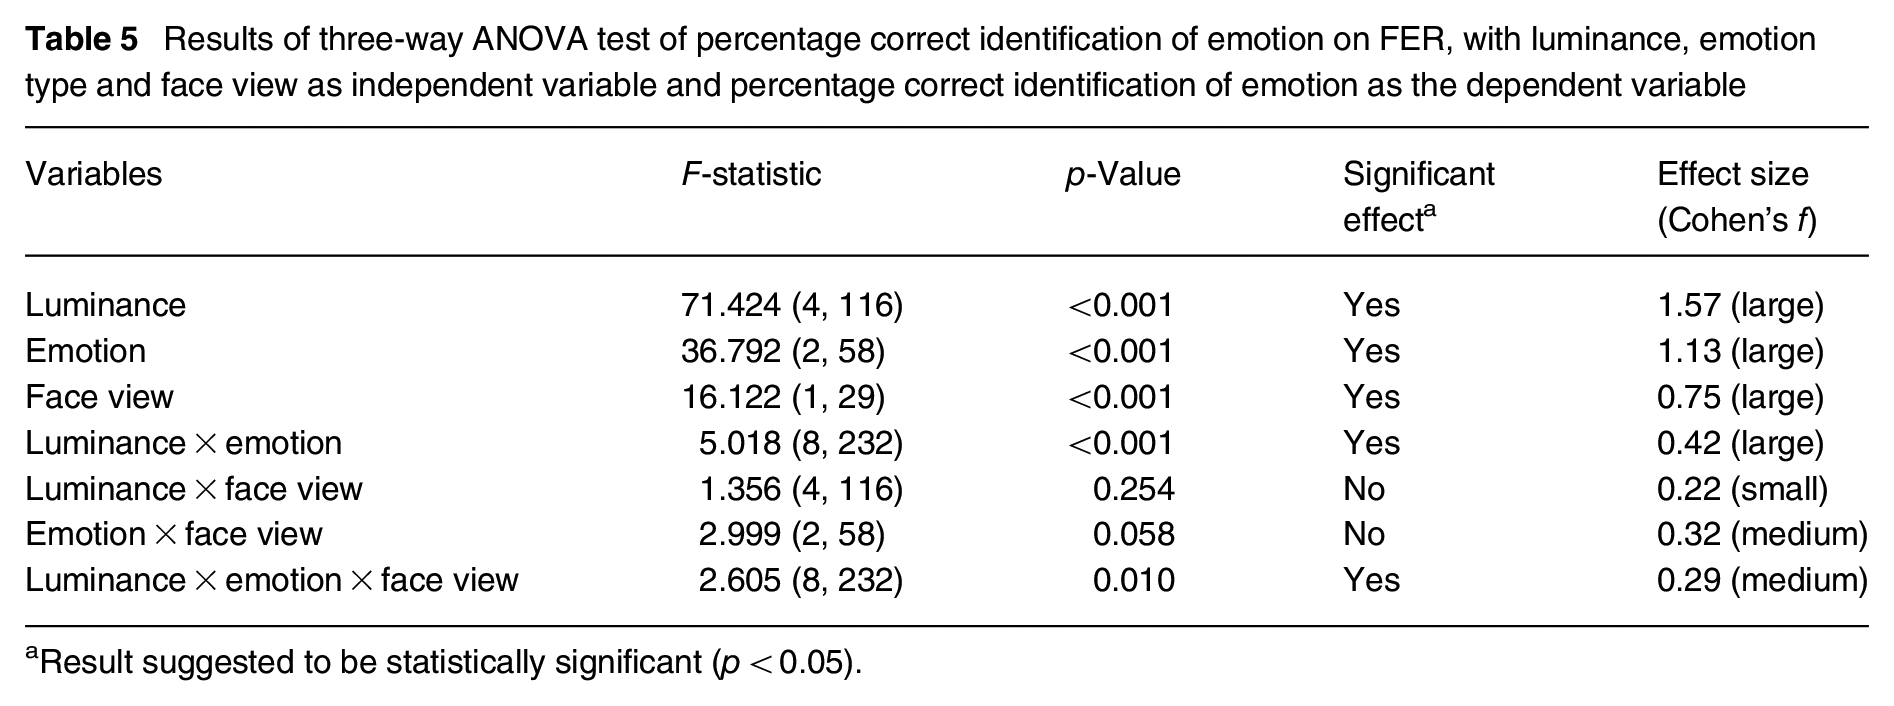
Result suggested to be statistically significant (p < 0.05).
The percentage correct identification of emotion increased as the face luminance increased, reaching a plateau at around 0.53 cd m−2 (Figure 6). Paired t-tests suggested that the percentages of correct identification of emotion at luminances of 0.05 cd m−2 (mean = 71.6%, SD = 6.8%) and 0.16 cd m−2 (mean = 79.2%, SD = 7.9%) were significantly lower than at the luminances of 0.53 cd m−2 (mean = 87.1%, SD = 7.1%) and above (p < 0.001 in all cases; Table 6). The difference between 0.53 cd m−2, 1.65 cd m−2 (mean = 89.3%, SD = 6.9%) and 5.63 cd m−2 (mean = 90.0%, SD = 6.4%) were not suggested to be significant (p > 0.061).
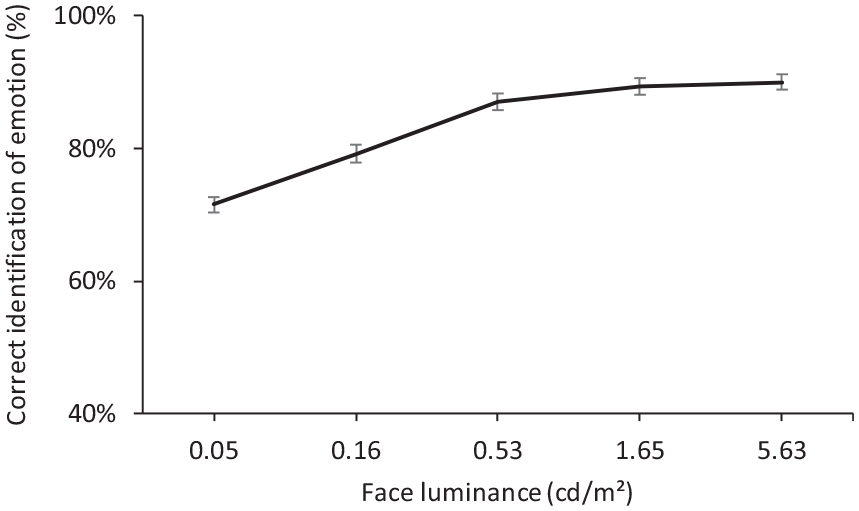
The effect of face luminance on percentage correct identification of emotion. Error bars show the standard error of the mean
Post hoc paired sample t-test with Holm–Bonferroni correction for percentage correct identification of emotion under five light levels
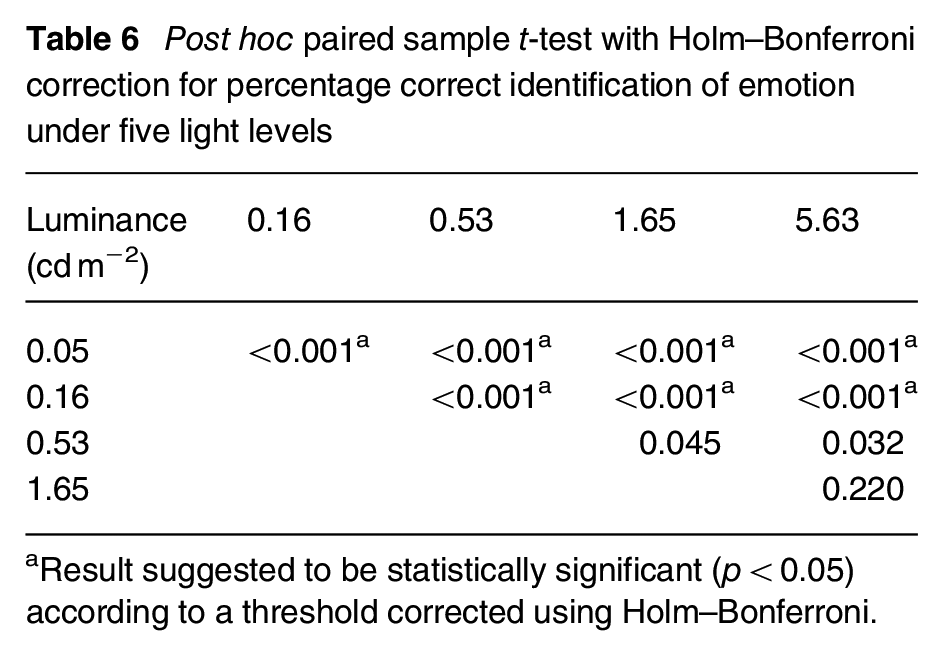
Result suggested to be statistically significant (p < 0.05) according to a threshold corrected using Holm–Bonferroni.
Paired t-tests suggested a significant difference between all three pairings of positive, negative and neutral facial expressions (p ≤ 0.003). Neutrality had the highest percentage correct identification of emotion (mean = 81.4%, SD = 11.3%), followed by positive (mean = 71.7%, SD = 9.7%), with the negative expression being the hardest to recognise (mean = 65.1%, SD = 12.1%; Figure 7). One explanation for the lower identification of negative emotions is that this consisted of two responses, anger and sadness, rather than the single responses for the positive (happy) and neutral emotion categories, and thus introduced greater potential for confusion with other emotions. During post-trial debriefing, participants commented that it was difficult to discriminate between the sad and neutral expressions: the results reveal that in 37% of trials where the sad face was presented it was identified as neutral.
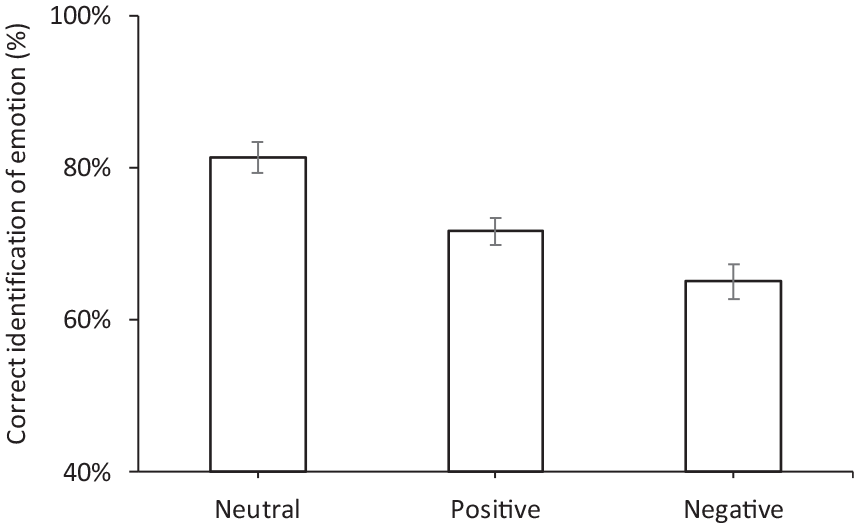
The percentage correct identification of emotion of four different facial expressions. Error bars show the standard error of the mean
Correct recognition of emotion for the 3/4 view face was significantly lower (p < 0.001, mean = 67.3%, SD = 11.5%) than for the full-view face (mean = 87.4%, SD = 4.7%; Figure 8).
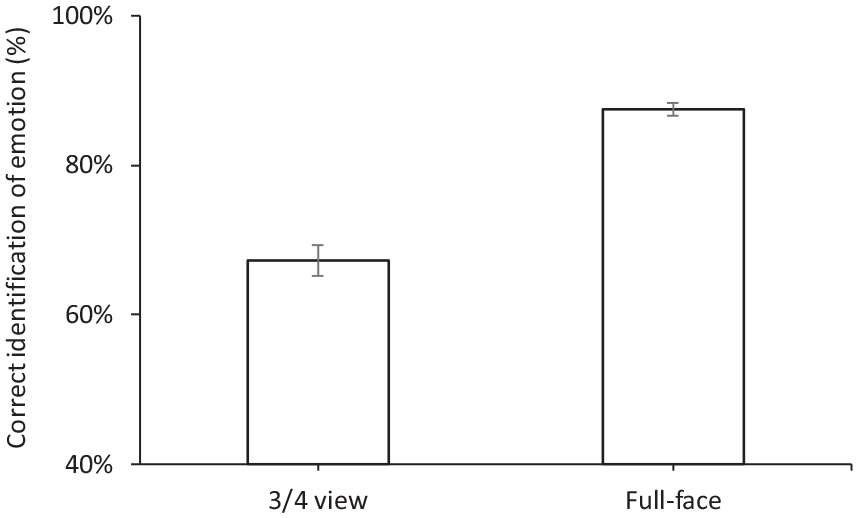
The percentage correct identification of emotion when facing forward and rotated to left/right. Error bars show the standard error of the mean
One significant interaction was between face luminance and emotion (p < 0.001). As shown in Figure 9, FER increased with increasing luminance for all faces, but the rate of increase with luminance was not consistent across emotion types. At the lower light levels (≤0.16 cd m−2), the neutral expressions were recognised significantly better than the other emotions (p ≤ 0.001). The positive and negative emotions did not suggest a significant difference in percentage correct identification of emotion (p = 0.022 under 0.05 cd m−2, p = 0.310 under 0.16 cd m−2). When the luminance was 0.53 cd m−2 or higher, the negative expressions had significant lower percentages for correct identification of emotion compared with the other two emotions (p ≤ 0.009). The differences in identification between positive and neutral expressions were not suggested to be significant (p > 0.05 for all luminances).
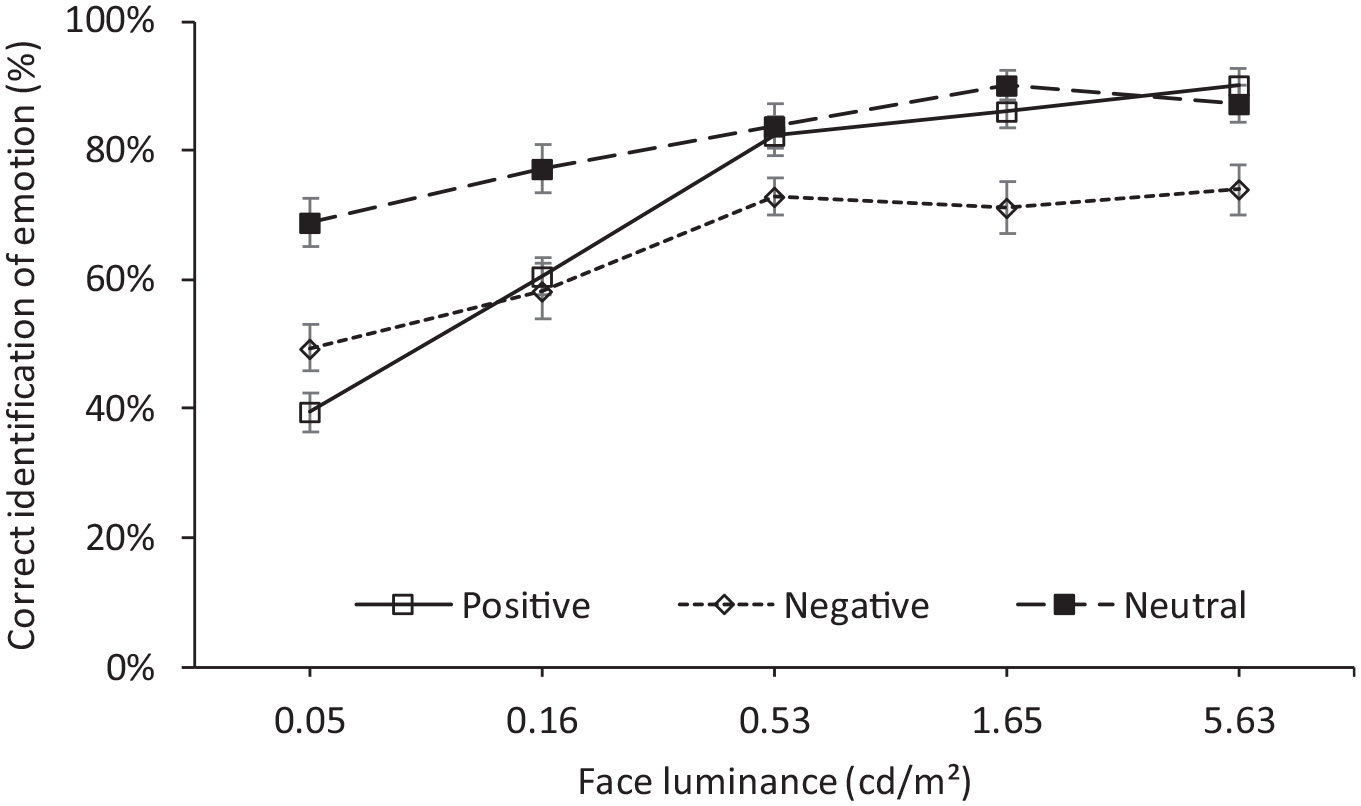
FER rate for positive, negative and neutral expressions. Error bars show the standard error of the mean
The interaction between luminance, emotion and face view was also suggested to be significant (Table 5). Figure 10 repeats Figure 9 but with separate curves for the two face views. This shows that while full-face views tended to lead to a higher percentage correct identification of emotion than did the 3/4 view at all luminances, this was reversed for certain cases (neutral emotion at 0.05 cd m−2 and 0.16 cd m−2, positive emotion at 0.53 cd m−2 and negative emotion at 1.65 cd m−2), but these differences were not suggested to be statistically significant.
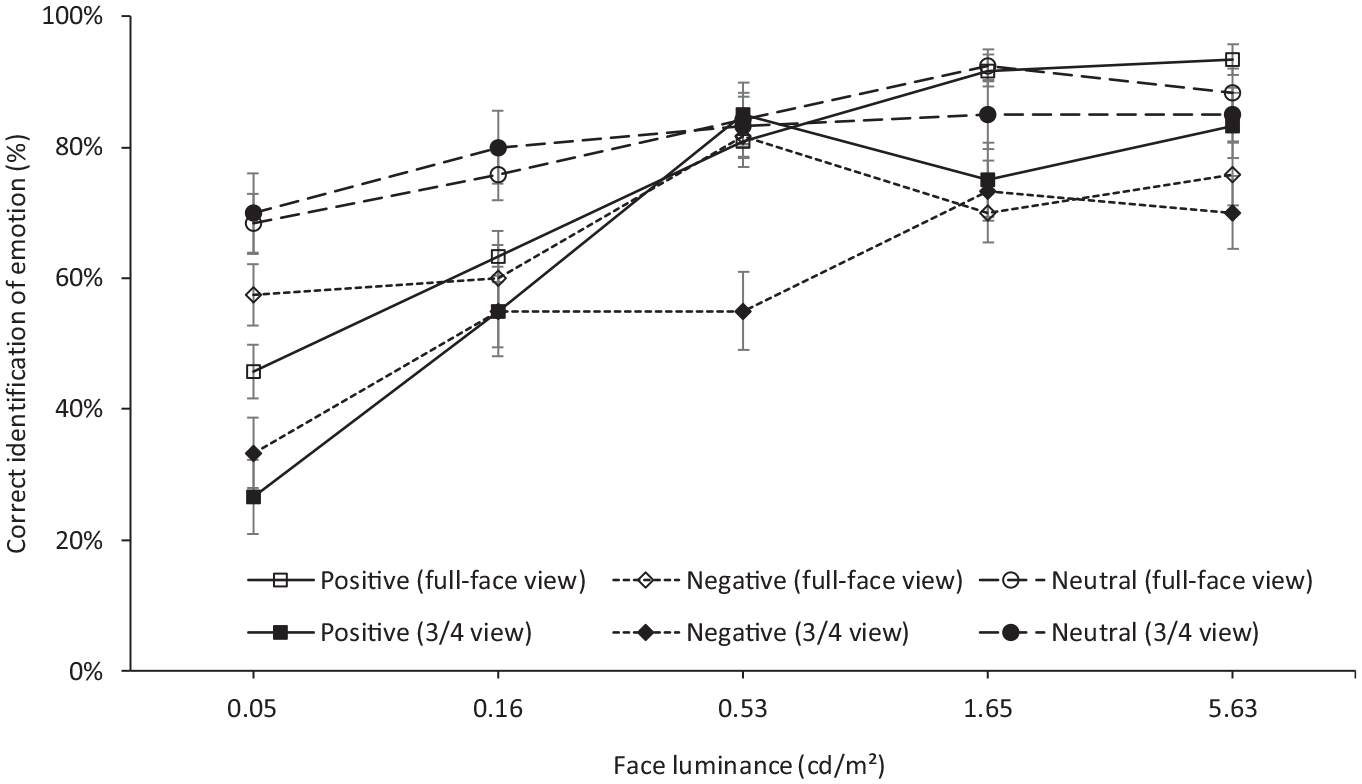
FER rate for positive, negative and neutral expressions in full-face and 3/4 views. Error bars show the standard error of the mean
Given that the 3/4 view generally leads to a lower rate of correctly detecting emotion as portrayed by facial expression than does the full-face view, the interaction of concern would be whether the impaired ability to recognise emotions when seen in 3/4 view was mitigated by higher luminance: this was not suggested to be significant (Table 5). On one hand, this means that conclusions drawn about the effect of changes in luminance on FER using full-face views are applicable to the 3/4 view. On the other, it means that conclusions drawn using only full-face views overestimate FER performance, which would be of relevance if light levels were established to provide an expected level of performance.
4. Conclusion
Although pedestrians tend to view other people from a range of orientations, previous research on lighting and the ability to make facial evaluations about other people has tended to use only a full-face view. An experiment was conducted to compare the ability to recognise emotion portrayed by facial expressions with full-face views and 3/4 views.
The 3/4 view resulted in a lower rate of correct emotion recognition than did the full-face view. The results did not suggest an interaction between luminance on the face and view of the face: in other words, higher luminance did not mitigate the impaired identification of faces seen in 3/4 view – the lower rate of correct recognition is retained across all luminances.
A preliminary comparison of full-face view and 3/4 view face evaluations made using RVP suggested that the 3/4 view could lead to a slightly reduced visual performance but that depended on the assumed width of the face in 3/4 view and hence the details assumed to inform the emotion recognition evaluation. Further work would be needed to establish the specific facial features used when making FER judgements and hence the size of details used in an RVP analysis.
If FER is accepted as an important factor in the setting of light levels, then the current work suggests one issue requires further consideration. This is that the emotions of faces of darker skin tone are not as easily identified as for faces of lighter skin tone, so requiring higher luminances to approach the same degree of recognition. As noted before, 21 previous studies have tended to consider only faces of lighter skin tone.
Footnotes
Appendix A
Facial measurements
| Face number | Age | Gender | Face height (menton–sellion length, mm) | Face width | ||
|---|---|---|---|---|---|---|
| Full-face: bizygomatic breadth (mm) | 3/4 view: nose to tragion (mm) | 3/4 view: nose to ectocanthus (mm) | ||||
| 1 | 31 | Female | 120 | 141 | 126 | 67 |
| 2 | 32 | Male | 124 | 145 | 130 | 81 |
| 3 | 33 | Female | 121 | 141 | 132 | 65 |
| 4 | 60 | Female | 112 | 139 | 121 | 65 |
| 5 | 30 | Male | 129 | 142 | 142 | 79 |
| 6 | 28 | Female | 112 | 125 | 146 | 69 |
| 7 | 29 | Female | 116 | 142 | 128 | 63 |
| 8 | 32 | Male | 118 | 146 | 133 | 62 |
| 9 | 29 | Male | 128 | 145 | 132 | 79 |
| 10 | 31 | Male | 126 | 144 | 131 | 80 |
| Mean | 120.6 | 141.0 | 132.1 | 71.0 | ||
All models were of Chinese origin.
Declaration of conflicting interests
The authors declared no potential conflicts of interest with respect to the research, authorship, and/or publication of this article.
Funding
The authors received no financial support for the research, authorship, and/or publication of this article.