
Abstract
A field study in the urban area of Ljubljana, Slovenia, explored the impact of variations in lighting parameters on pedestrian perceptions of safety, visual comfort and risk. Utilising the day-dark approach with 35 participants, this research evaluates differences in perception under daytime and after dark (but with road lighting) environments to determine the optimal lighting conditions. The results suggested that a minimum horizontal illuminance of 1.8 lx, corresponding to a day-dark differential of 0.5 on a 5-point scale, and a minimum luminance of about 0.15 cd m−2 were optimal for perceived safety and comfort. The results suggest that minimum illuminance provided a more effective predictor of pedestrian reassurance than did the other lighting parameters considered.
1. Introduction
After dark, road lighting plays a crucial role in enhancing visibility and supporting visual comfort and pedestrian reassurance.1–5 The proper design, installation and maintenance of road lighting is key to mitigating the risk of accidents, such as trips and falls, attributable to inadequate visibility. 6 It aids in the identification and detection of potential trip hazards, road signs and the facial expressions of other road users,7,8 thereby facilitating the discernment of surrounding details and colours, enhancing visual processing speed and visibility distance 6 and instilling a heightened sense of security among individuals potentially vulnerable to personal attacks or the fear of crime.9–12
The current work is an investigation of pedestrian reassurance. Previous work 3 has raised shortcomings of the standard methodology for pedestrian reassurance in which participants rate their perception of reassurance only in road lighting 3 ; these flaws encompass stimulus range bias, an inclination to neglect non-lighting factors, and the complexity of fully grasping the varied requirements of average pedestrians. To counter these issues, Boyce et al. 13 proposed the day-dark approach, later implemented by Fotios et al. 3 In the day-dark method, participant assessments of reassurance are gathered during both daylight and after dark at the same locations, utilising the difference between day and dark evaluations as a measure of the reassurance benefit gained by lighting. By assessing the same locations under both conditions, the day-dark method reduces the influence of environmental discrepancies, thereby offering a more accurate depiction of the contribution of road lighting. Optimal lighting conditions are those which minimise the day-dark difference. Fotios et al. 3 reported that a day-dark difference of 0.5 on their 6-point rating scale correlated with a minimum horizontal photopic illuminance of roughly 2.0 lx, and that minimum illuminance was a better indicator of reassurance than average illuminance.
This study concentrates on the relationship between horizontal illuminance and public space safety perceptions. However, it is crucial to acknowledge that additional factors also play a significant role in shaping these perceptions. These include the spectral power distribution and spatial distribution of lighting,14–19,20 the presence of open and green spaces, accessibility to shelters as environmental physical features21,22 and the overall maintenance quality of the neighbourhood.23–25 Moreover, personal attributes such as gender,4,5,26,27 age,4,5,27 income, 28 cultural background5,27 and even the time of day or season can influence pedestrian behaviour. 29 Despite the significance of these elements, they fall outside the scope of this investigation. The focus of this paper is to present the outcomes of a field experiment that utilised the day-dark approach to explore pedestrian reassurance. Specifically, the study aimed to answer two questions:
What is the optimal horizontal illuminance for pedestrian reassurance?
Does minimum illuminance serve as a better predictor of reassurance than does average illuminance or uniformity?
2. Method
2.1 Experiment locations
Reassurance was assessed reassurance across 12 locations (designated as L1 to L12) along a 3.5 km path in Ljubljana, Slovenia, in April 2022. The locations spanned various urban functional areas, incorporating diverse lighting facilities, including different types of lamps, optics, the height and spacing of lampposts, and covered urban main roads, secondary roads, residential areas, underpasses, campus areas, parking lots and commercial zones. All locations featured well-maintained road surfaces and surroundings without any malfunctioning or damaged man-made lighting fixtures, as observed during the study. Figure 1 illustrates the 12 locations, where the pavement material was consistently light grey asphalt, except for L3, which utilised light grey cement bricks. Participants assessed all 12 locations using a repeated measures design, evaluating locations L1 to L12 sequentially, in either the forward or reverse order, walking from location to location.
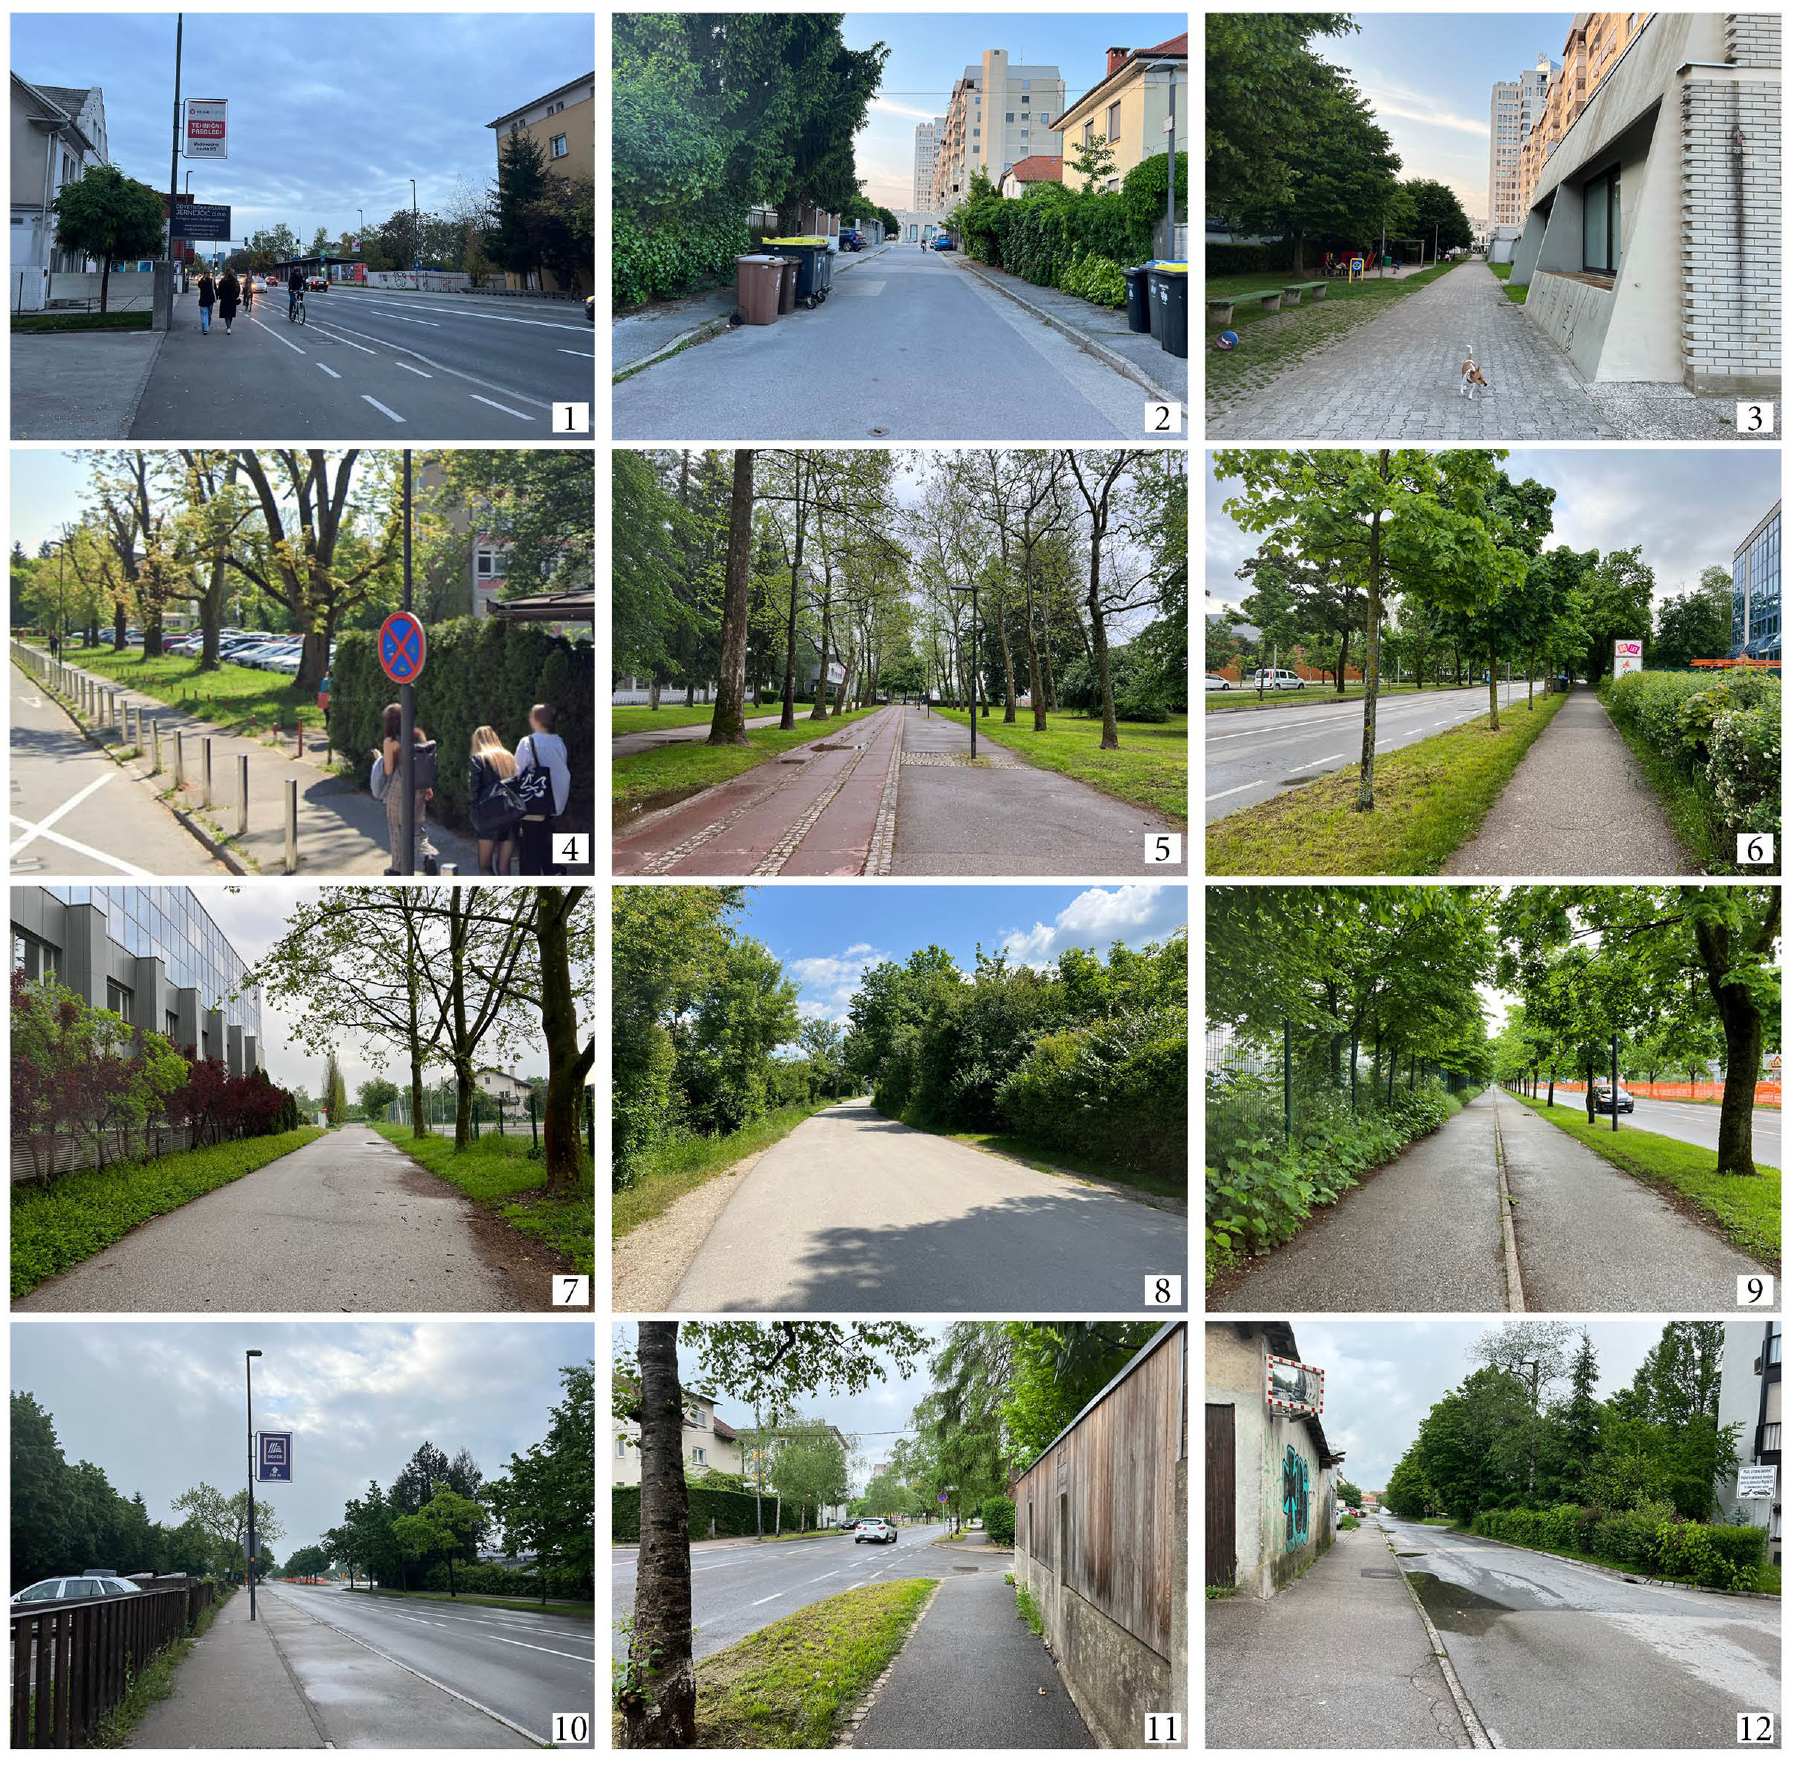
Daytime photographs of evaluation locations for reassurance assessment
2.2 Lighting measurement
Lighting characterisation at each site involved measurements of horizontal illuminance and road surface luminance. Luminance measurements were taken with Imaging Luminance Measurement Device positioned at a height of 1.6 m and approximately 15 m from the nearest lighting pole. Ground-level illuminance was measured using a calibrated LMT illuminance meter (model B360), applying a 10 × 3 grid on the pedestrian path in accordance with the EN 13201:2015 standard for vehicle paths. 30 The spacing between lighting poles did not exceed 30 m at any location. These measurements facilitated the calculation of mean, maximum and minimum illuminance and luminance values, as well as uniformity.
Table 1 describes the lighting conditions at these locations. Average illuminances ranged from 0.1 lx in L8 which was unlit and therefore illuminated only by moonlight, to 17.2 lx at L1 which is a main road. Light sources were either high-pressure sodium (HPS) or LEDs, with correlated colour temperatures (CCTs) spanning from 1850 K to 4800 K, colour rendering index ranged from 11 to 86, both parameters were measured with a calibrated spectrometer (UPRtek, model MK350S Premium).
Characteristics and lighting parameters of road locations: location (L1 to L12), average illuminance (Eave), minimum illuminance (Emin), maximum illuminance (Emax), illuminance (E), average luminance (Lave), minimum luminance (Lmin), maximum luminance (Lmax), CCT and colour rendering index (Ra)
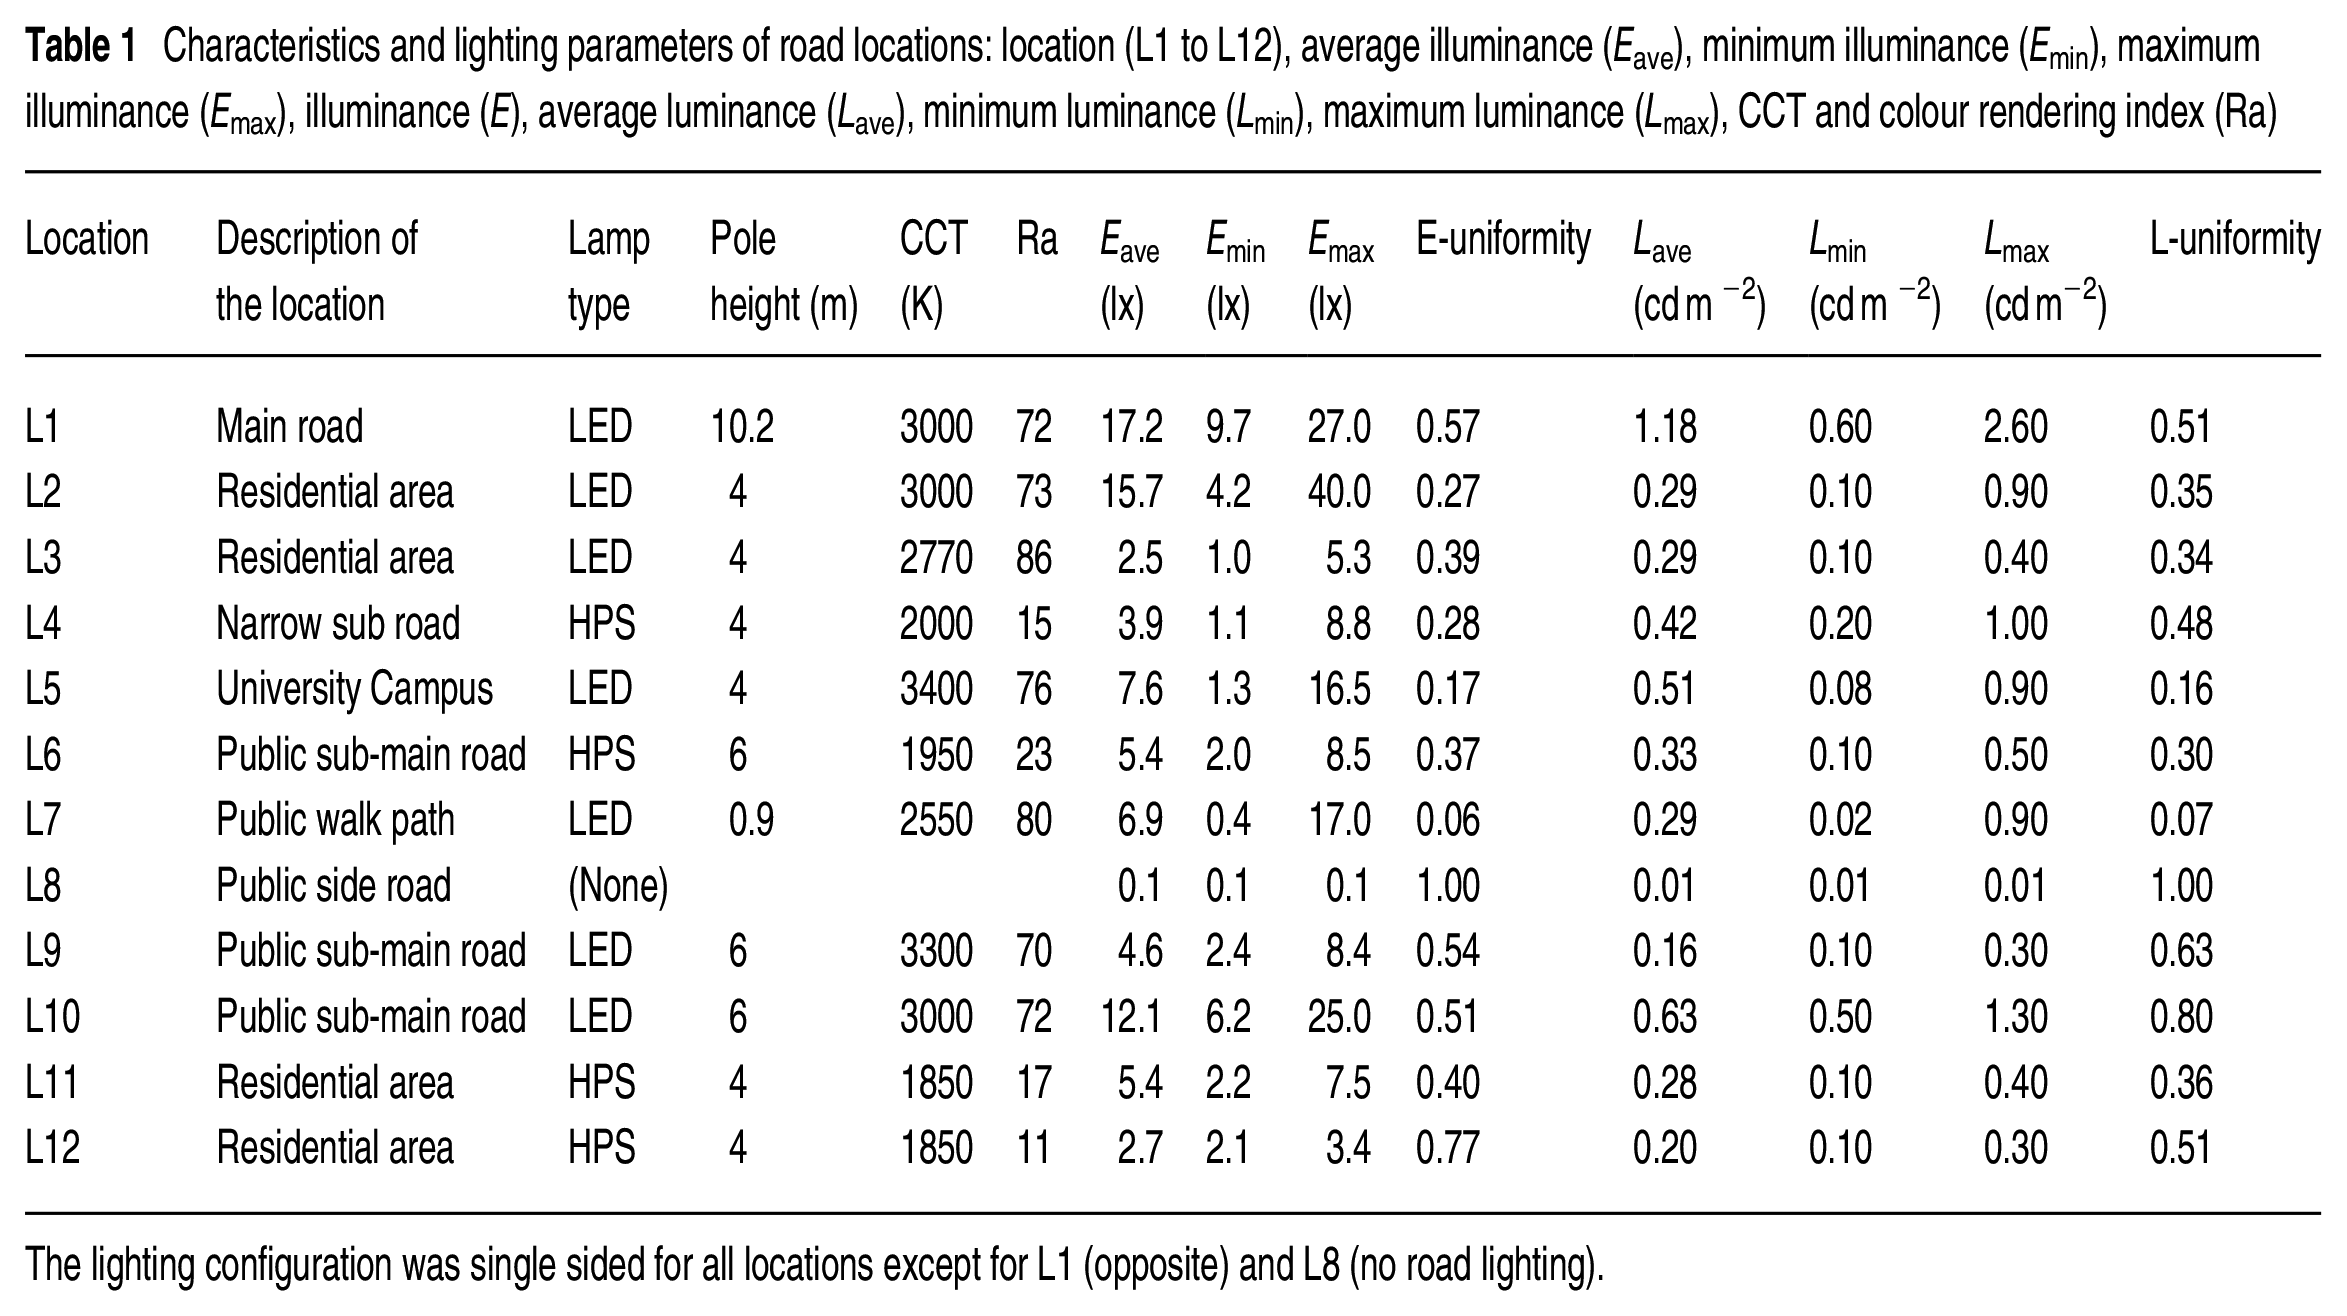
The lighting configuration was single sided for all locations except for L1 (opposite) and L8 (no road lighting).
2.3 Participants
Thirty-five participants were recruited for the experiment, each completing the assessment at all 12 locations during both daytime and darkness. The group consisted of 31 males and 4 females, with ages ranging from 20 years to 45 years. All participants reported having normal or corrected-to-normal vision and were sourced from the Faculty of Electrical Engineering at the University of Ljubljana, Slovenia.
This study received approval from the Ethics Committee of the University of Ljubljana. Prior to their participation, each participant provided written consent to adhere to the ethics clause. Participation was voluntary, with no compensation provided to the participants.
2.4 Survey questions and procedure
The questionnaire was divided into three parts. The initial section collected personal information, including gender, age, habits and a self-assessment of the respondent’s confidence level concerning potential crimes, specifically asking, ‘How confident do you feel in protecting yourself against crimes occurring during dark times?’ This section was completed before the experiment commenced. During the introductory session, the questionnaire was explained to participants in each group. Specifically, it was clarified that the term ‘safety’ pertained to the cognitive aspect of safety, such as traffic safety and safety from falling, whereas ‘comfort’ related to the sensation of visual comfort, and ‘risk’ was associated with the potential threat of crime.
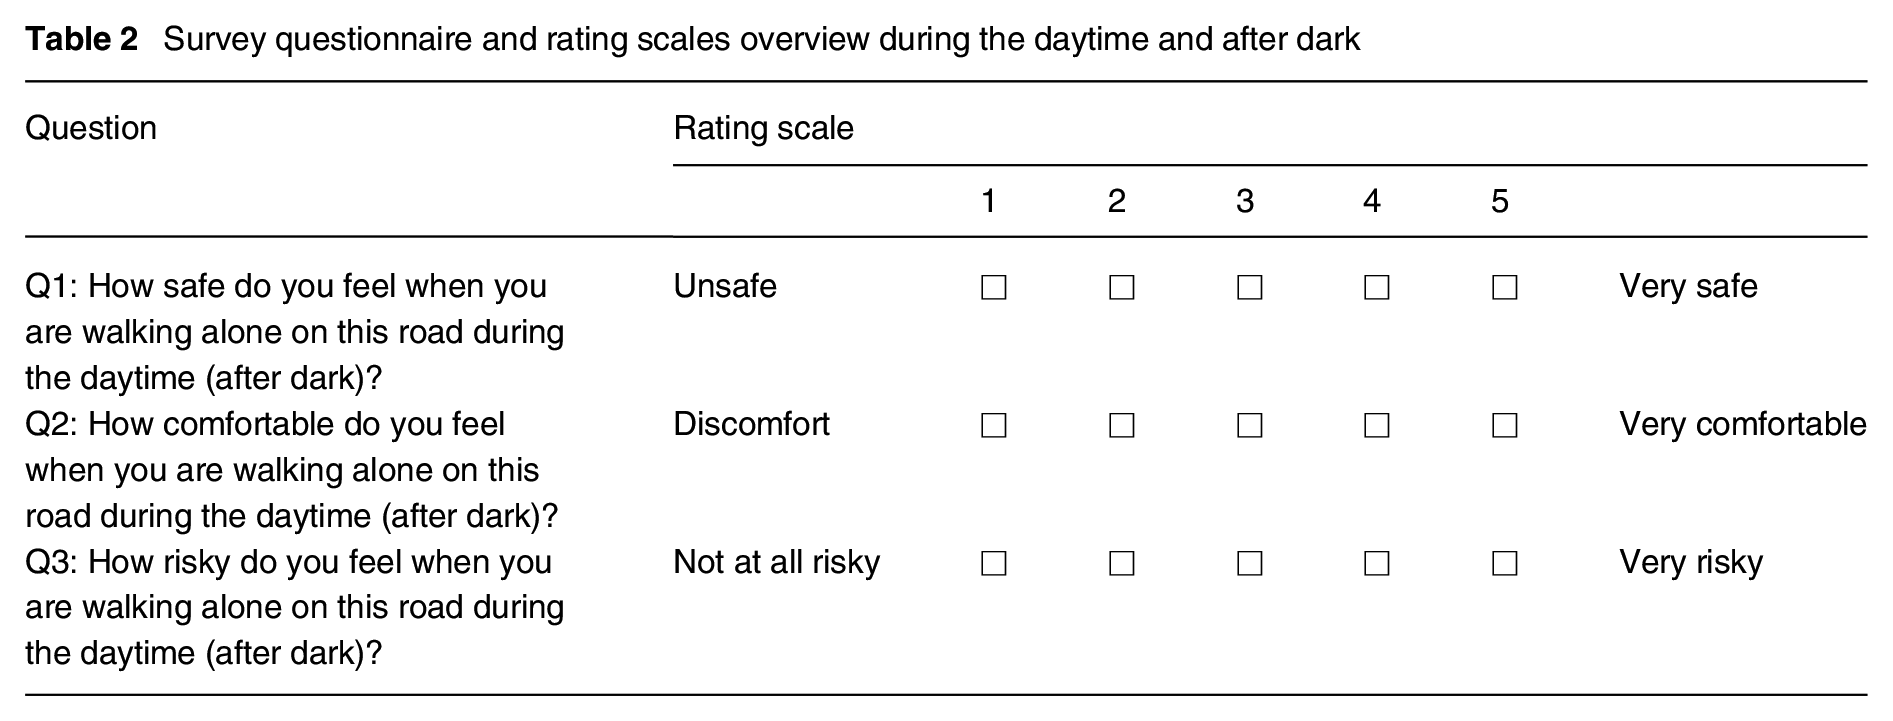
The second and third sessions of the questionnaire were conducted during daylight and darkness, respectively, forming the core part of the survey with three questions addressing safety perception (Q1), comfort (Q2) and the sense of potential criminal risk (Q3). Half of the participants began their evaluations in daylight, transitioning to darkness, whereas the other half started with after dark sessions before moving to daylight. Responses were captured on a 5-point scale, with higher ratings in questions 1 and 2 indicating better (safer, more comfortable) outcomes, whereas for question 3, a higher rating denoted a perception of increased risk. The survey questions are shown in Table 2. It was administered in paper format and conducted in Slovenian: the original language version is shown in Supplemental Material.
Survey questionnaire and rating scales overview during the daytime and after dark
The experiment took place in April 2022, following method established by Boyce et al. 13 and Fotios et al. 3 Participants, grouped in clusters of five to seven and led by a tutor, walked the route twice during working days: once in daylight, between 12.00 and 16.00, and once in darkness, 21.20 and 23.30, after the end of civil twilight. The sequence of lighting conditions (daytime or after dark) and walking direction (clockwise or counter clockwise) was systematically varied to ensure balance. Evaluations were conducted at points situated between two lighting poles, where participants were instructed to spread out, briefly observe their surroundings and then provide their ratings. A survey session, encompassing all 12 locations, lasted approximately 75 minutes.
The experiments were carried out under similar weather conditions across all groups, featuring windless, sunny days and dark evenings illuminated by moonlight.
3. Results
3.1 Daytime and darkness rating results
This study evaluated the variation in ratings between daytime and after dark conditions by comparing paired results. The dataset, outlined in Table 3, encompasses 420 values for each location, derived from 35 participants across the 12 locations. A paired-sample t-test revealed statistically significant differences in ratings between daytime and after dark conditions across all locations, based on the average responses to multiple questions. Specifically, the sense of safety was notably lower in darkness (M = 3.80) compared to daytime (M = 4.32, p < 0.0001), comfort ratings decreased in darkness (M = 3.75) from those in daylight (M = 4.26, p < 0.0001), and risk perception was higher in darkness (M = 1.87) than in daytime (M = 1.33, p < 0.0001). These findings indicate that participants felt safer and more comfortable during the day, with a lower perceived risk, compared to after dark conditions.
Observer ratings for safety, comfort and risk: measured during daytime and after dark conditions with mean values (M), standard deviations (SD), day-dark difference and significance levels
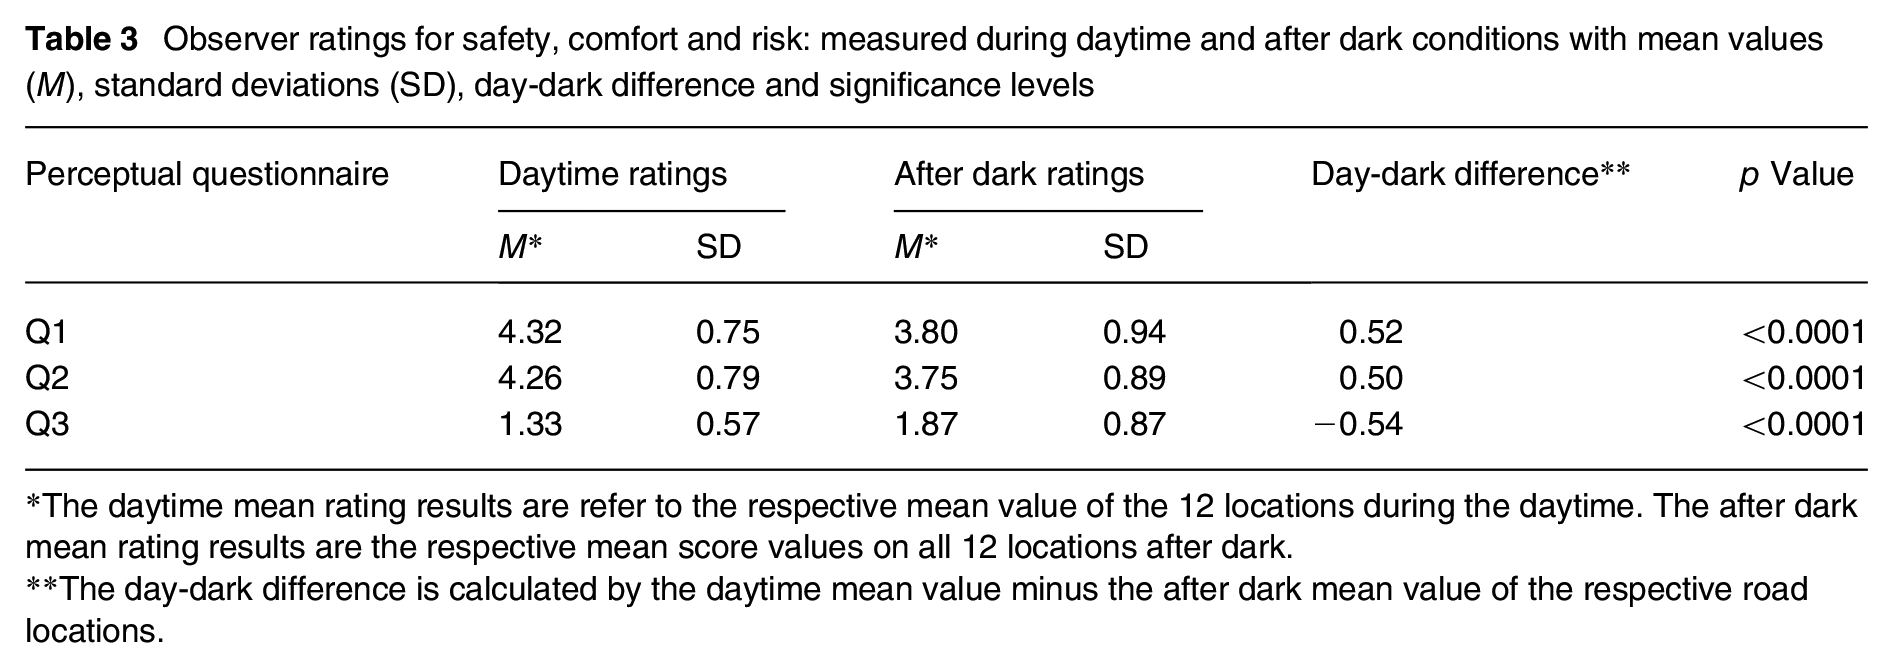
The daytime mean rating results are refer to the respective mean value of the 12 locations during the daytime. The after dark mean rating results are the respective mean score values on all 12 locations after dark.
The day-dark difference is calculated by the daytime mean value minus the after dark mean value of the respective road locations.
Table 4 details the rating results for the three questions, comparing daytime and after dark responses. During the day, locations L5 (M = 4.60), L1 (M = 4.57), L3 (M = 4.51) and L9 (M = 4.51) were rated highest for safety. The highest comfort ratings were given to L5 (M = 4.69), L9 (M = 4.51) and L3 (M = 4.43). For risk, the lowest ratings were observed at L5 (M = 1.14), L1 (M = 1.14) and L9 (M = 1.17), highlighting locations characterised by well-maintained urban facilities, low traffic volumes or exclusive pedestrian paths, adjacent greenery and urban equipment like children’s playgrounds and benches. Notably, L3 and L5, designed solely for pedestrian and cyclist use and devoid of motorised traffic, are situated within residential neighbourhoods (L3) or university campuses (L5). The presence of well-maintained playgrounds and public urban furniture contributes to a serene environment. After dark, the highest safety scores were attributed to L10 (M = 4.23), L1 (M = 4.14) and L3 (M = 4.09), with comfort ratings also peaking at L1 (M = 4.14), L3 (M = 4.11) and L10 (M = 4.00). For risk assessment, the locations L1 (M = 1.26), L10 (M = 1.57) and L3 (M = 1.60) received the lowest ratings, indicating a lower perceived risk. L1, L3 and L10 are characterised by well-maintained and illuminated road surfaces, straight streets and brightly lit surroundings comprising residential neighbourhoods or urban facilities. L9 and L10, located on the same adjacent street and equipped with identical lighting fixtures, pole spacing and height, exhibited notable rating differences. L10 was rated significantly higher than L9 due to its higher illuminance level, attributed to the absence of green strips beside the road and the lack of wide branches, which prevented visible shadows caused by trees on the pavement surface and adjacent areas, as observed in L9.
Mean scores (M) and standard deviations (SD) across all 12 locations
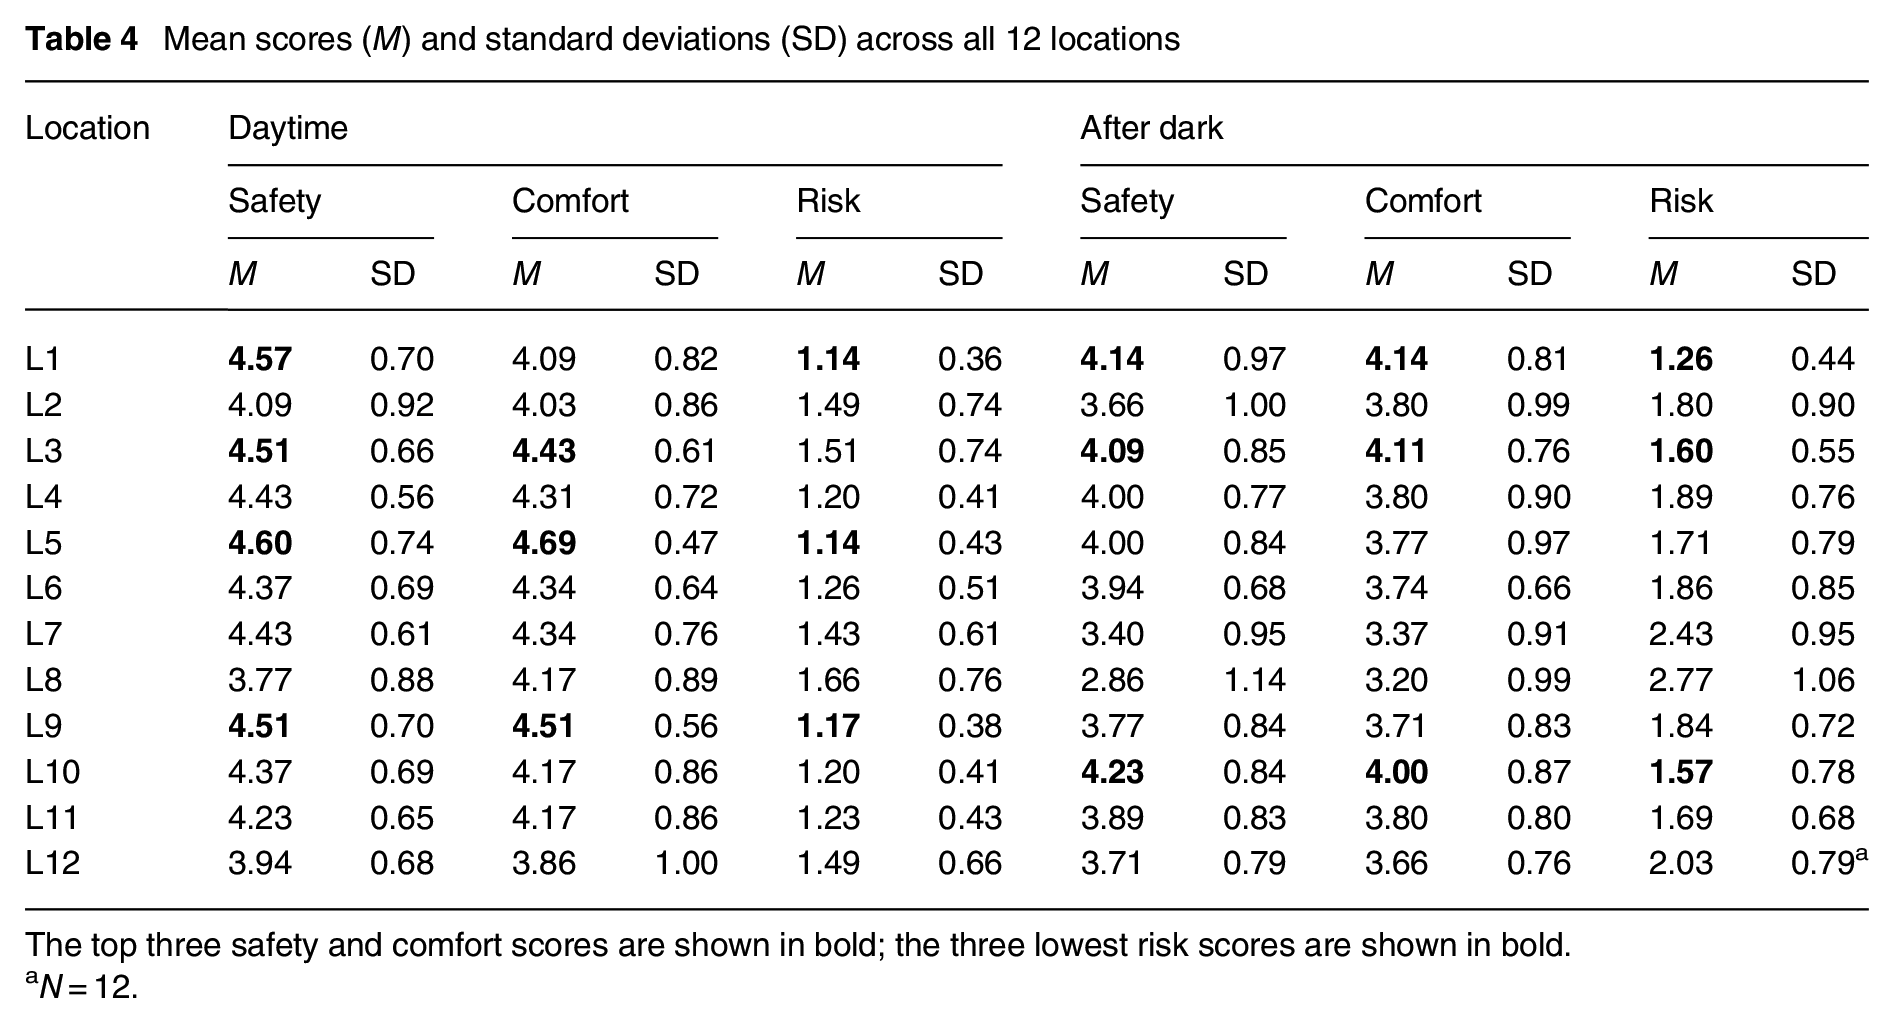
The top three safety and comfort scores are shown in bold; the three lowest risk scores are shown in bold.
N = 12.
The data analysis across the 12 locations revealed a robust correlation between perceived comfort and safety. During darkness, the correlation coefficient (r = 0.69, p < 0.001) highlighted a significantly stronger relationship compared to daytime (r = 0.55, p < 0.001). This indicates that areas deemed comfortable also tend to be perceived as safe, with this association being particularly pronounced during after dark conditions.
3.2 Day-dark difference analysis
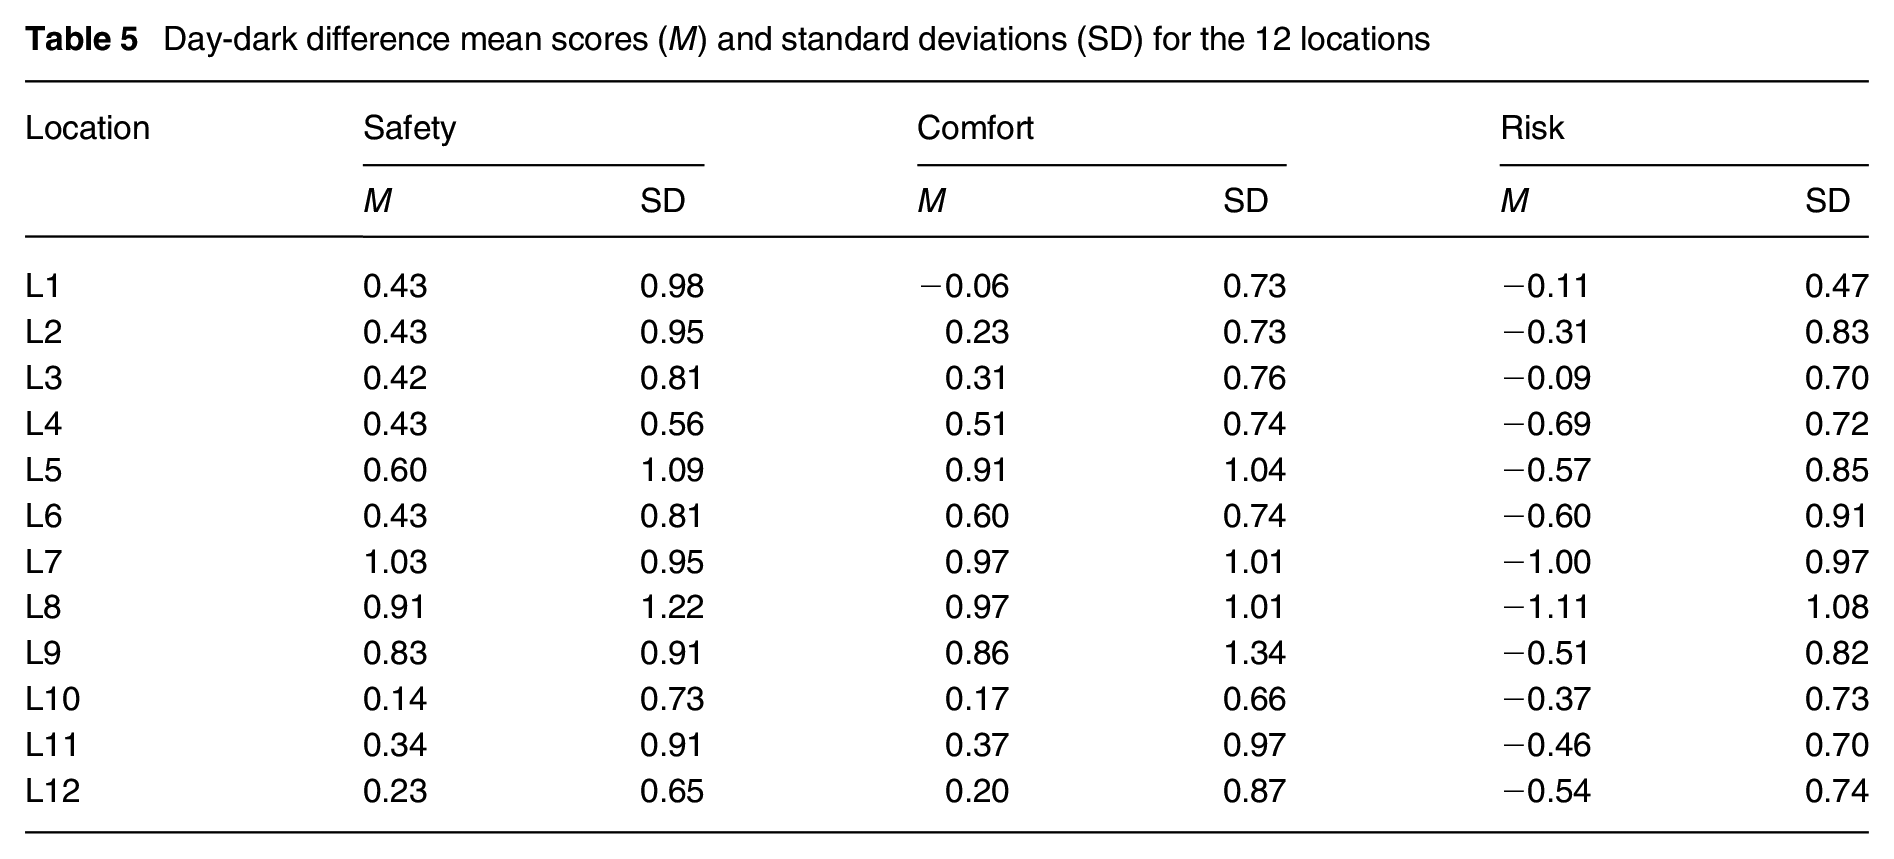
Analysis using the Shapiro–Wilk and Anderson–Darling tests suggested that the data follow a normal distribution. 31 Locations L7 and L8 exhibited the largest day-dark differences across all three questions. L7, featuring landscape lighting fixtures (bollards) at a height of 0.9 m, provides lighting concentrated near the lamp post, resulting in poor illuminance and uniformity on the road surface. L8, devoid of road lighting fixtures, is illuminated solely by natural light (moonlight). Conversely, L10, L11 and L12 demonstrated the smallest safety differences. L1, L10 and L12 showed the smallest differences in comfort, whereas L3, L1 and L2 had the smallest differences in perceived risk. These findings are detailed in Table 5.
Day-dark difference mean scores (M) and standard deviations (SD) for the 12 locations
3.2.1 Composite rating analysis
A principal component analysis (PCA) approach was utilised to consolidate responses to the three survey questions, subsequently repeating the analysis to ensure consistency. The Kaiser–Meyer–Olkin (KMO) test yielded a value of 0.64, indicating that the sample size was moderately sufficient for PCA. From the analysis, one component was extracted based on the day-dark difference across the three questions. Component loadings for safety, comfort and risk were 0.799, 0.776 and 0.696, respectively, indicating that a higher loading value corresponds to a stronger relationship, whereas a lower value suggests a weaker relationship. Notably, the calculation method for risk differences deviated by subtracting the daytime rating from the after dark rating, contrary to the approach for safety and comfort where the calculation was reversed. To determine component scores for each question, a regression method was applied, incorporating responses to all three questions. For every participant and location, a composite score was calculated by applying the component scores from Table 6 as weights to the day-dark differences for each rating item and summing these weighted values. Safety received the highest factor score (0.638), while risk perception had the lowest (0.484).
Factor loadings and scores based on three survey questions
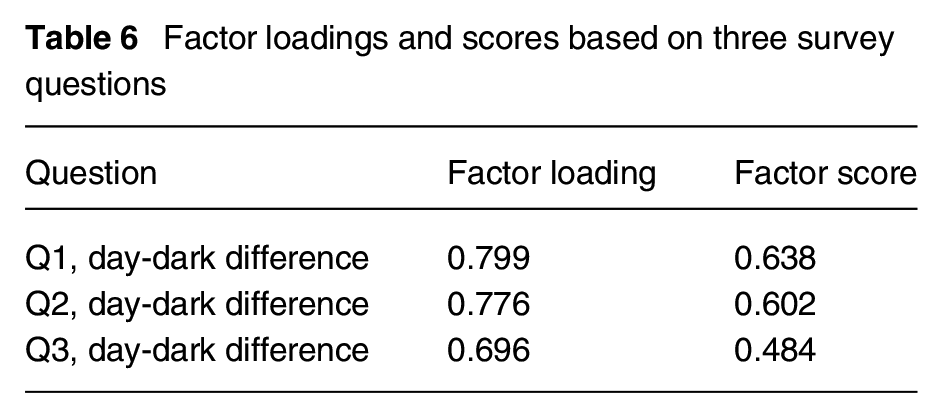
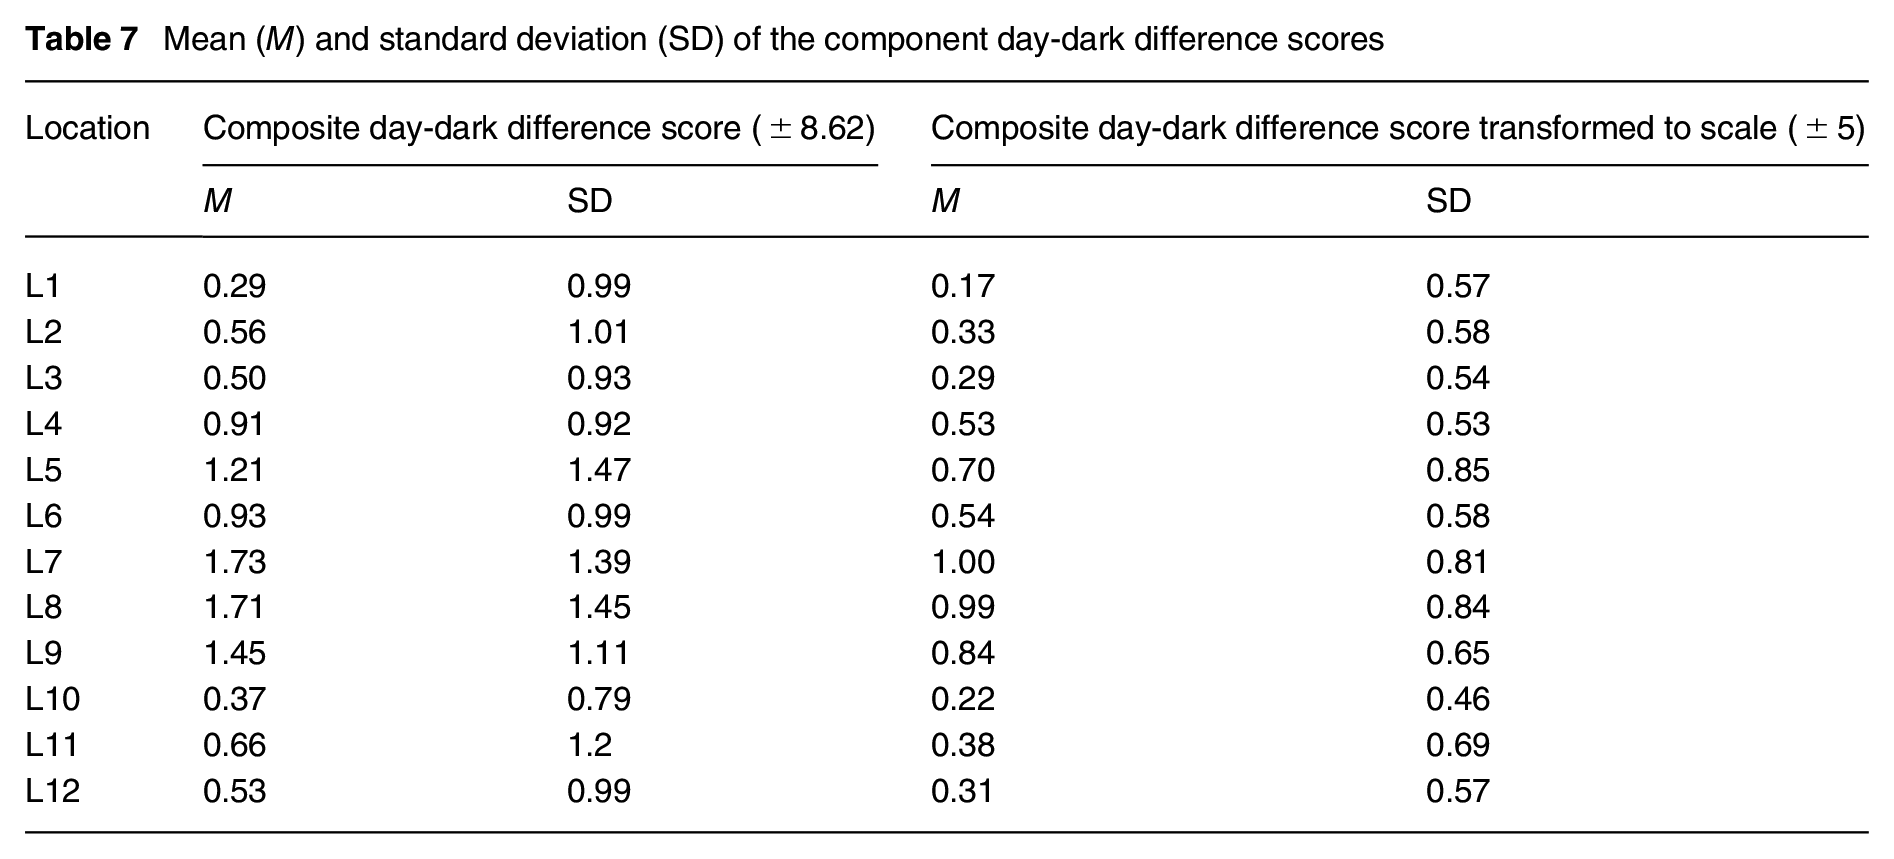
Table 7 outlines the mean composite score and standard deviation for each location, with scores averaged across each test site. It is essential to consider the range of differences when interpreting the significance of any particular unit of difference. Given the original response scale items, the range of differences available was broader than that derived using the initial 1 to 5 scale. Hence, to reconcile the composite score with the theoretical range of differences, it underwent transformation to a scale of −5 to +5. Employing the PCA methodology, the extremities of possible composite scores were calculated as ±8.62, based on (10 × 0.638+10 × 0.602+10 ×0.484)/2, assuming the most extreme day-dark difference (±5). A lower composite score suggests a narrower day-dark difference in ratings, potentially indicating more effective lighting.
Mean (M) and standard deviation (SD) of the component day-dark difference scores
Correlation and fitness model analyses, utilising the transformed composite data, demonstrated that the minimum illuminance parameter consistently offered a statistically significant interpretation over other lighting parameters. Multiple regression models, which included the logarithmic values of the combined mean, minimum, maximum and uniformity of illuminance and luminance, identified minimum illuminance as a significantly stronger parameter in comparison to others. Specifically, the analyses showed that only the minimum illuminance parameter provided a statistically significant interpretation, with an R2 = 0.61, F ratio = 18.57, p < 0.005, underscoring its significant predictive power and fitness over other lighting parameters. In comparing these models, a higher R2 value and lower values of Akaike information criterion (AIC) were indicative of a better model fit. 32 The analysis underscored that minimum illuminance yielded the best model fit, whereas the inclusion of combined lighting parameters did not enhance the predictive capability of the model, as detailed in Table 8. The day-dark differences, represented on a scale of −5 to +5 and depicted in Figure 2, indicated a maximum difference value of approximately 1.0 units. This outcome is relatively modest, especially when compared to the 1.4 units reported by Fotios et al. 3 and 4 units by Boyce et al., 13 highlighting the significance of non-lighting factors in influencing pedestrian safety and comfort assessments within the studied illuminance range. This suggests that, while minimum illuminance is a crucial factor for pedestrian perception in urban after dark environments, other elements beyond lighting also play significant roles in shaping pedestrian safety and comfort.
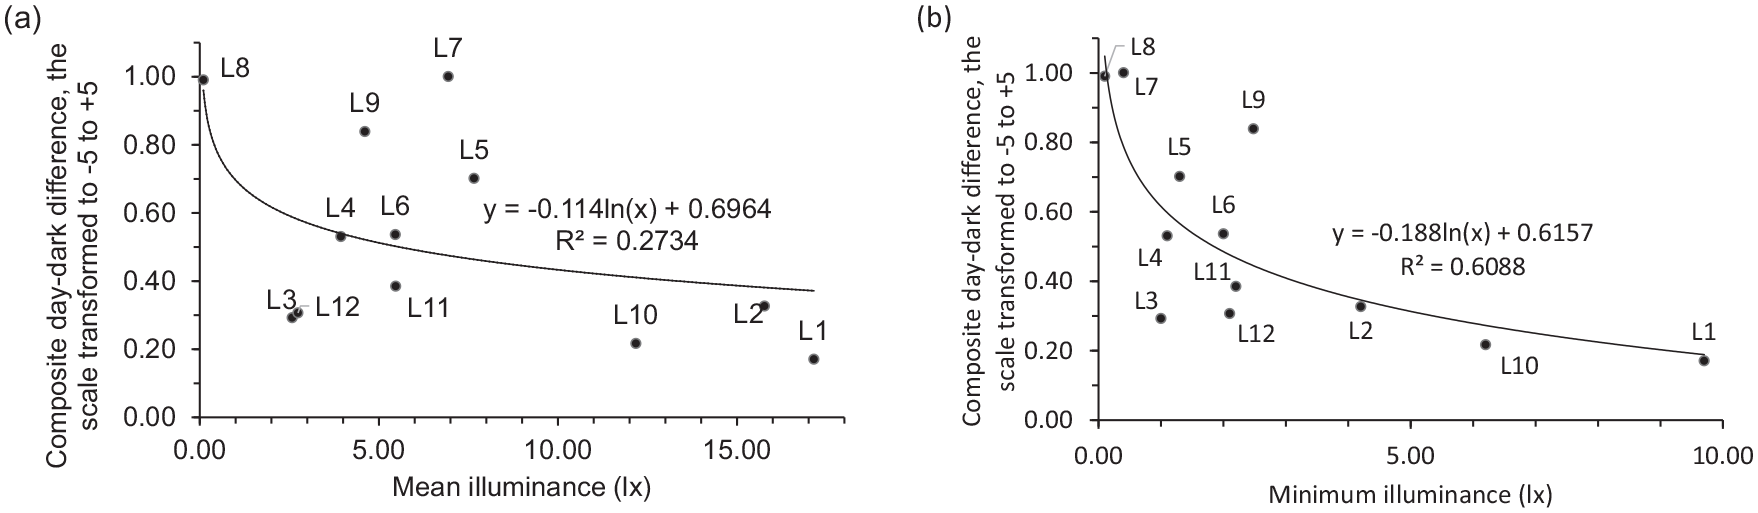
Composite rating day-dark difference transformed from a 1 to 5 scale to a −5 to +5 scale, plotted against mean illuminance (a) and minimum illuminance (b). Point labels correspond to location numbers. The regression line is described using a logarithmic function
Results of multiple regression models using combinations of lighting parameters to predict the transformed composite (safety, comfort and risk) day-dark difference score of perceptions
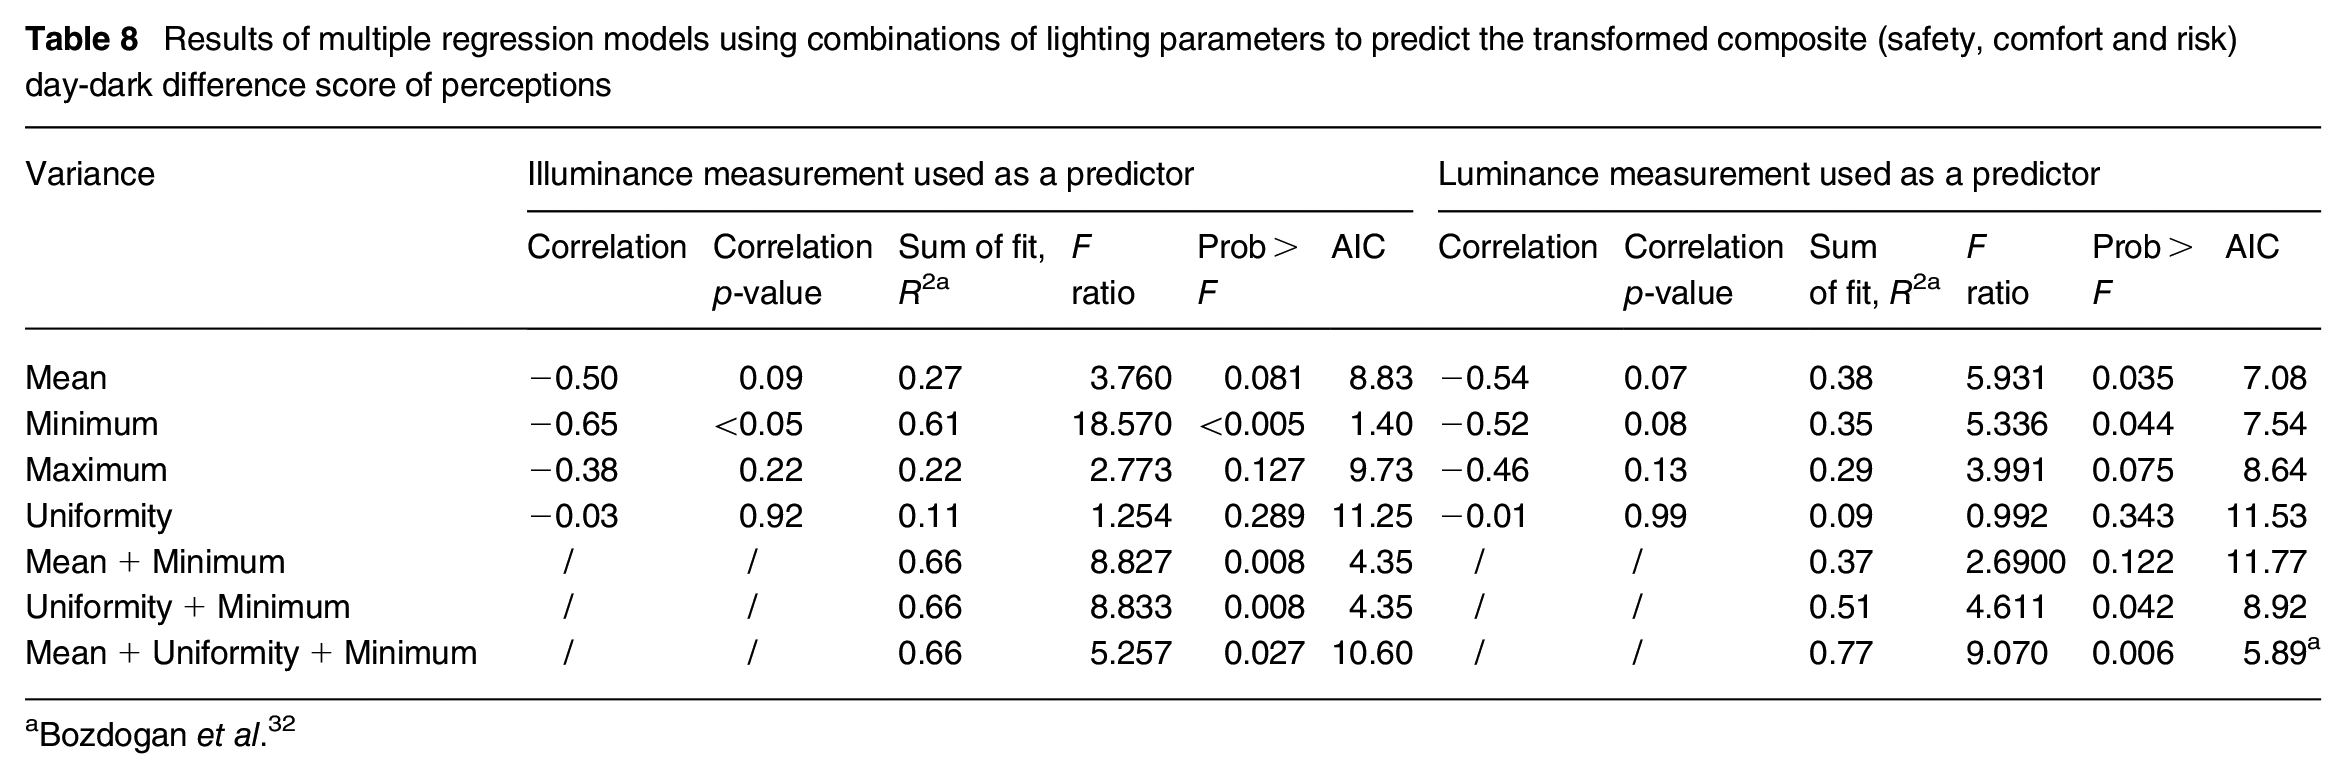
Bozdogan et al. 32
3.2.2 Optimal lighting parameters
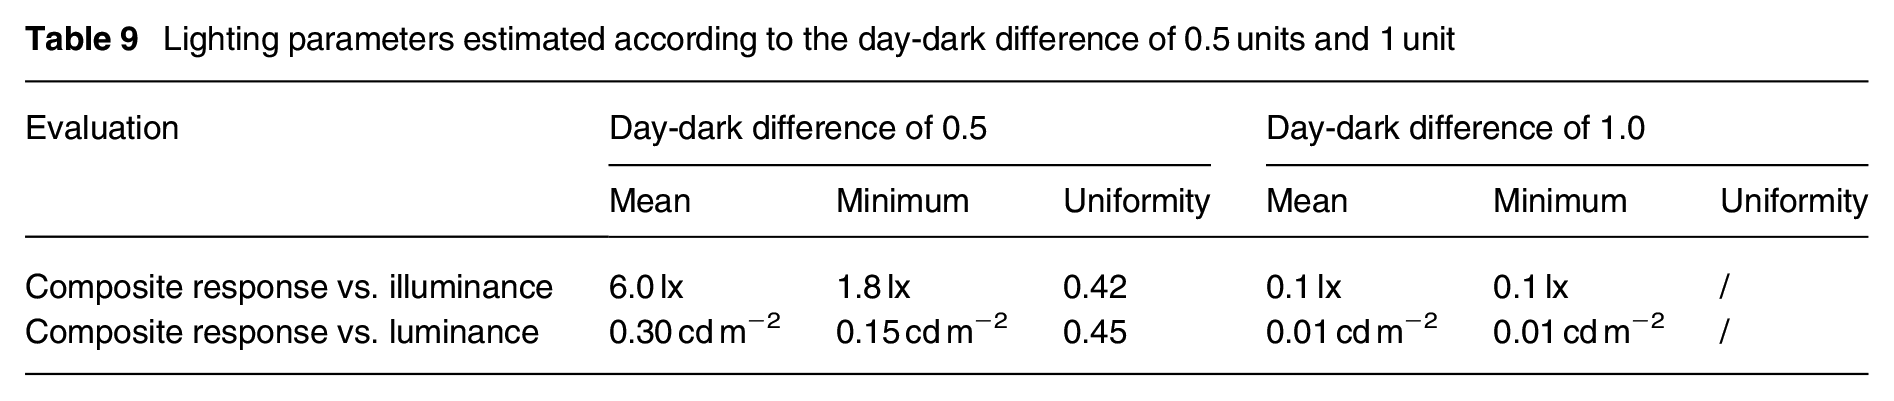
Employing PCA with composite score analysis revealed that minimum illuminance significantly influences the perception of differences between daylight and darkness more than other lighting parameters. A day-dark difference of 0.5, indicative of diminished safety and comfort from daytime to darkness and an elevated risk during after dark, corresponded to lower ratings. Correlation and fitness analysis determined that to closely replicate daytime conditions (achieving a day-dark difference of 0.5) and Foster feelings of safety, comfort and reduced risk, the optimal lighting conditions require approximately 1.8 lx for minimum illuminance and about 0.15 cd m−2 for minimum luminance. However, a day-dark difference of 1.0 units is associated with the very low lighting levels typically found under moonlight.
Table 9 presents the illuminance and luminance values corresponding to day-dark differences of 0.5 units and 1.0 units. For a 0.5-unit difference, road lighting conditions include a mean horizontal illuminance of around 6 lx, a minimum illuminance of 1.8 lx, or a uniformity of 0.42. These specifications are situated between the lighting classes P4 (mean = 5.0 lx, min = 1.0 lx) and P3 (mean = 7.5 lx, min = 1.5 lx), suggesting an intermediate classification for achieving desired safety and comfort levels. 30 With a 1.0-unit difference, both mean and minimum horizontal illuminance levels are approximately 0.1 lx, underscoring the significant role of factors beyond mere lighting in influencing pedestrian safety perceptions, visual comfort and risk assessment in urban settings characterised by higher illumination levels. This analysis underscores the critical role of minimum illuminance in urban after dark environments and highlights the need to consider a broader range of factors when assessing pedestrian safety and comfort.
Lighting parameters estimated according to the day-dark difference of 0.5 units and 1 unit
4. Discussion
This study presents several limitations that warrant attention for future research:
Gender representation bias: The participant pool comprised only 4 females and 31 males, which could lead to a gender bias in the estimation of population responses. Given that males and females often provide differing responses to surveys, a larger and more diverse sample would help mitigate potential gender bias and enhance the representativeness of the results. 33
Age group representation: The participants were predominantly aged between 20 years and 40 years, excluding older age groups that typically experience reduced visual acuity and may require higher levels of lighting for obstacle detection and environmental perception.4,5,26,27 With an ageing population and the need to ensure safer environments for the elderly and disabled, it is crucial that future studies include a broader range of participant ages.
Questionnaire reliability: The study’s reliance on a single question for each parameter (safety, visual comfort and risk) limits the reliability of the findings. Employing multiple questions per parameter and consolidating responses could enhance the validity and reliability of the questionnaire. 34
Sequence bias: There is a potential for sequence bias, as the order of day and darkness trips was reversed for participants, rather than employing a random sequence for visiting locations. 35 This methodological approach may influence the results and interpretations. Further studies are necessary to randomise the order to mitigate this bias.
Lack of mediation analysis: The study did not account for co-occurring variations in appraisals of parameters and pedestrian perception, such as street infrastructure and social ecology,25,36 which could explain the relationship between lighting parameters and pedestrian perceptions. Future studies should incorporate mediation factor analysis to explore these relationships further.
Despite these limitations, this study provides an insight into users’ subjective experiences and feelings regarding lighting parameters and the urban environment. It validates and complements previous research, contributing to our understanding of the relationship between perception and lighting parameters. This knowledge is essential for promoting the sustainable use of public lighting, aiming to achieve significant environmental benefits, enhance individual well-being and facilitate energy savings through the selection and maintenance of appropriate public lighting conditions.
5. Conclusion
This study reported on a field experiment conducted in the urban environment of Ljubljana, Slovenia, to evaluate the effects of lighting parameters on perceived safety, visual comfort and risk. It aimed to address and expand upon the potential limitations identified in prior research by applying the methodology to diverse social and urban contexts. The study utilised a robust sample size, encompassing 12 road locations and 35 participants, across a spectrum of lighting levels, and was set in a distinct geographical and social milieu from earlier investigations. The findings underscored the significant impact of minimum illuminance on the subjective perceptions of safety, visual comfort and risk during after dark, as determined through the day-dark approach. Specifically, achieving a day-dark difference of 0.5 units required a minimum illuminance level of approximately 1.8 lx, aligning closely with prior recommendations from an experimental study in Sheffield, UK, which advocated for a 2-lx minimum to attain a similar day-dark difference. 3 This marginal variance highlighted that the essential minimum lighting requirements for pedestrian security in urban settings might not drastically influence city safety standards.
The implications of these results suggested a strategic shift in lighting standards, guidelines and project implementations towards prioritising minimum illuminance and uniformity, rather than a combined focus on both mean and minimum illuminance levels. Emphasising minimum illuminance could significantly enhance the spatial distribution of urban lighting, mitigating dark spots, reducing light pollution and promoting energy efficiency. This approach not only aligns with sustainable urban development goals but also contributes to creating safer, more comfortable and environmentally friendly after dark environments for pedestrians.
Supplemental Material
sj-pdf-1-lrt-10.1177_14771535241269699 – Supplemental material for Evaluating the impact of road lighting on pedestrian reassurance through the day-dark approach
Supplemental material, sj-pdf-1-lrt-10.1177_14771535241269699 for Evaluating the impact of road lighting on pedestrian reassurance through the day-dark approach by L Wei, G Bizjak and MB Kobav in Lighting Research & Technology
Supplemental Material
sj-pdf-2-lrt-10.1177_14771535241269699 – Supplemental material for Evaluating the impact of road lighting on pedestrian reassurance through the day-dark approach
Supplemental material, sj-pdf-2-lrt-10.1177_14771535241269699 for Evaluating the impact of road lighting on pedestrian reassurance through the day-dark approach by L Wei, G Bizjak and MB Kobav in Lighting Research & Technology
Footnotes
Declaration of conflicting interests
The authors declared no potential conflicts of interest with respect to the research, authorship, and/or publication of this article.
Funding
The authors disclosed receipt of the following financial support for the research, authorship, and/or publication of this article: This research was partially funded by the Slovenian Research Agency, grant number P2-0356.
Supplemental material
Supplemental material for this article is available online.
References
Supplementary Material
Please find the following supplemental material available below.
For Open Access articles published under a Creative Commons License, all supplemental material carries the same license as the article it is associated with.
For non-Open Access articles published, all supplemental material carries a non-exclusive license, and permission requests for re-use of supplemental material or any part of supplemental material shall be sent directly to the copyright owner as specified in the copyright notice associated with the article.