
Abstract
In the day-dark approach to measuring the contribution of road lighting to pedestrian reassurance, reassurance is evaluated in daylight and after dark. In previous studies, the daylight and after dark evaluations were carried out at different times of day. Other factors, such as the presence of other people, are likely to vary with time of day, and hence this confounds conclusions about the effectiveness of road lighting. In this study, we conducted a day-dark field study of pedestrian reassurance but with the daylight evaluation carried out at two times of the day, one at around mid-day and one at the same time of day as the after dark evaluation, achieved by taking advantage of the biannual daylight savings clock change. These data did not suggest any significant effects of time of day on the daylight evaluations of pedestrian reassurance.
1. Introduction
Reassurance is the confidence a pedestrian might gain from road lighting (and other factors) to walk along a footpath or road, in particular if walking alone after dark. 1 In residential roads, one aim of installing road lighting is to enhance pedestrian reassurance (‘give them a sense of security’, 2 ‘feel more secure’ 3 ). There is some evidence that the presence of road lighting does indeed offer reassurance 4 ; what is needed next is to establish optimal lighting conditions. Road lighting can vary in the illuminance provided, the spatial distribution (or uniformity) of that illuminance and the spectral power distribution of the light: here, for convenience, we frame the current discussion in terms of illuminance.
A common approach to measuring reassurance is to use categorical rating.5–8 For example, Peña-García et al. 6 asked test participants ‘How safe do you feel when you walk along this street at night?’, with responses given on a five-point scale where 1 was labelled ‘Nothing’ and 5 was labelled ‘A lot’. While not widely raised in such studies, the robustness of results gained using category rating are perhaps questionable when compared with the apparent (and overestimated) ease of designing and administering a questionnaire. 9
To measure the effect of change in illuminance, a common approach6,10–13 is to repeat the evaluation in roads lit to different illuminances. The better lighting is that which gives the higher rating of safety. One limitation with this approach is the possibility of changes in the environment between those locations other than the road lighting; hence, that any conclusion about the effect of illuminance is confounded. Boyce et al. 14 introduced the day-dark method to overcome this, in which a location is evaluated in daytime (daylight) as well as after dark. Analysis uses the difference between the daylight and after-dark evaluations (the day-dark difference) and better lighting is that which minimises the day-dark difference. The use of repeated measures in the day-dark method may also reduce the impact of stimulus range bias, 15 but that is still to be verified.
We investigated one limitation of the day-dark method. In the work by Boyce et al. 14 and those who have subsequently used this method,16,17 the daylight evaluations are conducted at different times of day to the dark evaluations. Fotios et al. 16 for example report that daylight ratings were typically obtained in the morning, from 10.30, whereas after-dark ratings were obtained from 16.45. Between these times of day there may be changes in factors other than that in ambient light level which would confound the day-dark analysis.
Diurnal variation is observed in a range of factors that could influence reassurance. Previous work suggests perceived safety can change depending on whether or not it is assessed at peak commuting time. 18 This change in reassurance may be linked to changes in the presence of others, 19 as the number of other pedestrians and road traffic volumes are higher at peak commuting times compared with other times of the day. Reassurance can also vary depending on actual crime rates, particularly violent crime, 20 and the risk of crime occurring varies depending on the time of day. 21 Ambient temperature is also known to influence crime rates, particularly violent crime. 22 Crime rates, ambient temperature and the presence of others are all likely to have a direct or indirect influence on reassurance. Given that these factors all show diurnal variation, their influence on reassurance in an area is also likely to vary depending on the time of day.
In this study, we investigate whether the day-dark differences in ratings of reassurance are influenced by the time of day at which the daylight ratings are obtained. To do this, we take advantage of the biannual daylight savings clock change, to enable selection of periods of daylight and darkness at the same time of day. This is a method used previously to investigate the impact of ambient light level on road traffic collisions,23–25 traffic flows26,27 and crime.28,29 We compare day-dark differences in reassurance obtained at the same time of day against those where the day and after-dark reassurance ratings are obtained at different times of the day.
Ambient light level is defined by solar altitude, 30 with daylight being solar altitudes above 0° and darkness being solar altitudes of less than −6°. The daylight savings clock change offers a rapid transition from daylight to darkness (or vice versa) from one day to the next. Consider the clock change in Autumn 2021 in Sheffield, UK: the period 17.00 to 17.45 was daylight in the week before clock change but in darkness the week after.
We conducted an experiment to assess the impact time of day has on reassurance ratings as part of the day-dark method of measuring the reassurance of road lighting. Two daylight periods were chosen, one being in mid-day and the other being in the evening. A comparison of the results gained at these two evaluation moments will assess whether the time of day, and not just the ambient light level, influences the day-dark analysis of reassurance.
2. Method
Reassurance was assessed at six outdoor locations using the day-dark method of analysis previously used by Boyce et al. 14 and Fotios et al. 16 That method was extended by recording the daylight evaluations of reassurance at two different times of day: once at the same time of day as the after-dark evaluation and once at around midday. These evaluation points are referred to hereafter as evening daylight and noon daylight, respectively. The experiment was conducted over two periods, centred on the Autumn 2021 clock change (31 October 2021) and Spring 2022 clock change (27 March 2022), to balance the order of the naturally occurring day-to-dark (and dark-to-day) transitions. The experiment received ethical approval from the University of Sheffield Research Ethics Committee (UREC) on 8 October 2021 (reference number 043559).
2.1 Test locations
Six locations were selected from the 10 used previously by Fotios et al. 16 and Liachenko-Monteiro, 31 with five being footpaths along residential roads and one being a footpath through a park. The need to isolate a time period in the evening which was daylight one week and dark the other, without civil twilight in either period, permitted only a 45-min window. This reduced the number of locations it was possible to include because each location required a few minutes to do the evaluation and a few minutes to walk from one location to the next. All six locations were situated in an urban residential area of Sheffield, UK, labelled here as R1 to R5 (residential roads) and R6 (the footpath through a park). Characteristics and photographs of each location can be found in Table 1 and Figures S1 to S6 (Supplemental Material 1). All locations were lit using LED light sources with average illuminances ranging from about 1 lx to 11 lx, as measured in previous work.16,31
Characteristics of the six test locations. The light source was LED in all locations
2.2 Questionnaire design
Evaluations in each location were carried out using the same questionnaires as were used by Fotios et al. 16 ; one questionnaire for the daylight surveys (Figure A1 in Appendix) and the same but with additional questions about lighting for the after-dark surveys (Figure A2). Responses to all questions were recorded using a six-point category rating scale with the end points labelled, for example, 1 –very dangerous and 6 –very safe.
The daylight questionnaire consisted of 10 questions (Figure A1). Three questions (How safe do you think this street is?, How anxious do you feel when walking down this street? and I would rather avoid this street if I could) were evaluations of reassurance, and these are the primary focus in the current work.
As suggested by Meade and Craig, a bogus question was included to check participants’ attentiveness32,33 selected from a pool of 16 questions (Figure A3). The answer to a bogus question did not depend on the test location or participant and was therefore predictable. Every bogus question was on a 1 to 6 scale, with 1 being strongly disagree and 6 being strongly agree. Inattentive responding was defined as answering anything other than a 5/6 or 1/2 in the correct direction. An example correct response would be answering 5 or 6 to the question ‘I was born after 1879’. Each participant responded to 18 bogus questions in total (6 test locations × 3 test sessions) and would be excluded if they incorrectly answered 4 or more. Meade and Craig 33 did not suggest a threshold for exclusion: we used 20% which is stricter than Curran 34 who suggests a 50% threshold for incorrect responses to bogus questions for participant exclusion.
In laboratory studies of perceived safety participants are often asked to imagine they are in a location after dark and rate their feeling of safety.35,36 Does an imagined after-dark situation lead to the same evaluation of safety as real experience of after-dark conditions? Fotios et al. 16 tested this by including a question about how risky it felt to walk alone after dark, with the same question repeated in both the daylight and after-dark sessions, to provide an assessment of the influence of imagined versus real after-dark conditions on ratings of reassurance. They found participants rated risk as lower during the daylight session, when they were imagining after-dark conditions, compared with their ratings in the real after-dark session. This suggested asking participants to imagine an after-dark situation can lead to overestimations of how safe or reassured they might feel, compared with when they experience real after-dark conditions. We aimed to confirm this finding by including the same question (How risky do you think it would be to walk alone here at night?) in both the daylight and after-dark sessions.
For the after-dark questionnaire, two additional questions about road lighting were added, but analysis of responses to these questions is not included as they were outside the scope of this paper, which is on the day-dark method of assessing reassurance.
Identical questions were used for all test locations, but the order of questions was changed using 16 different questionnaire variations. In all after-dark evaluations, the two additional lighting questions were always located at the end of the questionnaire. The six-point rating scale was reversed for three questions to avoid the assumption that one end of the scale always represents a more positive/negative response; for the analysis, the responses were coded so that 6 always meant a higher degree of reassurance.
2.3 Sample
A power analysis was carried out using R (version 4.0.3) following the process for power analysis with mixed effects models provided by DeBruine and Barr 37 (see Supplemental Material 2). This suggested a sample of 60 participants would reveal a difference between the same time and different time sessions of 0.20 in the day-dark differences, with an alpha of 0.05 and a power of 91%. Differences below 0.20 were judged to be trivial; therefore, a sample size of 60 was adequate for the purposes of this study.
Sixty participants were recruited, 30 over each of the two clock changes. The responses from four participants were omitted from the analysis because they did not complete all three test sessions: one person from the Autumn 2021 clock change and three people from the Spring 2022 clock change. One participant was excluded because their responses to the bogus question suggested inattentive responding – they answered four bogus questions (22%) incorrectly. The mean number of incorrect responses from retained participants was 0.45 (2.5%).
The overall sample was therefore 55 participants. Of these, 28 were male and 27 were female, all aged between 18 y and 39 y with a median age of 23 y. Participants reported good visual health and wore their corrective lenses where these would normally have been worn when walking. All participants were students recruited through the University of Sheffield volunteering mailing list. They each received a reimbursement of £30 for their time at the end of the final test session.
2.4 Procedure
This experiment followed a repeated measures design; for a given clock change, each participant took part in all three evaluation sessions: noon daylight, evening daylight and after-dark. Evaluation sessions were conducted with participants in groups of four to six, accompanied by the experimenter. The order in which the six locations were evaluated was randomised. The order in which the noon daylight and evening daylight evaluations were conducted was balanced across participants. The after-dark rating was the first rating obtained in the Spring 2022 experiment, but was the last rating obtained in the Autumn 2021 experiment. During the first week, immediately before visiting the locations, the participant group met the researcher at the meeting point to carry out a practice trial. This was to familiarise the participants with the experiment and provide the opportunity to ask questions.
For the Autumn 2021 clock change, the experiment was carried out between Monday 25 October to Saturday 6 November with the day of the clock change (31 October 2021) excluded. The noon daylight sessions and evening daylight sessions were conducted during a period of 45 min in the six days before the clock change with a start time of 12.00 and 17.00 respectively; both evaluations were in daylight as the solar altitude was greater than 0°. The after-dark sessions took place during a 45 min period in the six days after the clock change with sessions starting at 17.00; this period was now in darkness with a solar altitude of less than −6°.
For the Spring 2022 clock change, the experiment took place between Monday 21 March and Saturday 2 April, excluding the day of the clock change (27 March 2022). The after-dark sessions took place first, during a 45 min period in the six days before the clock change with a start time of 18.45. The noon daylight sessions and evening daylight sessions were conducted during the six days after the clock change with a start time of 12.00 and 18.45, respectively and took 45 min. Similar to the previous clock change, the sessions in the first week were in darkness defined by a solar altitude of less than −6° while the sessions in the second week were in daylight defined by a solar altitude of more than 0°.
At each test location, participants were asked to walk between two lamp posts before crossing the road (R1 to R5) or turning around (R6) and returning to the starting point. They were then asked to face the route they had just walked and complete the questionnaire. Table 1 shows the distances walked. The participants were staggered for around 10 s to 15 s so that they walked alone; specifically, they were not accompanied by anyone else at that moment but other participants and the researcher were present in the area.
2.5 Statistical analysis
Linear mixed effects models were used to test our research questions. Homogeneity of variance within the models was checked using Levene’s test on the residuals of each model. Normality of distribution of the model residuals was visually checked by plotting them as a histogram. These assumptions of homogeneity of variance and normality of distribution were not found to be violated for any of the models used in our analyses. The analytical script used for the analysis is provided as Supplemental Material 3, and the data used by this script to create the results presented below are provided as Supplemental Material 4.
3. Results
3.1 Reassurance rating
An overall assessment of how reassured a participant felt at each location was established using the mean responses to the three reassurance items (Safe, Anxious and Avoid), with the scale on the Avoid question reversed so that a higher rating on all three questions indicated greater reassurance. This is referred to below as a participant’s ‘reassurance rating’ for each road and session. The reliability of such an overall measure of reassurance was assessed by calculating Cronbach’s alpha for each road and session. The resulting alpha levels suggested the mean of the three reassurance items was adequate for providing a reliable measure of reassurance. Bland and Altman 38 suggest a Cronbach’s alpha above 0.70 is satisfactory, and only 3 out of the 18 alphas calculated (for three sessions and six roads in each session) were below 0.70.
3.2 Effect of test session on reassurance ratings
We first compared reassurance ratings obtained on the three different test sessions undertaken by participants (noon daylight, evening daylight and after dark). This was done using the mean overall reassurance rating across all six locations for each session (Figure 1). A linear mixed effects model was used, with the overall reassurance rating as the dependent variable, the test session (after dark, evening daylight and noon daylight) as the independent variable and included as a fixed effect, and the participant and location included as random effects. This model suggested a significant difference in reassurance ratings between the three sessions (X2 = 58.6, p < 0.001, Cohen’s d = 0.30). Post hoc Tukey tests suggested all three reassurance ratings differed significantly from each other (after-dark reassurance mean = 4.20, noon daylight reassurance mean = 4.67, evening daylight reassurance mean = 4.51, all pairwise comparisons p < 0.05). Reassurance ratings were lowest during the after-dark session, followed by the evening daylight session, with the noon daylight session producing the highest reassurance ratings.
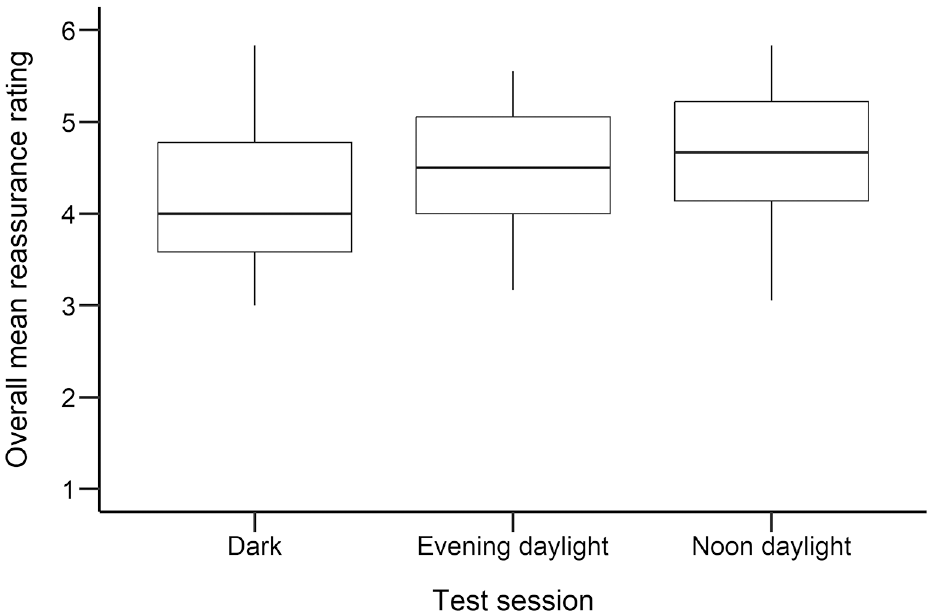
Boxplots showing overall mean reassurance ratings for each of the three sessions completed by participants (after dark, evening daylight and noon daylight). A higher rating indicates greater level of reassurance. Box shows interquartile range; whiskers show lowest and highest values within 1.5 of the interquartile range
3.3 Effect of test session on day-dark differences in reassurance ratings
Day-dark differences in reassurance ratings were calculated for each participant on each location and for each comparison of sessions (after dark vs. evening daylight, after dark vs. noon daylight). Reassurance ratings obtained during the after-dark session were subtracted from ratings obtained during the daylight session, meaning positive values indicate the location was considered safer in daylight than after dark. The mean day-dark difference was calculated across all six roads for each participant and for each comparison of sessions. Boxplots of these means are shown in Figure 2.
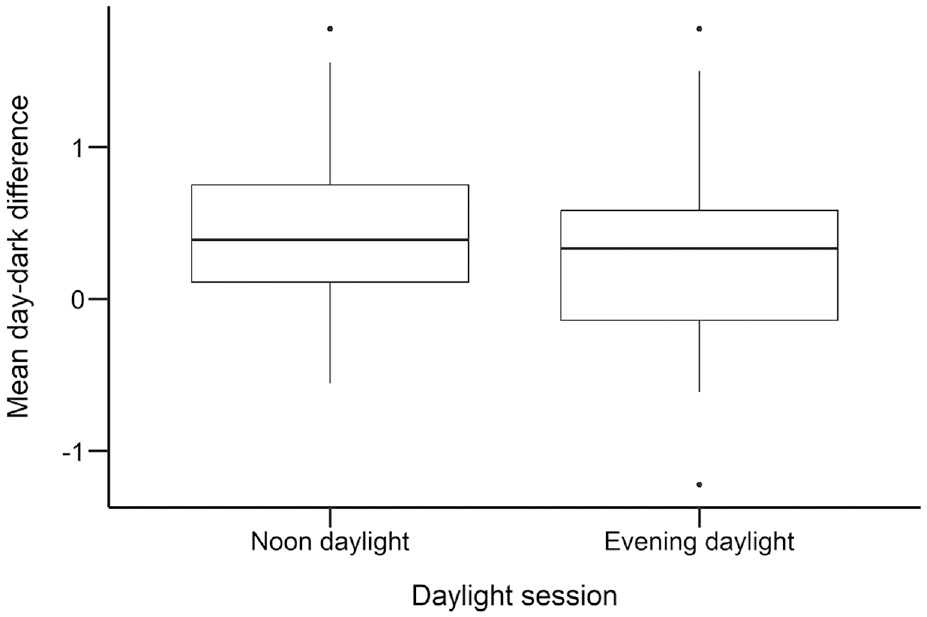
Boxplots of mean day-dark differences in reassurance ratings when day and dark ratings were obtained at different times of day (after dark minus noon daylight) or at the same time of day (after dark minus evening daylight). A positive day-dark difference indicates greater reassurance during daylight compared with after dark. Box shows interquartile range; whiskers show lowest and highest values within 1.5 of the interquartile range. Points show values lying beyond 1.5 times the interquartile range
A linear mixed effects model was used to compare the day-dark differences between the two comparisons of sessions (ratings obtained at same time of day vs. ratings obtained at different times of day). The day-dark difference in reassurance ratings for each participant in each location was used as the dependent variable, the time of day of the daylight session used as the independent variable (noon daylight or evening daylight) and included as a fixed effect in the model. The participant and location were included as random effects. This linear mixed effects model suggested the day-dark difference in reassurance ratings was larger when the ratings were obtained at different times of day (mean day-dark difference = 0.47, SD = 1.08) compared with at the same time of day (mean day-dark difference = 0.31, SD = 1.06, X2(1) = 5.39, p = 0.020, Cohen’s d = 0.15). However, the effect size was negligible and below Cohen’s threshold for a small effect of d ≥ 0.20. 39
3.4 Imagined after-dark situation
Participants were asked ‘How risky do you think it would be to walk alone here at night?’ in both daylight sessions as well as in the after-dark session. This was done to compare ratings of safety in an imagined after-dark setting versus in a real after-dark setting. A linear mixed effects model was used to assess whether these risk ratings differed depending on the session they were obtained in, with the mean rating on the ‘risk to walk alone at night’ question as the dependent variable, the test session (after dark, evening daylight and noon daylight) as the independent variable and included as a fixed effect, and participant and location included as random effects. This model did not suggest a significant difference between the three sessions (X2 = 0.42, p = 0.812, Cohen’s d = 0.01, means for the after-dark, evening daylight and noon daylight sessions were 3.69, 3.71 and 3.74 respectively). Figure 3 shows boxplots of the mean ratings on this question for each participant after being combined across locations, for each of the sessions.
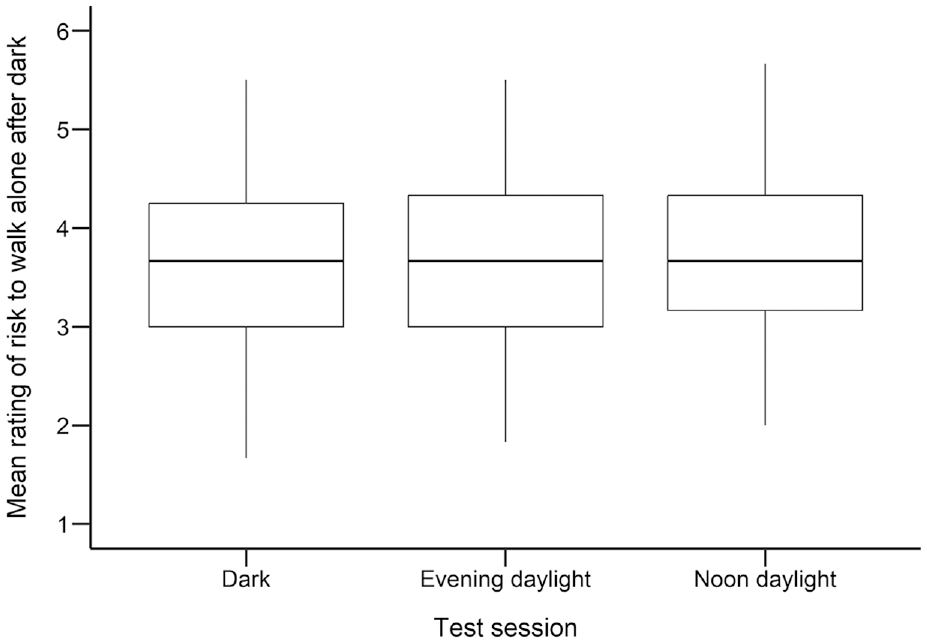
Boxplots showing mean ratings of risk to walk alone at night obtained during each light condition session. Box shows interquartile range; whiskers show lowest and highest values within 1.5 of the interquartile range
4. Discussion
Accurate assessment of the influence of lighting on reassurance is important for optimising target characteristics for lighting design so that lighting is used efficiently and achieves its stated aim.
In this study, we tested one aspect of the day-dark approach for evaluating the reassurance offered by lighting. In this method, evaluations of reassurance at a location are recorded in daylight and after dark to account for environmental influences on reassurance that may be unrelated to lighting conditions. The aim of road lighting is to minimise the day-dark difference in reassurance ratings. One possible limitation of previous day-dark studies14,16 is that the daylight evaluations were given at a different time of day to the after-dark evaluations. This difference in time of day may influence ratings obtained. We therefore recorded daylight evaluations at two times of day, noon (12.00 to 12.45) and evening (17.00 to 17.45 for the Autumn clock change and 18.45 to 19.30 for the Spring clock change). The evening evaluations were conducted before and after daylight savings clock changes, so that the after-dark evaluations were collected at the same time of day as the evening daylight evaluations.
Reassurance ratings were lower during the after-dark session compared with both daylight sessions, as expected (see Figure 1). Two day-dark differences in reassurance ratings were determined, one comparing the daylight rating collected at a different time of day to the after-dark rating (noon daylight – after dark) and one comparing the daylight rating collected at the same time of day as the after-dark rating (evening daylight – after dark). The results (Figure 2) suggest using the noon daylight evaluations led to a greater day-dark difference than did the evening daylight evaluations. However, while that difference is statistically significant (p < 0.05) the effect size was very small, below Cohen’s threshold for a small effect. In other words, the difference is negligible, of little practical relevance.
One question in the survey asked about risk to walk alone after dark. Identical questions were included in both the daylight and after-dark versions of the survey, thus to compare evaluations of imagined darkness (i.e. when responses were given in daylight test sessions) to evaluations in real darkness (i.e. when responses were given in the after-dark test sessions). Previous work 16 found that ratings of reassurance for imagined darkness were significantly lower than in real darkness. This suggested participants perceived the risk of walking alone at night to be higher when they were imagining being at the location after dark, compared with when they were actually present on the street after dark and making the same evaluation. The current work, however, did not find a significant difference in reassurance ratings for imagined and real darkness. One explanation for this may be due to the additional locations used in the previous work – only 6 of the 10 locations from the previous work were included in the current study. These missing four locations may account for the difference in findings between the two studies, if those four locations produced particularly large differences in reassurance ratings for imagined versus actual darkness. For example, one of these four locations excluded from the current work was an underpass with high illuminance levels and was the only location that produced lower ratings of reassurance during daylight than after dark.
5. Conclusion
The day-dark method for assessing reassurance is more effective for determining the influence of lighting than assessing reassurance after dark alone, as it helps control for environmental factors that influence reassurance but are unrelated to lighting. Previous research using the day-dark method14,16 obtained the daylight and after-dark ratings of reassurance at different times of the day. This may have influenced the results found as time of day could be a confounding factor introduced into the research design. We carried out an experiment to address this issue – does time of day influence ratings of safety during daylight, and therefore influence the day-dark differences in reassurance obtained through the day-dark method?
Our results suggest the time of day does have an impact on reassurance ratings – the day-dark difference in reassurance ratings was larger when the daylight and after-dark ratings were obtained at different times of the day, compared with when obtained at the same time of the day. However, this effect of time of day was very small, less than Cohen’s threshold for a small effect. We therefore suggest the effect is negligible and that conclusions drawn from previous research using the day-dark method remain valid. Future research into the influence of lighting on reassurance should use the day-dark approach to control for environmental influences unrelated to lighting, but the day and after-dark ratings of reassurance do not need to be obtained at the same time of day as this is logistically difficult to do and time of day only has a negligible effect on day-dark differences in reassurance.
Supplemental Material
sj-docx-1-lrt-10.1177_14771535241252712 – Supplemental material for Defining daytime in the day-dark approach to measuring the pedestrian reassurance of road lighting
Supplemental material, sj-docx-1-lrt-10.1177_14771535241252712 for Defining daytime in the day-dark approach to measuring the pedestrian reassurance of road lighting by J Uttley, S Gorjimahlabani and S Fotios in Lighting Research & Technology
Supplemental Material
sj-txt-2-lrt-10.1177_14771535241252712 – Supplemental material for Defining daytime in the day-dark approach to measuring the pedestrian reassurance of road lighting
Supplemental material, sj-txt-2-lrt-10.1177_14771535241252712 for Defining daytime in the day-dark approach to measuring the pedestrian reassurance of road lighting by J Uttley, S Gorjimahlabani and S Fotios in Lighting Research & Technology
Supplemental Material
sj-txt-3-lrt-10.1177_14771535241252712 – Supplemental material for Defining daytime in the day-dark approach to measuring the pedestrian reassurance of road lighting
Supplemental material, sj-txt-3-lrt-10.1177_14771535241252712 for Defining daytime in the day-dark approach to measuring the pedestrian reassurance of road lighting by J Uttley, S Gorjimahlabani and S Fotios in Lighting Research & Technology
Supplemental Material
sj-xlsx-4-lrt-10.1177_14771535241252712 – Supplemental material for Defining daytime in the day-dark approach to measuring the pedestrian reassurance of road lighting
Supplemental material, sj-xlsx-4-lrt-10.1177_14771535241252712 for Defining daytime in the day-dark approach to measuring the pedestrian reassurance of road lighting by J Uttley, S Gorjimahlabani and S Fotios in Lighting Research & Technology
Footnotes
Appendix
Declaration of conflicting interests
The authors declared no potential conflicts of interest with respect to the research, authorship, and/or publication of this article.
Funding
The authors received no financial support for the research, authorship, and/or publication of this article.
Data availability statement
All data and analytical scripts used to produce the results presented in this paper are given in the Supplemental Material.
Supplemental material
Supplemental material for this article is available online.
References
Supplementary Material
Please find the following supplemental material available below.
For Open Access articles published under a Creative Commons License, all supplemental material carries the same license as the article it is associated with.
For non-Open Access articles published, all supplemental material carries a non-exclusive license, and permission requests for re-use of supplemental material or any part of supplemental material shall be sent directly to the copyright owner as specified in the copyright notice associated with the article.