
Abstract
Daytime light levels are important for human physiology. Office workers spend most of their daytime inside buildings where it is unclear whether they receive healthy light levels. A recent publication presented recommendations for the minimum daytime light level for optimal human health, expressed in melanopic equivalent daylight illuminance (EDI). The current paper assesses whether this recommended daytime light level is achieved by office workers through a meta-analysis of personal light levels of office workers, obtained from light-dosimetry field studies. From our literature search, we identified nine eligible papers. These papers comprised data from studies in one or multiple office buildings, over one or more seasons, from 1 to 62 participants, and for 19 to 564 workdays. After analysing the data, we found that in none of the offices the recommended minimum light level of 250 melanopic EDI was met for the entire day. Only 1 out of 6 median and 6 out of 13 mean reported personal light levels were above this recommended value. Unfortunately, these conclusions are less groundbreaking than we hoped for, due to large differences between study protocols. This resulted in a large variety of (unreported) study characteristics (i.e. light data, light-dosimeter, participant, building and environment) which complicated a fair comparison between the different studies. To facilitate meta-analyses of light-dosimetry field studies, we introduce recommendations for data collection and reporting in light-dosimetry field studies. We based these recommendations on the gaps identified from our meta-analysis, supplemented by recommendations from other papers.
1. Introduction
Light is essential for humans to perceive their surroundings, but light also influences various aspects of human biology and behaviour such as alertness, sleep and circadian rhythms.1,2 These aspects are called non-image-forming (NIF) responses to light. These effects are mediated by a class of non-rod, non-cone photoreceptors in the eye known as intrinsically photosensitive retinal ganglion cells or ipRGCs. Thus, the term ipRGC-influenced light responses is also sometimes used to describe these effects. NIF responses are closely related to human health, performance and well-being.3,4 Misaligned light exposure can shift a person’s internal biological time relative to the actual local time, disrupting circadian processes and sleep, negatively impacting health and performance.5,6
To quantify NIF responses to light, the International Commission on Illumination (CIE) has introduced a system of metrology based on SI-compliant metrics, CIE S 026. 7 According to this system, irradiances are weighted with the spectral sensitivity of the five human retinal opsins (S-cone, M-cone, L-cone, rhodopsin and melanopsin). Under a certain light source, the α-opic equivalent daylight illuminance (EDI) represents the illuminance of daylight (standard illuminant D65) that would result in an equal rate of photon capture, for each of these five opsins. For melanopsin, the α-opic EDI is expressed as the melanopic EDI, measured in lx.
A group of experts in lighting, neurophysiological photometry and sleep, and circadian research has recently published recommendations 8 on the required melanopic EDI to best support physiology, sleep and wakefulness of day-active healthy adults. During daytime, they recommend a minimum of 250 lx melanopic EDI at the eye, that is, measured in the vertical plane at a height of approximately 1.2 m. For the remainder of this paper, this daytime recommendation by Brown et al. will be referred to as the recommended daytime light level.
The daytime melanopic EDI levels office workers receive at eye height are largely dependent on the lighting conditions in office buildings since office workers spend most of their daytime inside the building. Therefore, these interior lighting conditions should constantly provide 250 lx melanopic EDI at eye height to achieve the recommended daytime light level for office workers. Achieving such a value in offices may be challenging since current office lighting design standards are focused on visual performance, visual comfort and energy efficiency. The European standard for lighting of workspaces, EN 12464-1, requires an average (horizontal) task plane illuminance of at least 500 (photopic) lx for typical office tasks (i.e. writing, typing, reading and data processing). The light distributions and layout of office lighting fixtures generally result in the average horizontal task plane illuminance being approximately three times the vertical illuminance received at eye height.9,10 According to this rule of thumb, a horizontal task plane illuminance of 500 lx corresponds to ∼167 lx at eye height. However, to achieve 250 lx melanopic EDI under electric light sources commonly found in offices, that is, fluorescent and LED lighting, an even higher photopic illuminance is needed, 8 indicating a potential mismatch between the (horizontal, photopic) task illuminance target and the (vertical, melanopic) EDI at the eye that is recommended.
It is currently unknown whether consistently achieving the recommended daytime value is feasible for workers in offices. Light levels measured in office spaces – incident on a horizontal plane or even vertically at the assumed eye height – might not correspond to the light levels that office workers experience due to the inability to incorporate (dynamic) human behaviour. Yet, this behaviour may have a considerable impact on the light at eye height during a day. 11 To understand what light levels office workers actually receive under naturalistic conditions, it is necessary to measure light in a personal manner. This is achieved by using wearable light sensors, also known as light-dosimeters. Light-dosimetry is often used in field studies aiming to identify the relationship between personal light levels (PLLs) and physiological or psychological responses. Moreover, light-dosimetry field studies provide rich datasets of lighting conditions in actual buildings and may indicate whether lighting practice should be changed. 12 We define PLLs as light received by a person over time and measured by a dosimeter as close to the eye as possible. Therefore, PLL should exceed the recommended level of 250 lx melanopic EDI during daytime.
To determine whether the recommended daytime light level is met in typical offices, a substantial dataset of PLL measurements collected by light-dosimetry in various office buildings is needed. Light data collection in the field requires a great amount of time and effort and is scientifically challenging to conduct. Accordingly, due to their inherent complexity and cost, field studies are often small-scale. Thus, it is essential to collect field data in a manner that ensures future applicability. Representative findings can then be constructed by combining published results from previous small-scale field studies through a meta-analysis.
Conducting a meta-analysis presents practical difficulties due to differences in research methodologies, individual paper narratives and incomplete data. Data collection and reporting guidelines, such as the FAIR (meaning Findable, Accessible, Interoperable, Reusable) guiding principles for scientific data 13 are increasingly being used in order to help overcome these difficulties. An important goal of the FAIR data guidelines is creating reusable data. In lighting studies, creating reusable data is complex due to the multidisciplinary background of the researchers conducting such studies and the lack of reporting standards across disciplines.4,14 The literature contains examples of researchers from the fields of psychology, biology, medicine and building engineering collecting and reporting data in different ways.11,15–18 Therefore, there is a need for commonly agreed lighting research protocols.
This paper consists of two parts. Firstly, a case study meta-analysis is presented that aimed to identify from published studies whether office workers receive the most recently recommended daytime PLL within offices. Light-dosimetry field studies that report in-office PLL were gathered through a literature search, their data were aggregated and compared with the recently recommended daytime light level of 250 lx melanopic EDI. Secondly, based on the informed experience of attempting a meta-analysis of published light-dosimetry field studies, we present recommendations for data collection and reporting in light-dosimetry field studies, supplemented with recommendations from existing publications. From this perspective, we have identified a number of important factors that should be accounted for in field studies. These recommendations aim to facilitate future meta-analyses of PLL collected in light-dosimetry field studies.
2. Case study PLL meta-analysis: Methodology
This section describes the search criteria to find eligible studies for the PLL meta-analysis. Data were extracted from the identified studies using different methods, including directly extracting data from the papers, extracting data from tables and figures and converting data when needed. The extraction of PLL data from different papers proved to be complex, due to differences in data collection and presentation methods in the identified studies.
2.1 Search
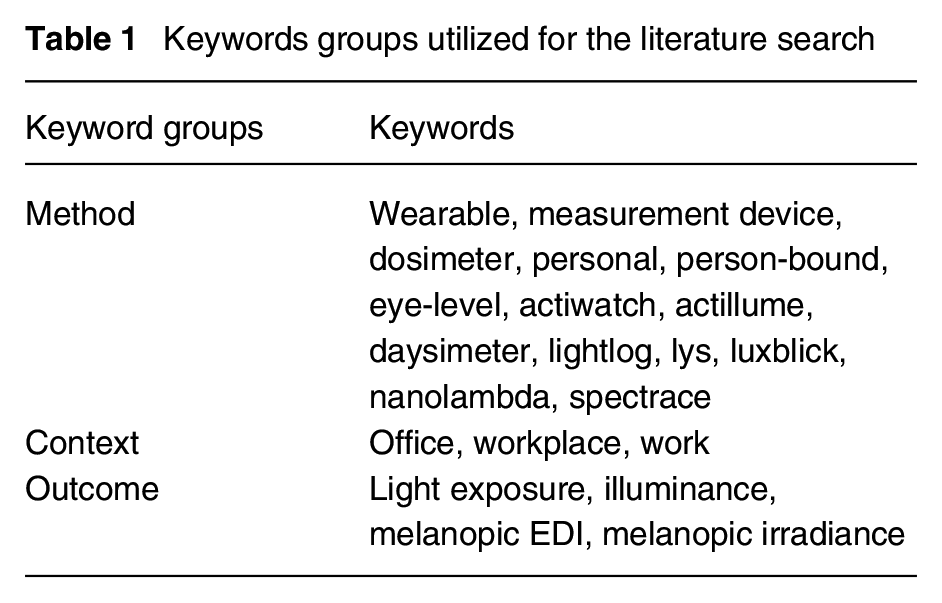
To identify light-dosimetry studies that measured PLL in offices, a literature search was conducted over three databases, that is, Scopus, Science Direct and Web of Science. Three keyword groups were used to describe the method (a light-dosimeter), context (a workplace setting) and outcome (light levels), as given in Table 1. Only studies published in English were considered and no limit was set on the year of publication. The search was performed on 5th April 2023.
Keywords groups utilized for the literature search
The eligibility of studies found in the search was assessed using six inclusion criteria, Figure 1. First, light levels were measured on the bodies of participants using light-dosimeters. Second, the participants were workers with daytime office jobs. Third, to get a representative office sample, studies need to have been carried out in offices having both electric lighting and natural light, that is, windows in the facade or roof. Fourth, no intervention impacting the lighting conditions (as a result of the experimental procedure) was present in the office during the study. Fifth, to identify the light levels within the offices, only levels that were measured within an office building were included in the analysis. To exclude light levels measured outside the office, studies were only included if they provided an in-office presence filter or allowed the extraction of light levels during (assumed) work hours on workdays. Sixth, the light levels were published using a SI-compliant metric such as melanopic EDI or photopic illuminance (allowing estimation of the melanopic EDI), to allow comparison with the recommended daytime light level. Based on these criteria, all studies found in the search were evaluated based on the title and abstract. Next, using the same criteria, the remaining studies were analysed on full text. For all studies that were included in this case study, forward and backward tracing was conducted.
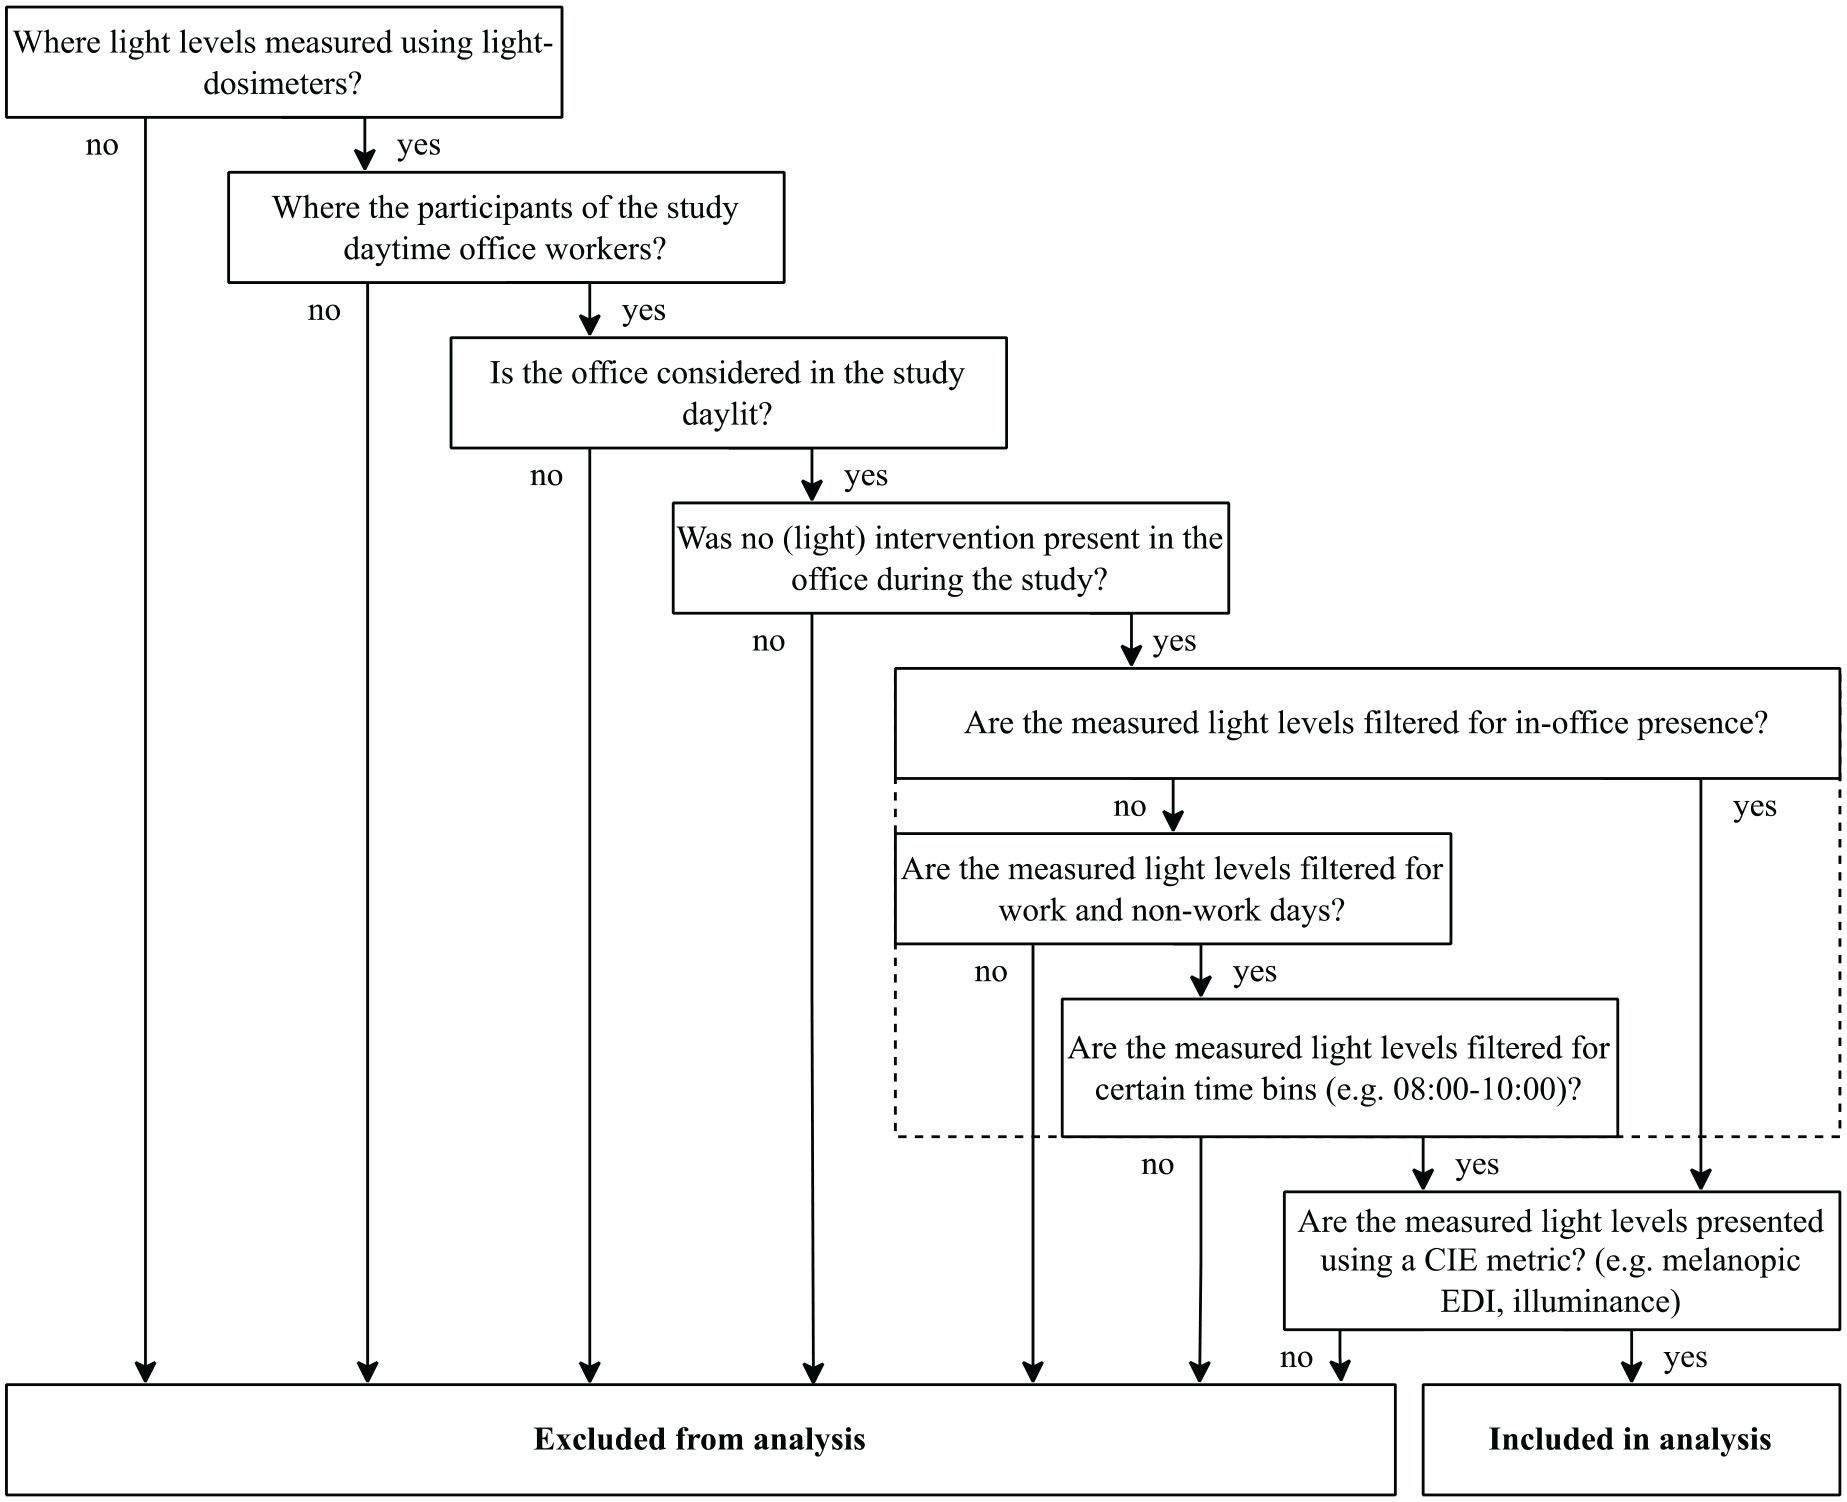
Procedural overview of the inclusion criteria applied to identify eligible studies
2.2 Data extraction
The following data were extracted from the identified studies: the applied measurement protocol; office characteristics that are deemed to have an impact on the lighting conditions and the measured PLL while in the office to allow comparison with the recommended daytime light level.
2.2.1 Measurement protocols
From each study, the used light-dosimeter, sample interval and location of the dosimeter on the body were extracted. Additionally, the number of participants and the average number of measurement workdays were recorded. Using the number of participants and workdays, the total number of measurement days during every study, for every season individually, was calculated.
2.2.2 Light-related office characteristics
The type of light sources present and the luminous reflectance factors of the interior surface finishes were extracted. Additionally, daylight characteristics such as the window orientation, user orientation relative to the closest window and the location of the office (country, city and geographical latitude) were extracted. If no geographical latitude was published, an approximated value based on the office’s location was derived.
2.2.3 Personal light levels
From every study, the PLLs were extracted as published, that is, a box plot, median value, or mean value and standard deviation (SD). Log-transformed light levels were inverse log-transformed, standard errors (SE) were converted to standard deviations and time-integrated light levels, for example, lux × hours, were converted to average light levels. To distinguish the in-office measurements from all measurements (that might include the participants’ commutes to the office or outdoor lunch breaks), three methods were applied, as depicted in Figure 2. First, option A, if a study presented PLLs that were recorded while the person was present in the office building, only these levels were utilized. Second, if in-office filtered PLLs were not available, the levels were extracted in the smallest time bin possible, either from tables or figures. Data were derived from figures using WebPlotDigitizer, an online image-extraction tool. 19 If the arrival, lunch and departure times of the study’s participants were noted, light levels were filtered for the closest available time bin (option B). Third, if these times were not specified, working hours were assumed from 08.00 to 17.00 (option C). Combined means and standard deviations of multiple time bins were calculated using decomposition. 20
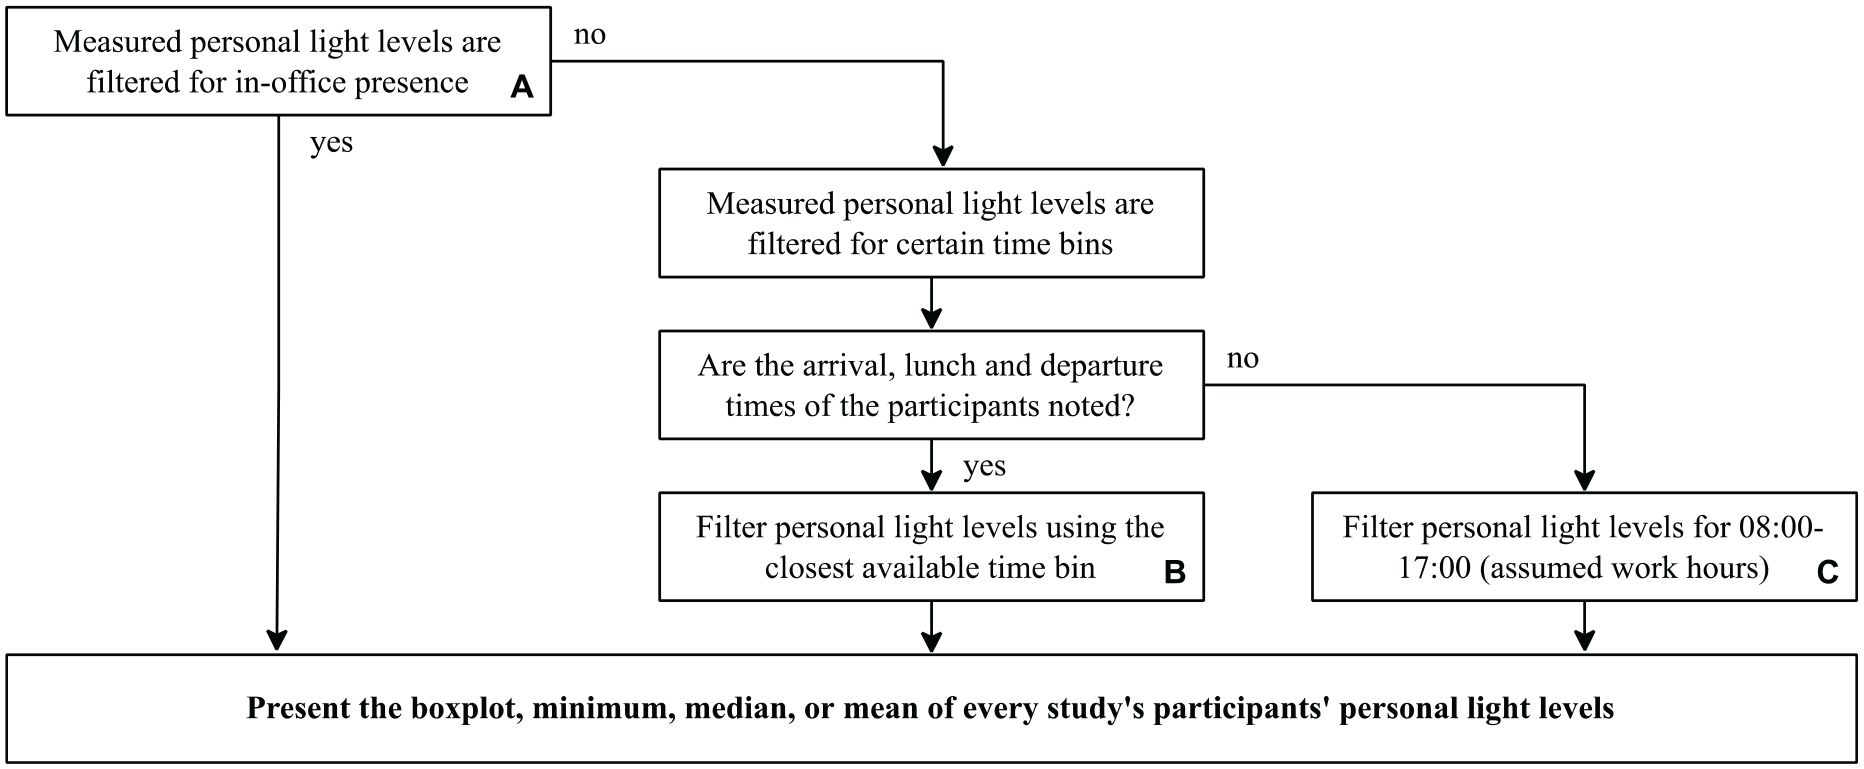
Three extraction methods (A, B and C) to distinguish PLLs measured while in the office
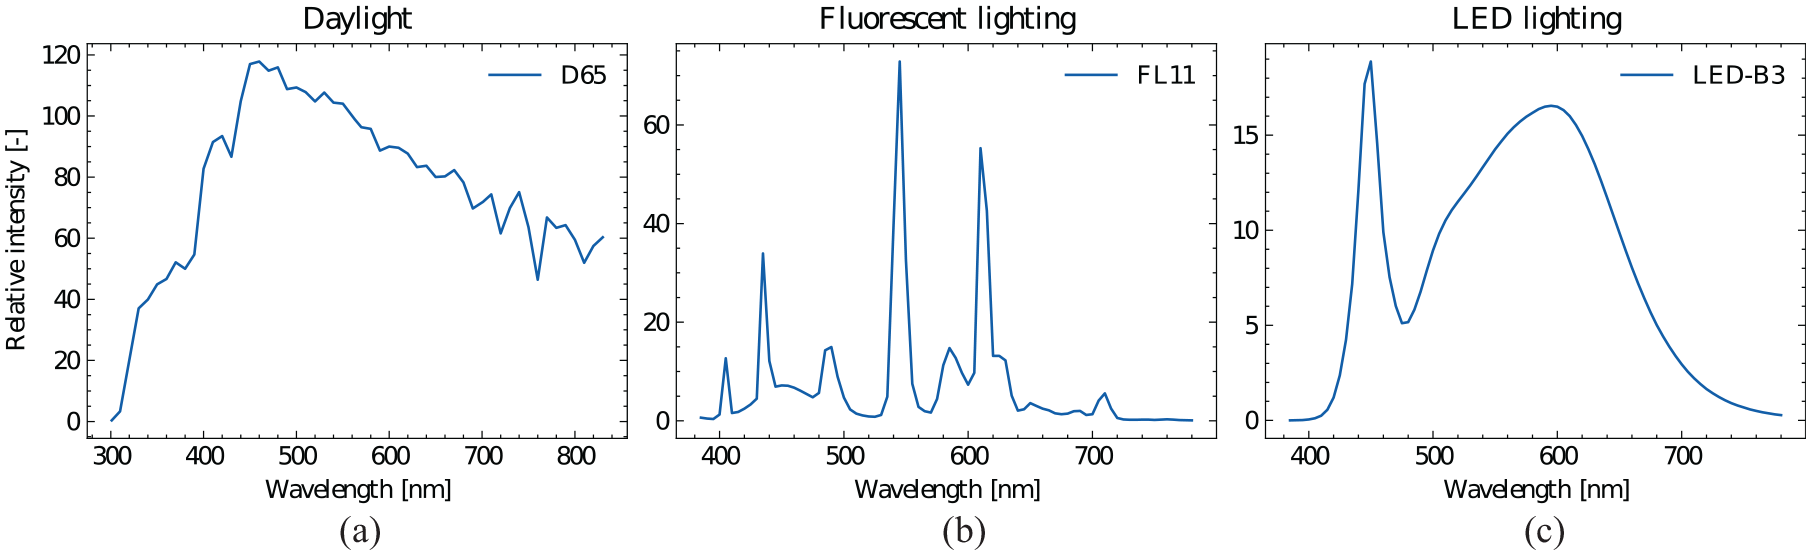
PLLs presented solely by photopic illuminances do not provide the spectral data needed to compute the corresponding melanopic EDI. For a certain light source, the photopic illuminance corresponding to the recommended daytime light level of 250 lx melanopic EDI can be calculated based on the source’s spectral power distribution. By calculating the photopic illuminances corresponding to 250 lx melanopic EDI for spectral power distributions of light sources commonly found in offices (daylight, fluorescent lighting and LED lighting), measured photopic illuminances can be compared to the recommended daytime light level. Depending on the relative contribution of every light source present, the photopic illuminance needed to reach 250 lx melanopic EDI may vary. For a typical fluorescent and LED spectrum (standard illuminants FL11 and LED-B3), 21 photopic illuminances of 445 lx and 396 lx, respectively, are needed at eye height in the vertical plane to achieve 250 lx melanopic EDI (Figure 3). For a combination of these light sources (daylight, typical fluorescent and LED), the photopic illuminance threshold to reach 250 lx melanopic EDI was determined to be somewhere between 250 lx and 445 lx.
The in-office PLLs found in each study, organized by the season in which the measurements were conducted, were plotted in one figure. The required photopic illuminances to achieve 250 lx melanopic EDI (Figure 3) under daylight (D65), fluorescent (FL11) and LED (LED-B3) were also indicated in this figure.
3. Case study PLL meta-analysis: Results and discussion
The search identified 408 studies, of which, after removal of duplicates and screening using the given inclusion criteria (Figure 1), four were included in this case study. Backward (reference) tracing of these four studies identified three additional eligible studies. Forward tracing of all included studies identified two more studies, which resulted in nine studies in total included in the review. The search process is shown in Figure 4. In this section, the results of the data extraction are presented in terms of measurement protocols of the nine studies, light-related office characteristics and identified PLLs. Then, the limitations of the analysis are discussed.
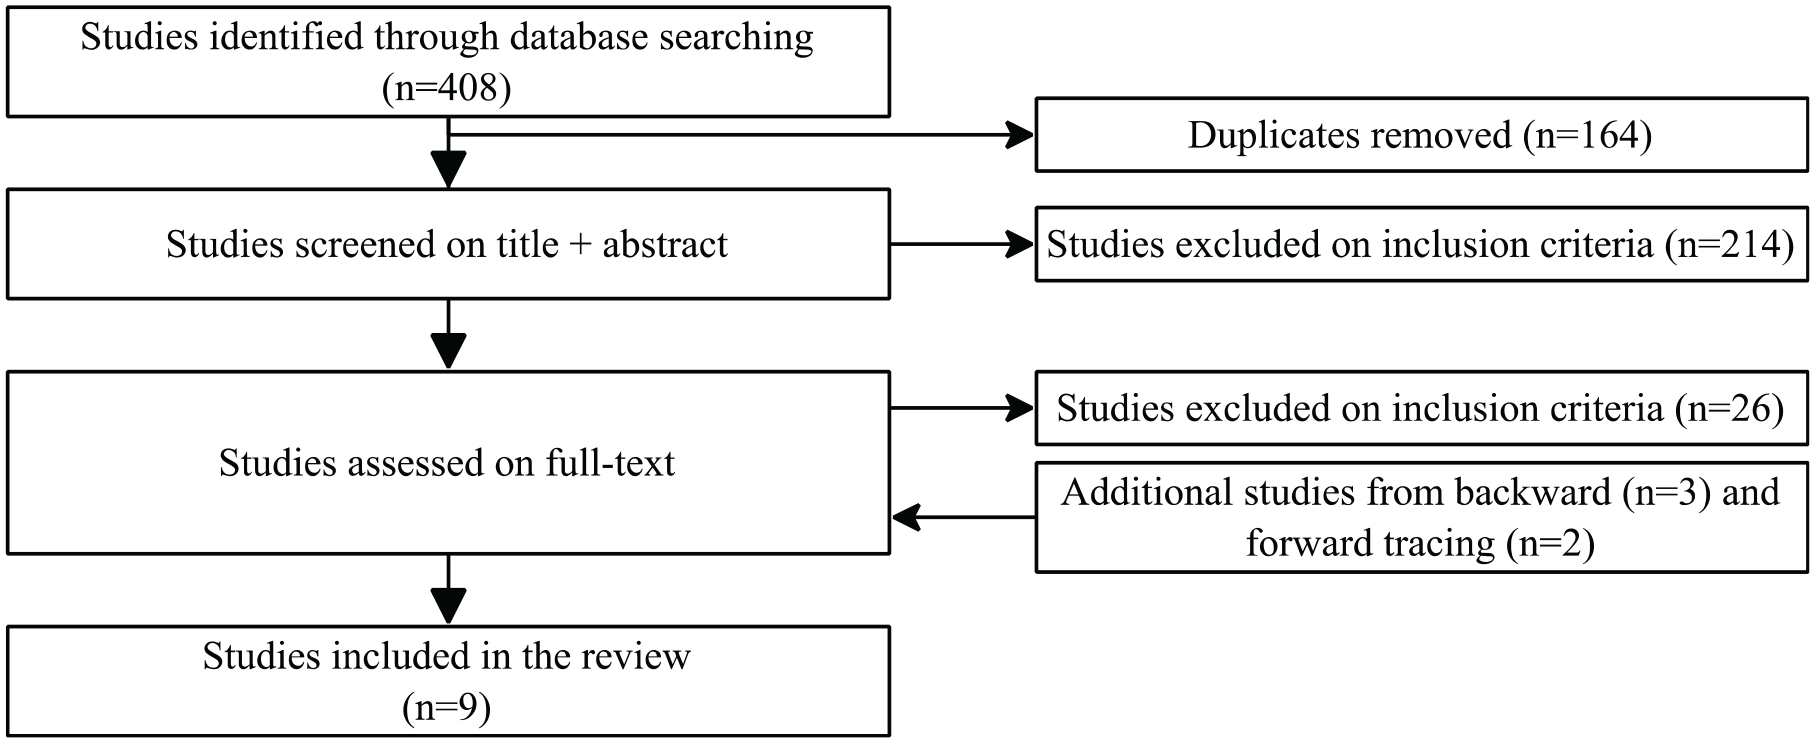
Procedural overview of the applied literature search process
3.1 Measurement protocols
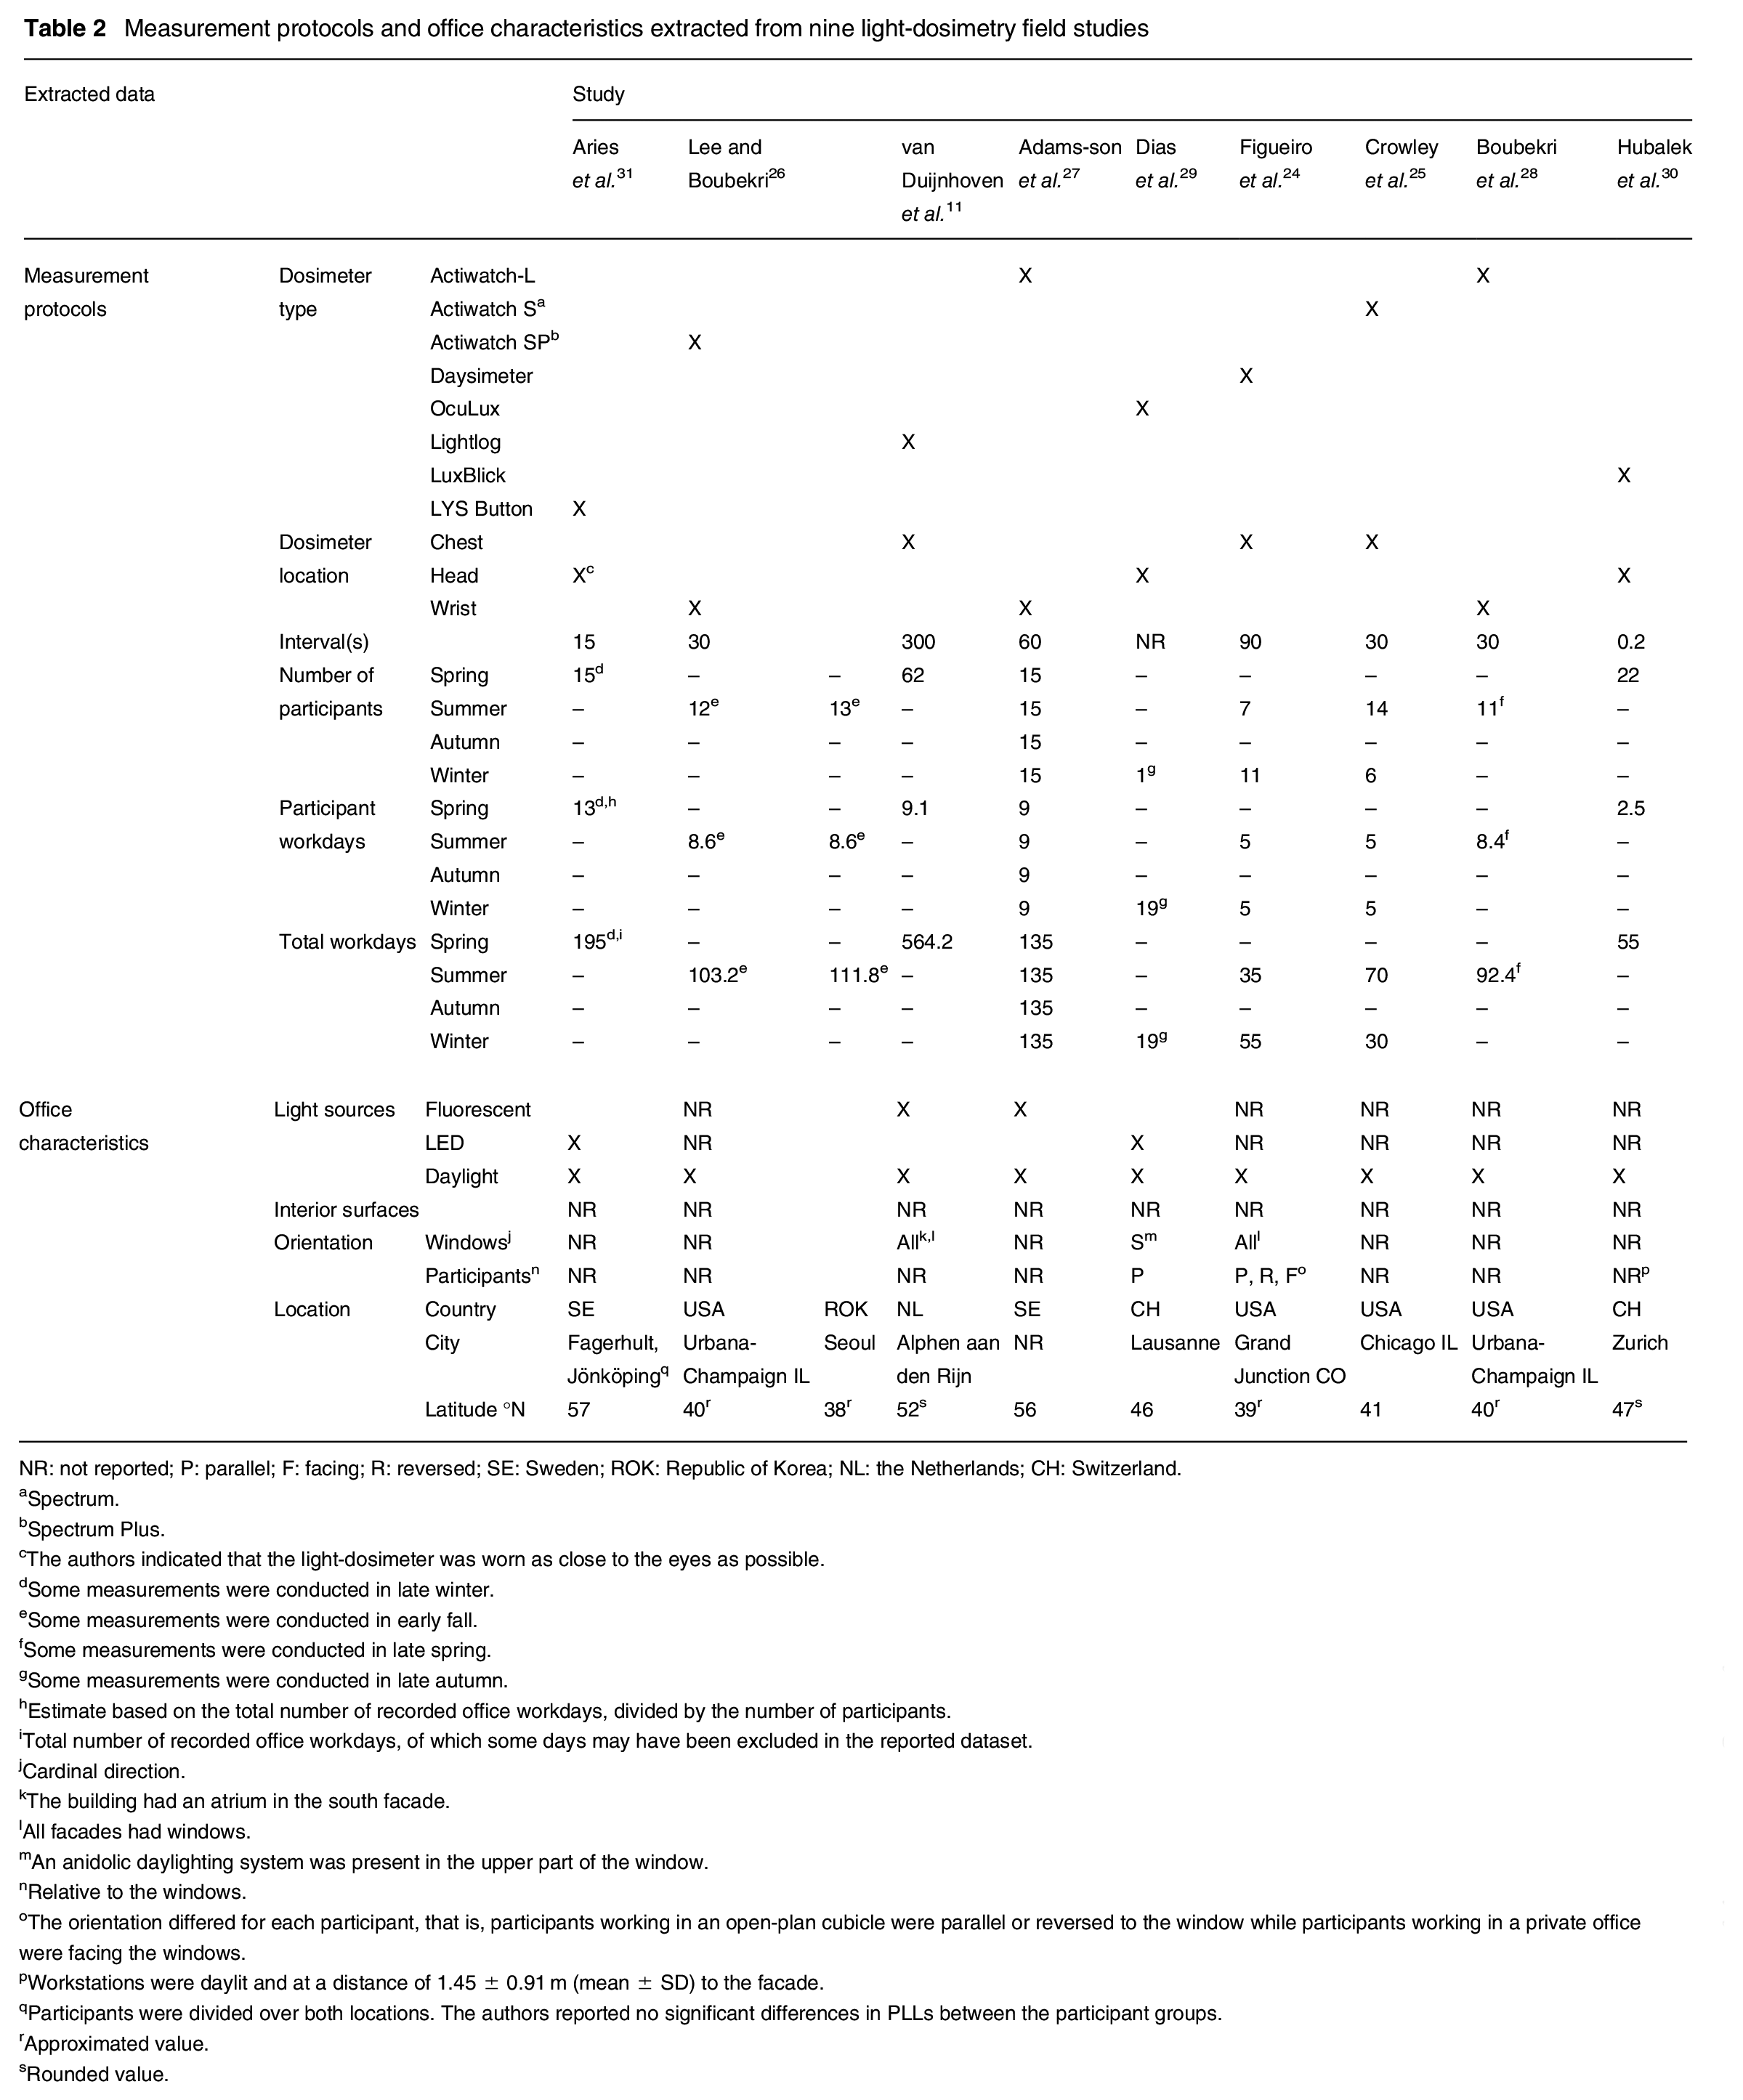
The measurement protocols of the studies are given in Table 2. On average, 8.3 ± 3.9 (mean ± SD) workdays were measured including 15.6 ± 13.7 (mean ± SD) participants. The participants wore the light dosimeter on the chest in three studies,11,24,25 on the wrist as a watch in three studies,26–28 between the eyes using a pair of glasses in two studies,29,30 and close to the eyes in one study. 31 Five studies25,27,28,30,31 conducted measurements in multiple office buildings located in close proximity and combined the datasets, whereas one study 26 presented the results separately since the offices were located in different countries. Two studies26,28 measured in offices with and without daylight from which only results from offices with daylight were included in this case study.
Measurement protocols and office characteristics extracted from nine light-dosimetry field studies
NR: not reported; P: parallel; F: facing; R: reversed; SE: Sweden; ROK: Republic of Korea; NL: the Netherlands; CH: Switzerland.
Spectrum.
Spectrum Plus.
The authors indicated that the light-dosimeter was worn as close to the eyes as possible.
Some measurements were conducted in late winter.
Some measurements were conducted in early fall.
Some measurements were conducted in late spring.
Some measurements were conducted in late autumn.
Estimate based on the total number of recorded office workdays, divided by the number of participants.
Total number of recorded office workdays, of which some days may have been excluded in the reported dataset.
Cardinal direction.
The building had an atrium in the south facade.
All facades had windows.
An anidolic daylighting system was present in the upper part of the window.
Relative to the windows.
The orientation differed for each participant, that is, participants working in an open-plan cubicle were parallel or reversed to the window while participants working in a private office were facing the windows.
Workstations were daylit and at a distance of 1.45 ± 0.91 m (mean ± SD) to the facade.
Participants were divided over both locations. The authors reported no significant differences in PLLs between the participant groups.
Approximated value.
Rounded value.
3.2 Light-related office characteristics
The characteristics of the offices used in the studies are given in Table 2. Only four studies reported the electric lighting type, of which two studies11,27 had fluorescent lighting and two studies29,31 had LED. None of the studies reported the luminous reflectance factors of the interior surfaces. Moreover, only three studies reported the orientation of the windows in the facades, with two studies11,24 having windows in all facades and one study 29 having windows only in the south. Merely, two studies indicated the orientation of the office workers relative to the facade windows, with one study 29 having their participants seated parallel to the window, and the other one study 24 having varying orientations for every participant. All offices were located on the northern hemisphere in a geographical latitude range between 38°N and 57°N.
3.3 Personal light levels
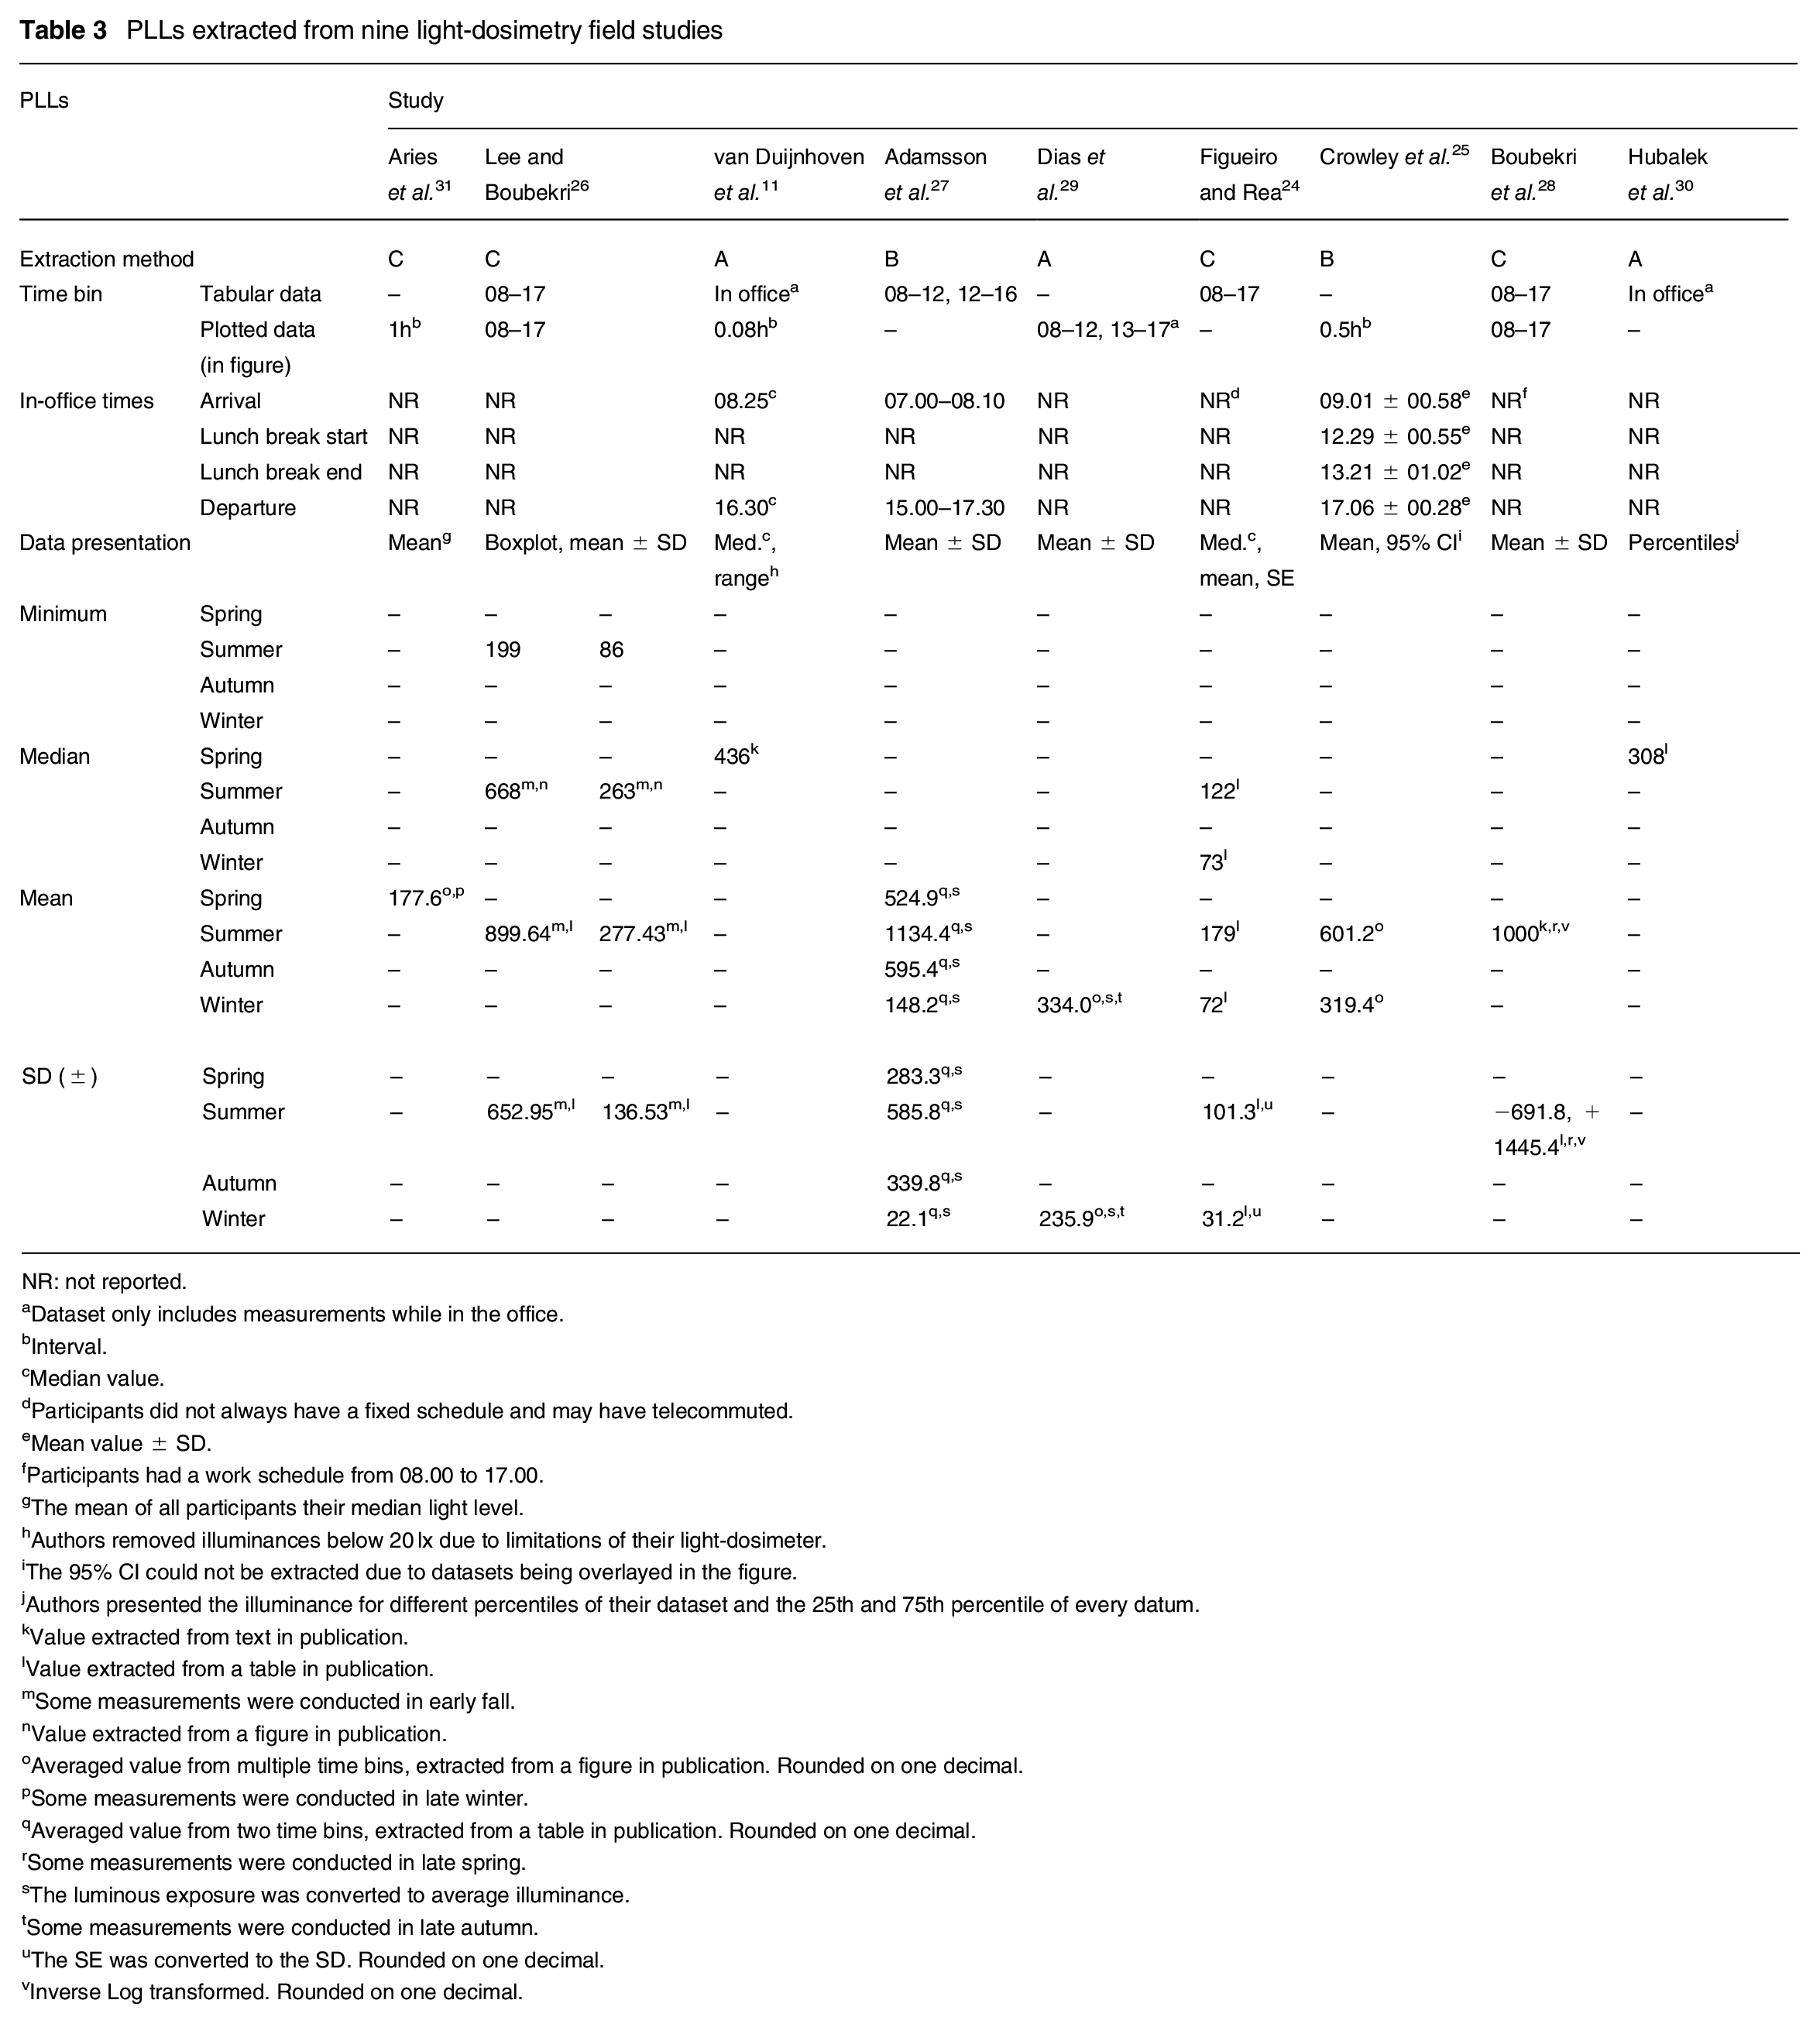
None of the studies presented PLLs using melanopic EDI. Instead, all studies reported person-bound photopic illuminances as shown in Figure 5 and in Table 3 together with the utilized extraction method, time bins of the illuminance datasets and in-office times of the participants. The median illuminances were in a range from 73.0 lx to 668.0 lx, based on four studies11,24,26,30 describing in total six measurement periods. The mean illuminances were in a range from 72.0 lx to 1134.4 lx, based on seven studies24–29,31 describing 13 measurement periods. The minimum illuminances were reported by only one study 26 for two measured offices and were approximately 199 lx and 86 lx. A ‘measurement period’ here means a period in which illuminance measurements were performed by a study in a certain office, during a certain season (since some studies performed measurements in multiple offices and/or during multiple seasons). In total, 15 measurement periods were extracted with 4 in spring, 6 in summer, 1 in autumn and 4 in winter.
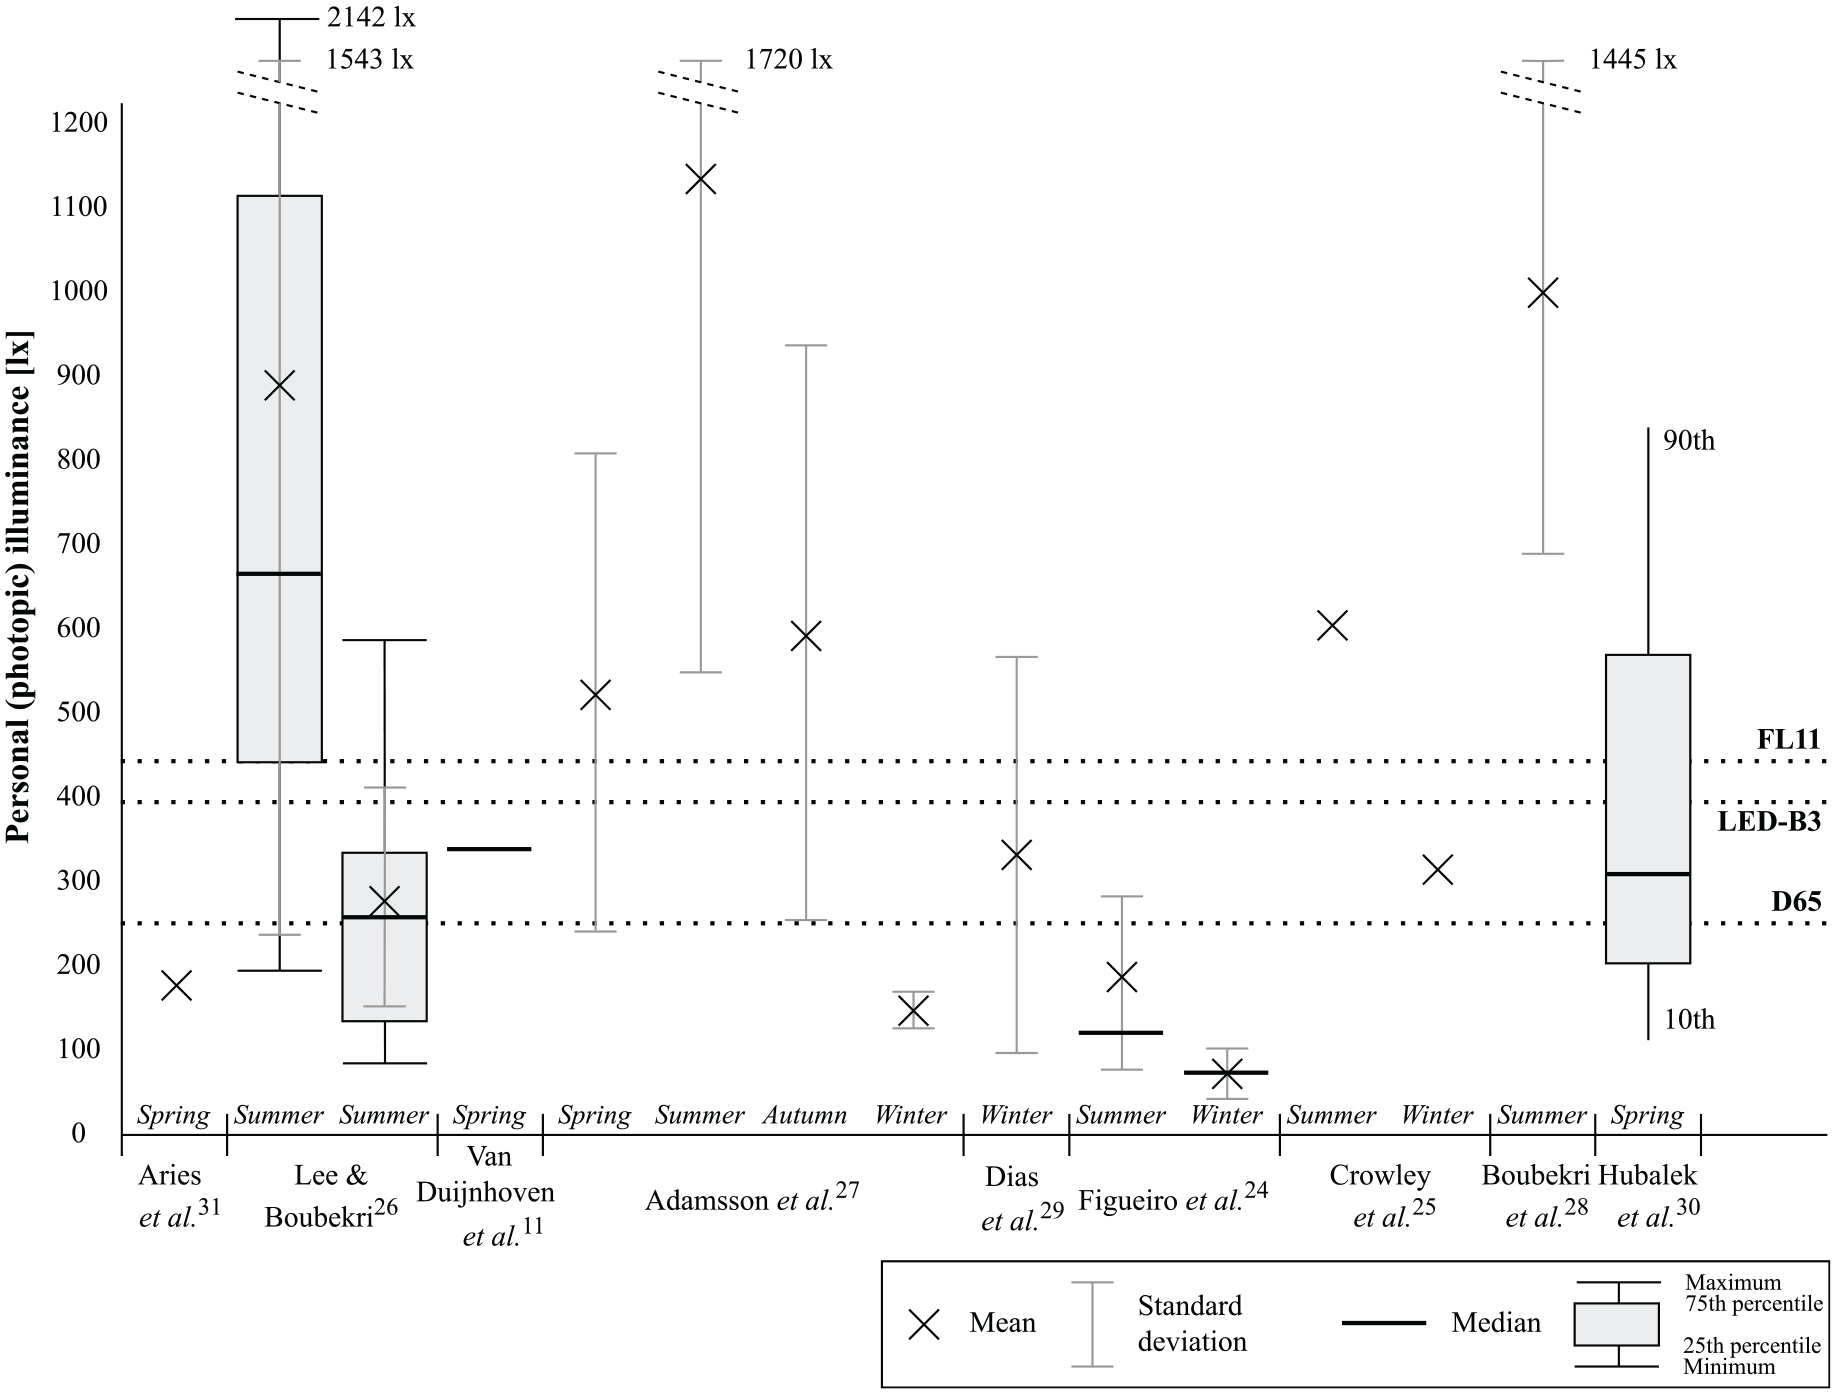
Personal photopic illuminances (lx) received by workers while in the office. Dashed lines indicate the required photopic illuminance to reach 250 lx melanopic EDI under solely standard illuminants D65, FL11 or LED-B3. The number of participants and measurement days for every measurement period are available in Table 2. The variability within the participant group for every percentile 30 and the median range of all participants 11 are not shown in the figure. Quantifications of radiation in the bluish part of the light spectrum11,27,30 were not considered in this case study
PLLs extracted from nine light-dosimetry field studies
NR: not reported.
Dataset only includes measurements while in the office.
Interval.
Median value.
Participants did not always have a fixed schedule and may have telecommuted.
Mean value ± SD.
Participants had a work schedule from 08.00 to 17.00.
The mean of all participants their median light level.
Authors removed illuminances below 20 lx due to limitations of their light-dosimeter.
The 95% CI could not be extracted due to datasets being overlayed in the figure.
Authors presented the illuminance for different percentiles of their dataset and the 25th and 75th percentile of every datum.
Value extracted from text in publication.
Value extracted from a table in publication.
Some measurements were conducted in early fall.
Value extracted from a figure in publication.
Averaged value from multiple time bins, extracted from a figure in publication. Rounded on one decimal.
Some measurements were conducted in late winter.
Averaged value from two time bins, extracted from a table in publication. Rounded on one decimal.
Some measurements were conducted in late spring.
The luminous exposure was converted to average illuminance.
Some measurements were conducted in late autumn.
The SE was converted to the SD. Rounded on one decimal.
Inverse Log transformed. Rounded on one decimal.
The recommended daytime light level of 250 lx melanopic EDI corresponds to a range of 250 lx to 445 lx (photopic) under assumed office light sources (Figure 3). Thus, to undoubtedly meet this level, all reported illuminances should be above 445 lx. When accounting for the contribution of daylight, photopic illuminance should be above 250 lx. Based on the minimum values reported in the studies, neither the strict threshold of 445 lx nor the favourable threshold of 250 lx is met. Based on the median values, only one period out of the reported six meets the strict threshold of 445 lx, and four out of six meet the favourable threshold of 250 lx. Based on the reported mean values, 6 out of 13 measurement periods met the strict threshold of 445 lx and 9 out of 13 meet the favourable threshold of 250 lx.
It should be noted that the Brown et al. recommendation describes a minimum PLL value. Given the lack of reported minimum illuminance values, evaluations can be made based on the reported median or mean PLLs. The median is more useful because it indicates the PLLs that were achieved for 50% of the time. The mean can only be interpreted as indicative and cannot be used to estimate the percentage of time that the recommended daytime light level was met. This is stressed by the fact that of the two studies24,26 that reported both a median and mean value, considerable differences are present between both values, as shown in Figure 5.
Brown et al. suggested several approaches that could be used individually or in combination to achieve the recommendation in buildings, such as optimizing daylight availability, utilizing lighting fixtures with relatively high radiation in the bluish part of the light spectrum or optimizing interior surface finishes.32–35 None of the studies included in this case study reported that the offices utilized lighting fixtures with a relatively high radiation in the bluish part of the light spectrum or optimized interior surface finishes (Table 2). The descriptions of the offices used by three of the studies indicate some optimization for the available natural light. In these offices, workstations were all close to the facade (1.45 m ± 0.91 m, mean ± SD), 30 glazing was present in all facades and an atrium in the south facade, 11 or an anidolic daylighting system was located in the upper part of the window. 29 Hence, these offices may be considered to have considerable daylight potential. Of these three studies, the former two presented a median illuminance in the range of 308 lx (spring) to 436 lx (spring), whereas the latter presented a mean of 334 lx (winter), as given in Table 3. Thus, on average, the illuminances were lower than 445 lx, but above 250 lx (Figure 3). All the offices in the case study meta-analysis had daylight openings and were located on the northern hemisphere in a relatively small geographical latitude range (38°N to 57°N). Thus, differences in illuminances are expected due to seasonal differences in the availability of natural light. Studies conducted in summer reported generally higher illuminances (Figure 5). Three studies24,25,27 applied the same measurement protocol in multiple seasons, allowing comparisons. For all three studies, the mean illuminances of the measurements, while in the office, were between 1.9 and 7.7 times higher in summer compared to winter. One study 24 additionally reported the median illuminance, which was 1.7 times higher in summer compared to winter.
Three different methods of in-office data extraction were applied (Figure 2). Three studies presented illuminances that were filtered for in-office presence by having participants wear the light-dosimeter only while in the office, 29 fill in diaries 11 or questionnaires, 30 allowing data extraction method A (Figure 2). Two studies published time binned illuminance levels, that is, in 4-h bins, 27 or 30-min bins (extracted from a figure), 25 and the arrival and departure times, 27 or arrival, departure and lunch times 25 of the participants, allowing extraction method B (Figure 2). Four studies published the average illuminances between 08.00 and 17.0024,26,28 or for every hour 31 on workdays but did not provide information on the time in office, resulting in extraction method C (Figure 2).
3.4 Limitations of the analysis
The meta-analysis was impeded by the large differences between study protocols and several unreported study characteristics. None of the studies followed a specific data collection protocol. Instead, in the methodologies, references were made to previous work, or no references at all were provided. Limitations in data collection and reporting were identified in relation to light data, light-dosimeter, participant, building and environment.
3.4.1 Light data
Based on the data presented by the studies, one cannot determine the minimum PLLs that are needed to identify if the recommended daytime light level is met. Moreover, the inter-individual differences in PLLs of workers in the same office could not be determined, meaning that it was not possible to identify whether all individuals receive the recommended light level. Only three out of the eight studies gave some indication by reporting the 95% confidence interval 25 of the mean individual illuminances or the range of individual illuminances for every percentile 30 or solely the median 11 of their participants. Every study included in this case study essentially collected the requisite data to determine the minimum PLLs of office workers. However, the distinct narratives in each study resulted in various data presentation approaches, obstructing or challenging the extraction of the necessary data. Moreover, since all the reviewed papers reported light in terms of photopic illuminance, the Brown et al. recommended daytime light levels were converted to photopic illuminance by assuming the spectral power distribution of typical office light sources. However, the assumed spectra might not correspond to the actual spectral composition of light within the offices.
3.4.2 Light-dosimeter
PLLs were measured at different positions on the body (chest, head and wrist), but positions close to eye-level are the most relevant for this case study. Relative to the eye position, substantial differences occur for other positions. 36 A 27% inaccuracy for the wrist, a 17% inaccuracy for the chest and a 7% inaccuracy for the side of the glasses has previously been reported for indoor light measurements. 37 Hence, depending on the location of the light-dosimeter in a study, the results may differ. Studies that used a dosimeter that measured on the chest24,25 or head29,31 (Table 2) reported, on average, lower mean illuminances than studies26–28 in which the illuminances were measured on the wrist (Figure 5). It can be hypothesized that dosimeters worn on the wrist were oriented horizontally when sitting at a desk. Hence, higher values measured by wrist-worn dosimeters may be explained by the previously introduced 3:1 rule of thumb between the horizontal task plane illuminance and the vertical illuminance at eye height.9,10
Seven out of nine studies utilized off-the-shelf light-dosimeters without reporting a calibration process. In only two11,29 of the included studies, the error of the dosimeter was reported. The accuracy of dosimeters may not be consistent due to differences in spectral response, spatial sensitivity and absolute response, 27 or the used calibration was not optimized for light levels found indoors. 28
3.4.3 Participant
Extracting in-office PLLs from the included studies proved challenging due to the difficulty of identifying for which periods of time a participant was within the office environment. To distinguish measurements in offices from all reported PLLs, it was necessary to apply three methods (Figure 2). Method A, using in-office presence filtered data as published by a study, is deemed the most accurate, followed by respectively methods B, and C, which require some assumption on the locations of the participants. The data needed to allow extraction of in-office PLLs, the arrival, departure and lunch break times (Figure 2, methods B and C), was incomplete for five out of six studies (Table 3). Hence, the presented PLLs may have included data while participants were outside the office, where light levels can be substantially higher than indoors. 38 Therefore, when light-dosimetry data has been collected in an environment that is both indoors and outdoors, the median of the dataset may provide a better estimate of the central tendency rather than the mean since the median is less affected by extreme values. Out of the 15 measurement periods shown in Figure 5, 9 are presented using only a mean illuminance value,25,27–29,31 and 8 of these periods were extracted using methods B or C (Figure 2).25,27,28,31 One study’s 31 mean is the mean of every participant’s median illuminance, thus preventing the effects of including outdoor measurements. For the other seven25,27,28 measurement periods, the presented mean illuminances might be higher due to the inclusion of some outdoor measurements.
3.4.4 Building
Office characteristics were only sparsely reported (see Table 2), disallowing identification of factors impacting the presented PLLs. Consequently, an in-depth analysis for identifying whether office characteristics affect PLLs could not be conducted. Nevertheless, it would be interesting to investigate how the characteristics and position of electric light sources, the window and shading properties, the reflectance of the interior surfaces and the orientation of the office room influenced the measured PLLs.
3.4.5 Environment
All the identified studies reported the season during which the data collection took place and the (approximate) location of the study, but only two25,31 reported the exact period in which data were collected. However, the contribution of daylight cannot be adequately estimated by only season and location. For all the identified studies, daylight was likely to have been a significant contribution to the illumination received by the participant. The quantity and quality of daylight in buildings is continually changing due to the natural variation in sun and sky conditions from one moment to the next. Hence, knowledge of the external daylight conditions over the duration of any field study would have been essential to determine how significant or otherwise the daylight contribution might have been to measured PLLs. The in-office PLL results presented in Figure 5 are likely a mixture of daylight and electric light, and it is not possible to identify the contribution of each.
4. Recommendations for data collection in light-dosimetry field studies for reliable meta-analyses
In the future, to overcome the limitations in the source data revealed by the meta-analysis, we propose recommendations for data collection and reporting relevant for researchers conducting light-dosimetry field studies. Whilst these recommendations are primarily for allowing more reliable-meta analyses, there is also the potential for (low-cost) enrichment of existing datasets. Previous research has suggested guidelines and checklists describing how to correctly use light-dosimeters 39 and how to correctly report data from laboratory experiments on the NIF responses to light.40,41 In the proposed recommendations, elements of existing checklists are combined and supplemented by necessary information that needs to be provided for light measurements in the field based on the insights gained from the meta-analysis case study. The summary of the recommendations is presented in Table 4, and it contains the five categories mentioned in the limitations section.
Information that needs to be reported in light-dosimetry studies to allow for meta-analyses
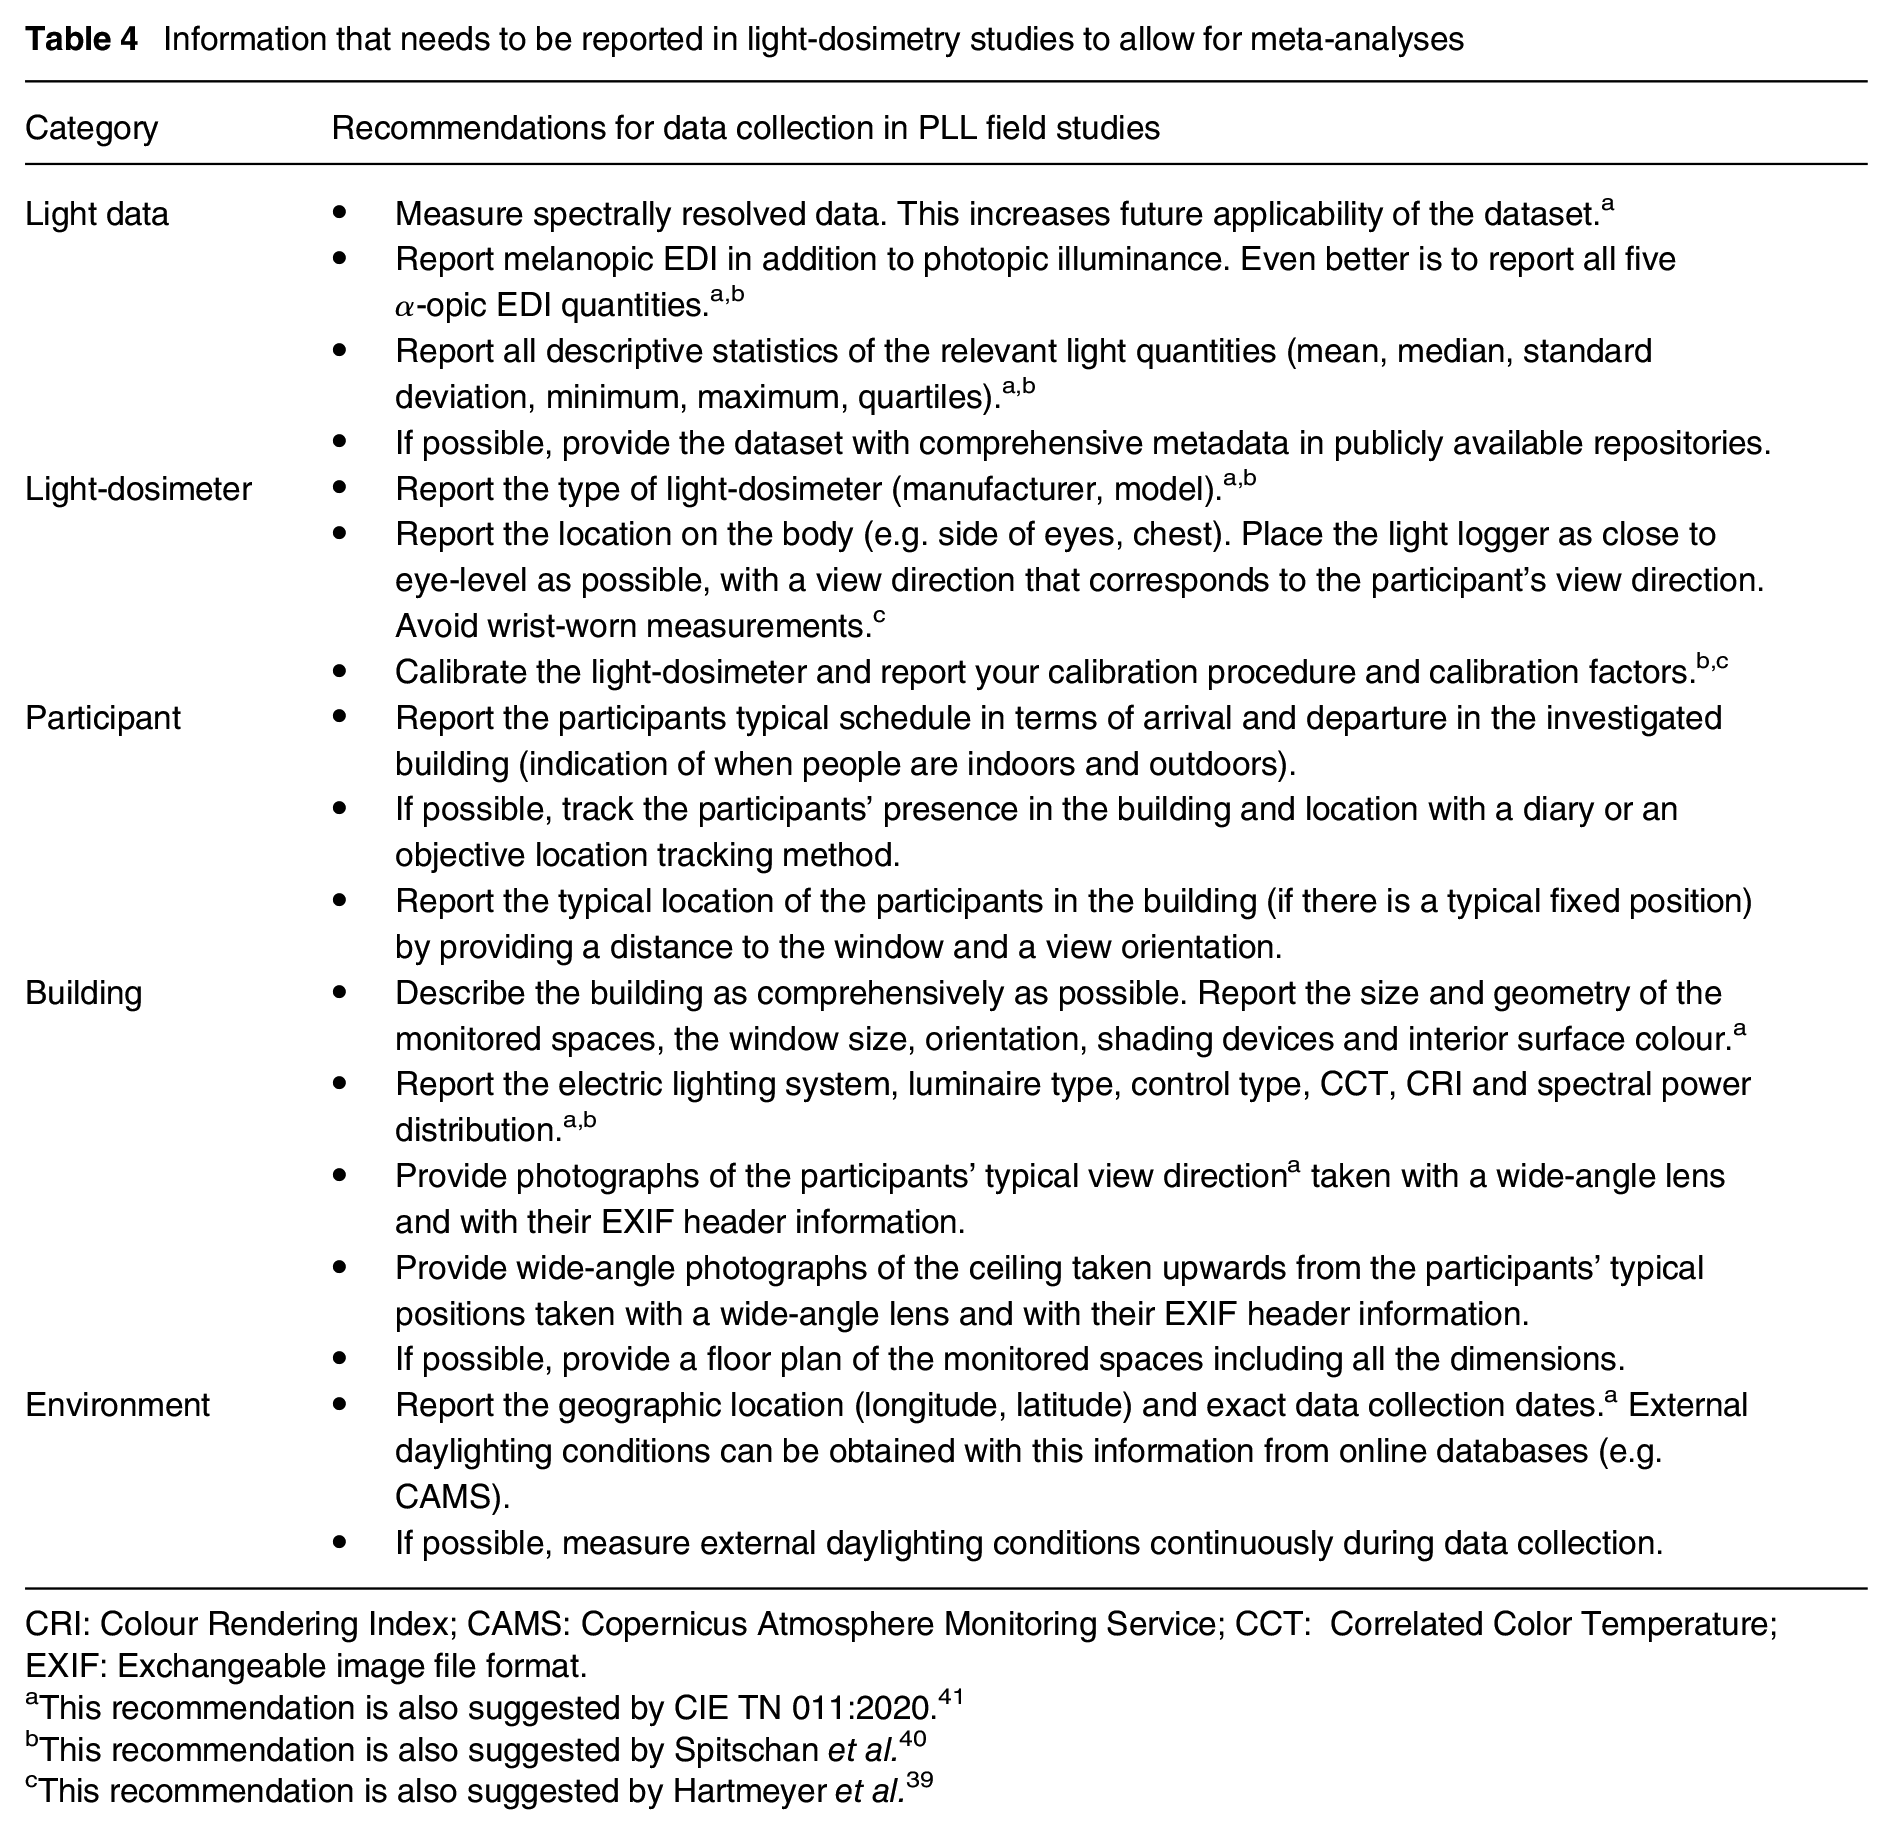
CRI: Colour Rendering Index; CAMS: Copernicus Atmosphere Monitoring Service; CCT: Correlated Color Temperature; EXIF: Exchangeable image file format.
This recommendation is also suggested by CIE TN 011:2020. 41
This recommendation is also suggested by Spitschan et al. 40
This recommendation is also suggested by Hartmeyer et al. 39
4.1 Light data
In the meta-analysis case study, the focus was on evaluating minimum, mean and median PLLs against the recent Brown et al. 8 recommended daytime light levels. It was clear from Figure 5 that even basic descriptive statistics, such as mean, median, minimum, maximum, standard deviation and interquartile range, are not always provided. Reporting only mean light levels does not sufficiently describe the light environment experienced by a person. Yet, there is currently no consensus on how PLL data should be quantified and reported. 42 Part of the difficulty in precisely reporting data collected from field studies lies in the fact that PLL data are collected sequentially over time (in a time series manner), which results in a large size of data points per participant. This means that aggregated measures per participant need to be reported, as well as measures of inter-individual differences.
Given the complexity of the data, it might be advisable to normalize the sharing of datasets in online databases. This would maximize the value of the collected data and allow future researchers to compare data from different studies. When sharing datasets, it is important to ensure that they are reusable by providing metadata that contain a comprehensive description of the data. The metadata schema by Spitschan et al. 43 is a useful step in the road towards standardizing the way that PLL data are shared.
It is understood that photopic illuminance does not sufficiently describe the NIF responses to light. Since it is likely that multiple photoreceptors contribute to certain NIF responses, 44 it is recommended to measure spectral irradiance data, from which all relevant light metrics can be calculated (α-opic EDI quantities and photopic illuminance). The calculation of NIF light metrics from spectral irradiance is possible through (i) researchers’ individual code (e.g. writing Python code for the specific application), (ii) available tools for single point-in-time calculation (e.g. excel-based CIE S 026 toolbox, 23 luox web platform 45 ) or (iii) available tools for analysis of time series data (e.g. pyLight open-source Python package 46 ).
4.2 Light-dosimeter
A notable limitation of three of the reviewed studies was the wrist-worn position of the light-dosimeter which might lead to overestimation of the light dose. Wrist-worn dosimeters can only give a very rough indication of the light levels near a person and cannot be used to measure PLLs at eye-level, as has been recommended for over 10 years. 18 To accurately measure PLLs, it is important to place the dosimeter as close to eye-level as possible. Positions between or at the side of the eyes or forehead are preferred. If this is deemed obtrusive or burdensome for the participants, a chest-worn dosimeter might also be adequate.
In addition, it was evident not only from the current meta-analysis, but also from previous literature reviews, 39 that calibration procedures of light-dosimeters are rarely described. However, it is important to understand that such dosimeters tend to be inaccurate. 37 Therefore, testing and calibration are needed before using them in a field study. For dosimeters that measure spectral irradiances, the spectral responsivity, directional response and linearity should be computed, and possibly, corrected for. Spectral calibrations are detailed in CIE 202:2011. 47 For the directional response and linearity, a quantity derived from spectral data, such as melanopic EDI, can be used, following CIE 19476:2014. 48 Ongoing work (CIE JTC 20 (D6/D2)) is developing a calibration protocol specifically for wearable α-opic dosimetry.
4.3 Participant
In a laboratory study, the environment to which the participants are exposed and the time spent in that environment is well-defined. On the contrary, in a field study, participants typically move freely to different spaces and go outdoors. To evaluate if characteristics of the built environment influence PLLs, it is important to know when a person is indoors or outdoors. Therefore, light-logging might need to be combined with some form of location tracking. In the meta-analysis case study, three different methods were used to identify in-office light data (Figure 2). Some of these methods required several assumptions (e.g. taking typical work hours to be 08.00 to 17.00) which reduced the reliability of the data. The data reliability would have been improved if additional information about the participants’ location was provided.
Several techniques can be used for location tracking. The simplest technique is to report the participants’ typical schedule (i.e. typical arrival and departure time). More accurately, this can be achieved by using a diary or a questionnaire where participants report their arrival and departure times in a space. A paper-based diary is a simple tool, although additional effort of the participants to fill in the diary needs to be considered. 11 Objective measures of location through smartphones or commercially available devices can also be useful, for example, tracking location through Bluetooth, 49 WiFi 50 or Visible Light Communication. 51 Nevertheless, such objective measures might need additional work, data protection considerations and might not be relevant for all field studies. The level of detail for location tracking will depend on the study design. Yet, it is recommended to report at least the participants’ typical schedule.
4.4 Building
From Table 2 one can see that building characteristics are incompletely reported. This poses an obstacle in identifying how these characteristics might affect PLLs. Providing a floorplan indicating the dimensions of the space, the positions of the light sources and the participants is a useful resource. For scenarios where the participants of a light-dosimetry field study are likely to spend significant periods of time at a fixed place, for example, desk or workstation in an office, it is recommended that a minimum of two digital images are taken at each of the identified fixed places. One image should be taken from the approximate eye-point of the participant and aimed horizontally along the typical view direction adopted by the participant when working. The second image should be taken from the desktop and aimed directly upwards towards the ceiling. Smartphone cameras are suitable for this task. Where the option is available, a wide-angle camera setting should be selected for both images to capture the greatest extent of the visible environment in each image, see examples in Figure 6. The horizontal image will contain information about the ‘connectivity’ of the participant’s eye-point to the immediate environment. Of particular significance with regard to the potential for daylight contribution is the degree to which facade glazing is visible from the participant’s eye-point under typical working conditions. The ceiling image will serve as a record of the participant’s relation to the luminaires in the immediate vicinity, in addition to providing the possibility of estimating the luminaire type.
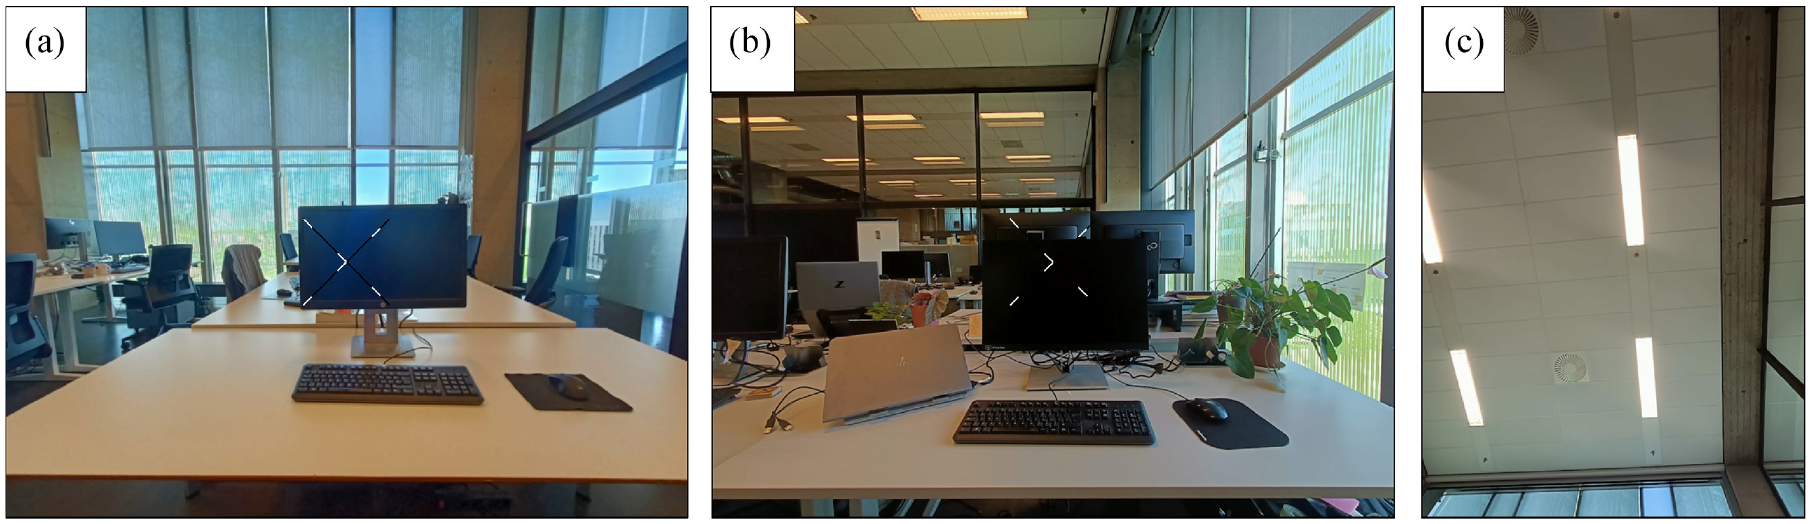
Example participant-specific images showing: typical workstation view directions for cases with windows facing the participant (a); windows to the side of the participant (b) and a photo of the ceiling above the participant showing the luminaires (c). The compass orientation should be that for the view centre (indicated by × in the two view images)
Additional information to supplement the two digital images are: (i) the distance from the eye-point (camera) to the building facade either facing the participant (Figure 6(a)) or to a side window if that is nearer (Figure 6(b)); and (ii) the compass direction matching the camera view. Importantly, most smartphones have a fairly reliable compass application as standard. This information in combination with the digital images will be valuable as input to image analysis software designed to extract geometrical information from 2D images (see Dai et al. 52 ). Thus, it should become possible to determine quantitative measures of (geometrical) eye-point connectivity to the facade windows. Such measures, combined with knowledge of the facade orientation, are likely to have a significant relation to the daylight contribution of PLLs experienced by the participant.
In addition to providing valuable input for a meta-analysis, the digital photographs will benefit those who carry out the field study. For example, readily accessible digital images (i.e. tagged to a particular participant) could be summoned during the data analysis to possibly verify if there are grounds for excluding a participant from a particular category (e.g. by perhaps revealing one or more participants as having a significantly different artificial lighting condition from the rest).
The authors wish to emphasize that the additional effort required to take these two images and make the two measurements (distance plus view-direction orientation) is minimal. Yet, these images give researchers the opportunity to ‘unpick’ vital quantitative information about the participants’ relation to the building facade, and also information regarding the placement of the luminaires that provide the electric lighting. Importantly, it is recommended that any digital images taken for these purposes are kept with their original EXIF headers intact, since these contain information useful to any image analysis software, for example, lens focal length.
The ceiling image is a simple way to provide information about the luminaire type, but it is preferable to provide a comprehensive description of the lighting installation. This includes the luminaire type, the light source type (e.g. fluorescent, LED) and control type (e.g. dimmability and tunability). It is important to provide the spectral power distribution of the electric light sources, either as a figure or as Supplemental Material, in addition to the CCT and CRI (as was pointed out by previous documents40,41).
4.5 Environment
As previously mentioned, knowledge of the external daylight conditions throughout any field study is important. Localized direct measurement of external conditions is a possibility, for example, a global horizontal illuminance sensor on an (ideally unshaded) nearby rooftop. 53 However, this imposes significant overheads in terms of both cost (for the sensors) and effort (to install/maintain the sensors and collect/process the data). As a consequence, direct monitoring of external daylight conditions is rarely carried out as an intrinsic part of light-dosimetry field studies. Remote sensing from satellites in earth orbit offers a potentially zero cost and low effort means to derive location specific ground level components of daylight illumination, for example, beam normal illuminance and diffuse horizontal illuminance.
The CAMS provides freely available satellite-derived radiation data covering Europe, Africa, the Middle East and parts of South America. The period of record is February 2004 to the present day (with up to 2 days delay). Data are provided at temporal resolutions of 15 min and 1 h in addition to daily and monthly summaries. Global horizontal and direct normal irradiance data provided by CAMS have been compared with ground measurements in a number of studies, with generally very good agreement.54,55 Given this good agreement, the use of CAMS-derived illuminance data would appear to be a potentially valuable – and somewhat overlooked – daylight resource for light-dosimetry field studies. Importantly, illuminance would need to be derived from CAMS irradiance using a luminous efficacy model, for example, Perez et al. 56 For locations within CAMS zones of coverage, the only input needed to retrieve irradiation data are: the latitude and longitude of the location; the start and end date (i.e. duration) and the time-step. Accordingly, we propose that light-dosimetry field studies include as matter of routine the necessary geographic location information so that the sun and sky daylight boundary conditions during the monitoring period can be recreated at a later date from satellite data wherever there is coverage.
5. Conclusion
This paper presented a case study meta-analysis to determine whether real-life office environments provide adequate light levels to best support human physiology, sleep and wakefulness, in line with a recent recommendation on healthy daytime light levels. PLLs of office workers were extracted from nine light-dosimetry field studies identified through a literature search. The diverse narratives in these studies led to varied data gathering and presentation approaches, challenging or obstructing the extraction of the necessary data for this meta-analysis.
The available data showed that the recommended daytime light level was not easily met. Zero out of 2 minimum values, 1 out of 6 median values and 6 out of 13 reported mean values of illuminances were higher than the photopic illuminance needed to achieve the recommended daytime light level of 250 lx melanopic EDI under typical electric light sources. When accounting for the contribution of daylight, an improvement is observed. Specifically, 0 out of 2 minimum values, 4 out of 6 median values and 9 out of 13 reported mean values meet the recommended daytime light level under daylight. The main limitations of the meta-analysis were the lack of adequate descriptive statistics of the light data, lack of information on the participants’ presence and location in the office, the differences in position and lack of calibration of light-dosimeters and the insufficient information about building and environmental characteristics.
Recommendations for data collection in PLL field studies are proposed to address these limitations and facilitate future meta-analyses. Drawing from existing frameworks and incorporating new elements, a comprehensive list of recommendations is presented, consisting of five categories: light data, participant, light-dosimeter, building and environment. Most recommendations are easy to implement, for example, to report all descriptive statistics, report the data collection dates and collect photographs of the monitored environment. These simple steps can provide invaluable data for future meta-analyses by giving information about the geometry of the space and the daylight availability, especially when combined with publicly available daylight data. With increasing interest in PLLs and a shift towards open science, establishing commonly agreed lighting research guidelines for field studies is important.
Footnotes
Declaration of conflicting interests
The authors declared no potential conflicts of interest with respect to the research, authorship, and/or publication of this article.
Funding
The authors disclosed receipt of the following financial support for the research, authorship, and/or publication of this article: M Gkaintatzi-Masouti reports financial support was provided by European Union (Marie Skłodowska-Curie Grant Agreement No. 860613). The other authors received no financial support for the research, authorship and/or publication of this paper.