



Abstract
Investigating the risk of road crashes associated with ambient light is often challenged by bias resulting from confounding effects of other risk factors. The study used the odds ratio and the risk ratio methods to isolate the effect of ambient light from other risk factors. This was possible in this research using the ‘whole-year’ approach adopted in previous research and utilising seasonal variations in ambient light in Cape Town. The analysis was based on crash and ambient light data collected between 2014 and 2018 in Cape Town. A total of 361 452 crashes were reported during this period. With only minor exceptions, the results confirm a higher crash risk in both twilight and dark conditions. The increase in the risk was different depending on the ambient light level, the crash type (total and pedestrian crashes) and the time of the day (morning and evening times). The results suggest that more efforts need to be made to assist road users to travel safely under twilight and dark conditions.
1. Introduction
The incidence of road traffic crashes is an international concern, not least in developing countries where crash rates persist or even increase year on year. 1 Understanding the causes of crashes is a key area of road safety research, as even now, our collective understanding of the complex elements leading to crashes occurring is, at best, partial. Traditional models of crash causation associate road traffic crashes with several risk factors, including human factors, vehicle defects, road design and environmental factors. Most crash reporting systems across the globe use this approach to identify the main contributing factors. However, in many instances, risk factors act together to precipitate a crash. Environmental factors such as weather (e.g. rains, wind, temperature), ambient light and road conditions (e.g. wet road surfaces) are recognised as pre-crash contextual risk factors that may compound the complexity of other risk factors and influence the likelihood of crashes occurring.2,3
It is well understood that crashes and severe injuries are overrepresented during dark driving conditions.4–6 Research has also shown that certain types of crashes – for example, rear-end crashes, 7 hit-and-run crashes, 8 fatal single-vehicle run-off-road crashes 9 and pedestrian crashes resulting in severe injuries9,10– are more likely to occur after dark than during daylight hours. The increased risk of crashes and injury severity after dark is partially attributable to human night vision limitations11,12: From a physiological point of view, research confirms that human visual performance deteriorates in darkness and under low illumination conditions.13,14 Human visual limitations are evidenced by the deterioration of several aspects of visual performance, including spatial resolution,15,16 contrast discrimination,17,18 stereoscopic depth perception, 19 accommodation response20,21 and visual reaction time.22,23
The impact of low luminance conditions during twilight (i.e. partial lighting occurring during the transition from light to dark, or dark to light) on crash likelihood is less well understood, though logically, many of the same physiological challenges are experienced by road users under reduced light conditions. During twilight periods, the sky is partially illuminated by refraction and scattering of the sunlight by the upper layers of the atmosphere. 24 Twilight is classified into three distinct phases according to the position of the centre of the sun relative to the horizon (solar altitude) and the prevailing visibility conditions due to the illumination level.24,25 Civil twilight is when the solar altitude is between 0° and −6° and when a human observer can still distinguish terrestrial objects. Nautical twilight is when the solar altitude is between −6° and −12°, and only object outlines are visible. Astronomical twilight occurs when the solar altitude is between −12° and −18° and when the illumination level is low enough to allow the visibility of stars and other astronomical objects. Road safety literature is starting to produce evidence to show that ambient light conditions during twilight may have a more significant influence on the likelihood of crashes than has generally been credited.26,27
Numerous studies have attempted to assess the contribution of ambient light and artificial light conditions (e.g. daylight, dusk/dawn, dark lighted and dark unlit) on crashes and injury severity. Most of these studies applied crash modelling techniques such as logit models to quantify the effect of ambient light conditions on crashes or injury severity either at the micro or macro level.28–30 A common challenge facing these studies is a potential bias that may result from confounding effects of other risk factors, which occur more frequently after dark. For example, traffic violations such as excessive speed, fatigue and alcohol intoxication are more prevalent after dark than during daylight.31–34 Certain exposure variables, such as road user demographics, vehicle types, pedestrian volumes and traffic volumes, are also subject to notable temporal variations after dark, and these are thus likely to influence the frequency of crashes. 35 Other contextual risk factors often linked to crashes occurring after dark include wildlife in the roadway26,36,37 and criminal activities.38,39
Removing confounding factors from ambient lighting crashes is challenging. It requires a methodology that eliminates, as far as possible, the likelihood of other factors influencing crash risk in a comparison of two comparable datasets. To this end, a few attempts have been made in recent studies to develop methodologies which compare crash frequencies at similar times of day but characterised by different ambient light conditions.
Johansson et al. 31 proposed a methodological approach to isolate the effect of ambient light conditions from other risk factors. Their approach compares crashes recorded during specific time windows, which are daylight at one moment in a year and dark at another moment in the same year. Fotios et al. 40 later referred to the approach as the ‘whole-year’ approach. The approach introduced the use of the odds ratio (OR) method to estimate the crash risk associated with darkness. In the approach of Johansson et al., 31 once an OR has been determined, tests of statistical significance must be used to determine whether the OR is significantly different from 1. In the context of interpreting an OR, 1 indicates equal odds for both conditions or no relationship. 41 Johansson et al. 31 defined a case hour, which is daylight during one part of the year and dark during the other part of the year. Crash frequencies for the case hour were compared to those for a control hour (referred to as ‘comparison hour’ in the study by Johansson et al. 31 ) to estimate ORs. The control hour was introduced to account for the effect of seasonal variations on the frequency of crashes. Using crash data from Norway, Sweden and the Netherlands, these researchers found that the risk of a crash involving an injury increased by about 40% in dark conditions compared with daylight. 31
Alternatively, several studies took advantage of seasonal variations of ambient light and daylight-saving time (DST) transitions in Spring and Autumn to examine crashes that occur immediately before and after a clock change.9,35,42–44 The biannual changes to clock time provide an opportunity to define specific time windows in daylight before the clock change but dark during the same time windows after the clock change, or inversely depending on the season. 45 Initially, a few studies used the approach of DST transitions to assess whether darkness significantly increases the crash risk compared to daylight.9,42 Inspired by the work of Johansson et al., 31 more recent studies applied the OR method to estimate the crash risk associated with darkness.40,43,44 These studies defined control periods in which ambient light remained the same both before and after the clock change, against which variations between daylight and darkness conditions can be compared. 46
There are claims that the OR method performs better than other analytical approaches in controlling for confounding when assessing the crash risk associated with ambient light. 31 Previous studies that applied the OR method to investigate the crash risk associated with ambient lighting conditions reported an increase in the crash risk after dark compared to daylight.31,35,43,44 Table 1 summarises study designs and key results from these studies. The OR values for almost all crash types included in these studies were greater than 1, indicating a consistently greater risk during darkness than daylight for the specific crash types (see Figure 1). There are claims that the choice of control periods and the definition of darkness (or the degree to which the confounding effect of twilight is accounted for) may influence the estimated effect of ambient light.44,46 As shown in Table 1, inconsistency in defining darkness is evident – some scholars included civil twilight in the definition of darkness31,35 while others excluded it.43,44
Previous studies that used the OR approach to assess the crash risk associated with darkness
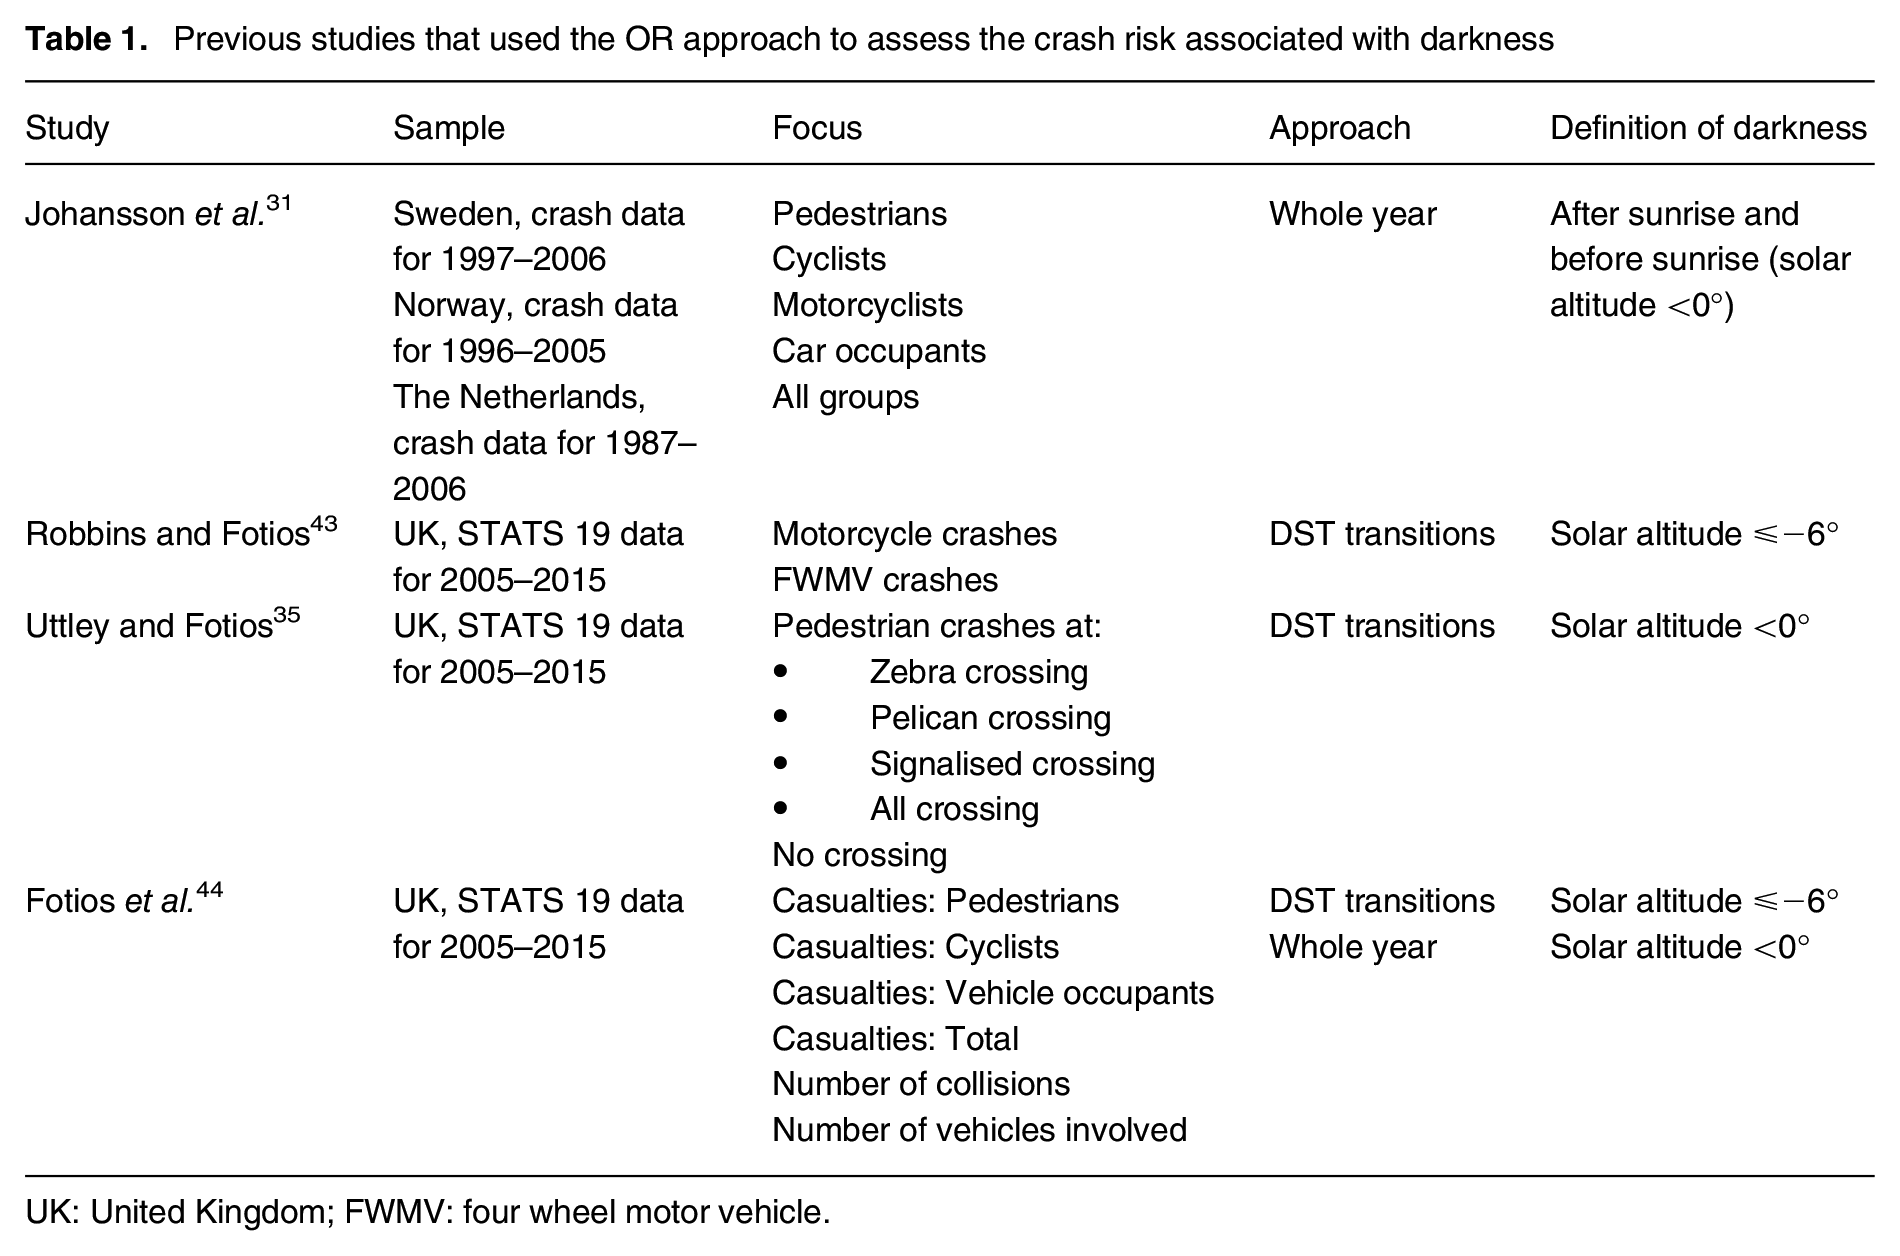
UK: United Kingdom; FWMV: four wheel motor vehicle.
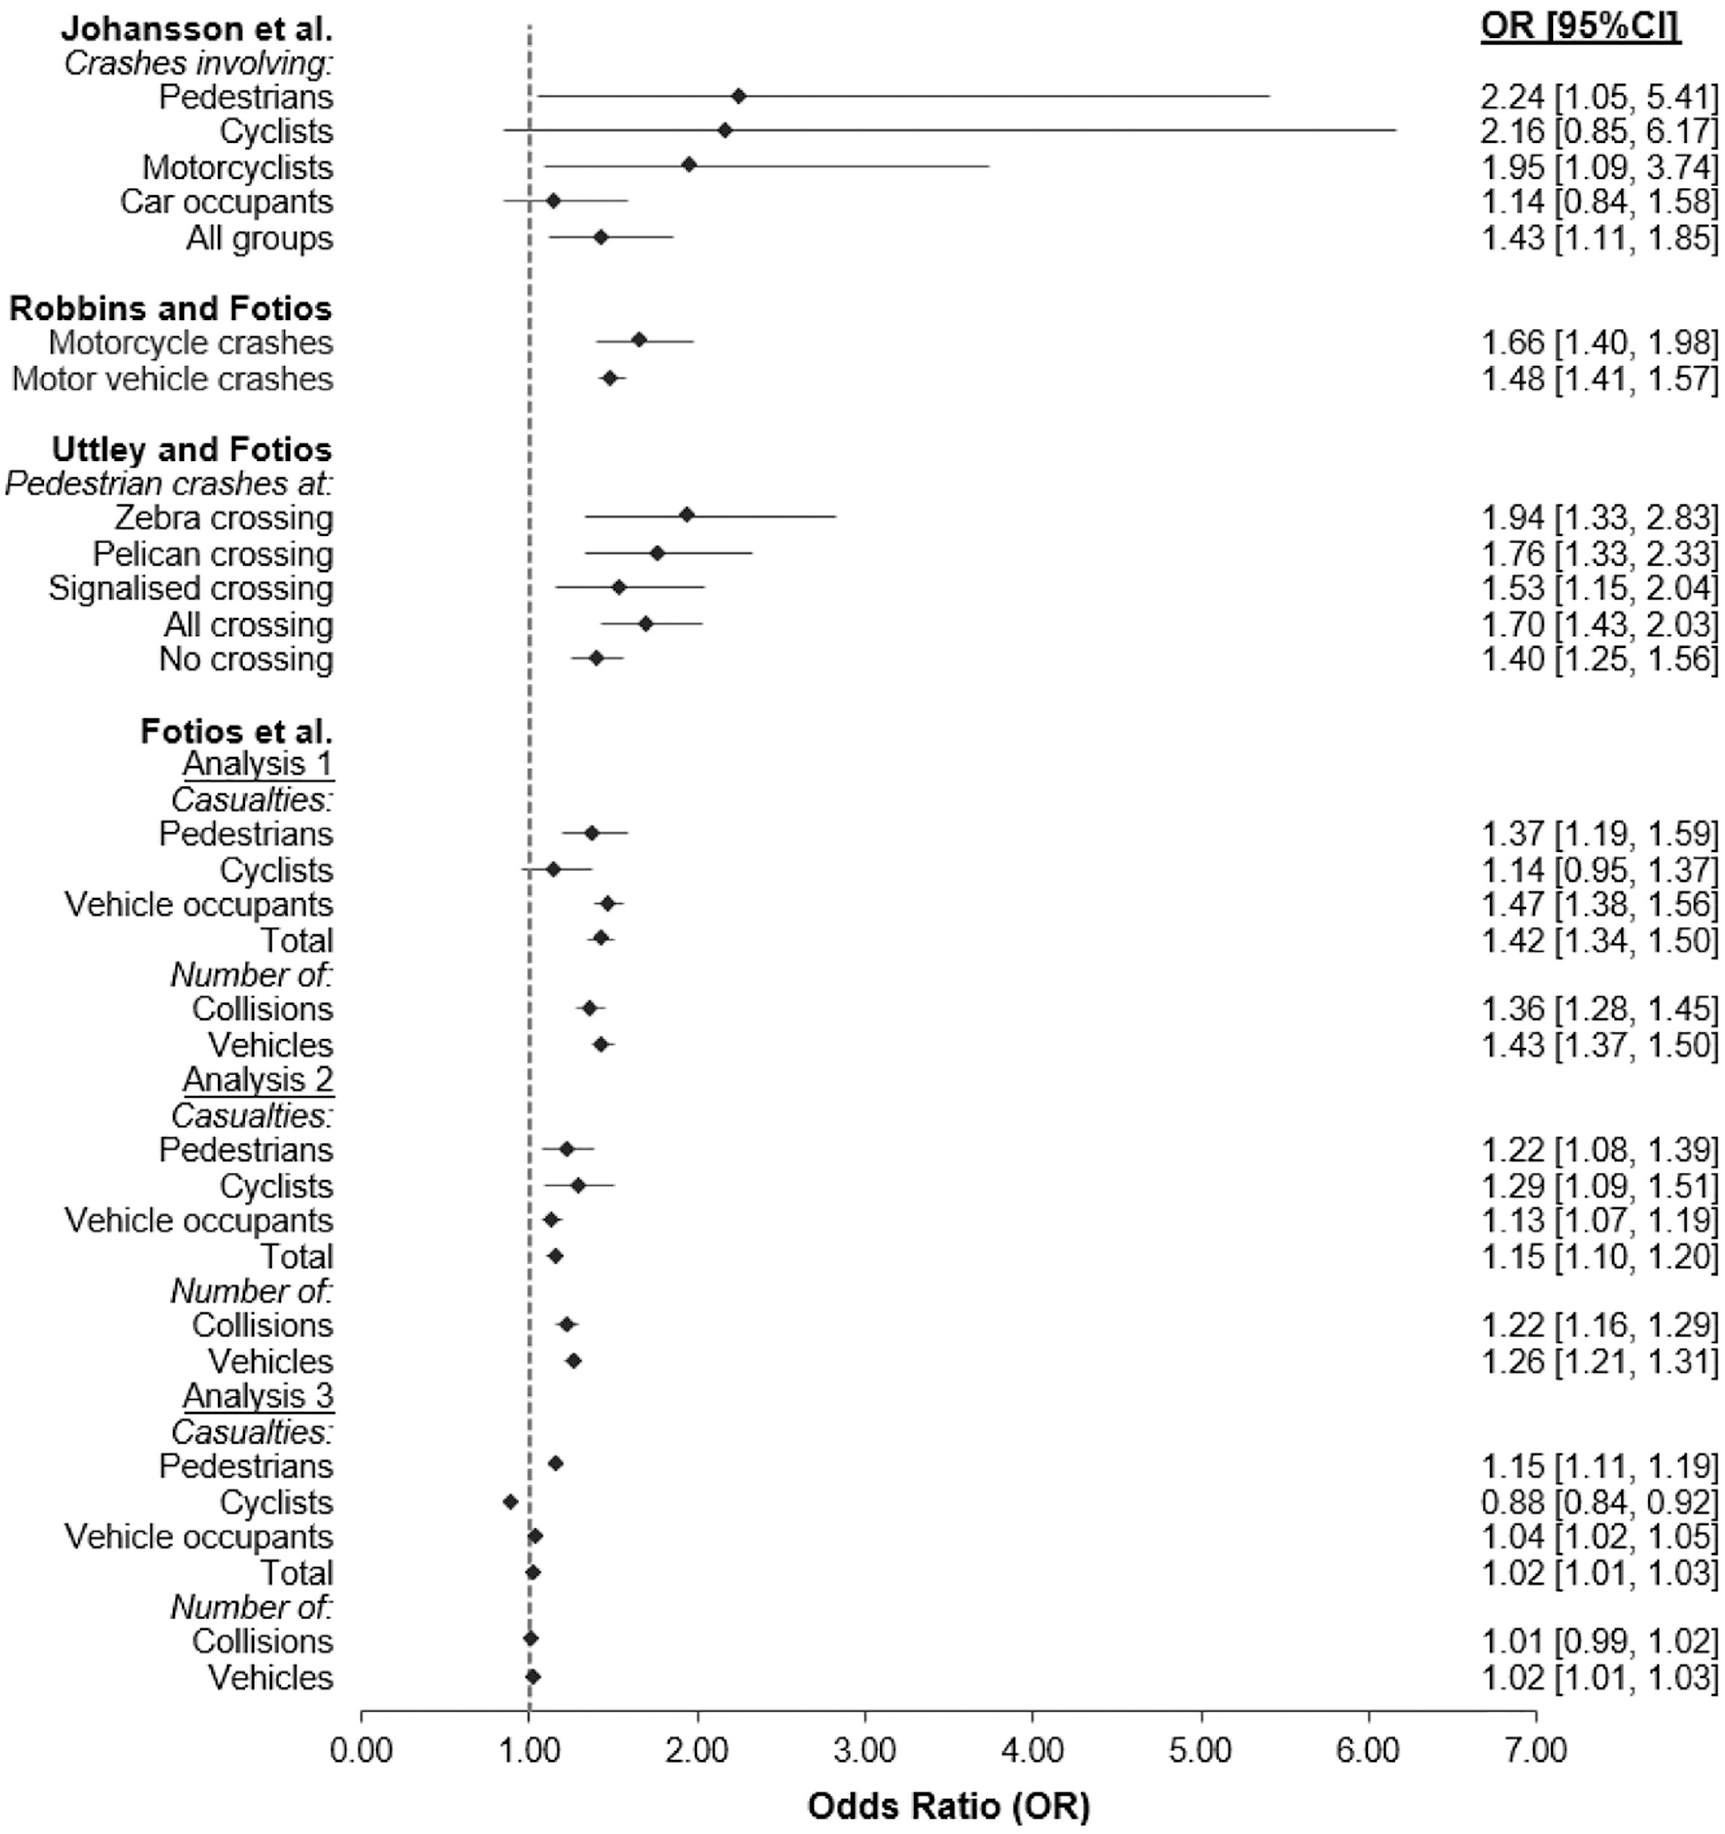
ORs reported in previous studies that investigated the crash risk associated with darkness
Risks facing road users during twilight (i.e. periods of lower light conditions) tend to be similar to those affecting crashes occurring after dark, though they may be less easy to specify. Twilight periods arguably reflect complex hybrids of road user behaviour, traffic characteristics and lighting availability. For example, in addition to the visual difficulties already described, exposure levels of road users may be affected: some research indicates that already reduced levels of walking and cycling during twilight become more reduced after hours of darkness. 45 In contrast, research is mixed on whether there is a reduction in vehicle activity after hours of darkness.45,47 The argument that activity levels of road users vary during twilight has not been fully supported in the literature. The fact that headlights are mandatory during darkness but not used consistently during twilight periods is another issue that complicates the risks of crashes during these periods. Given the gradual transition of risk factors during the twilight stages, it is not yet known whether including the twilight periods in the definition of darkness would underestimate the crash risk associated with darkness or not.
Insufficient research has been carried out into crash likelihood during partial lighting conditions for us to be fully conscious of what factors play the most critical roles. To begin with, however, it is necessary to isolate the effects of the ambient light alone as far as possible, to understand what role the lighting level itself may play – when confounders are offset – in crashes across different lighting periods.
The purpose of the research was twofold: first, to throw some light on the role of ambient light on crash likelihood in Cape Town; and second, to compare the effectiveness of the OR method and a variation of this method – the risk ratio (RR) method – in isolating and quantifying the effects of a range of ambient light on crash likelihood in that city. Although investigating the crash risk associated with ambient light, the study tested and compared different scenarios of defining darkness. The first analysis compared daylight versus complete darkness, with all twilight stages excluded (i.e. when the solar altitude is below −18°). The second compared daylight versus a combination of nautical and astronomical twilight stages (i.e. when the solar altitude is between −6° and −18°). The last analysis compared daylight versus each individual twilight stage. Such an investigation is scarce in traffic safety research. Finally, the study conducted a comparative evaluation of the results and discussed the crash risk observed under the various definitions of darkness and the periods of the day. The authors of this paper are not aware of previous studies that used the OR method in the Global South, and more specifically on the African continent.
2. Method
2.1 Data description
Crash data for this study was obtained from the Department of Transport and Public Works of the Western Cape Province. Crash data include records of road traffic crashes that resulted in a death, injury or no injury. The crash data was collected by the police between 2014 and 2018 in the City of Cape Town. Like many developing countries, accurate and reliable crash data is often hard to come by in South Africa, and data that is available for research purposes is often subject to significant time lags – in the case of Cape Town, the lag at the start of research was 2 years to 3 years. The dataset for total crashes included records on 361 452 crash events, whereas that for pedestrian crashes included records on 22 515 crashes involving pedestrians and other road users (e.g. vehicle, motorcycle, cyclist, quadricycle and animal-drawn vehicle). The data on ambient light for Cape Town over a 5-year period (from 2014 to 2018) was retrieved from the website of Time and Date AS. 48
2.2 Definition of darkness
The study adopted three different definitions of darkness for comparison purposes. The first definition considers complete darkness as the period when the solar altitude is below −18°, or darkness excluding any stage of twilight. The second definition considers darkness as the period when the solar altitude is between −6° and −18° or a combination of nautical and astronomical twilight stages. The last definition considers individual twilight stages as periods of darkness. Daylight was defined as the time of day when the solar altitude is 0° or above.
2.3 Determination of case periods
This study followed the whole-year approach to investigate the effect of ambient lighting conditions on all road crashes and pedestrian crashes. The study took advantage of noticeable seasonal variations of ambient light in Cape Town to estimate the crash risk associated with different ambient light levels in comparable periods. Figure 2 illustrates variations in ambient light levels throughout a typical year in Cape Town, and the case and control periods determined for the analysis of the crash risk under complete darkness. Similarly, Figure 3 presents the case and control periods selected for the analysis of the crash risk under nautical and astronomical twilight stages. Following the whole-year approach, case periods were defined as time windows that are dark at one moment of a year and daylight at another moment. Case periods were identified distinctively for the morning and the evening.

Seasonal variations in ambient light, case and control periods for the analysis of the crash risk under complete darkness in Cape Town
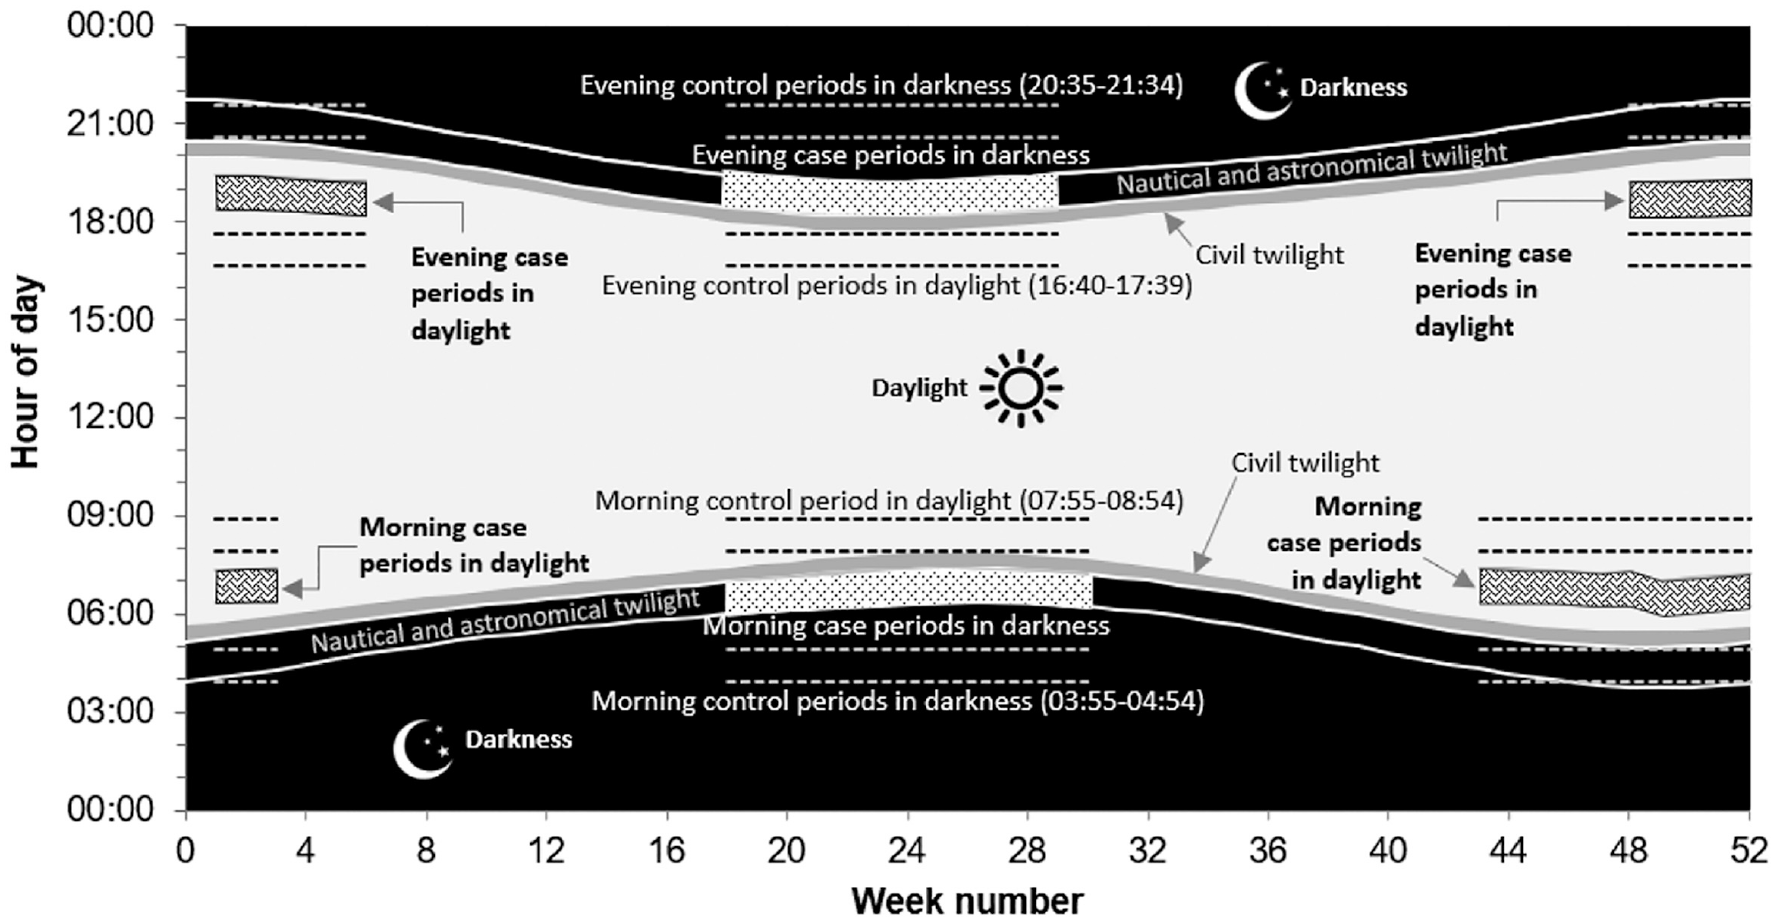
Seasonal variations in ambient light, case and control periods for the analysis of the crash risk under nautical and astronomical twilight periods in Cape Town
For each year included in the analysis, a total of 83 case periods were selected in the morning and 70 case periods in the evening. For the analysis in the morning, the dark case periods were identified from 07 May to 30 July, and these were matched with daylight case periods selected from 26 October to 16 January. For the analysis in the evening, the dark case periods were selected from 01 May to 16 July, and these were matched with daylight case periods identified from 03 December to 09 February. A list of case periods identified for different definitions of darkness is provided in Supplemental Tables S1 to S10.
Case periods were selected based on strict inclusion criteria set to avoid possible confounding effects due to variations in exposure factors. Firstly, each dark case period was matched with a single daylight case period having a time window identical to that of the dark case period. Then, pairs of case periods were selected in different months but on the same day of the week. For example, a dark case period in the morning was selected from 05.28 to 05.58 on Monday, 07 May 2018, and this was matched with a daylight case period of the same time window on Monday, 03 December 2018.
The nature of seasonal variations in ambient light determines the shapes of the bars illustrating the case periods in Figures 2 and 3. For example, the time window for the evening case periods is constant from 31 May to 19 June. This is because the end of the astronomical twilight period (19.13) does not change over this period of the year. Subsequently, the case periods in darkness are also constant (specified from 19.14 to 19.44) following the selection criteria provided in Table 3. Similarly, the evening case periods in daylight also took rectangular shapes in Figures 2 and 3 since they should be identical to the evening case periods in darkness. In some instances, selecting case periods on the same day of the week required matching dark case periods with daylight case periods specified on non-consecutive dates, hence the irregular shapes representing the morning case periods in daylight in Figures 2 and 3.
Initially, the authors intended to identify case periods of 60 min to investigate the crash risk associated with darkness. Given the magnitude of seasonal variations in Cape Town, it was impossible to find time windows of 60 min that are completely dark (i.e. excluding twilight periods) during a certain period of a typical year, and daylight during another period of a year. Subsequently, case periods for the definition of complete darkness were restricted to a time window of 30 min for both the morning and the evening. The definition of darkness falling within nautical and astronomical twilight stages permitted the extension of the case periods to a time window of 60 min for both morning and evening times. Other risk factors besides the ambient light (e.g. road user behaviour, travel exposure, etc.) were assumed to remain relatively constant during the time windows of the case periods.
Unlike previous European studies presented in Table 1, the time window of the case periods was selected to be variable and determined by sunrise and sunset times. The approach of variable case periods was a response to a weak variation in ambient light for Cape Town (e.g. variation in the length of day and night throughout the year), which restricted the adoption of case periods of a fixed time window. For example, the authors attempted two scenarios of defining case periods of constant time windows to analyse crash risk under complete darkness in the morning (see Supplemental Figures S1 and S2). The first scenario aimed to maintain the 83 case periods with a fixed time window. The attempt led to case periods with a time window of 7 min (from 05.52 to 05.59). The second scenario aimed to achieve fixed case periods with a time window of 25 min. The attempt led to an approximately 50% reduction in the number of case periods. Through both scenarios, the amount of data used in the analysis was significantly reduced, undermining the robustness of the analysis. Subsequently, this study used case periods with variable time windows to ensure the robustness of analysis, more specifically for the analysis of pedestrian crashes, which were less frequent in the periods of comparison.
2.4 Determination of control periods
Control periods of equal time windows as the case periods were identified to account for seasonal influences of other factors (e.g. weather effects) on the frequency of crashes and pedestrian crashes. Control periods had the same ambient light as the case periods. For each case period, two control periods were established on the same day as the case period: one having a time window that remains naturally lit throughout the year and another having a time window always in darkness throughout the year. The time windows of the control periods vary depending on the definition of darkness adopted in the analysis. Each control period was chosen in such a way that it is closest to the case period to minimise potential confounding effects due to temporal variations in other risk factors (e.g. rain, wet surface, temperature, etc.). For the context of Cape Town, the control periods were determined as follows:
Complete darkness: The time window that is always dark throughout the year is from 21.45 to 03.43, whereas the one always in daylight is from 07.53 to 17.42. The control periods (one always in darkness and another always naturally lit), each of 30 min, were determined in such a way that they fall in the respective time intervals. The dark control period is from 03.10 to 03.39 in the morning and from 21.45 to 22.14 in the evening. Similarly, the time window for the daylight control period is from 07.55 to 08.24 in the morning and from 17.10 to 17.39 in the evening.
Darkness that includes nautical and astronomical twilight stages: According to this definition, the time window that is always dark throughout the year is from 20.31 to 04.58, whereas the one always in daylight is from 07.53 to 17.42. In light of these time windows, the dark control periods of 60 min were determined to be from 03.55 to 04.54 in the morning, and from 20.35 to 21.34 in the evening. Correspondingly, the daylight control period was selected from 07.55 to 08.54 in the morning and from 16.40 to 17.39 in the evening.
Table 2 describes the case and control periods for different definitions of darkness adopted in this study. It is worth noting that control periods for the analysis of individual twilight stages could not be found due to the magnitude of seasonal variations in Cape Town and the short duration of twilight periods (ranging from 28 min to 40 min for astronomical twilight; from 28 min to 36 min for nautical twilight; and from 24 min to 30 min for civil twilight). Following the definition of a control period, it was impossible to find a time window in a day during which the ambient light remains twilight throughout the year. As a result, the analysis of the crash risk under individual twilight stages relied solely on the RR method. The search for the case periods for the RR method adopted the same strategy used to identify the case periods for the OR method (see Table 2).
Time windows for case and control periods for different definitions of darkness

Calculated as the minimum duration of a particular twilight type minus 1 min.
2.5 Analytical methods
This study adopted two analytical approaches to investigate the effect of darkness on total crashes and pedestrian crashes: the OR and RR methods.
2.5.1 The OR method
The first approach calculated ORs and associated 95% confidence intervals (CIs). The OR indicates the odds that an outcome (e.g. a crash in this study) will occur given a particular exposure (e.g. darkness in this study) compared with the odds of the outcome taking place in the absence of that exposure (e.g. daylight).
49
The odds represent the probability that an outcome occurs relative to the probability that the outcome does not occur.
50
In this study, an OR compares changes in crash frequency between darkness and daylight in the same period of day with changes in control periods, which are permanently either in darkness or daylight throughout the year. An OR significantly


where A is the frequency of total crashes or pedestrian crashes during the case period in darkness; B is the frequency of total crashes or pedestrian crashes during the case period in daylight; C is the frequency of total crashes or pedestrian crashes during the control periods (i.e. the dark and daylight control periods) when the case period is in darkness and D is the frequency of total crashes or pedestrian crashes during the control periods (i.e. the dark and daylight control periods) when the case period is in daylight.
2.5.2 The RR method
When faced with the difficulty of obtaining the control periods for specific darkness definition (i.e. twilight stages) – owing to the nature of variation in ambient light for the study area – RRs were used as alternative risk estimates to ORs, primarily to estimate and compare the crash risk under the three twilight stages. An RR (also known as relative risk 51 ) is defined as the ratio of the probability of an event occurring in the exposed group versus the probability of the event occurring in the unexposed group.51,52 This study defined an event as a crash occurring during the case period and a non-event as any crash occurring outside the case period on the same day as an event. Exposure was defined as darkness, whereas daylight served as a control or reference condition. Simply put, the RR method compares the incidence rates of crashes occurring during the two case periods (dark vs. daylight). A crash incidence rate was defined in this study as the ratio of crash frequency during the case periods identified for the OR method (i.e. dark case period and daylight case period) to the total number of crashes recorded on the same day as the case period. Unlike the OR method, the RR method omits control periods: possible confounders – usually offset by the use of control periods – are offset by the use of crash incident rate in both terms of comparison.
Like the OR method, an RR equal to 1 implies that the risk of the event is identical in the exposed and control samples. The RR is mathematically defined by Equation (3), and the corresponding 95% CI was calculated similarly as in Equation (2).

where a is the frequency of crashes occurring during the case period in dark conditions, b is the frequency of crashes occurring outside the case period when the case period is dark,
Research has provided evidence that RRs approximate ORs when the prevalence of the study outcome is small in both exposed and unexposed groups52,53– that is, when a is small relative to b and when c is small relative to d in Equation (3). This was the case of this study as the ratios
2.5.3 Inferential statistics
Fisher’s exact probability test 41 was used to assess the departure from 1.0 for the ORs and RRs. The p-values determined whether there was a significant departure of the OR or RR values from 1 (where 1 suggests no difference between dark and daylight conditions). Statistical differences in the ORs between pairs of different groups (e.g. darkness definitions and twilight stages) were tested using the Breslow–Day’s test of homogeneity of the ORs. 54 The same test was used for pairwise comparisons between the ORs in the morning and those in the evening. The analysis was conducted using IBM-SPSS statistical software. 55
3. Results
3.1 Descriptive statistics
Figure 4 shows the distribution of the cumulative crash frequency by time and month of the year in Cape Town. The results indicate two distinct peaks of crashes in a typical day (between 07.00 and 08.59 and between 16.00 and 18.59) across almost all the months of a year. These two peaks correspond to the periods of the day during which travel exposure variables (e.g. traffic volume) are usually highest.

Hourly frequency (cumulative) of total road crashes recorded in Cape Town from 2014 to 2018
3.2 Estimating the effect of darkness using ORs
Table 3 shows the cumulative frequencies of total crashes and pedestrian crashes during the case and control periods. The frequencies are distinctively presented for the morning and evening periods. Also shown are the ORs, the 95% CI and p-values estimated using the crash frequencies as shown in Equations (1) and (2). The ORs describe the risk of a crash occurring during various dark conditions compared with daylight conditions.
ORs for total road crashes and pedestrian crashes, describing the change in the crash risk under dark conditions relative to daylight conditions

OR does not significantly depart from 1 (i.e. p > 0.05 or the 95% CI includes the value 1).
All the estimated ORs were significantly greater than 1 for both total road and pedestrian crashes. In general, the findings indicate that the numbers of total crashes and pedestrian crashes were significantly higher in darkness compared with daylight. Considering Cohen’s effect size threshold – an OR equal to 1.22, 1.86 and 3.00 indicating small, medium and large effect sizes, respectively56,57– the majority of the OR values in Table 3 reflect a medium effect. Generally, a comparison of the OR values indicates that the crash risk was significantly greater
Risk comparison between the two definitions of darkness (complete darkness and nautical and astronomical twilight) and between the two periods of the day (morning vs. evening)

OR does not significantly depart from 1 (i.e. p > 0.05 or the 95% CI includes the value 1).
3.3 Estimating the effect of darkness using RRs
Table 5 shows the RRs estimated for total crashes and pedestrian crashes according to various definitions of darkness and the time of the day. Also shown are the 95% CI and the associated p-values, which tested whether an RR significantly departs from 1. In general, the RRs were greater than 1 in the morning dark conditions for all ambient light definitions. In the evening, similar patterns of crash risk were found, except for two instances of an RR smaller than 1 – during civil twilight for total crashes and complete darkness for pedestrian crashes. However, the p-values and the 95% CI for these two instances do not indicate significant departures from 1.
RRs describing the change in the crash risk under darkness and twilight conditions relative to daylight conditions

RR does not significantly depart from 1 (i.e. p > 0.05 or the 95% CI includes the value 1).
3.4 Comparison of ORs and RRs
The ORs and RRs display a consistent crash risk associated with darkness across all the various definitions of dark conditions. A comparison of eight pairs of the ORs and RRs (see Table 6) revealed that the risk estimates produced by the two analytical methods were statistically identical
A Comparison of the analytical methods – ORs versus RRs
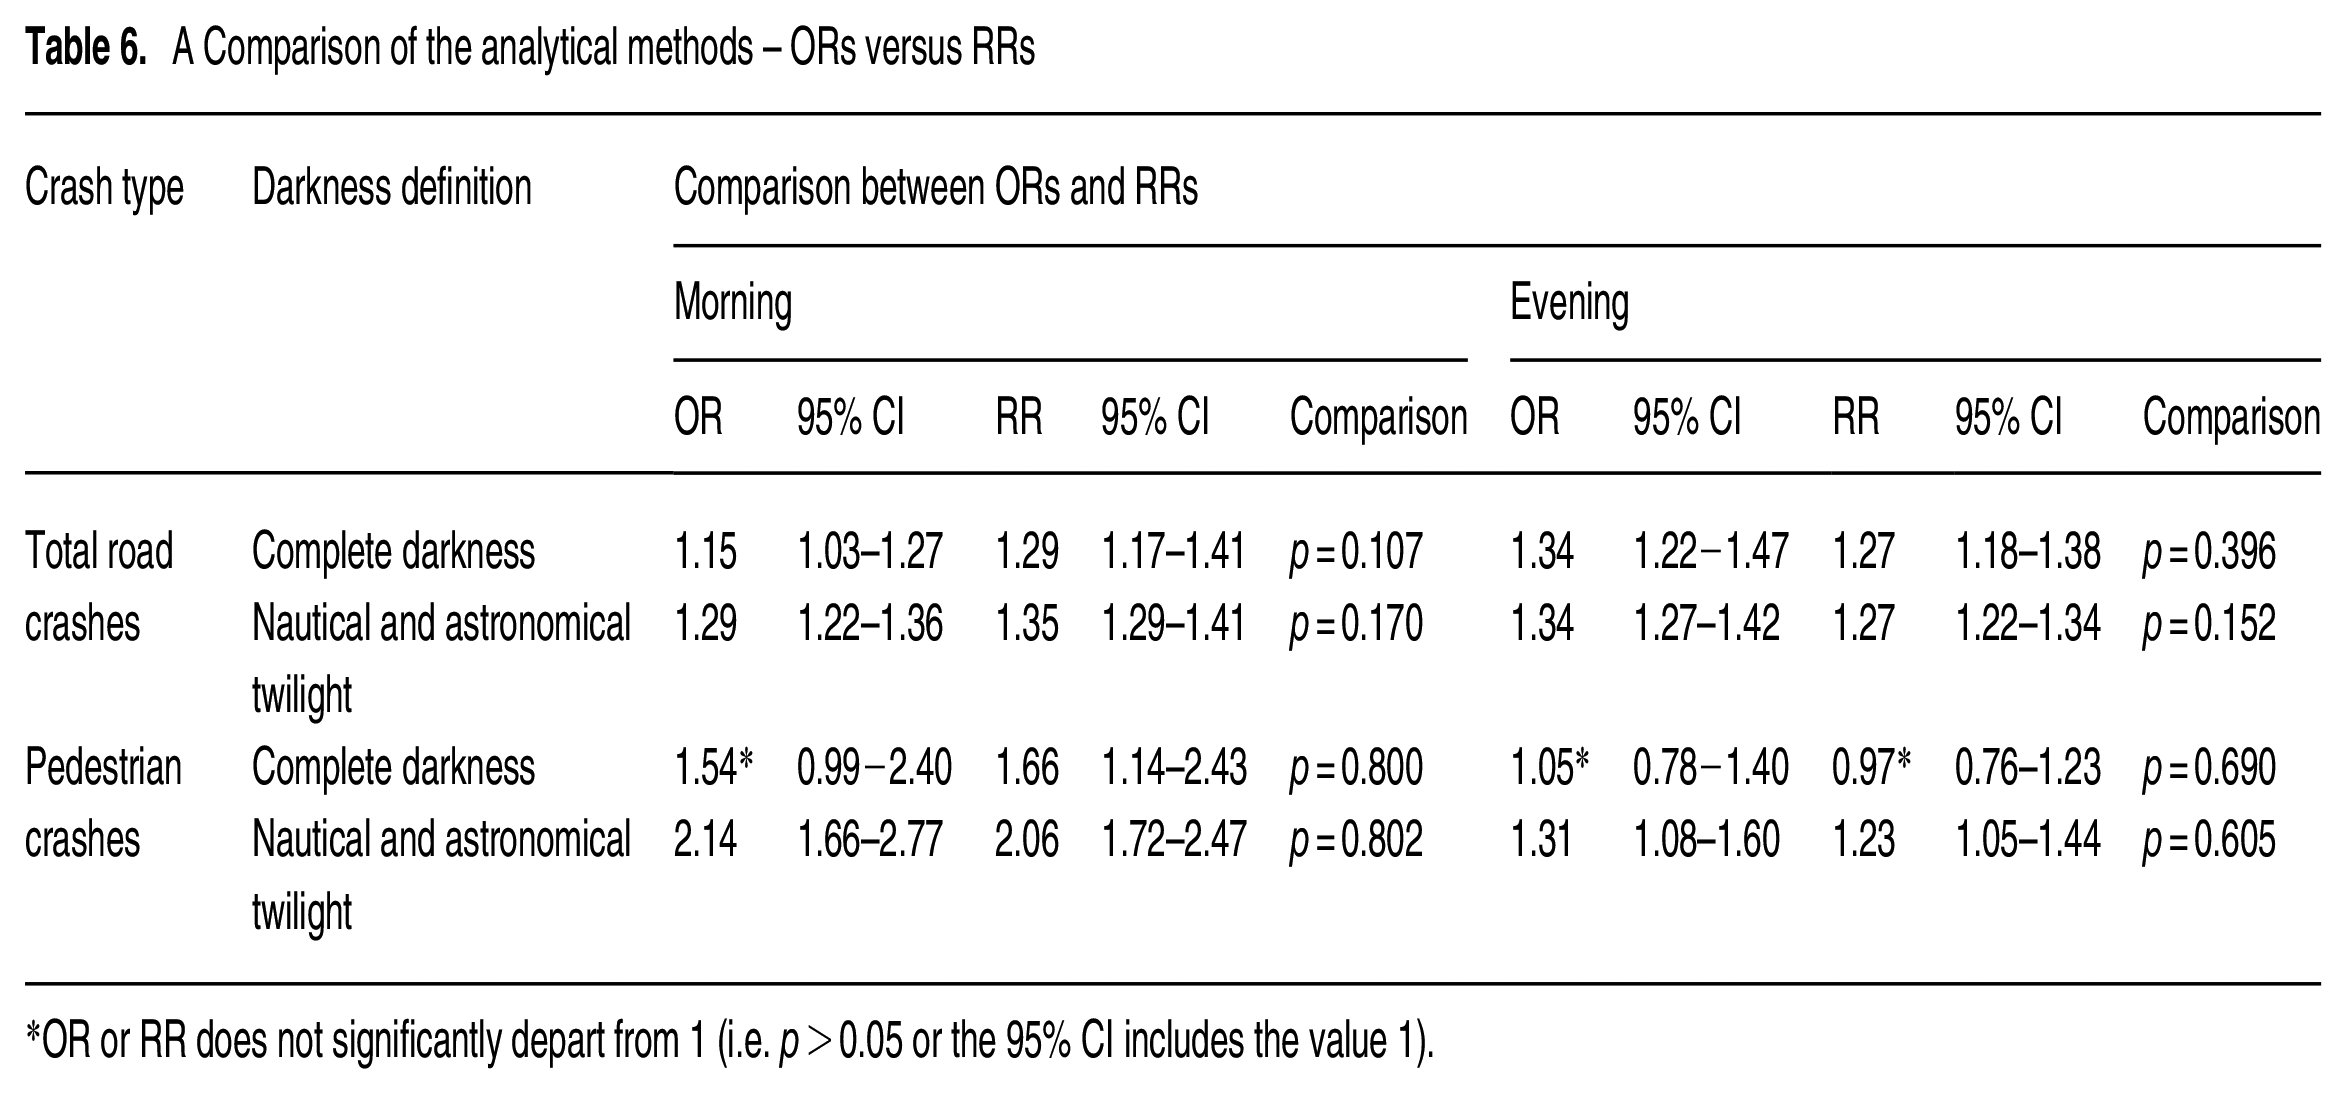
OR or RR does not significantly depart from 1 (i.e. p > 0.05 or the 95% CI includes the value 1).

Plots of ORs for total road crashes and pedestrian crashes to describe the change in crash risk during dark conditions relative to daylight conditions
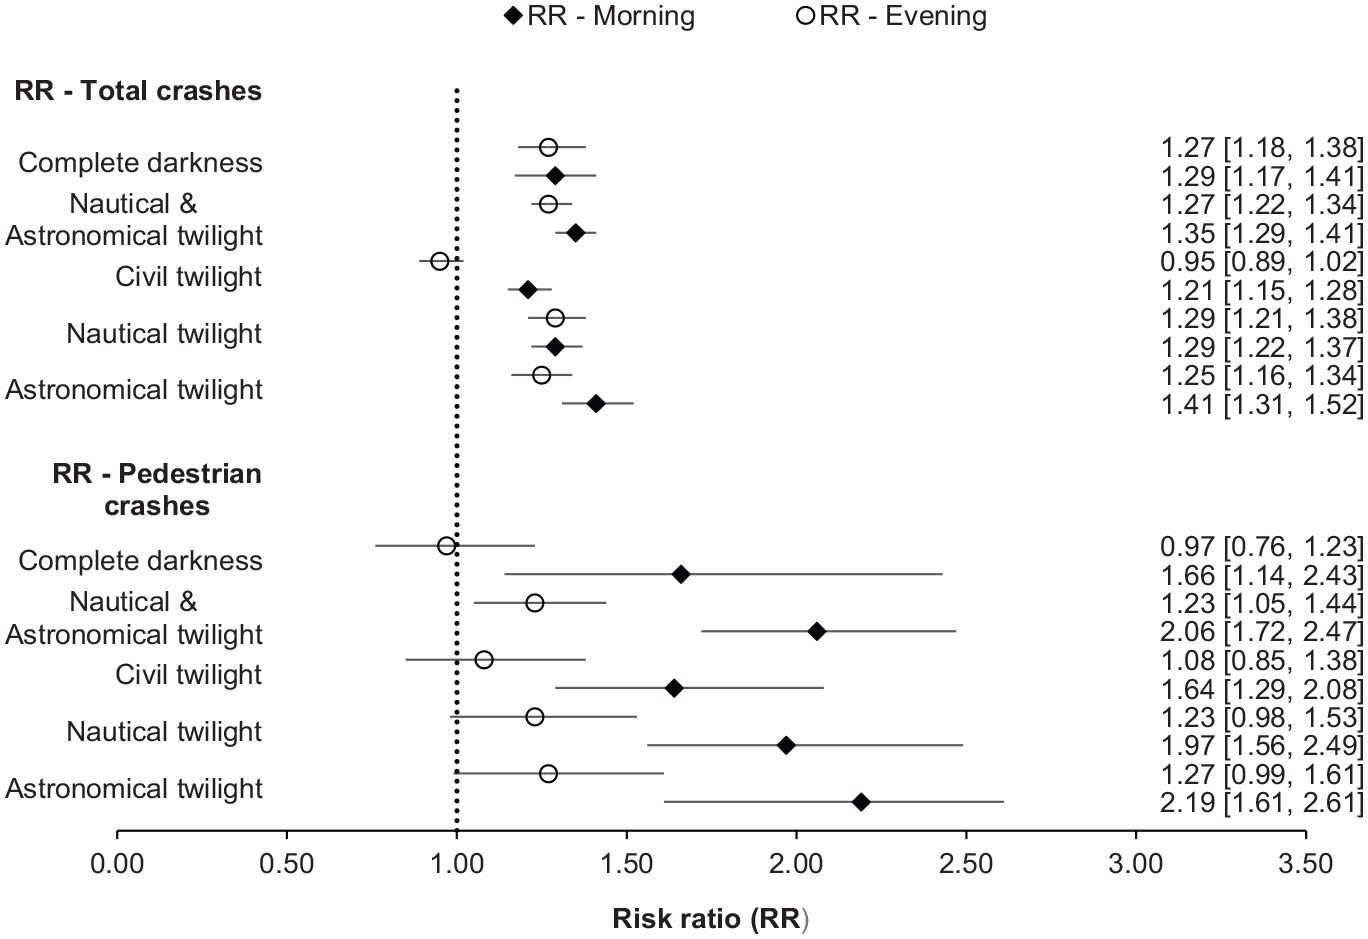
Plots of RRs for total road crashes and pedestrian crashes to describe the change in crash risk during dark and twilight conditions relative to daylight conditions
3.4.1 Effect of darkness definition
The Breslow–Day’s test for the ORs in Table 4 and the RRs in Table 7 revealed that the two definitions of dark conditions – complete darkness and darkness that includes nautical and astronomical twilight – consistently resulted in statistically identical risk estimates
A comparison of RRs across different definitions of darkness and between the RRs in the morning and those in the evening

RR does not significantly depart from 1 (i.e. p > 0.05 or the 95% CI includes the value 1).
3.4.2 Effect of the time of the day
A comparison of the ORs in Table 4 shows a consistent and significant increase
4. Discussion
4.1 Discussion of the findings
The ORs and RRs estimated in this study provide compelling evidence of a significant increase in the risk of any road crash type and pedestrian crashes in dark conditions compared with daylight conditions. When compared with the findings of similar previous studies presented in Figure 1 (ORs in the range 0.88 to 2.24), the ORs and RRs found in this study for similar definitions of darkness – when the solar altitude is below −6°– appeared to be in the same range (0.97 to 2.14). In general, the results show a gradual increase in crash risk as the daylight illuminance reduces during the twilight stages. However, the findings of this study do not suggest an increased crash risk for the stricter definition of darkness that excludes nautical and astronomical twilight periods. In fact, contrary to the authors’ expectations, the ORs and RRs appear to be smaller for complete darkness (which completely excludes twilight) than those for the definition of darkness that includes nautical and astronomical twilight. A possible explanation of this pattern could be the differences in the sample size of total crashes and pedestrian crashes used in the estimation of ORs and RRs for the various darkness definitions. The estimation of RRs and ORs for complete darkness relied on the smallest samples of total crashes and pedestrian crashes in comparison to other darkness definitions (see Tables 3 and 5).
The difference in risk estimates between complete darkness and darkness that includes nautical and astronomical twilight tend to be more pronounced for pedestrian crashes than total road crashes (see plots in Figures 5 and 6). In addition to the explanation provided above, another possible explanation of the seemingly different risk estimates could be a reduction of pedestrian volumes in complete darkness compared with daytime and twilight periods. This pattern was confirmed in the study by Robbins and Fotios 45 and that by Fotios et al. 40 In the context of South Africa, research conducted in Cape Town provided evidence of significant risks of crime and violence faced by pedestrians when walking after dark. 58 In South Africa, the fear of falling a victim of a crime is often cited among factors dissuading pedestrians from walking after dark, especially when walking alone. 59 Nevertheless, the results of inferential statistics do not indicate significant differences in risk estimates between the two definitions of darkness for all pairwise comparisons in Tables 4 and 7.
The results also confirmed a statistically identical crash risk found during nautical twilight and astronomical twilight. In agreement with previous studies,43,44 the findings of this study justify why nautical and astronomical twilight stages should be considered dark periods for research of this nature, despite the difference in the definition based on the solar altitude. In other words, the findings strengthen the motivation to consider civil twilight as an appropriate border between daylight and darkness. The contrasting crash risk between civil twilight and the other two twilight stages also justifies why civil twilight should be excluded from the definition of darkness to avoid underestimating risk estimates.
The findings indicate a significantly greater risk of a pedestrian crash during the dark conditions in the morning than in the evening. While more local research would be needed to unpack the reasons for this difference, one possible explanation for this effect could be a higher density of pedestrian movement in the morning peak hours than in the evening peak hours. Another possible explanation could be the nature of vehicle-pedestrian interaction during these two times of the day. The morning case periods (selected from 05.28 to 07.51) fall within the period when commuters and school-goers usually rush to get to their destinations on time. Hypothetically, road users may tend to be relatively more relaxed in the evening times involved in the comparison of the crash risk (i.e. case period selected from 17.44 to 19.28). When motorists and pedestrians are in a rush, they are more likely to increase their speeds and engage in aggressive and risky behaviour that can precipitate road traffic crashes.
The literature on road safety has some evidence of a more perilous vehicle-pedestrian interaction in the morning than in the evening.60,61 For example, Hamed 60 found that pedestrians going to work in the morning engaged in riskier crossing behaviour than pedestrians coming from work and heading to their homes. In accordance with Hamed, Liu et al. 61 reported that pedestrians were more likely to commit traffic violations in the morning than at midday and in the evening. The pedestrian crash risk found to be greater in the morning than in the evening points to potential effects of other risk factors besides ambient light. For total crashes, the increased risk during the dark conditions in the evening may suggest an influence of fatigue and alcohol intoxication, which are usually more prevalent after dark than in the morning. Overall, there is a need for continued research to advance the understanding of the difference in crash risk between the morning and evening dark conditions.
4.2 Limitations
This study used police-reported crash records, often subject to potential limitations emanating from data quality issues.62,63 For this study, the time of crash occurrence was the most important variable used in the data linkage between crash data and ambient light data. Based on the authors’ knowledge and familiarity with crash data systems in South Africa, the time of crash occurrence is the most complete and possibly the most accurate (provided with 5-min-level time accuracy) variable in the police-reported crash records. Hence, this study assumes a negligible effect of crash data deficiencies on the findings of this study.
Another limitation relates to shading from nearby hills and mountains, which can affect standard sunrise and sunset times used in this study as the benchmarks for the end of the daylight period and the start of the civil twilight period. However, a large part of the Cape Town area is characterised by low-lying regions, except for some areas on the southwest coast covered by hills and mountains extending from the south up to the City Bowl. Hence, the effect of topography on the findings of this study is assumed to be negligible.
5. Conclusions
Several conclusions were drawn from this study on the effect of ambient light conditions on road traffic crashes and the analytical approaches adopted to illustrate the risk. Generally, there was evidence of an increased crash risk associated with darkness in both analytical approaches tested in this study. The crash risk estimated by the OR and RR methods was found to be in the same range as the ORs reported in previous studies. When faced with the difficulty of obtaining the control periods for specific darkness definitions (i.e. the twilight stages), the RR method was used as an alternative to the OR method, and the results proved the RRs were statistically identical to the ORs. As such, the RR method might be a suitable method of isolating and quantifying the effect of ambient light on crash incidence where the data restricts the application of the OR method.
The increase in the crash risk under dark conditions differed depending on the crash type and the time of the day. An elevated crash risk was observed during the dark conditions in the evening, while dark conditions in the morning presented the highest risk for pedestrian crashes. There was also evidence of an identical crash risk under complete darkness and darkness that includes nautical and astronomical twilight. Hence, the appropriate definition of darkness for research of this nature should be the one that excludes civil twilight (i.e. when the solar altitude is below −6°).
The findings of this study highlight a clear need for interventions to improve the safety of the road environment in darkness, as well as under twilight conditions. Although more work is needed to identify more precisely how road users behave at these times and what their perceptions of their risk may be, the preliminary results here suggest that there is definitely scope for:
• Engineering solutions to enhance the visibility of the road environment and other road users, particularly pedestrians, and to provide enhanced protection for all vulnerable road users. Interventions could include intelligence-led street lighting, better prioritisation of pedestrians in crossings and more forgiving roadway designs. The effectiveness of geometric design standards also needs to be re-assessed for both daytime and nighttime driving conditions.
• Education strategies to raise public awareness about the impact of ambient lighting on crashes for all road users, particularly vulnerable road users during the hours of twilight and darkness.
Supplemental Material
sj-docx-1-lrt-10.1177_14771535241239616 – Supplemental material for Investigating the effect of ambient light conditions on road traffic crashes: The case of Cape Town, South Africa
Supplemental material, sj-docx-1-lrt-10.1177_14771535241239616 for Investigating the effect of ambient light conditions on road traffic crashes: The case of Cape Town, South Africa by P Nteziyaremye and M Sinclair in Lighting Research & Technology
Footnotes
Acknowledgements
The authors would like to acknowledge the Department of Transport and Public Works of the Western Cape Province for providing road traffic crash data.
Declaration of conflicting interests
The authors declared no potential conflicts of interest with respect to the research, authorship, and/or publication of this article.
Funding
The authors received no financial support for the research, authorship, and/or publication of this article.

Supplemental material
Supplemental material for this article is available online.
References
Supplementary Material
Please find the following supplemental material available below.
For Open Access articles published under a Creative Commons License, all supplemental material carries the same license as the article it is associated with.
For non-Open Access articles published, all supplemental material carries a non-exclusive license, and permission requests for re-use of supplemental material or any part of supplemental material shall be sent directly to the copyright owner as specified in the copyright notice associated with the article.
