
Abstract
The non-image forming effects of light are moderated by various aspects such as dose, spectrum or temporal and spatial patterns. One of them, the spatial distribution of light within the field of view, has been scarcely researched. Although few studies suggest effects on melatonin secretion during night-time, the daytime effects remain unknown. In this project, we investigated the effect of three light directions – from above, below and the side – each illuminating different retinal regions. The luminance and the size of the light source were kept constant, thus realising the same vertical illuminance and melanopic irradiance at the eye for all scenes. Forty participants underwent a two hour protocol of cognitive tasks and subjective assessments of alertness and performance. Our results suggest stronger non-image forming-effects stimulation with lighting from above, whereas the effect of lighting from below and side differed slightly.
1. Background
Light affects the human brain and body in ways other than just providing visual information. The non-image forming (NIF) effects can manifest in cognitive performance, alertness, mood or various physiological responses, such as hormonal balance, heart rate and sleep quality.
However, light comes in many shapes and forms, with different sources of origin, doses and spectral compositions – each affecting the magnitude of the NIF effects in their own way. Thus, defining the exact light dose required for stimulating the desired NIF effects is difficult. Furthermore, literature gives examples showing that it is not only the characteristics of light but also the context of its use – otherwise known as its patterns 1 – that play a significant role. These potentially moderating patterns include exposure duration, timing (day and season) and light history. In addition, individual differences of the test subjects, such as chronotype or age group, are important.
Looking at recent reviews and overviews of the literature on light, alertness and cognitive performance,2–4 one can notice a broad disparity in the experimental designs with varying light intensities, spectral composition, exposure duration, number of participants and other components of the experimental paradigms. It could explain why a similar light dose yielded different results in some cases. Although many of these moderating factors have been widely researched, the spatial pattern of light – its directionality – has been looked into scarcely. The handful of studies on this topic mainly cover night-time conditions with a focus on melatonin secretion related to the illumination of different retinal areas.
The most apparent relationship was found between the illumination of the inferior retina (when the light arrives at the eye from the upper field of view (FoV)) and melatonin secretion, with a stronger reported effect in comparison to the illumination of the superior part of the retina.5–7 Moreover, illumination of the nasal part of the retina was found to be more effective at melatonin suppression than the temporal part.8–10 Nevertheless, some of these studies reported no difference between the illumination of superior and inferior parts of the retina,8,10 conflicting with the findings of the other publications. However, the experimental paradigms were different, suggesting that perhaps another more significant factor came into play. Although these studies focused on melatonin secretion and phase shifts in night-time conditions, the daytime moderating effect remains unknown.
The question is whether illumination of the retinal regions that were proven to be particularly efficient at suppressing melatonin at night would also lead to stimulation of – non-melatonin-related – NIF effects during the day. Therefore, the following hypotheses were tested:
In the support of cognitive performance and alertness:
– Illumination from the upper side of the FoV (inferior retinal illumination) will be more effective compared to the lower part of the FoV (superior retinal illumination).
– Illumination from the side will be more effective than from the lower part of the FoV.
2. Method
2.1 Experimental set-up
Three lighting conditions (also referred to as lighting scenes (LSs)) were realised in two custom-built chambers to test the hypotheses. Each of the conditions was designed to illuminate different retinal areas. The light sources used for every lighting condition were the same type (see Figures 1 and 2). Moreover, every light source was within the limits of the FoV, as per the CIE S026 model for indoor spaces. 11 LS1, LS2 and LS3 had their light source position only varying in the tilt angle (Figure 3),12,13 with a reference to the observer’s gaze direction. The distances to the centre of the light sources, as well as the slant angles,12,13 were the same (Figure 2). LS1 used the light source positioned in the upper part of the FoV, thus illuminating the lower retinal area. LS2 used the light source positioned on the side of FoV, thus illuminating one eye’s temporal and the other eye’s nasal retina. LS2 in test chamber 1 was on the right side and in test chamber 2 on the left side of the participant’s FoV (Figure 3). LS3 used the light source positioned in the bottom part of the FoV, thus illuminating the superior part of the retina. Two additional LSs utilised frontal light exposure with a luminaire in front of the participants, and they will be the topic of a follow-up publication.
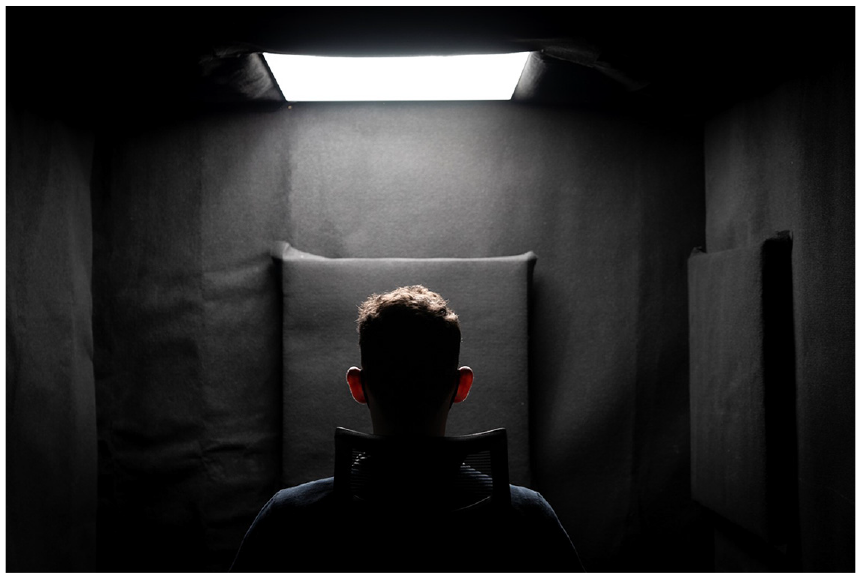
Lighting scene 1 with luminaire above the participant
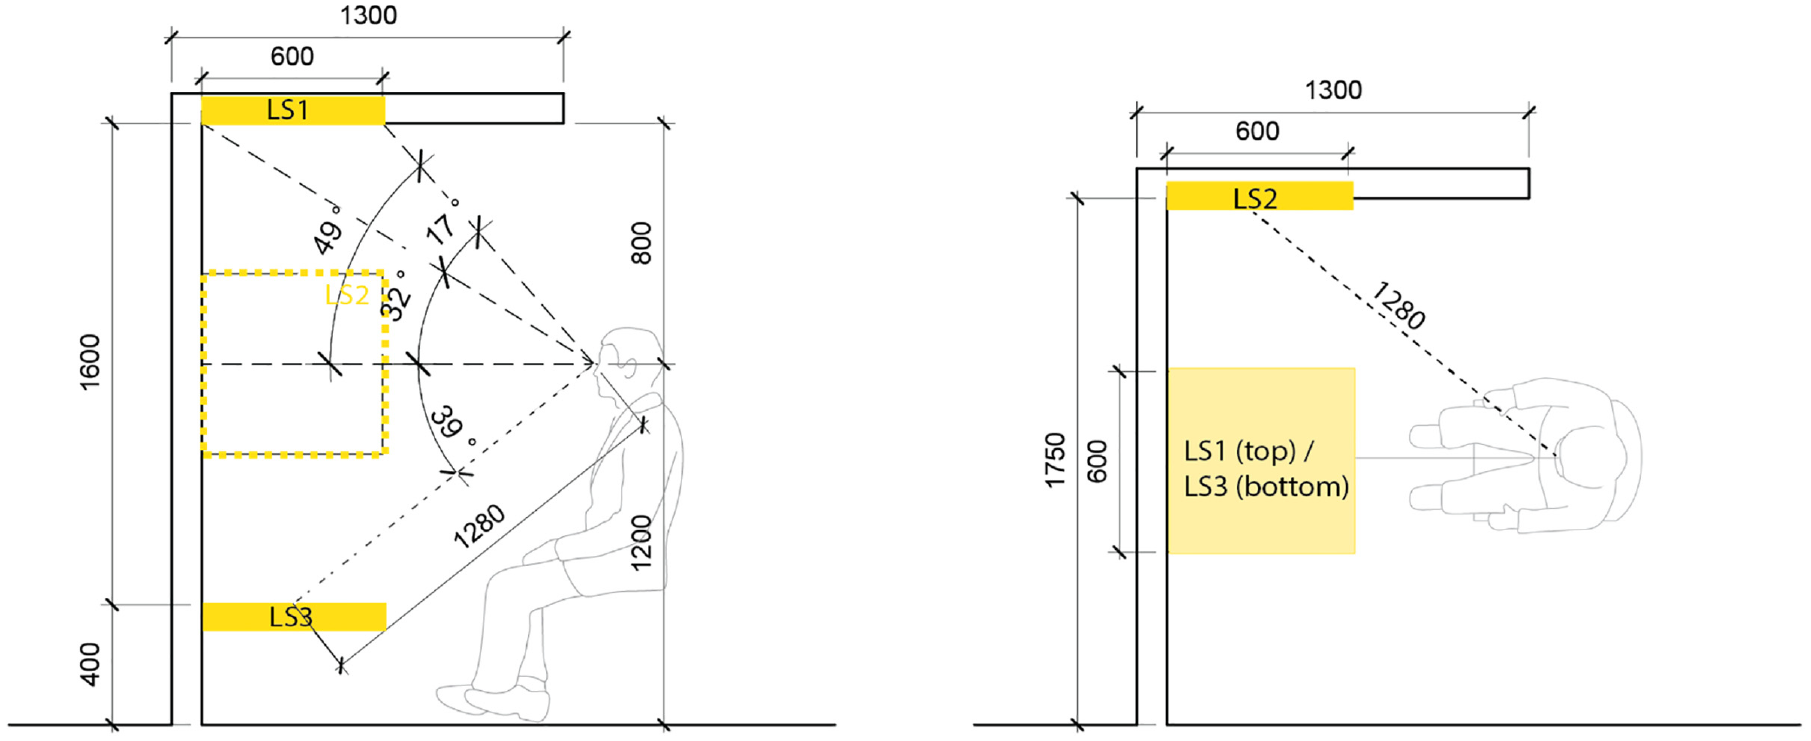
Section (left) and plan (right) sketches showing the position of participant and light sources for the three lighting scenes (LS1, LS2 and LS3). Dimensions given in millimetres
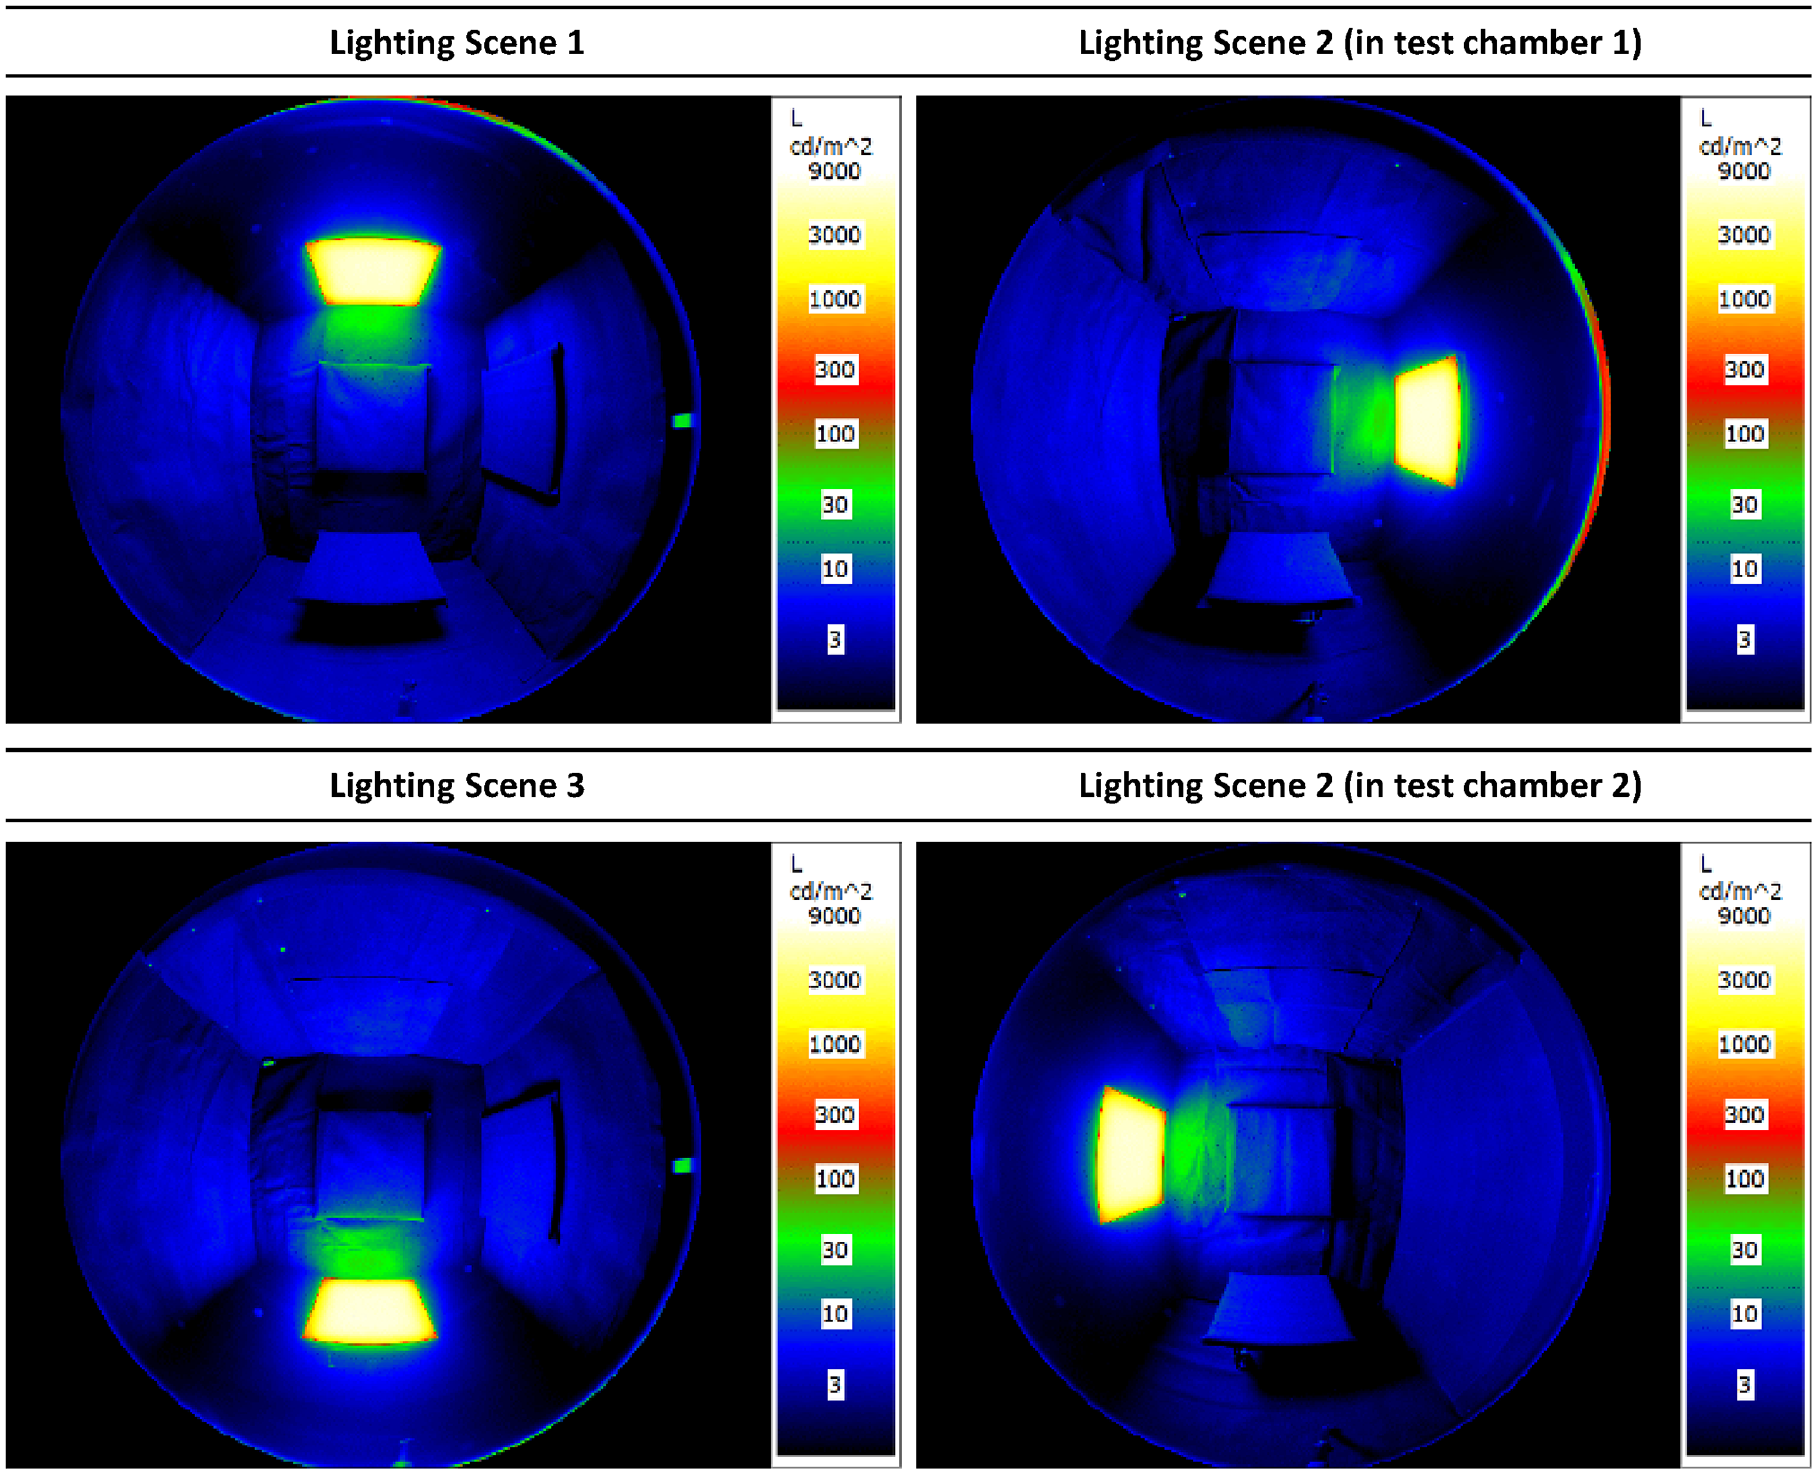
Fish-eye luminance images of the lighting scenes, taken from the position of the participant’s eyes
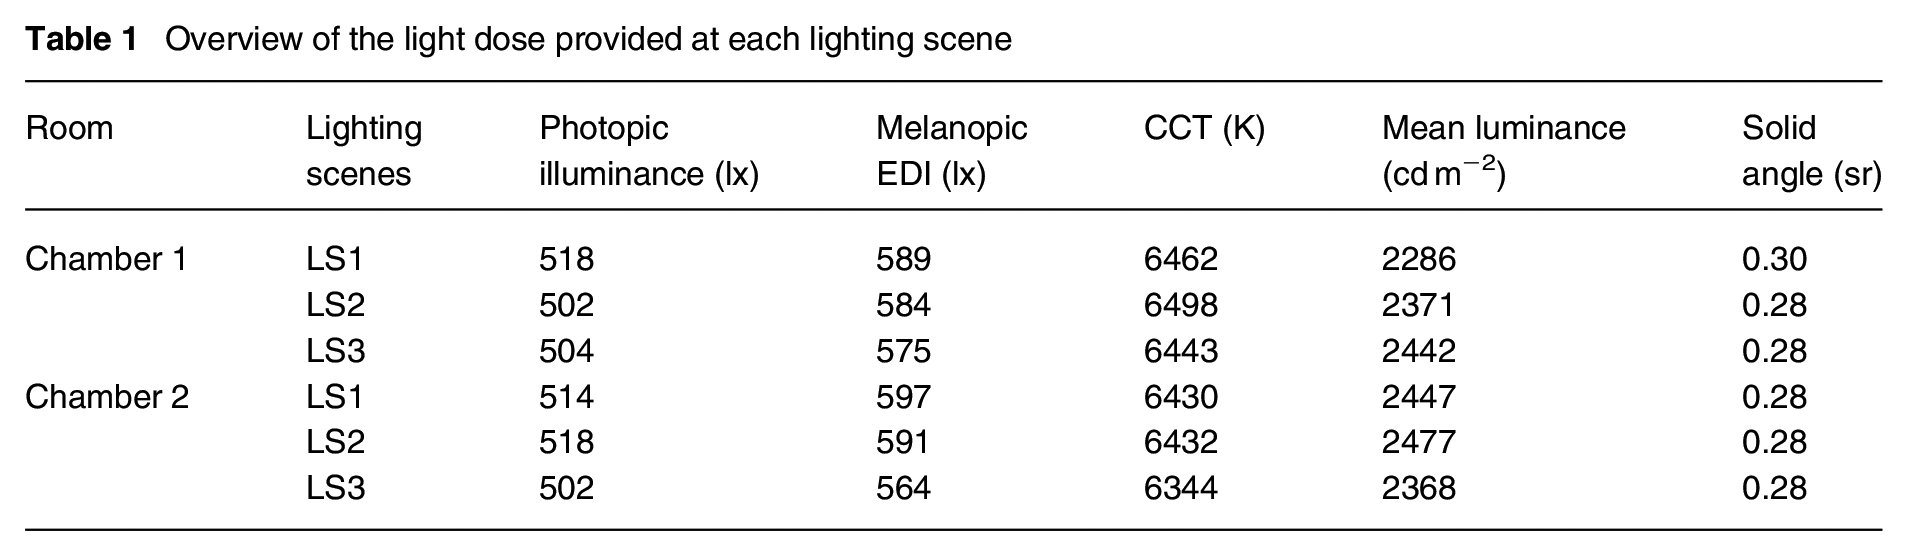
All the conditions were viewed binocularly and provided a similar light dose measured vertically at the eyes of test subjects with a spectroradiometer (specbos 1201, JETI Technische Instrumente GmbH, Germany) (Table 1). The light dose was determined considering a minimum dose of 250 lx melanopic equivalent daylight illuminance (mEDI), as per the recommendations for daytime dose in indoor workplaces for healthy circadian stimulation. 14 The actual dose was increased to match more realistic daytime levels and was based on the subjective acceptance level as judged by the researcher, in a longer session under the light exposure realising a (photopic) illuminance of 510 lx at eye level. To maximise the circadian stimulus of the selected dose, a blue-enriched spectral power distribution (Figure 4) with a Correlated Colour Temperature (CCT) of 6400 K was used to provide an mEDI of ca. 580 lx. This CCT is still within the range of commercial products; the colour rendering index (CRI) was >80.
Overview of the light dose provided at each lighting scene
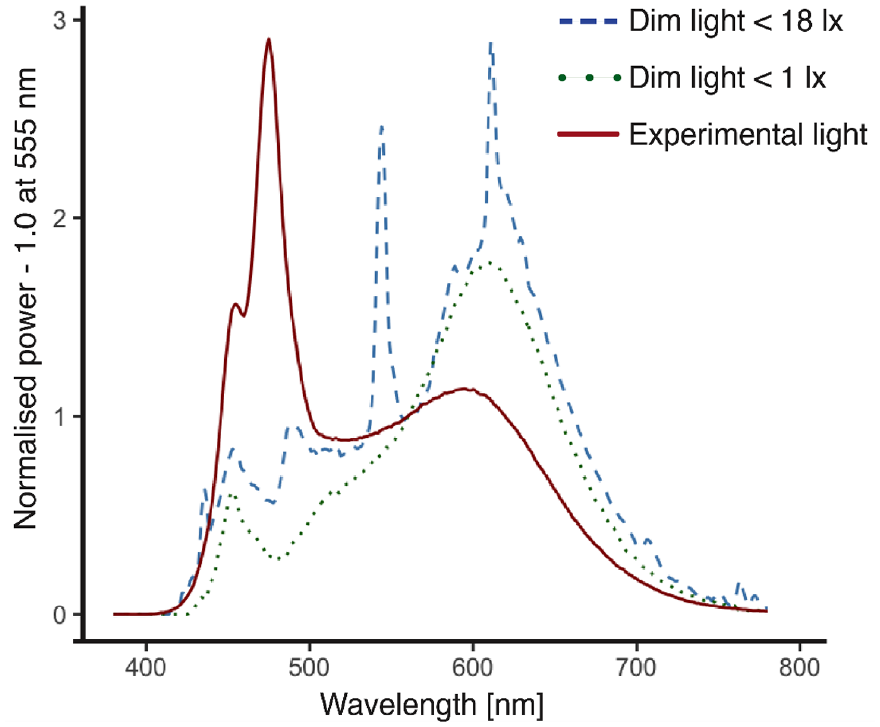
Spectral power distribution of the light sources used in this experiment, normalised at 555 nm.
2.2 Setting and apparatus
The experiment took place at the Technische Universität (TU) Berlin in the laboratory of the Chair of Lighting Technology, where the walls and the laboratory’s ceiling are painted black. The experimental set-up consisted of two areas (Figure 5 for drawing). During the beginning of the experiment, while taking the entrance questionnaires and lunch, the participants were positioned in Area 1, with the tables and computer stations. During the cognitive tests, the participants were positioned on chairs with headrests in Area 2, in custom-made chambers with mirrored layouts. Humidity level, air quality and temperature in the chambers were registered throughout the experiment via sensor placed on the control desk. The dimensions of the chambers were 1.75 m wide and 1.30 m deep. Each chamber was covered with black carpet-like fabric (reflectance: 2.0%, measured with a reflectance and transmittance measurement system (LMT RT500, LMT Germany GmbH, Germany), which uses standard illuminant A at an 8° angle), and the rest of the laboratory was separated with black curtains. Each chamber was equipped with four identical custom-made, 3-channel (warm white, cool white and blue) LED luminaires (RIDI NOREA-QA SPECTRAL) of 600 mm × 600 mm dimensions.
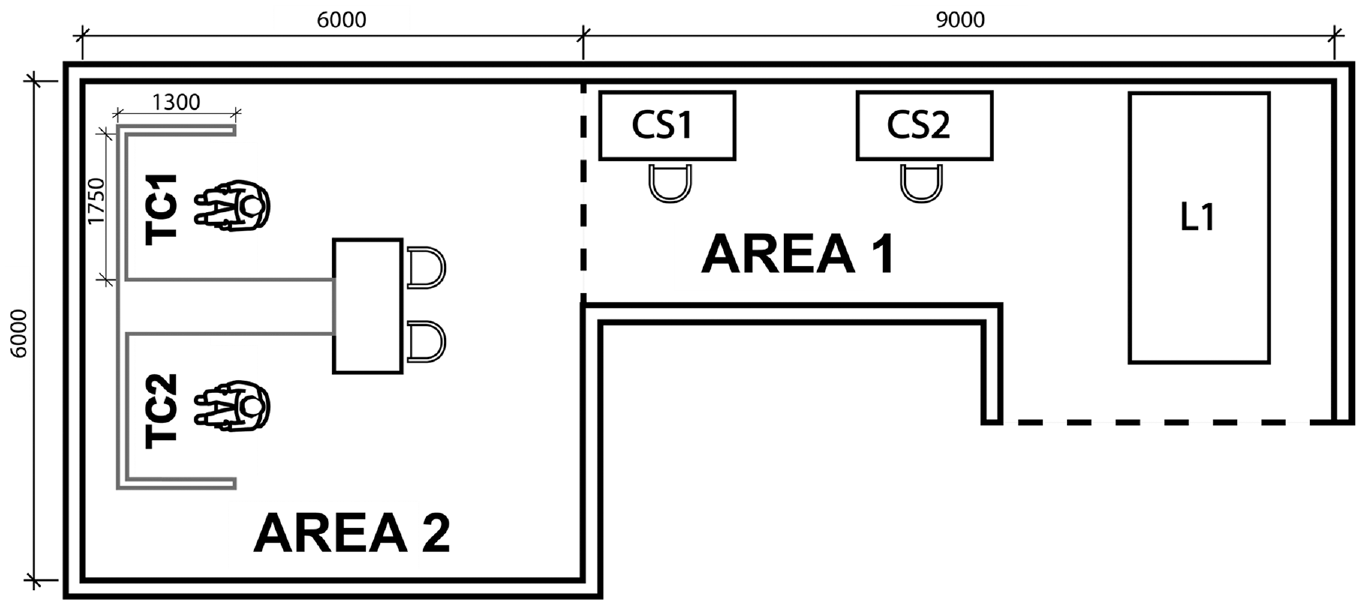
Plan of the laboratory. Dimensions given in millimetres
Only one of the luminaires was active in each lighting condition. While inactive, light sources were covered with the same black fabric as on the walls of the chambers (see Figure 1). The participants sat at the edge of the chambers, and there was a room divider between them as the chambers had an open end (Figure 5– drawing of the room). The testing chambers in Area 2 were equipped with webcams aimed at the participants’ eyes. The camera preview was used by the researcher to supervise the gaze direction and to control if participants kept their eyes open during the sessions. The footage was not recorded and stored due to data protection, and participants were informed about the purpose of the cameras.
On the tables in Area 1 and behind the participants in Area 2, there were small spherical luminaires (IKEA FADO) equipped with a warm white light source (IKEA SOLHETTA LED 470 lumen, 2700 K) which provided the dim light condition in Area 1 and Area 2. During the questionnaire phase, this dim light condition realised, together with the light from the computer screens, a vertical (photopic) illuminance of <18 lx at the eye level, at a CCT of 3091 K, and a melanopic EDI of <10 lx. The dim light condition realised a vertical illuminance at the eye of <1 lx in Area 2, as the luminaries were positioned behind the participants, effectively shaded by them.
The questionnaires were on iMac computers (iMac Model A1225 (EMC 2211), Apple, USA) using the so-sci.de platform to record the data. The cognitive tasks were performed using the Raspberry-Pi-based device AURETIM (software version 1.3), which was specially developed for psychological cognitive tests. 15 All the cognitive tasks were auditory to refrain from visual stimuli in the experimental set-up. The participants received headphones and hand-held keyboard-like buttons (LICHIFIT Mini Keyboard) for their responses.
2.3 Participants
Forty participants (24 men, 16 women; mean age = 27.5 years, SD = 4.74; range = 20 y to 37 y) were recruited for this study. The participants were selected based on the following inclusion criteria probed in the registration questionnaire:
– Good mental and physical health, assessed with the SF-12 questionnaire (mental health score >34, physical health score >33). 16
– No significant indication of depression (score <10, probed with Patient Health Questionnaire (PHQ-9) 17 ).
– Normal or corrected vision.
– No colour blindness assessed with Ishihara test on the first visit to the lab.
– No travel through multiple time zones up to 2 months prior to the experiment.
– No extreme chronotype, assessed with the D-MEQ (Morningness-Eveningness Questionnaire) 18 with a score between 30 and 70.
– Fair sleep quality, assessed with the Pittsburgh Sleep Quality Index (PSQI) questionnaire 19 (score <8).
– No regular or excessive alcohol use (more than three times a week).
Participants who did not fulfil the requirements were not admitted to the study. The participants were recruited from the TU Berlin mailing list and through posters with QR codes located at various locations in the city of Berlin. All participants signed the consent form and received payment after participation. Participants were paid after each completed session, with one bonus payment upon completing all five sessions.
2.4 Procedure
The experiment took place between 07 November 2022 and 27 February 2023, with 20 participants before and 20 participants after the winter holidays. The participants came in pairs, and lighting scenes LS1 to LS3 were offered to four participants per day for three consecutive weeks, with extra weeks to accommodate two additional LSs (follow-up publication) and cancellations. The experiment was approved by the Ethics Committee of the Faculty of Electrical Engineering, TU Berlin.
The experiment was performed in a within-subject design, where the participants went through each of the conditions (LS) in separate sessions (visits to the lab), with a 1-week wash-off period between the sessions (for a few exceptions this time was longer). During each visit, the participants were randomly assigned to one of the experimental LSs. After the dim light condition, the lighting condition within one session was kept the same.
Participants were asked not to consume any food and drink coffee or other stimulating products up to 3 h prior to the session and to maintain a regular and healthy sleeping schedule throughout the experimental period and a week prior to it. The experiment was performed in the early afternoon hours, starting either at 12.00 or 14.00, to benefit from the so-called post-lunch dip phase, when a natural decline in alertness occurs. As a meal enhances the post-lunch dip phase,20–22 it was decided to provide a meal before the main experiment.
Each session (Figure 6) consisted of an introduction and entrance questionnaire with lunch (also referred to as a testing block, or TestBlock 0, abbreviated to TB0), a baseline TestBlock (TB1), an active listening task, two more TestBlocks (TB2 and TB3), an ending questionnaire (TB4) and a debriefing. One full session lasted a maximum of 120 min, and the same protocol was repeated for each of the five visits.
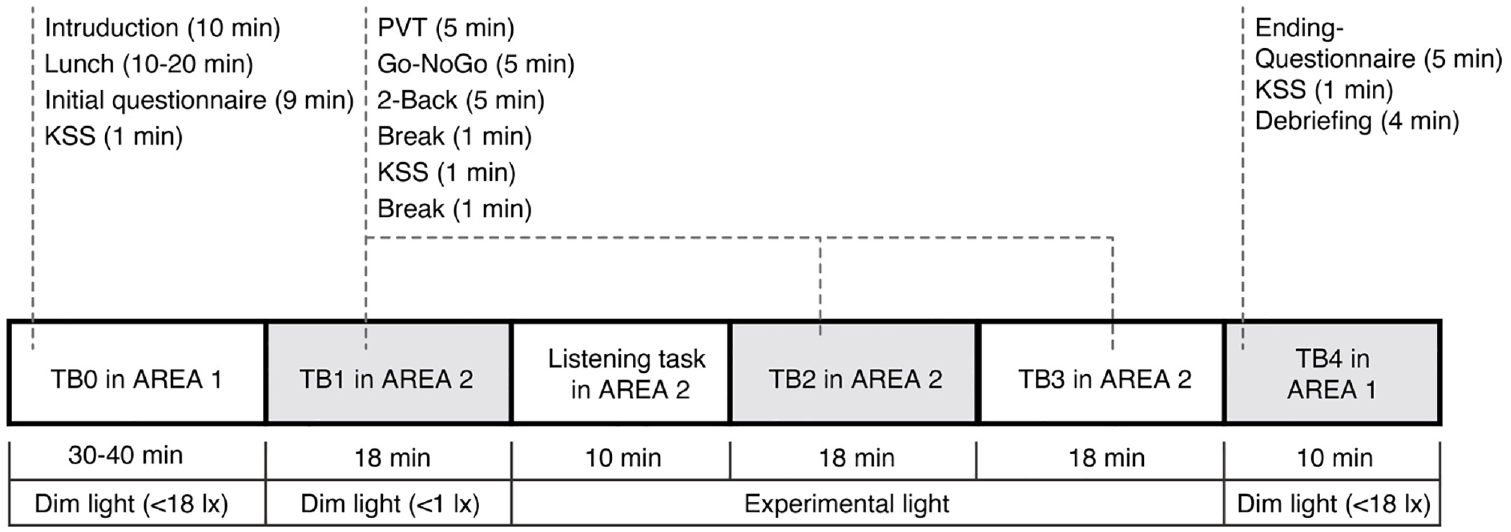
Protocol for each test session
During the first session of the series, the participants were introduced to the cognitive tasks and presented with examples, and the Ishihara colour blindness test 23 was performed. During the first 20 min of each session, the participants were presented with the session’s protocol and filled in the initial questionnaire, which probed the following: momentary sleepiness (assessed with a nine-point Karolinska Sleepiness Scale – KSS 24 ), sleep quality on the day of the session (assessed with the PSQI questionnaire 19 ), light history of the 24 h preceding the visit (assessed with Harvard Light Exposure Assessment questionnaire 25 ), momentary mood state (assessed with the multidimensional well-being questionnaire (MDBF) 26 ), general well-being on the session day, food and beverage consumption on the day of the session, time spent outside and activities performed until the session, height and weight for the Body-Mass-Index (BMI) calculation.
After the initial questionnaire, participants remained in Area 1 for an additional 10 min to 20 min, where they consumed a lunch meal, served per dietary preferences expressed in the registration questionnaire. The caloric intake of the meals was reported for future checks for the potential moderating role of food consumption on the dependent variables. It was calculated into a custom-made variable called Food Factor, which was the total number of calories divided by the BMI of the participant. The caloric intake was approximately the same per visit per participant, as they were asked to eat the same amount of food every visit.
After the meal, participants moved to Area 2 and took a seat in the experimental chambers. Their positions were adjusted as per Figure 2. They put on the headphones, received handheld buttons and prepared for the TB1, which shortly commenced.
Each TB1–3 consisted of a 5-min version of the Psychomotor Vigilance Task (PVT 27 ), followed by a 5-min Go–NoGo task, 28 ending with 5-min 2-Back digit task. 29 After the sequence of three tests, there was a 1-min break, followed by a verbally asked question about the level of sleepiness (KSS scale), and then another short 1-min break. The total time of each of the TB1, 2 and 3 was 18 min. TB1 was performed in dim light conditions of less than 1 lx at the eye to establish the baseline measurement for each session.
After TB1, the experimental lighting condition was turned on. From this moment, participants were asked to keep their eyes open and fix their gaze on a 4 cm × 4 cm cross made with 5-mm thick opaque green tape at a 1.28-m distance in front of their eyes glued on the luminaire cover. The gaze direction was controlled via webcams installed in the chambers.
In the first 10 min of the LS, the participants performed an active listening task, listening to an audiobook about the solar system. 30 The participants were afterwards asked control questions; however, the answers were not reported. It was a way to keep the subjects mentally engaged and activated during the initial light exposure.
After the active-listening task, the participants went through TB2 and TB3, resulting in a total of 46 min exposure in the experimental lighting condition (two blocks of 18 min + 10 min during the active-listening task).
After TB3, participants were asked to return to Area 1 and perform the final questionnaire on the computer stations (TB4). The questionnaire probed the level of sleepiness, lighting quality, visual and room comfort (Likert-type 7-point scales) and final comments and observations.
2.5 Dependent variables
The dependent variables in this experiment included objective measures in the form of auditory performance tests and subjective measures in the form of verbal questions related to the level of sleepiness. Verbal form was chosen over screen-based questionnaires to eliminate any additional luminous sources in the FoV, other than the experimental light. The specific performance tasks were chosen following the frequently occurring tasks in the literature on cognition and NIF effects of light.2–4 Subjective assessments of mood, room comfort and visual comfort were probed in the beginning or end questionnaire, but they are not subject to this paper.
2.5.1 Performance tests
The first test in TB1–TB3 was a 5-min version of the auditory PVT. This task was used for assessing objective alertness and sustained attention. Here, the participants were asked to press a button as soon as they heard a sound (pitch: 440 Hz, 500 ms duration) on the headphones. The time interval between the sounds was randomised between 2 s and 8 s. The measured marker in this task was reaction speed (1/mean reaction time in seconds), meaning that a higher number was a faster response. Any reaction slower than 2 s was reported as a lapse.
The second test in TB1–TB3 was a Go–NoGo task, another widely used cognitive test for measuring inhibition capacity and reaction time. In this test, the participants heard two types of sounds – the target sound (similar to the PVT) and the non-target sound (pitch: 600 Hz). Every time they heard the target sound, they were asked to press the button; every time they heard the non-target sound, they were asked to refrain from action. The sound sequences were generated randomly, together with a randomised time interval between them, similar to the PVT task (between 2 s and 8 s). The markers in this task were reaction speed (1/mean reaction time in seconds) and percentage of correct responses (pressing the button at target stimuli and ignoring the non-target stimuli). Any reaction slower than 2 s and any incorrect button press (reacting to non-target stimuli) was reported as a lapse.
The third task was an auditory 2-back task used to assess short-term working memory performance. In this task, the participants listened to a 5 min sequence of digits from 0 to 9. They were asked to press the button whenever they heard the digit that equalled the penultimate. The digits were played at 1.5-s intervals in randomly generated order, but each complete 5 min sequence always had 30 matches. The marker in this task was the percentage of correct responses. Any incorrect button presses, as well as missed button presses, were recorded as lapses.
2.5.2 Subjective assessments
The level of subjective alertness was assessed with the KSS. 24 It is a nine-point scale where number 1 on the scale means ‘extremely alert’, and number 9 equals ‘very sleepy, doing great efforts to stay awake’. The first KSS assessment was probed in the entrance questionnaire, where participants could also read the description of the scale’s steps. It was then followed by three verbal assessments at the end of TB1–3. The last KSS assessment was done through the ending questionnaire. Therefore, there were a total of five assessment points throughout one session.
2.6 Covariables
The remaining responses to the various questionnaires were used to check for their role as potential covariables affecting the measured outcomes and to check for differences in participant states prior to the sessions.
2.7 Statistical analysis
To test the hypotheses, multivariate and univariate linear mixed model (LMM) analyses were performed to analyse the effects of categorical variables on the numerical response variables of the cognitive tasks and subjective sleepiness (Overview of variables in Tables A1.2–3 in the Supplemental Material). In addition, a set of univariate models was computed for the analysis of the effect of potential covariates on the response variables of the cognitive tasks and subjective sleepiness.
All models include data from five LSs, whereas in this article the focus is on the analysis of the LS1, 2 and 3. Analysis of the scenes that utilised frontal light exposure is included in a follow-up paper.
The significance of differences between estimated marginal means (EMMs) for categorical variables was calculated using contrast analysis without adjustment except for the KSS variable, where Tukey’s adjustment was applied due to a more compound analysis.
For all LMMs, the subject ID was added as a random effect. Cohen’s d was calculated to analyse the effect sizes within TB between LS in the multivariate LMM models and the effect size within LS categories in the univariate models examining the effect on response variables. The effects within the ±0.2 difference were considered similar when comparing effect sizes. The significance level of all statistical tests was set at α = 0.05. Interpretation of the results of the model effect sizes (d,
2.7.1 Multivariate models for cognitive performance and subjective sleepiness
To estimate the effects of the categorical explanatory variables (LS and TB) on the numerical response variables (PVT reaction speed, Go–NoGo accuracy, Go–NoGo reaction speed, 2-back accuracy and KSS), multivariate LMMs were fitted in the form of a factorial design with Restricted Maximum Likelihood and Boundary Optimizer Based on Quadratic Approximation. 32 The exploratory step of analysing the results of the response variables Go–NoGo accuracy and N-Back accuracy revealed a singularity effect in the response data of these variables, so it was not possible to fit them in LMMs (too good of a performance of the participants); thus, their analysis is omitted. However, summary statistics of these two variables are included in Section A of the Supplemental Material. The LS explanatory variable had three categories (LS1–3) for each of the response variables, whereas the TB categorical explanatory variable had five categories (TB0–TB4) for the KSS response variable and three categories (TB1–TB3) otherwise. Estimation of the target interaction effect in the model was performed using contrast analysis within TB categories conditioned on LS.
2.7.2 Univariate models with covariates
The effects of the covariates PSQI score, food factor, CO2 level, humidity level, room temperature, LED light history (time counted in hours spent under LED lighting within the 24 h before the session), indoor daylight light history (time counted in hours, spent under daylight indoors, within the 24 h before the session), time outside light history (time spent outdoors prior to the session, counted in hours) on the response variables KSS, Go–NoGo reaction speed and PVT reaction speed were analysed using univariate LMMs.
2.7.3 Statistical environment
Analyses were conducted using the R Statistical language 33 (on Windows 10 pro 64 bit (build 19045)), using the packages lme4, 34 Matrix, 35 purrr, 36 emmeans, 37 sjPlot, 38 report, 39 ggplot2, 40 dplyr, 41 tidyverse, 42 readxl, 43 lmerTest, 44 ggpubr 45 and rstatix. 46
3. Results
This paper focuses on the impact of the directionality of light on the dependent variables. The questionnaires in this experiment also assessed momentary mood state, visual and room comfort and lighting quality, which will be addressed in follow-up publications.
The overall explanatory power of each of the three multivariate LMMs for the response variables, Go–NoGo reaction speed, PVT reaction speed and KSS, was substantial, with an ICC (intraclass correlation coefficient) of 0.37 or higher (Table C1.1, Supplemental Material). The large difference between the coefficients of determination, together with the high value of the ICC, indicated a significant differentiation in the variation of the dependent variable between subjects, NsubjectID = 40. The results of the contrast analysis can be found in the Supplemental Material (Tables B1.1–6).
3.1 Go–NoGo reaction speed
The EMM range of Go–NoGo reaction speed values was [2.65–2.84]. The largest Go–NoGo reaction speed values (the fastest reaction times) within each LS were for TB1 (Table 2). Reaction speed decreased over time between TB1 and TB2 for all LSs, and between TB2 and TB3 for LS1 and LS3. For LS3, the reaction speed increased slightly between TB2 and TB3 (Table B1.4, Supplemental Material). Nonetheless, no significant difference in Go–NoGo reaction speed was found between the TestBlock baseline (TB1) EMM and the EMMs for other TB levels.
Contrast analysis of the Go–NoGo reaction speed model
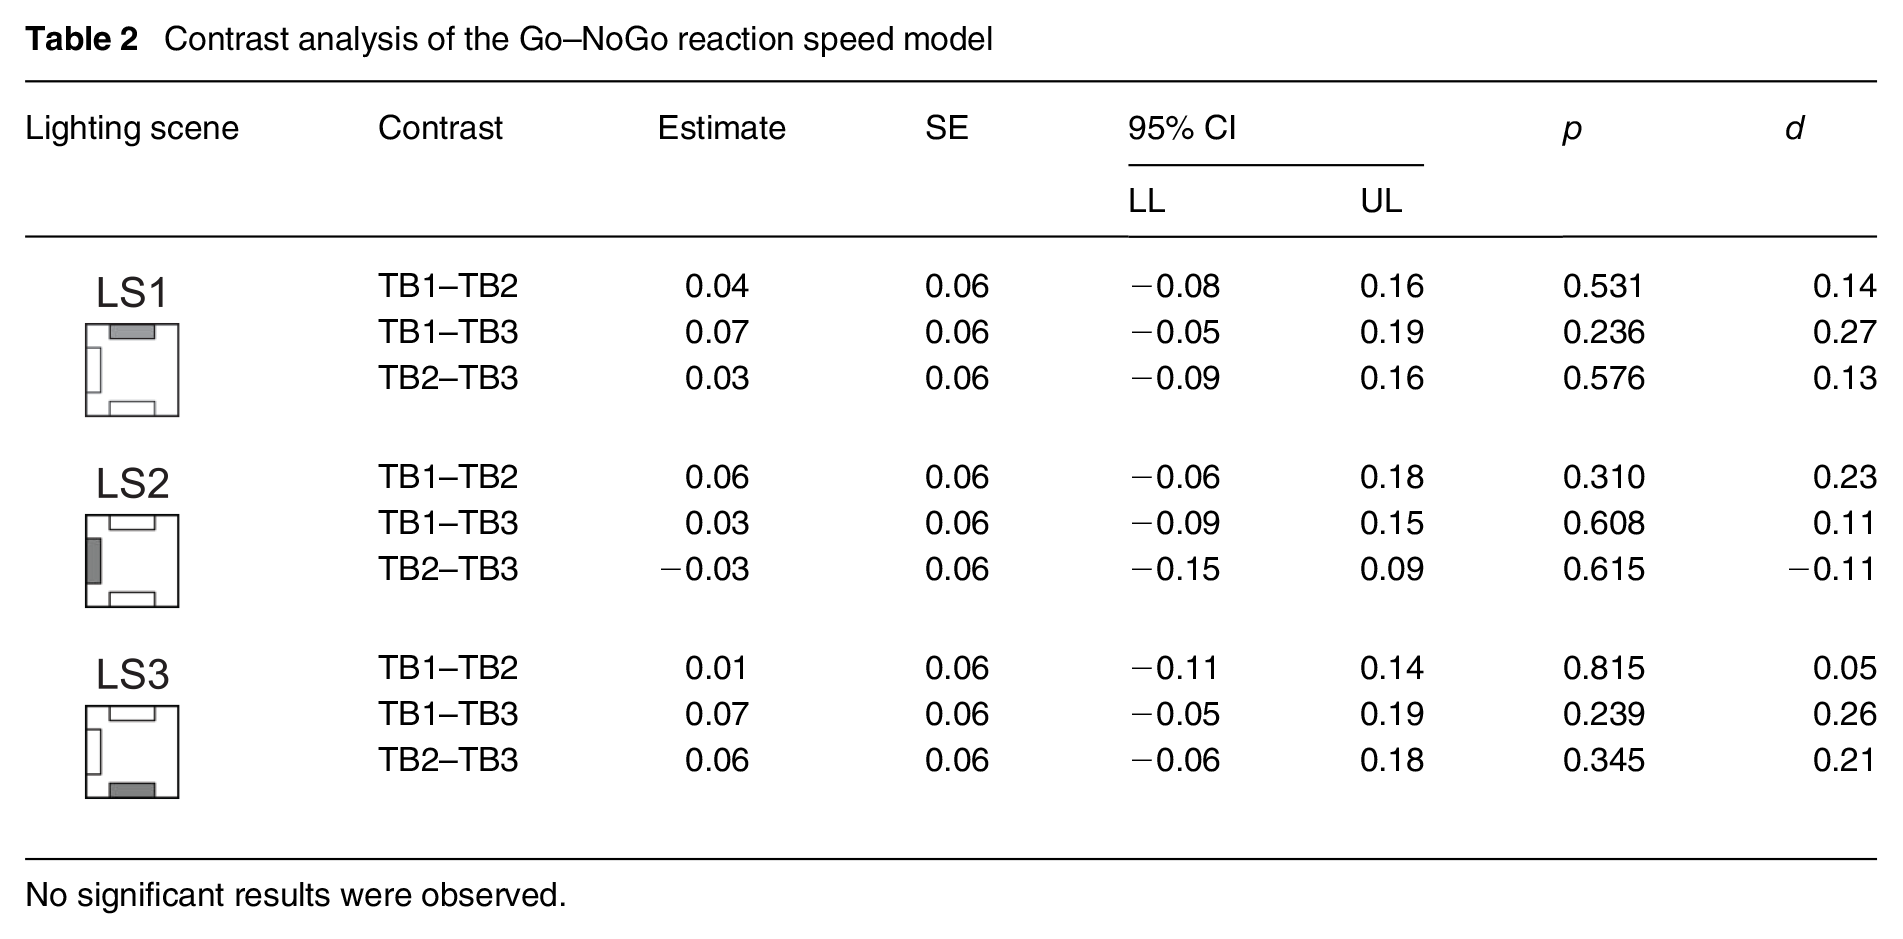
No significant results were observed.
3.2 PVT reaction speed
The EMM range of PVT reaction speed values was [3.62–4.25]. The largest PVT reaction speed values (i.e. fastest reaction times) within each LS were for the first TB level in all the LS (Table 3). Reaction speed values decreased over time, with the lowest EMM values for the last level of TB (Table B1.6, Supplemental Material, Table 3 includes significant results only).
Contrast analysis of the PVT reaction speed model
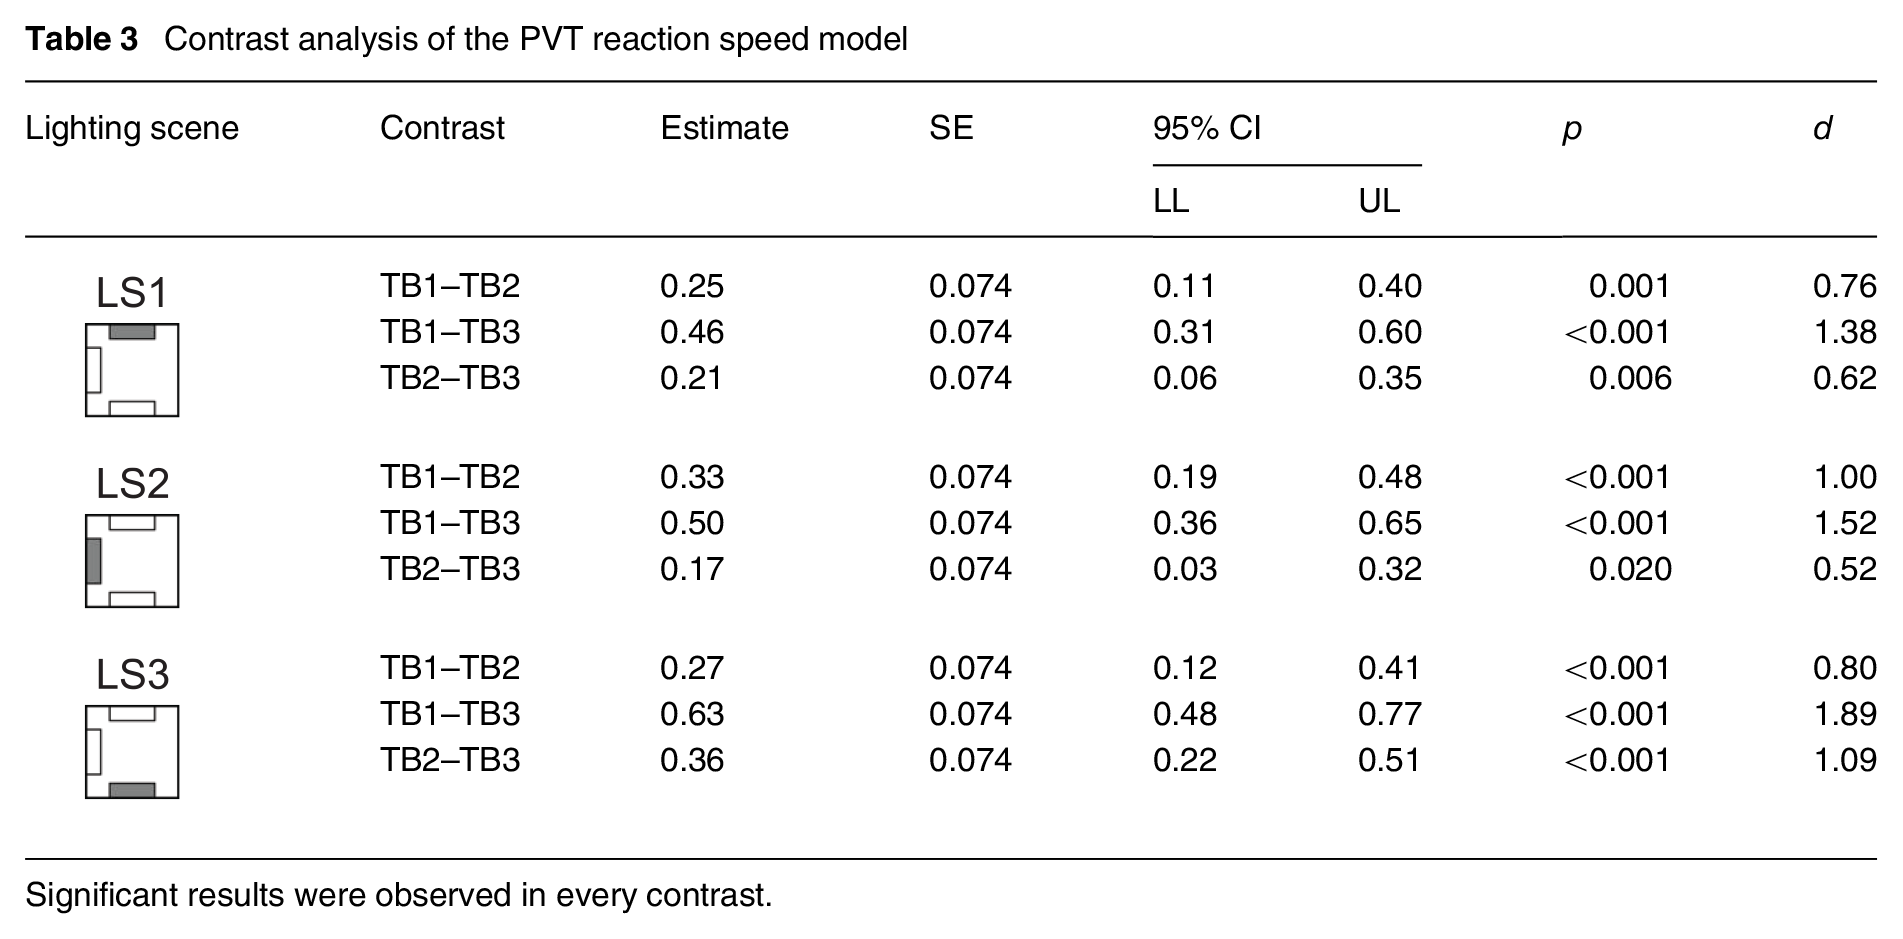
Significant results were observed in every contrast.
In all the LS levels, there were significant differences in PVT reaction speed within the TB category, with the reaction speed slowing over time. The largest effect was observed in LS3, with the effect size of d = 1.89 between TB1 and TB3.
3.3 Karolinska Sleepiness Scale
The EMM range of KSS values was [3.25–5.32]. The smallest KSS values for each LS were noted for TB0 category. The KSS values increased over time, with the highest EMM values for the TB4 for each LS. The results of the contrast analysis show the significance of the differences in KSS scores within TB categories between LS (see Table B1.2, Supplemental Material for all results, Table 4 includes significant results only).
Contrast analysis of the KSS model – only significant results
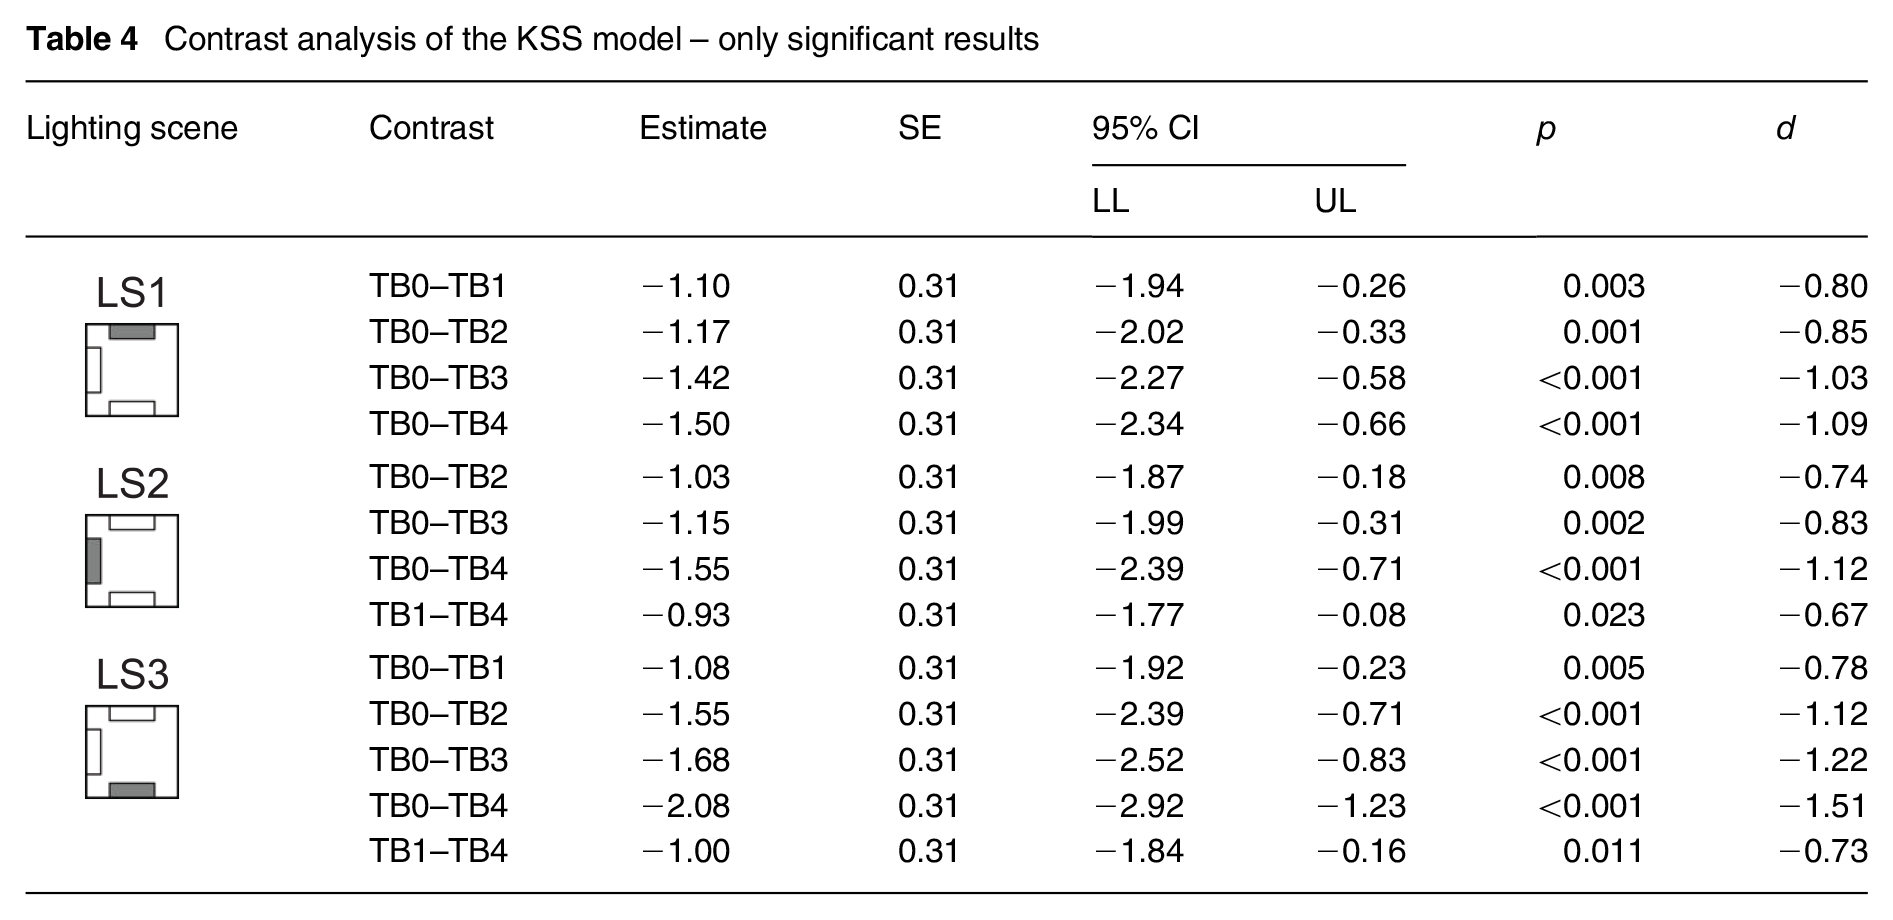
The data in Table 4 showed that there were significant differences in KSS between the TB baseline (TB0) and TB4 in all LS levels, with the largest effect found in LS3 (d = −1.51). In addition, significant differences in EMMs were found between TB1 and TB4 within LS2 and LS3, which is the main interest of the analysis as TB1 was the last measurement under dim light conditions before the light intervention. The effect sizes of the TB1–TB4 contrast in LS2 and LS3 were similar (d = −0.67 for LS2, d = −0.73 for LS3). In LS1, these contrasts were not significant showing that participants were getting significantly sleepier under LS2 and LS3, but not under LS1.
3.4 Covariates
The significant effects of covariates are included in Table 5. The β-value represents the estimated change in the response variable for every unit increase in the covariate.
Results of the fitted models with only the significant results
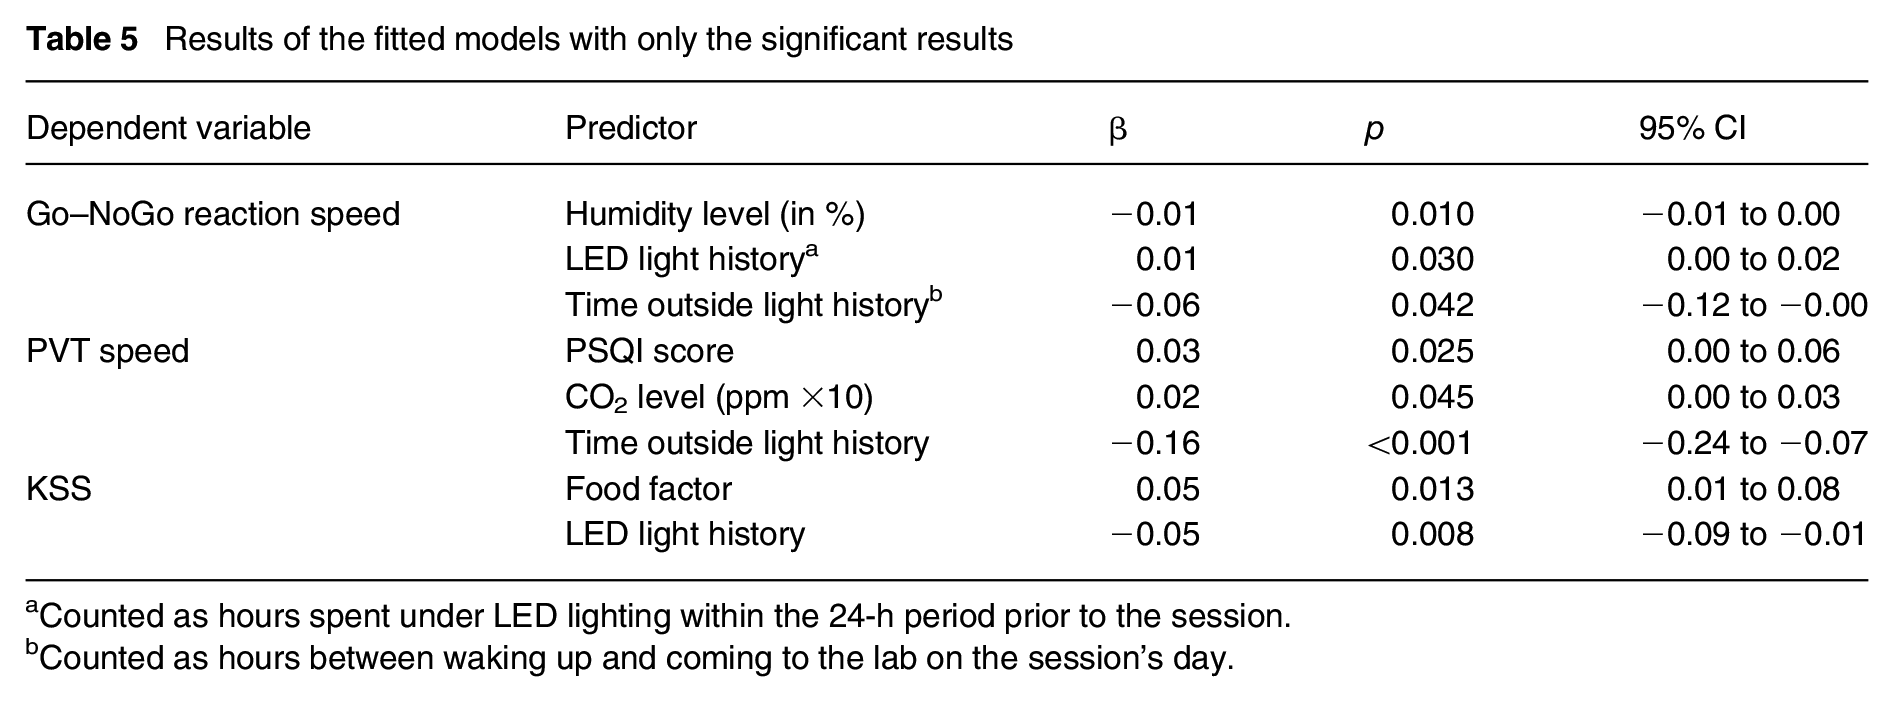
Counted as hours spent under LED lighting within the 24-h period prior to the session.
Counted as hours between waking up and coming to the lab on the session’s day.
The humidity level in the room, LED light history and time outside light history had a significant effect on the Go–NoGo reaction speed response variable, with β = −0.01 for the humidity level, β = 0.01 for LED light history and β = −0.06 for time outside light history.
The PSQI score (sleep quality on the day of the session), indoor CO2 level (presented in a normalised format as ppm ×10) and time outside have been shown to have a significant effect on the PVT reaction speed response variable, with β = 0.03 for the PSQI score, β = 0.02 for CO2 level and β = −0.16 for time outside light history.
Food factor and LED light history had a significant effect on the KSS response variable, with β = 0.05 for the food factor, and β = −0.05 for LED light history.
As an additional result, although not part of this paper, it is worth mentioning that LS1 was also scored significantly less glary in comparison to LS2 and LS3 (on the Visual comfort – Glare 5-point Likert-type scale). The analysis of visual comfort variables will come in a follow-up publication.
4. Discussion
The directionality of light is a scarcely topic in the literature on NIF effects of light, especially in the diurnal context. This study focused on investigating different directionalities of light during the daytime. For this purpose, here it was tested whether there is a difference in cognitive performance and self-reported sleepiness in LSs in which only the tilt angle of the light source was varied. To ensure that NIF effects were triggered in every condition, the delivered mEDI exceeded the recommended thresholds, 14 and a mEDI of ca. 580 lx and (photopic) illuminance of ca. 510 lx was provided at eye level. Thus, we did not compare a dim light (or no light) condition to a light intervention condition, which is in contrast to the majority of literature examples in this research field.2–4 Given the dissimilarities in experimental design, a direct comparison between our study and other diurnal studies examining light and NIF effects is not suitable.
The results of our study demonstrated that the magnitude of selected NIF effects can indeed be influenced by the directionality of light in diurnal conditions. As a result, we rejected the null hypothesis that lighting provides similar stimulation of the NIF effects regardless of the direction, as long as the quantity of mEDI delivered remains consistent.
The data analysis revealed varying effect of lighting on subjective experiences and cognitive performance. Lighting originating from the upper part of the visual field demonstrated greater stimulation compared to lighting emanating from the lower part. This difference manifested in subjective sleepiness and reaction time during a simple cognitive task (PVT). The results show that the light from the upper part of the FoV successfully kept the participants at stable levels of sleepiness after the initial large increase in the dim light condition. As for cognitive performance in the PVT task, the participants exhibited a significant drop in reaction speed over time under all lighting conditions, but the setting with light from below showed a more pronounced effect size compared to the LS with light from above. These findings correspond to the prior night-time studies that indicated stronger NIF effects, as evidenced by melatonin secretion, under inferior retinal illumination.5–7
Nonetheless, the reaction speed in the Go–NoGo task did not significantly change over time under any of the LSs, implying a similar NIF effect stimulation in all of them. For example, that could be due to the increased mental load of the task, which caused a heightened state of alertness and would render the influence of lighting conditions less effective over such a short period. On the other hand, this task was always the second in a sequence, which could mean that within a time span of one testing block, the participants’ fatigue neutralised the effect of light on the reaction speed. We suggest that the randomisation of tasks could tackle this issue in future studies.
Based on these findings, we support the hypothesis that lighting originating from the upper part of the FoV is more effective at stabilising subjective sleepiness and objective alertness measured in reaction speed in a simple cognitive task.
Our second hypothesis focused on comparing light administered from the side of the FoV with light from the lower part. Prior studies on lighting directionality from the side had primarily centred on the comparison between nasal and temporal retina illumination, utilising monocular exposure 8 or shading devices.9,10 To provide more practical insights, we analysed side lighting and lighting from the lower part of the visual field using binocular unshaded lighting exposure. The results indicated a significant decrease in subjective sleepiness for both LSs, with nearly identical effect sizes. Regarding PVT reaction speed, a significant drop in performance over time was also found in both scenes, although the LS with light from below had a larger effect size.
Based on these findings, we accept the null hypothesis, suggesting a similar NIF effect between side lighting and lower lighting conditions in the FoV.
The examination of covariates revealed their substantial impact regardless of the lighting conditions. While attempts were made to remind participants to maintain a regular routine, achieving uniformity in conditions across the five lab visits was not realistic. Light history expressed in both exposure to LED light and to the natural daylight prior to the session, the amount of consumed calories during lunch, sleep quality on the session day and air quality in the laboratory have been observed to significantly moderate the dependent variables of reaction speed and subjective sleepiness. Although these variables demonstrated a significant moderating effect on response variables, their magnitude of impact (expressed by beta values) was smaller in comparison to the impact of the lighting conditions where significance was reached. Therefore, despite significance, the impact of covariables can be considered negligible.
Regarding cognitive performance measured in inhibition capacity (accuracy in the Go–NoGo task) and short-term working memory (accuracy in the 2-Back task), our study faced a significant data limitation due to the singularity effect. Participants performed exceptionally well in the tasks, resulting in a large number of correct reactions with minimal variance between participants’ scores. Few identified studies from the relevant research field also used the auditory version of the Go–NoGo task.47–49 One reported a significant difference in performance between light and dim light conditions, albeit with performance remaining at a very high level of approximately 95% accuracy. 47 The other one reported non-significant results. 48 The last identified a similar data limitation as our study. 49 Based on the limited existing evidence in the literature and analysis of our own data, we suggest using a more difficult version of the task in future studies, not only to increase the likelihood of observing an effect but also to allow the appropriate data analysis altogether.
Concerning the auditory N-Back task, we concluded with a similar observation as in the Go–NoGo task – that a change in task design could potentially help in observing results and make the data usable in the first place. However, choosing the best-fitting parameters is challenging, given the mixed findings in the literature and general scarcity of examples. In a study that implemented 2- and 3-Back versions of this task, the influence of light was only significant in the 2-Back version and not the 3-Back. 50 Conversely, another publication reported significant results using the 3-Back auditory task. 51 Furthermore, another study incorporating both 2- and 3-Back tasks, in both auditory and visual formats, observed significant differences in both tasks, 52 however, only in a participant group of specific chronotypes. Notably, none of the three mentioned studies encountered the data limitation experienced in our study. However, it is crucial to emphasise that all these studies compared the light intervention to a dim light condition, which differs from our experimental design.
Although our collected data did not allow for the investigation of the hypothesis regarding the cognitive performance of higher functioning, these results provide valuable insights into the feasibility of the measures used. For future studies, we recommend considering adjustments in the task design or incorporating a set of different tasks to explore cognitive performance more comprehensively.
The participant group in this study comprised 40 individuals, a number determined as the maximum feasible within the constraints of a single season with specific photoperiod considerations, the capacity of the experimental room to accommodate two participants simultaneously and the requirement to conduct experiments during the post-lunch period. A larger cohort might have heightened the likelihood of detecting smaller effects.
A sensitivity analysis was conducted using G*Power software 53 to estimate the expected main effect from this sample size. The analysis was set on repeated measures ANOVA (within factors) with a LS comprising five levels, as such, a statistical approach was the initial plan for data analysis. The main effect assessment excluded the secondary influence of time duration. Parameters were set with an alpha level of 0.05, a power of 80% and a total sample size of 40. Groups were set at 1 (all participants experienced each condition), with five measurements representing each LS level. The effect size specification was defined as ‘as in SPSS’ to ensure comparability with the computation in R statistical software intended for the analysis of the results. Based on these inputs, the smallest detectable effect size was computed as f(U) = 0.28. Nonetheless, it is worth noting that a sample size of 40 participants remains comparable to that found in many publications within the relevant field.2–4
The participant selection aimed to obtain a representative sample of young adults with regular day-to-day rhythms. While other specific groups might have exhibited stronger responses to light, as demonstrated in studies involving factors such as sleep deprivation 54 or extreme chronotype, 52 our focus was on analysing a population which typically spends a significant amount of time indoors in offices, universities or school settings.
In our study, subjects with normal or corrected vision were allowed to participate, which was based on the participants self-assessment in the registration questionnaire. We did not conduct specific tests for mono- and binocular visual acuity, contrast vision or limitations in the FoV. Individual differences in the visual acuity, or any limitations in the perceived FoV that were not disclosed by the participants, could potentially alter the performance as well as the light exposure in different settings. It can be considered a potential bias of this study and should be considered in future studies on the directionality of light.
The duration of light exposure has been reported in the literature to be a moderating factor when comparing the experimental light intervention to dim light conditions, indicating that the effect on the PVT task getting more pronounced over time spent under the experimental light condition.47,51,55 Here, we were limited by the timing constraints of the protocol, and 46 min was the maximum exposure time we could accommodate. Moreover, as this was a laboratory study, participants’ comfort was very limited. However, with a perspective for future studies, a longer protocol, even with just one more time testing block, could yield results with more pronounced effects. That said, in the studies on NIF effects of light and cognitive performance, an exposure as short as 20 min 56 has been shown to affect higher cognitive functioning, and several studies with exposure closer to ours have also reported an effect,2–4 adding to the validity of our choice of 46 min. However, it is essential to underline that the majority of these studies, compared dim light conditions to a light intervention.
5. Conclusion
This study contributes significantly to the existing body of research on NIF effects of light, as it investigates the previously unexplored aspect of directionality – a spatial light pattern – in the early afternoon conditions. While ensuring an equivalent light dose in all settings, adhering to indoor workplace recommendations, our investigation unveiled statistically significant disparities among various directional lighting configurations concerning alertness and subjective sleepiness. Particularly, lighting from the upper part of the visual field was shown to provide a higher NIF effects stimulation.
In view of these results, we reject the null hypotheses that the tested lighting conditions with the same light dose but different directionalities of light lead to a similar stimulation of the NIF effects.
In terms of the application of results, the key takeaway of our results is underlining the importance of lighting from the upper part of the visual field in providing aid for alertness and reducing subjective sleepiness, which can be achieved by appropriate office lighting together with well-designed daylight openings and shielding.
The collected data in this study has also revealed that environmental and participant-specific covariates significantly influence alertness and cognitive performance. Therefore, we emphasise the essentiality of reporting the details and impressing upon participants the importance of a consistent lifestyle routine throughout the experiment. Although this study was conducted over an extended period with multiple laboratory visits, shorter studies may allow participants to maintain a consistent schedule and lifestyle between the sessions.
Supplemental Material
sj-pdf-1-lrt-10.1177_14771535241237096 – Supplemental material for The effect of light directionality on alertness and cognitive performance during post-lunch dip
Supplemental material, sj-pdf-1-lrt-10.1177_14771535241237096 for The effect of light directionality on alertness and cognitive performance during post-lunch dip by N Derengowski, M Knoop and S Völker in Lighting Research & Technology
Footnotes
Acknowledgements
The design of this study was registered to OSF.io on 7 November 2022. Different stages of this study were presented during Licht’23 and SLTBR 2023 conferences and can be found in their proceedings. Special thanks to Kai Broszio and Moritz Christian Dölle for all the help with the project.
Declaration of conflicting interests
The authors declared no potential conflicts of interest with respect to the research, authorship, and/or publication of this article.
Funding
The authors disclosed receipt of the following financial support for the research, authorship, and/or publication of this article: This research was performed within the European Training Network LIGHTCAP (project number 860613) supported by the Marie Sklodowska-Curie actions framework H2020-MSCA-ITN-2019.
Supplemental material
Supplemental material for this article is available online.
References
Supplementary Material
Please find the following supplemental material available below.
For Open Access articles published under a Creative Commons License, all supplemental material carries the same license as the article it is associated with.
For non-Open Access articles published, all supplemental material carries a non-exclusive license, and permission requests for re-use of supplemental material or any part of supplemental material shall be sent directly to the copyright owner as specified in the copyright notice associated with the article.