
Abstract
This research concerns the influence of electric lighting on user behaviour in public squares and whether differences in people’s use of the square can be observed between daylight and darkness. Previous research on pedestrians suggests that lighting can support human needs for reassurance, accessibility, comfort and pleasure. While these findings are also likely to be applicable to the use of public squares, there is little empirical evidence to verify that. A field study was conducted to explore user behaviour in two differently illuminated public squares. Observations of the movements and stationary activities of people in the squares were recorded at both squares for the same times of day in the weeks before and after the daylight savings clock change, enabling a comparison of activity in daylight and after dark. 5296 observations were recorded and lighting conditions were captured with HDR-photography and aerial photos. Kirseberg square, with asymmetric luminaires and metal halide lamps, revealed a decrease in stationary activity after dark. Lindeborg square, with omnidirectional luminaires and high-pressure sodium lamps, revealed an increase in stationary activity. In conclusion, the patterns of user behaviour in the two public squares after dark seem to be differently influenced by electric lighting, pointing to a need for further understanding of users’ experience of the squares after dark.
1. Introduction
The United Nations New Urban Agenda 1 and the Habitat III policy paper I The Right To The City And Cities For All 2 envisage the right of people to safe and healthy habitats, including the right to fully enjoy the city with its sufficient, accessible and quality public spaces. Public spaces are here defined as publicly accessible spaces, such as parks, streets and squares. 3 At their best, public spaces are ‘sites of civic promise’, 4 supporting the quality of life3,5 and wellbeing of individuals.6,7 Good public spaces are accessible and open, meaningful in their design and the activities and behaviour they support, and provide a sense of safety, comfort and pleasure.3,8 Electric lighting may support function and amenity 9 and encourage use after dark.8,10
This paper specifically concerns local public squares i.e. squares that constitute users’ everyday life spaces in their respective neighbourhood (hereafter referred to as ‘squares’).3,11 The square typically includes different functional zones such as paths to reach destinations and seating spaces for contemplation or socialisation. 12 The focus of the research presented here is on the movements and stationary activities 13 that occur in this specific physical setting in a given time frame i.e. behaviours with spatio-temporal patterns.14,15
Research on squares is multidisciplinary.16,17 Architects and urban designers have investigated the association between square attributes and their use.3,13,18–20 It has been shown that well-frequented squares are distinguished by having recognizable and comprehensive physical features, 19 which resonates with users’ needs not only for movement but also stationary activities, 3 by providing adequate seating, trees and favourable wind and light conditions.12,18
Scholars within the fields of public life studies and urban sociology have stressed the importance of defining how people use squares, and therefore employed methods for observing how users move and stay to participate in social activities.11,20–25 In squares with appropriate physical characteristics, user activities tend to grow in number, duration and scope. 13
Research on exterior electric lighting has largely focused on performance and requirements for urban infrastructure designed for transportation (roads, cycle and pedestrian paths). 10 The square is, however, intentionally designed to support social interaction in the local community.20,26 It needs to be experienced as a comfortable and safe place where one likes to stay and spend time, which requires an atmosphere for social interaction and associated stationary activities. Consequently, it is important to further the understanding of the role of electric lighting in squares that include functional zones designed with the intention to sustain user behaviour of movements and stationary activities after dark.
1.1 Framework for user behaviour in public squares
By adopting a transactional-contextual perspective on the human–environment behaviour relationship, we suggest that there is a dynamic interplay between people and their environmental setting. 15 This study focuses on the users’ operative mode i.e. observable behaviour, 27 operationalised as movements and stationary activities as depicted in Figure 1 25 and spatial use i.e. how behaviours relate to functional units of the square in daylight compared to after dark in electric lighting. User behaviour is viewed in its socio-physical and temporal context, 15 that in our case is a local public square set within the social realm of a neighbourhood and its associated behavioural patterns. Moreover, user behaviour is considered to be partly derived from the person’s environmental perception as guided by individual characteristics, past experiences and expectation. 28
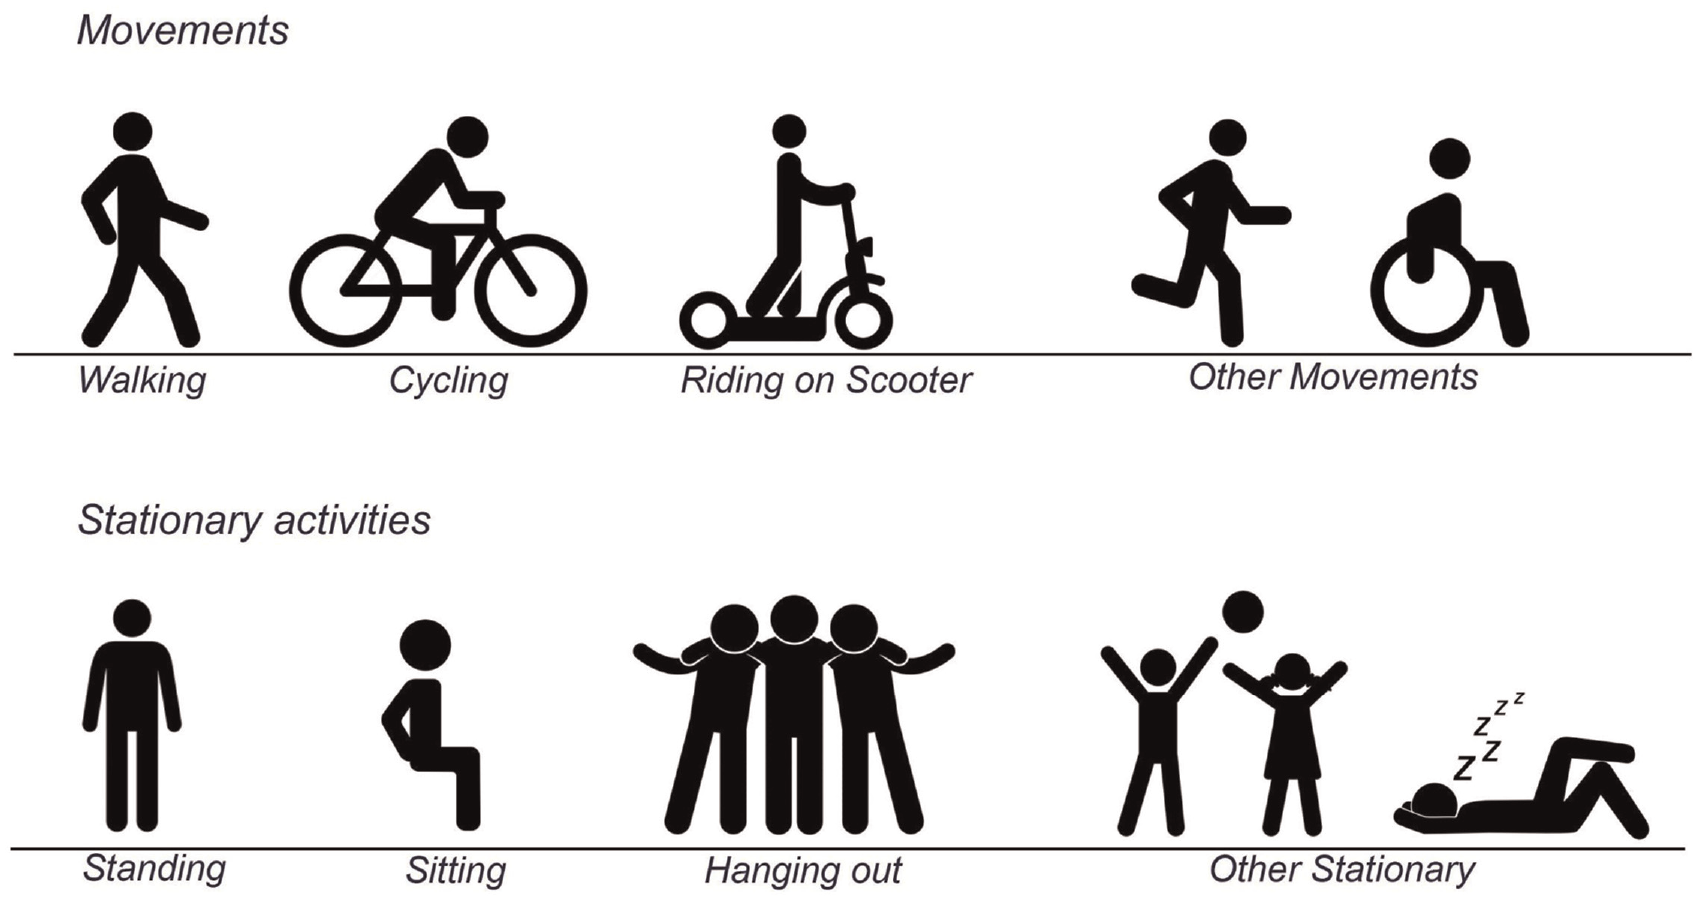
Pictograms, movements with the subcategories of behaviour (walking, cycling, riding on scooter and other movements), stationary activities with the subcategories of behaviour (standing, sitting, hanging out and other stationary)
Squares tend to have physical limits and characteristics that can impede or facilitate users’ behaviour. A behaviour such as taking a seat and chatting with a neighbour is affected by the physical opportunities that exist in the square, 15 as mediated by environmental perception, affective and cognitive processes; 29 for example, seats perceived to enable socially comfortable sitting on a sunny afternoon might affect tranquillity, excitement or pleasure and may therefore invite the user for participation. 18
We employ the typology of ‘necessary’ versus ‘optional’ activities, where stationary activities to a greater extent are optional in nature.25,30 Necessary activities are more-or-less compulsory (such as shopping for groceries), whereas optional activities are voluntary (such as taking a stroll or sitting sunbathing) and more likely influenced by physical conditions. 13 Whenever necessary and optional activities are given better conditions in a public space, social life is also indirectly supported. 13 Previous studies (which were performed in daytime) suggest that optional behaviours are largely dependent on the physical conditions, mediated by an appropriate design 21 and perceived affordances. 31 Where the user-experience is a ‘good’ one, people are more likely to stay. 8 User behaviour in terms of sustained movements and stationary activities, might however differ between daylight conditions and electric lighting.
1.2 Performance of a square after dark
The facilitation of user behaviour in squares is mediated by experiential factors such as the perceived access and linkage, activities and uses, comfort and sociability, amongst other factors. 12 Arguably, these factors are as important in daylight as after dark, but for several reasons such experiential factors may differ between daylight and electric light. The perception and appreciation of a space in daylight, which typically implies photopic conditions of vision, allows for both colour vision and fine resolution. Critical characteristics of daylight include variability in illuminance (ranging from about 1000 lx to 100 000 lx), variability in cloud cover (from completely overcast to clear skies, changing with latitude, season and time of day) and solar geometry, and hence variability in the directionality, varying correlated colour temperature (CCT), and spatial distribution. 32 After the sun sets, the portrayal of spatial properties alters. In electric light, illuminances are much lower, meaning that the visual system operates in mesopic conditions with reduced colour vision and resolution. 32 Temporal variation in directionality and spatial distribution are largely absent. Therefore, features in a space such as trees, sculptures as well as features of people, will be differently modelled between daylight and electric light, and between electric lighting designs of different after-dark uniformity. Thus, the way users perceive, interpret and behave in a square after dark may be influenced by the design choices for electric lighting. 33
A discrepancy in users’ perception, and thus experiential factors, between daylight and electric light may have different consequences to the performance of spaces designed for movements as compared to spaces designed for stationary activities. Footpaths have been systematically examined with regard to pedestrians’ movement,10,34 and their ability to move safely is essentially a matter of visual performance involving the visual tasks of orientation, obstacle detection and facial recognition.35–37 Walkability36,38 and reassurance i.e. the confidence a pedestrian might gain from lighting when walking along a footpath after dark,39–45 is a prerequisite for access and linkages and thus for the potential use of a square. 12 A hierarchical order has been proposed with appraisals of feasibility, accessibility and safety (or reassurance) as fundamental to walking, and comfort and pleasure as facilitating walking.38,46
Stationary activities are likely to be more dependent on the portrayal of space and perceived affordances.31,47 Light has emotional connotations, 48 and therefore the role of lighting in spaces programmed for stationary activities in a square is also to enhance a comfortable and pleasurable atmosphere.9,49 Changes in light distribution, light level, contrast, uniformity and spectral power distribution will affect spatial brightness50–54 and appreciation of the scene.9,53,55–57 In directing the eye and providing brightness transitions through the space, 58 by revealing shape, texture and colour, the atmosphere of a space is generated.59,60 So far, preference assessments of 3D-visualisations have demonstrated that the appeal of squares after dark is associated with different lighting modes.61,62 Thus, lighting may present a powerful tool to enhance also areas programmed for stationary activities and thereby vitalize squares.8,10
1.3 Aim
The aim of this study is to investigate user behaviour and spatial use in two local public squares, each having a different lighting installation, and to assess if these behaviours change when the squares are lit by daylight as compared to electric lighting. To offset other factors, this comparison is made for the same times of day using the biannual daylight savings clock change.
The objectives are:
To describe the types and the occurrences of movements and stationary activities in local public squares in daylight compared to after dark with electric lighting.
To compare the spatial use across different functional zones in local public squares.
To test if any change in movements and stationary activities can be attributed to the effect of change in ambient light.
2. Method
2.1 Observations
Structured observations 63 of users were carried out at two local public squares in different neighbourhood centres in Malmö, Sweden. Observations were performed with a scan-sampling technique 64 recording cases consisting of both events (e.g. a sequence of a movement and a stationary activity such as a male adult is walking and takes a seat) and states (e.g. a stationary activity such as an elderly female is sitting), as shown in Figure 2. During sampling, users were visually classified by apparent gender and by apparent age into four different approximate age groups: children (0–12 years), teens (13–19 years), adults (20–60 years) and elderly (above 60 years). Observations were reported in a coding scheme, which employed predefined types of behaviour in two main categories: movements and stationary activities, which were inspired by behaviour previously identified in the area of public life studies. 25 A pilot study was carried out over a 2-week period in late summer 2020, to confirm which type of behaviours take place at the specific squares. This pilot study suggested that the coding scheme was sufficient to characterise all movements and stationary activities observed in the squares.
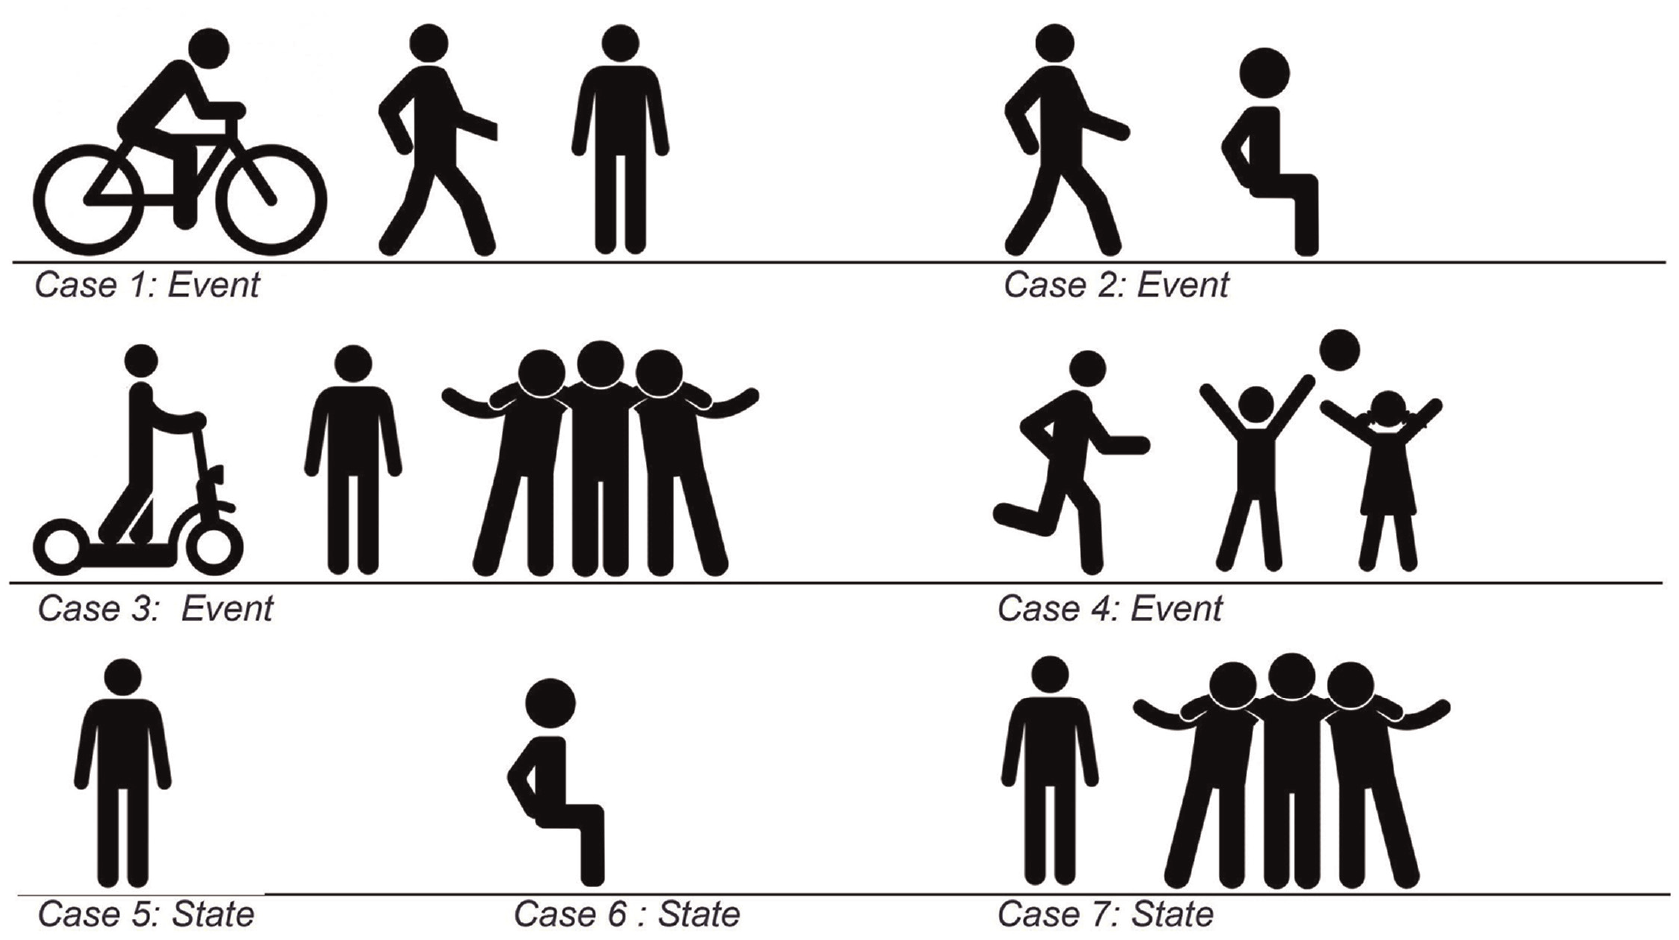
Pictograms of examples of cases illustrating the scan-sampling technique with different type of events (instantaneous sequence of behaviours) and states (a behaviour of appreciable duration). Case 1 – a person is cycling then walking and then standing; Case 2 – a person is walking and takes a seat; Case 3 – a person arrives with a scooter then stands and hansgout; Case 4 – a person is running and thereafter playing; Case 5 – a person is standing; Case 6 – a person is sitting; Case 7 – a person is standing and hanging out
The coding scheme, as shown in Figure 1, consists of binary categorical data on types of movements including walking, cycling, riding on scooter and other movements and types of stationary activities comprising standing, sitting, hanging out and other stationary. To hang out was defined as ‘to spend time idly, relaxing or socializing’ with another. 65 To test inter-observer reliability the coding scheme was tested in field, revised and verified again by three observers.
2.2 Data collection
Data were collected during two weeks before and two weeks after the autumn 2020 daylight savings clock change, to enable a comparison of activity in daylight and after dark for the same times of the day. Time-of-day factor and seasonal factors where thus held sufficiently constant to isolate the effect of change in ambient light level. 66 In each of the data collection periods, observations were carried out on six days; distributed over two weekdays and one weekend-day per square. Each day included two observation sessions, each of these consisted of two timeslots with a duration of 45 min (Figure 3). Timeslots 1 and 2 took place in the afternoon at 15:30–16:15 and 16:15–17:00 and timeslots 3 and 4 took place in the early evening at 17:30–18:15 and 18:15–19:00. Observations were conducted for 18 h within each square.
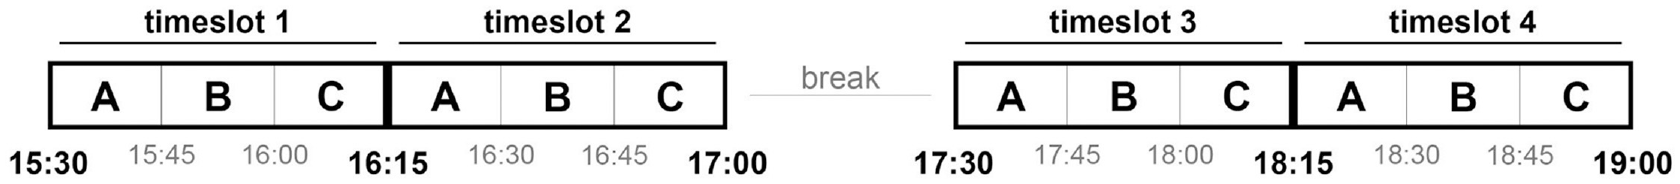
Data collection procedure during a day. Each timeslot includes 15 min in each sampling unit
The squares were divided by the observer (author VKRH) into three sampling units (zones A, B and C) on the basis of its intended function (its programmed design3,67) and spatial setting. In each square, zone A is a designated social area for stationary activities, B is a combined commercial area and path and C is a designated path (Figures 4 and 5). The sampling units covered the whole of each square. Each observation session started in zone A, with a rotation between zones taking place every 15 min, allowing for six rotations in 90 min. The recording also noted the conditions in which observations were made; air-temperature, precipitation, vegetation, sky-condition and whether lights were switched on or off.
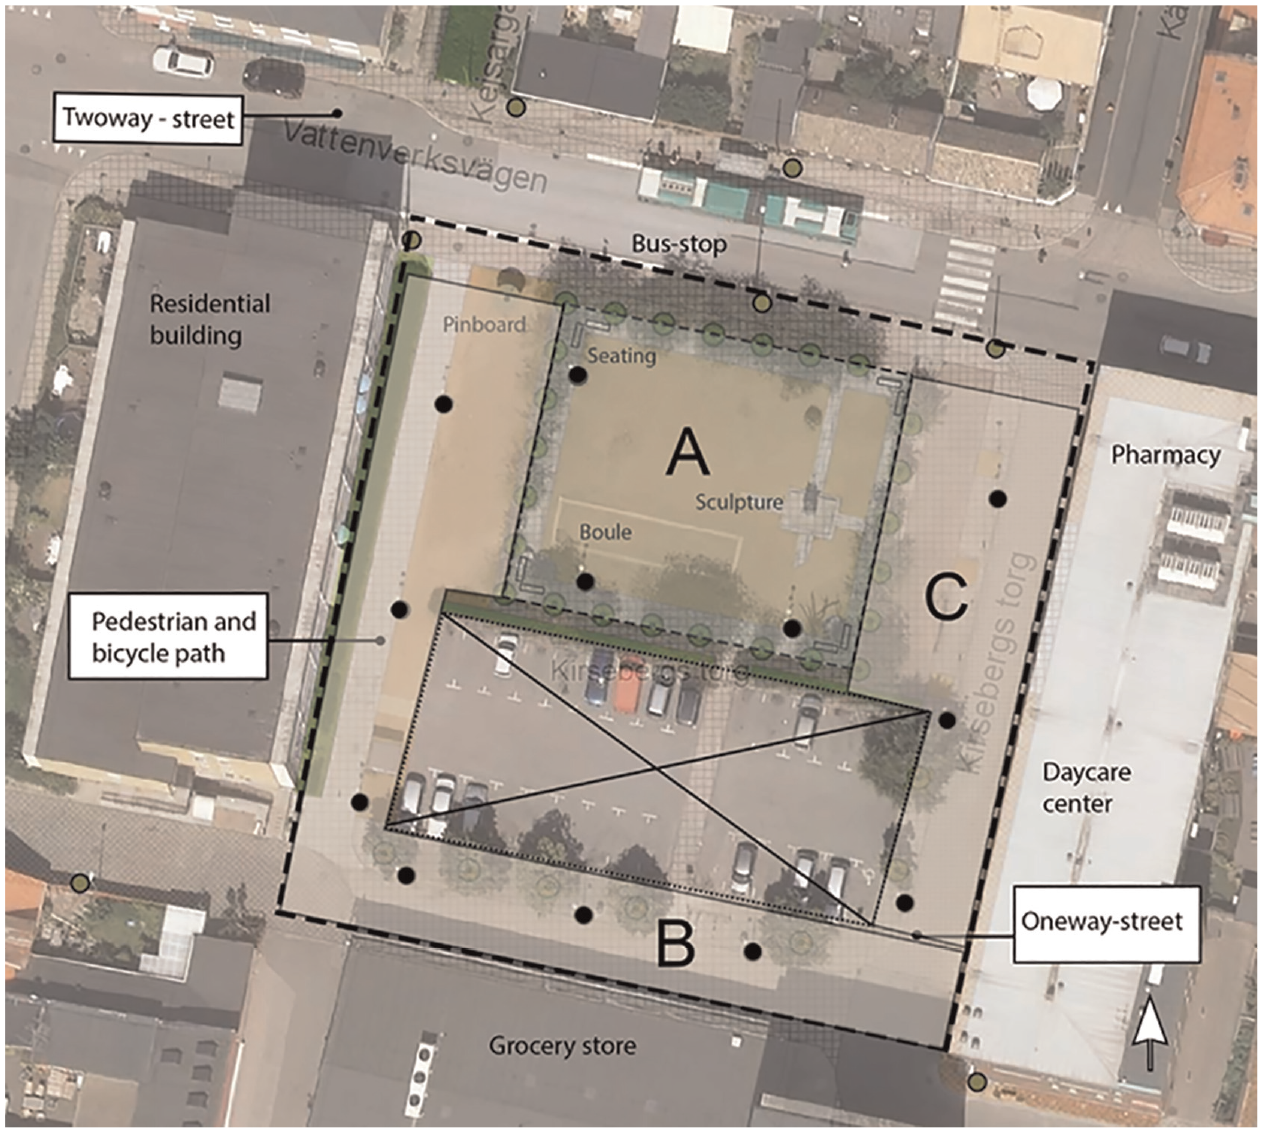
Plan of Kirseberg square. Sampling units (zones) are indicated with A, B and C. Black dots symbolize lamp posts
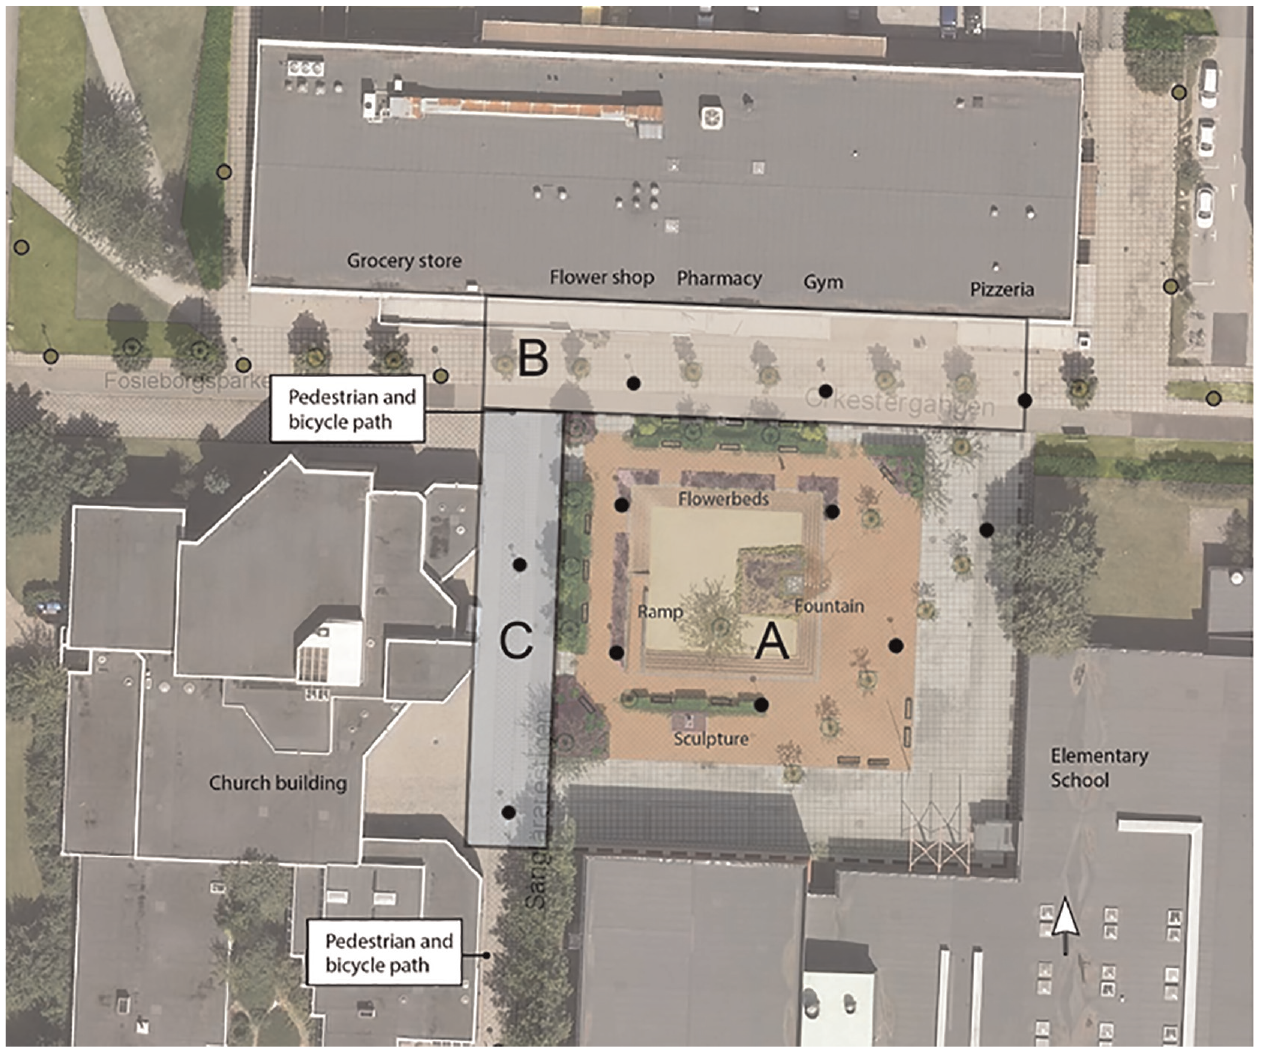
Plan of Lindeborg square. Sampling units (zones) are indicated with A, B and C. Black dots symbolize lamp posts
2.3 Settings
The two squares in which observations were conducted both serve as a central area of their respective neighbourhoods of Kirseberg and Lindeborg and are of similar size (surface area) and include similar spatial zones with programmed design for movements and stationary activities. However, the lighting installations are not similar, having differences in the spatial light distribution, illuminance uniformity, contrasts and spectral characteristics as defined using CCT, the CIE general colour rendering index (CRI) and the Scotopic/Photopic (S/P) luminance ratio. The two squares and the lighting installations are further described below.
2.3.1 Kirseberg square
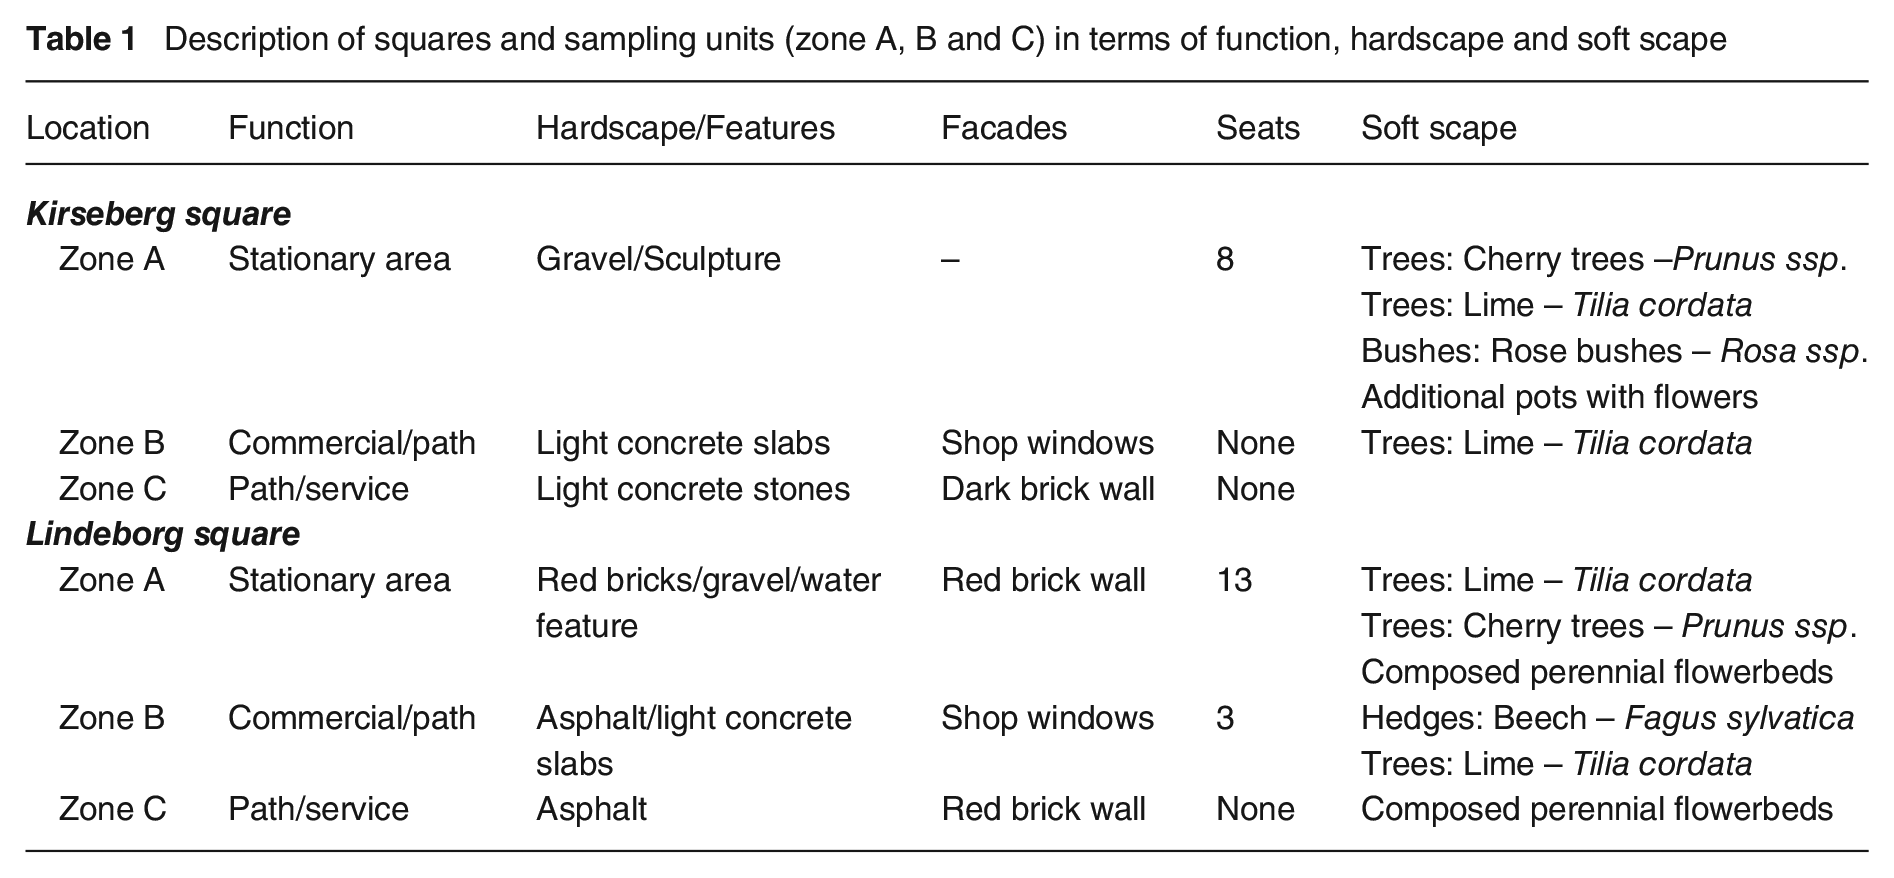
Kirseberg in northern Malmö, Sweden, has approximately 6000 inhabitants. The square, described in Figure 4 and Table 1, has an area of approximately 3100 m2. It has a parking area to the south, an area for stationary occupancy of approximately 700 m2 to the north (zone A), with a boule court, a sculpture, two benches in each corner and soft-scape of trees and bushes. A pedestrian route runs along the commercial area and along the west side (zone B). Motorised vehicles, limited to a one-way direction, are mixed with pedestrians and cyclists in the east (zone C). The enclosing buildings were constructed in the 1960s. 68 A residential building flanks the west side. Services available within the square are a children’s day care, a pharmacy and a food chain store.
Description of squares and sampling units (zone A, B and C) in terms of function, hardscape and soft scape
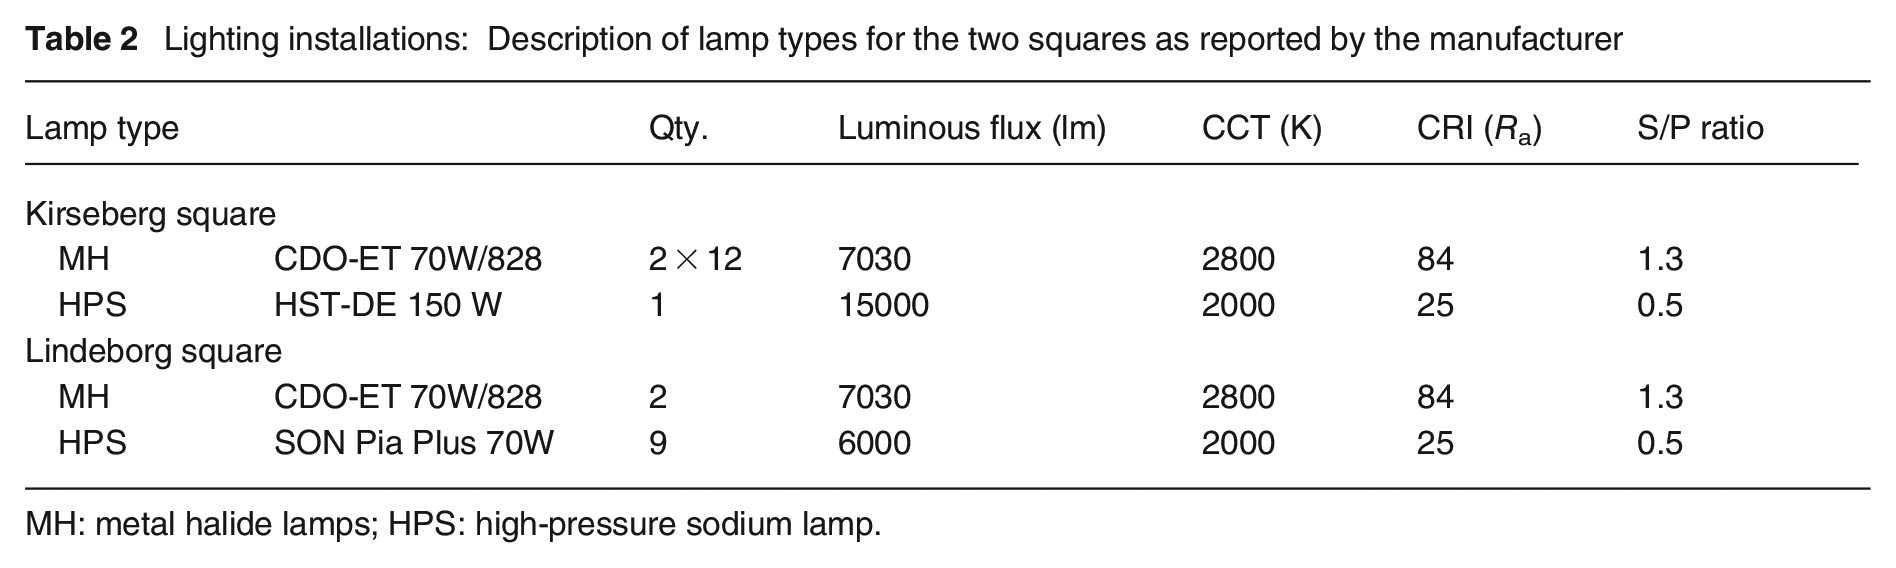
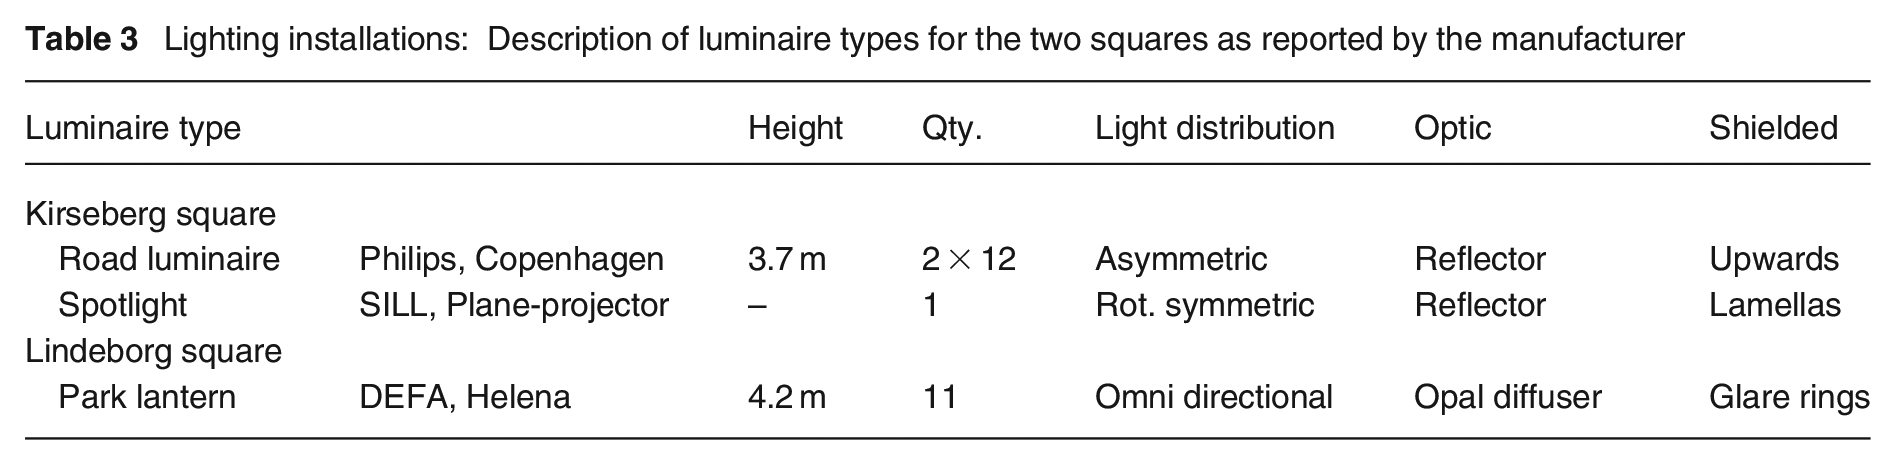
Kirseberg square has 12 lamp posts, 3.7 m high: the locations are shown in Figure 4. Double reflector-luminaires with asymmetric light distribution are fitted with 2 × 70 W metal halide lamps (MH). The sculpture in zone A is lit with a spotlight with a 150 W, high-pressure sodium lamp (HPS). Shop-windows in zones B and C contribute to illumination in these areas. Windows in the residential building give a lit impression to the vertical surface. Lamp and luminaire types are shown in Tables 2 and 3. The lighting installation layout is shown in Supplemental Figure S1.
Lighting installations: Description of lamp types for the two squares as reported by the manufacturer
MH: metal halide lamps; HPS: high-pressure sodium lamp.
Lighting installations: Description of luminaire types for the two squares as reported by the manufacturer
2.3.2 Lindeborg square
Lindeborg in southern Malmö has approximately 5000 inhabitants. 69 The square, described in Figure 5 and Table 1, has an area of approximately 3100 m2. The designated area for stationary occupancy is approximately 1300 m2 (zone A). The soft-scape includes trees, hedges and flowerbeds, seating and a water-feature. A pedestrian and bicycle path runs along the north with access to the commercial building (zone B). There is also a pedestrian and bicycle path along the west side (zone C). The neighbourhood centre was constructed in the 1970s and hosts different commercial services, an elementary school and a church. 70
Lindeborg square has 11 lamp posts, 4.2 m high, located as shown in Figure 5, spaced at a distance of 20 m along the paths in B and C and in an arrangement to accompany the flowerbeds and seating in zone A. The lanterns are omnidirectional with opal diffusers and fitted with 70 W, HPS. The light setting in Lindeborg results in a visual scene with warm ambiance, poor colour rendering and a diffuse light distribution in zones A and B. The path in zone C is lit with MH lamps, which gives higher light levels and cooler appearance locally. The shop windows in zone B and linear fluorescent tubes cause substantial contrasts in the visual scene. Lamp and luminaire types are shown in Tables 2 and 3. The lighting installation layout is shown in Supplemental Figure S2.
2.4 Photometric assessment
A photometric assessment of the electric lighting scenario at each square was carried out as follows:
Horizontal illuminances were measured at ground level across the squares, with a grid size of 3 m × 3 m in compliance with SS-EN 12464-2:2014.
Horizontal illuminances were measured at ground level on designated footpaths in compliance with SS-EN 13201-3:2016.
High-dynamic range (HDR) images of visual scenes were captured for viewpoints assumed to be vital and converted into luminance maps calibrated against a luminance spot measurement using a diffusive cardboard placed in each of the viewpoints.
The instruments used for these three sets of measurements were a Hagner E4-X (Solna, Sweden) illuminance meter with SD2 external detector, a Hagner S4 (Solna, Sweden) luminance meter and a calibrated Techno Team LMK Canon EOS 550D HDR camera (Illmenau, Germany).
2.5 Data analysis
For each square, frequency analysis was used to establish the occurrence of different types of behaviour within the two behavioural categories movements and stationary activities and the distribution of behaviour across the three spatial units. These analyses are based on the total dataset i.e. all four timeslots, see Figure 3. Pearson’s chi-square test was performed to test for differences between:
Daylight (DL) or electric lighting (EL) within category of behaviour during all timeslots i.e. aggregated data for all observations.
Spatial use of the different zones i.e. to reveal if movements and stationary activities are related to the different functional zones.
The general level of significance was set to p ≤ 0.05. In analyses including multiple comparisons, the Bonferroni-corrected level of significance was used.
For each square, an odds ratio (OR) analysis was performed to investigate if changes in frequency of behaviours were associated with the change in ambient light before and after clock change. During each recorded observation, the status of EL (on–off) was noted. This information was used to filter the recorded observations, assuming ‘electric lighting off’ for observations in daylight and ‘electric lighting on’ for observations after dark. To ensure consistency in the dataset, the analysis included only timeslots where the totality of observations were either during daylight or after dark. These timeslots resulted to be the first 15:30–16:15 (control period, with daylight before and after clock change) and the third 17:30–18:15 (case period, with daylight before clock change but dark after clock change) (Figure 6).
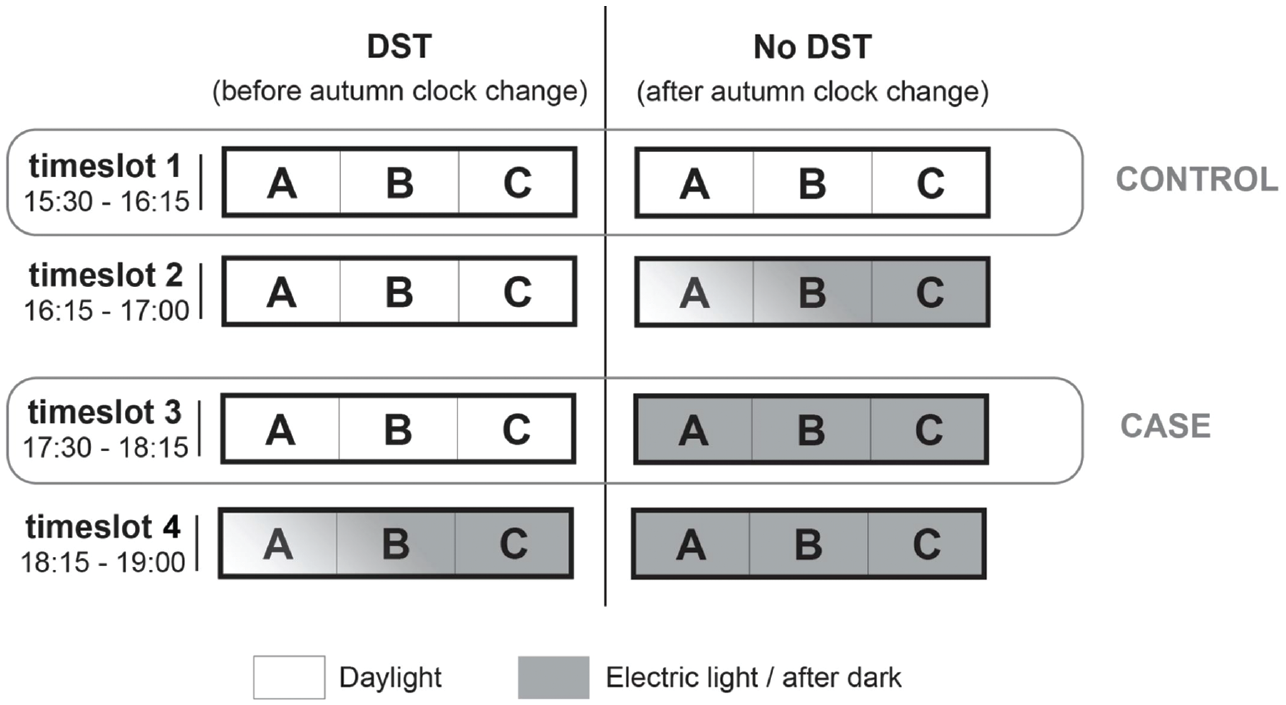
Selection of timeslots for the OR analyses.
The OR defined by Equation (1) was used to examine the effect of ambient light on the frequencies of occurrence for each specific category of behaviour. ORs higher than 1 indicate higher likelihood that a certain behaviour occurs in daylight rather than in electric light. An OR of 1.0 indicates no difference in frequency of behaviour between daylight and electric light.
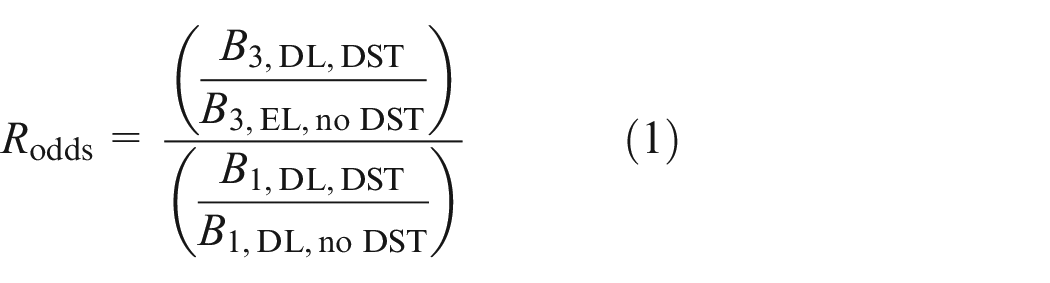
where B1 is the frequency of behaviour in timeslot 1 and B3 is the frequency of behaviour in timeslot 3 and the other subscripts DL, EL, daylight saving time (DST) and no DST are as already defined.
The 95% confidence intervals were calculated using Equation (2).
where the standard error (SE) of the log OR is defined as being:
3. Results
3.1 Photometric assessment
3.1.1 Kirseberg square
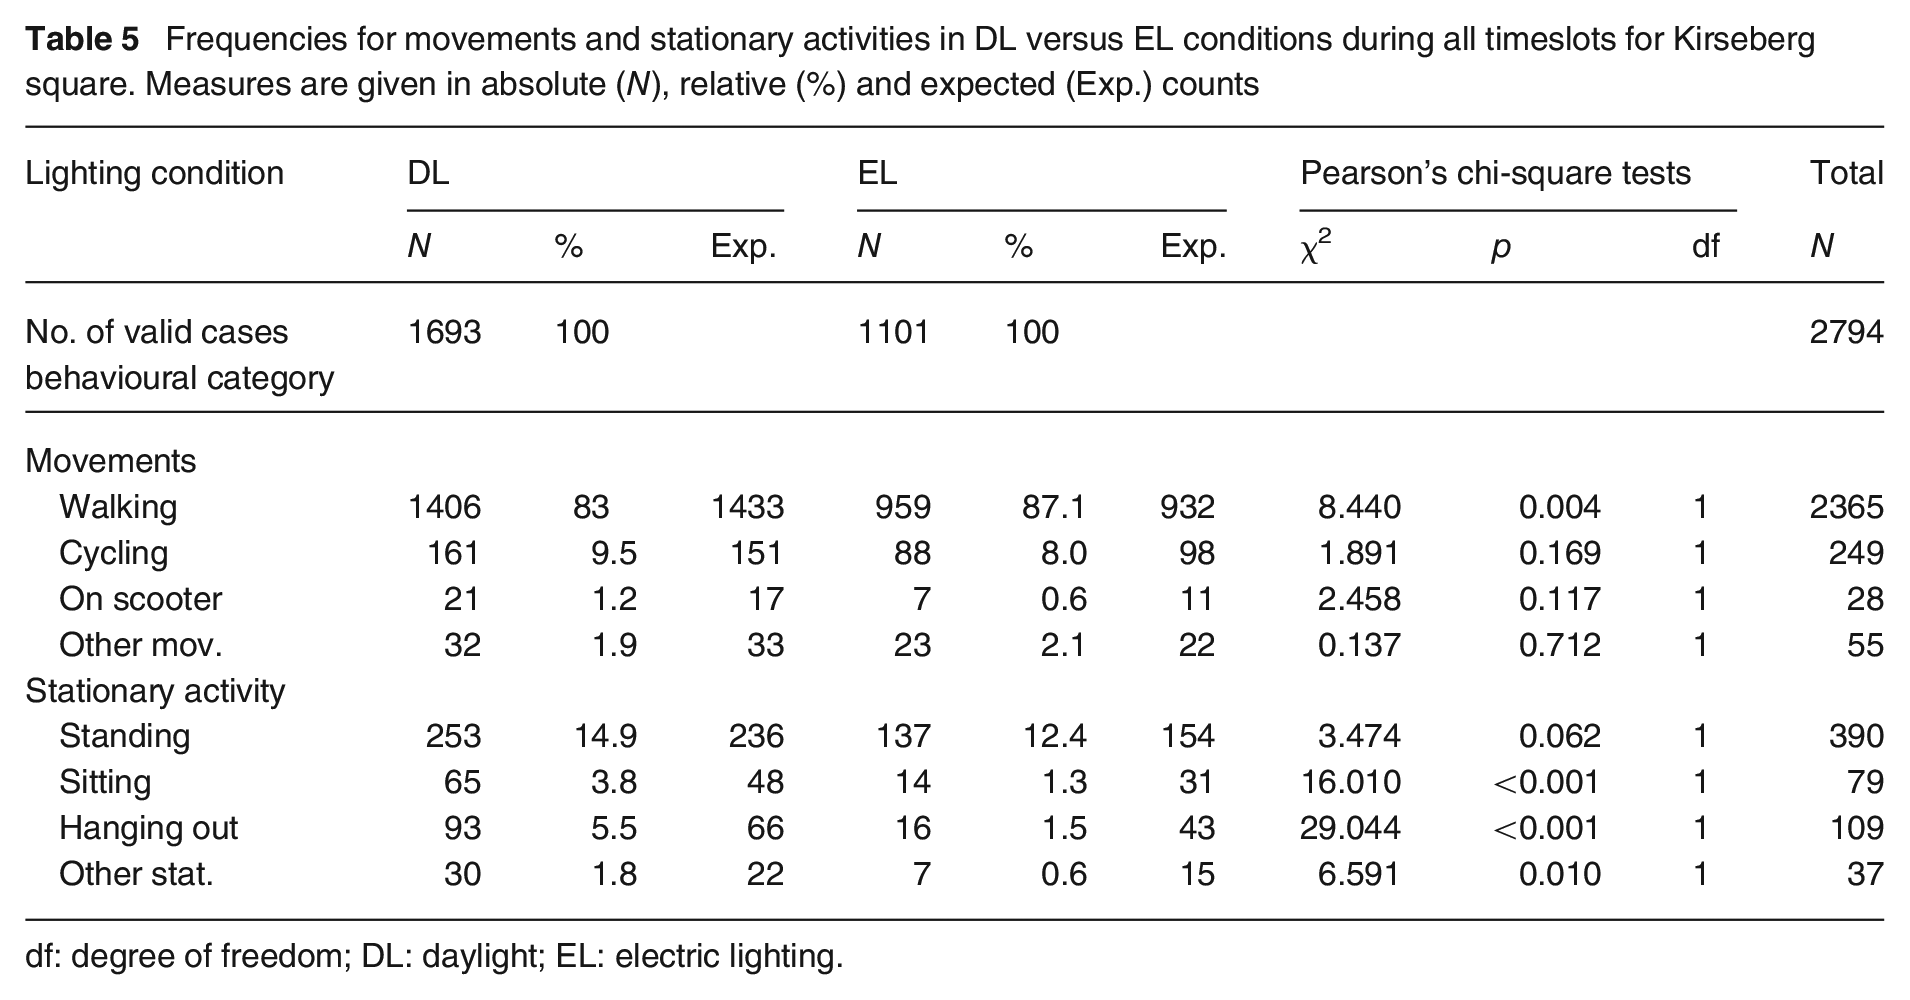
Horizontal illuminances across Kirseberg square, shown in Table 4, have an average of Ē = 23.4 lx and a uniformity of Uo = 0.03. The paths in zone B and zone C, Figure 7, have illuminance levels above required average maintained levels of class P1, in SS-EN 13201-2:2016, for pedestrians and cyclists. However, uniformity levels are lower than recommended (the average illuminance exceeds 1.5 times the minimum) for this class.
Measurements of horizontal illuminance at ground level and uniformity of illuminance
Uo lower than the recommended value in SS-EN 13201-2:2016.
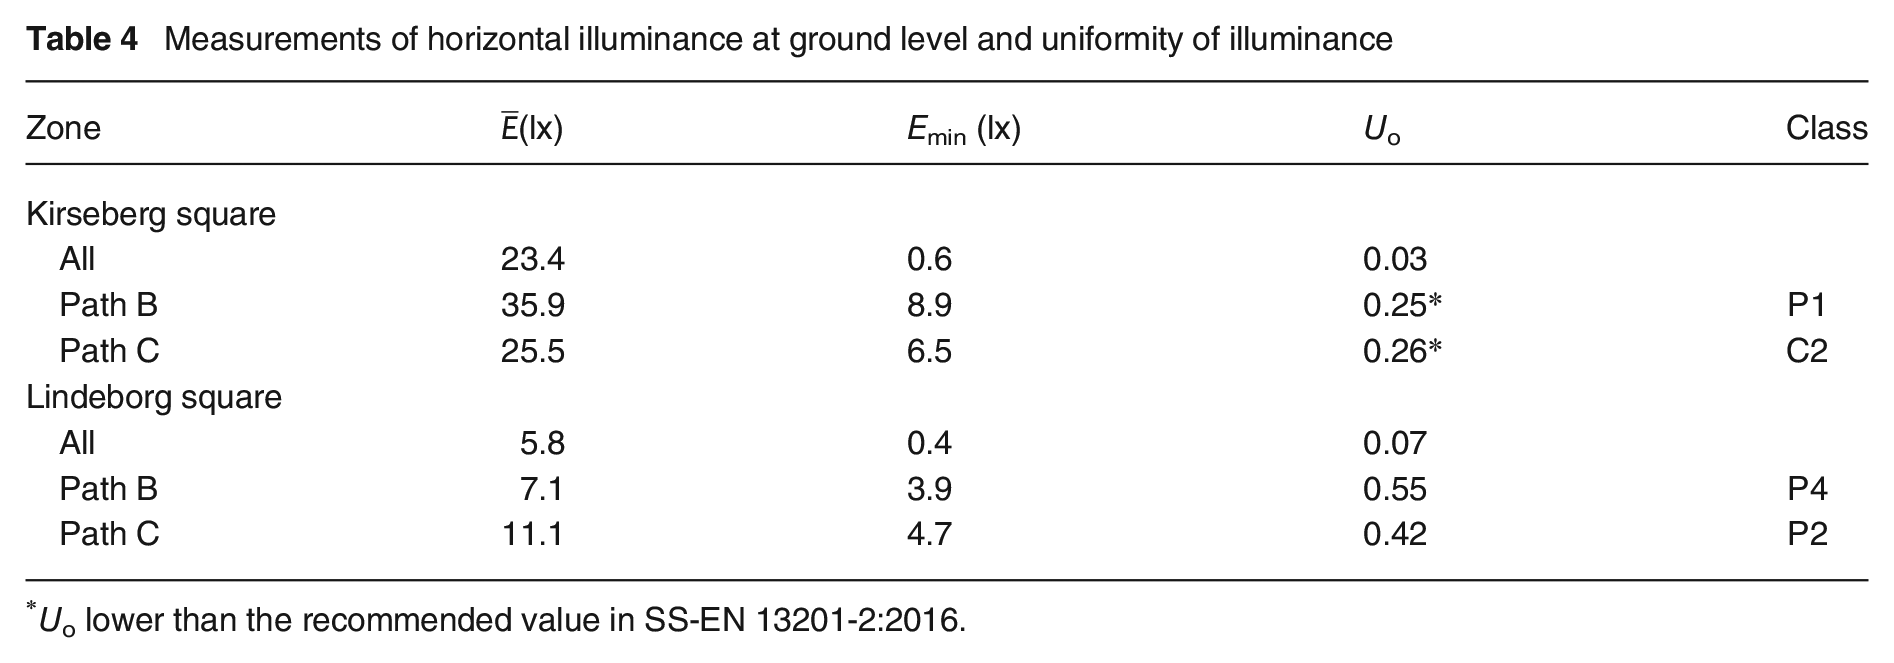
Kirseberg square – HDR images with corresponding luminance maps for zones A, B and C. From the top: zone A, zone B in the commercial area, zone B path and zone C path
Luminance maps for zones at Kirseberg square portray large contrasts on the ground level in zone A, with luminance ranging from 0.1 cd/m2 to 20 cd/m2, but less contrasts in zone B and zone C, Figure 7.
3.1.2 Lindeborg square
Measurements of horizontal illuminances across Lindeborg square, shown in Table 4, have an average of Ē = 5.8 lx and a uniformity of Uo = 0.07. In comparison, lighting levels are substantially lower than Kirseberg square. Contrasts between bright and dark areas are less evident at the horizontal ground level. The horizontal illuminance levels and uniformity on paths in zone B and zone C, comply with P2 and P4 classes in SS-EN 13201-2:2016.
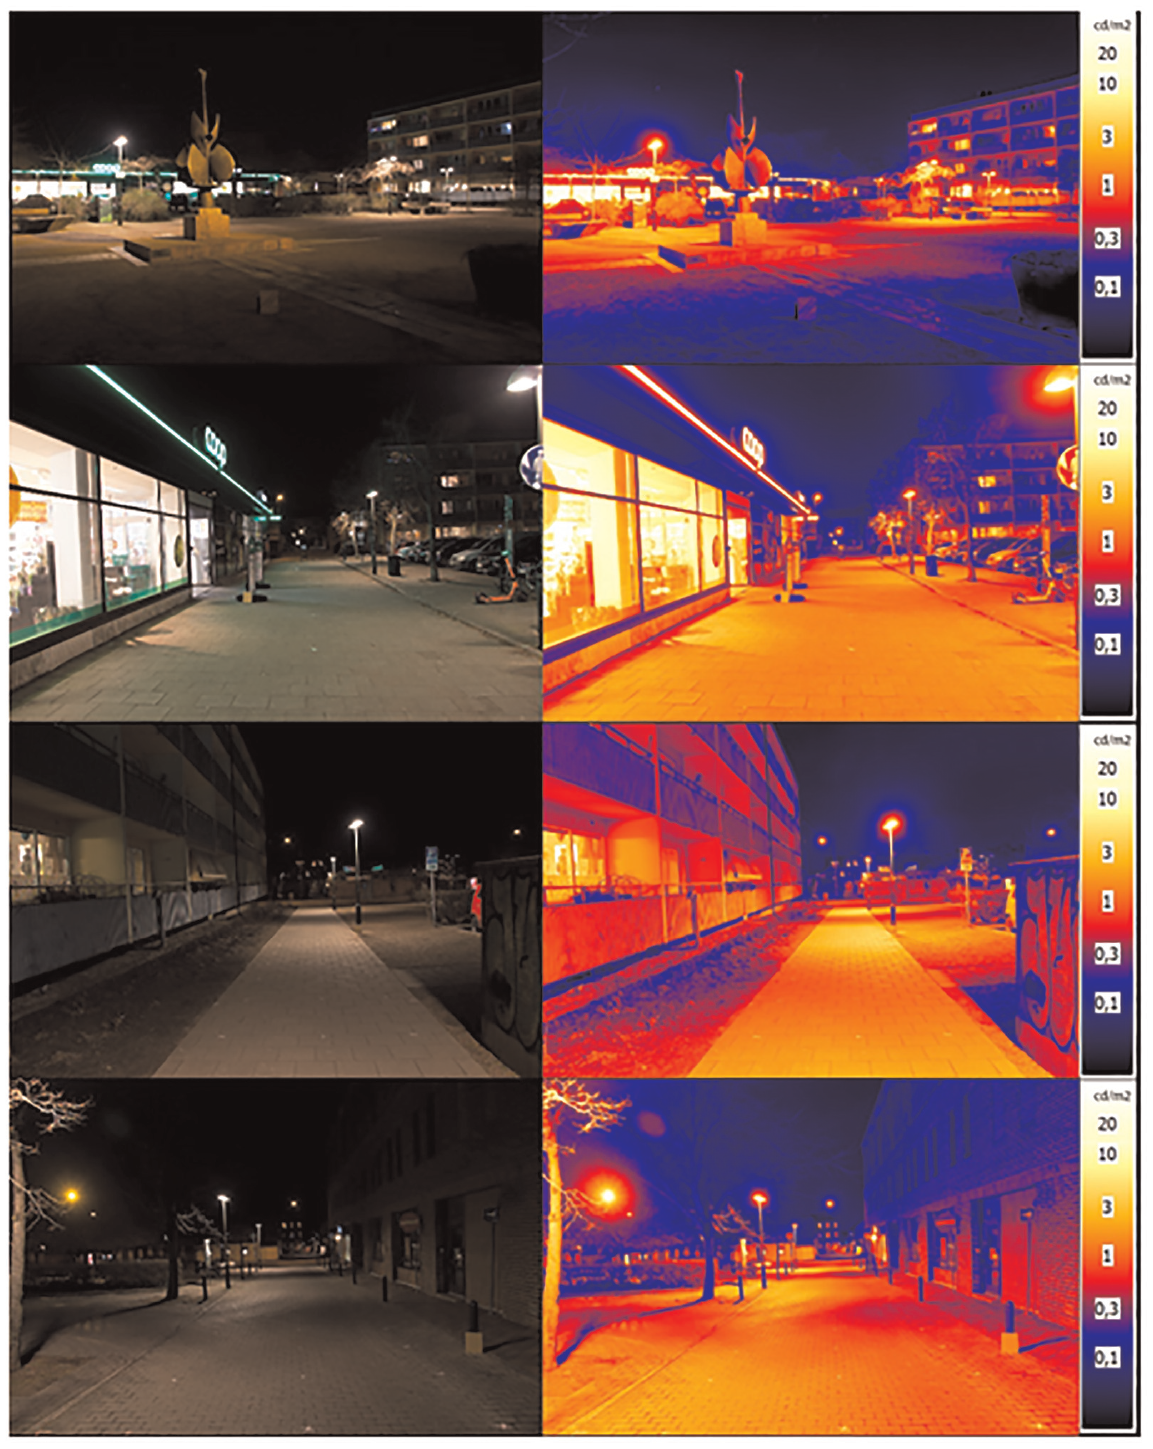
Luminance maps depict a visual scene in zones A and B with diffuse light distribution from the lanterns, poor modelling of hedges, curb stones and objects, poor colour rendering due to HPS lamps resulting in distorted colours of plant materials, Figure 8. In zone C, the MH lamps give a cooler temperature and grey depiction of concrete slabs and asphalt, Figure 8.
Lindeborg square – HDR images with corresponding luminance maps for zones A to C. From the top: zone A, zone B and zone C
3.2 Behaviour in DL and in EL
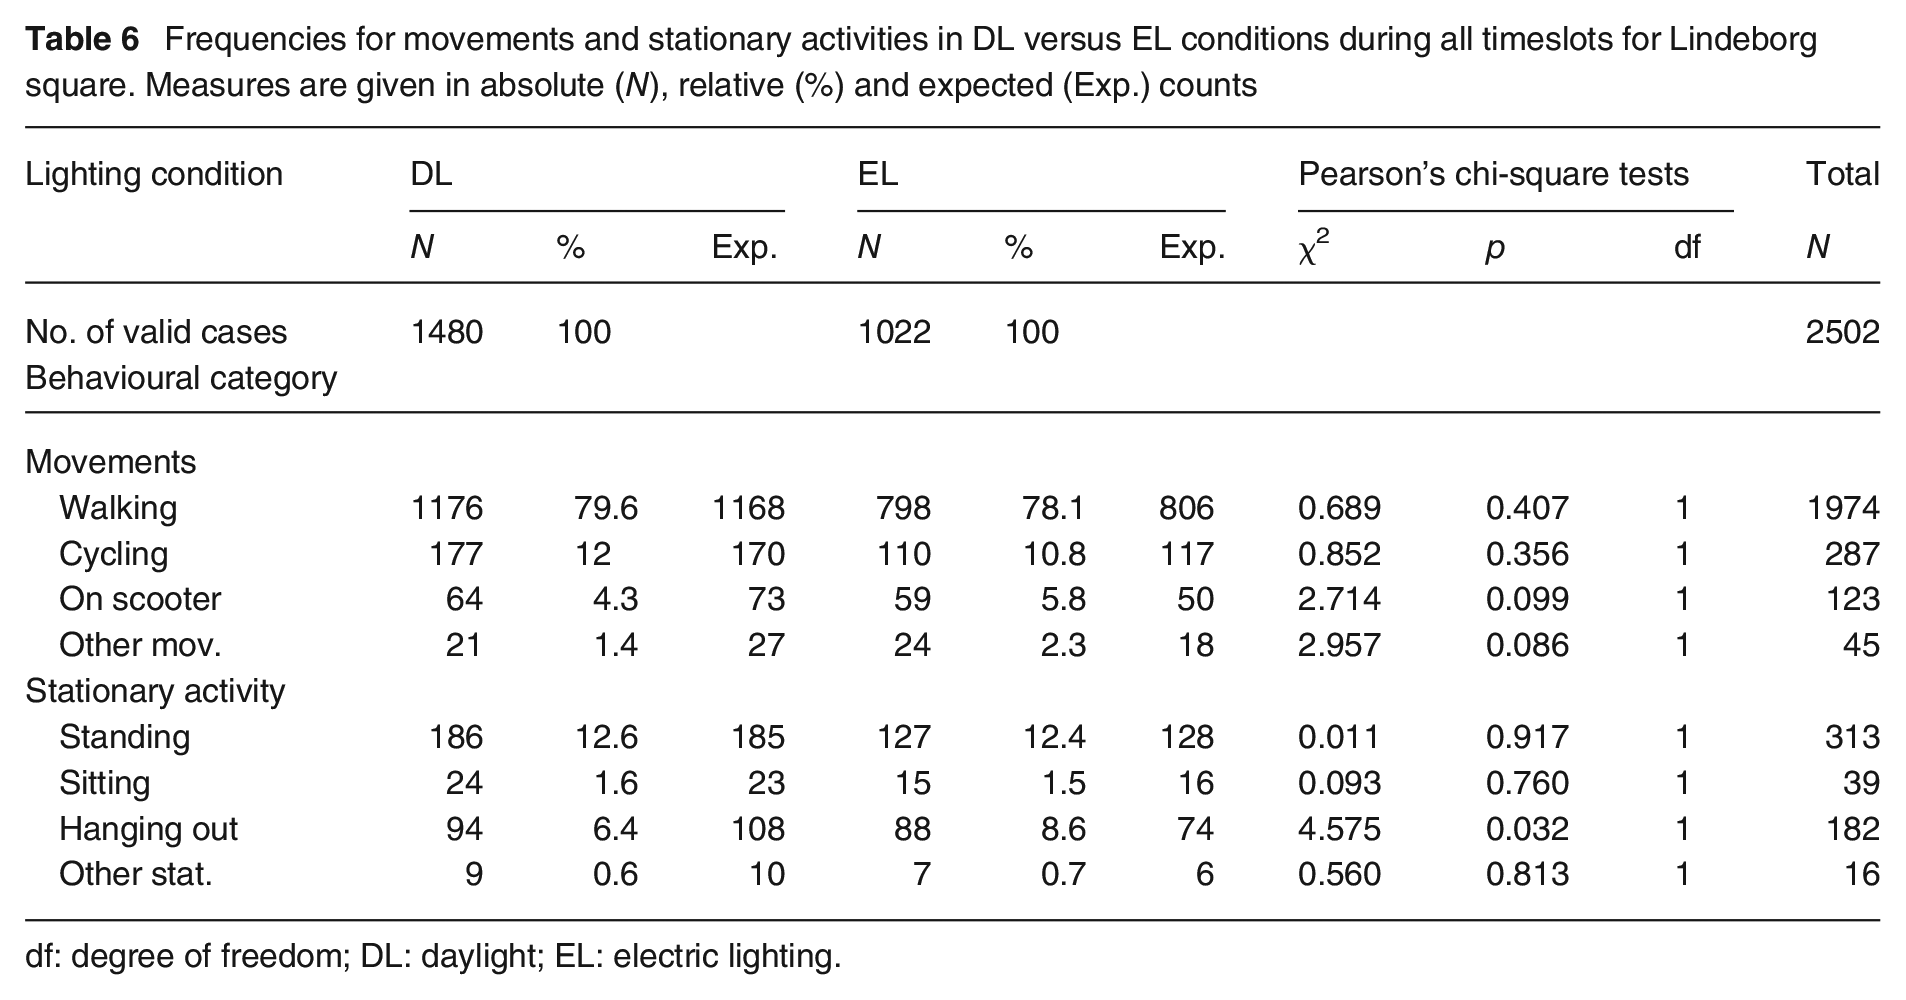
In total, 5296 observations were sampled at both squares. Tables 5 and 6 show the results of the frequency analysis and the results of Pearson’s chi-square tests for each type of behaviour within the categories, movements and stationary activities, in daylight compared to electric light during all timeslots for the squares. Walking was the most frequent type of movement observed in both squares. Kirseberg displayed higher rates of walking and sitting than Lindeborg. Cycling and riding on scooter were more frequent at Lindborg.
Frequencies for movements and stationary activities in DL versus EL conditions during all timeslots for Kirseberg square. Measures are given in absolute (N), relative (%) and expected (Exp.) counts
df: degree of freedom; DL: daylight; EL: electric lighting.
Frequencies for movements and stationary activities in DL versus EL conditions during all timeslots for Lindeborg square. Measures are given in absolute (N), relative (%) and expected (Exp.) counts
df: degree of freedom; DL: daylight; EL: electric lighting.
The Pearson’s chi-square results for Kirseberg square suggest a significant increase in walking (χ2 (1, N = 2365) = 8.44, p = 0.004), and significant decreases in the stationary activities; sitting (χ2 (1, N = 79) = 16.01, p < 0.001) and hanging-out (χ2 (1, N = 109) = 29.04, p < 0.001) in EL compared to DL.
The Pearson’s chi-square results for Lindeborg square display no significant differences in any of the movement types, however an increase in the stationary activity hanging-out (χ2 (1, N = 182) = 4.58, p = 0.032) in EL compared to DL.
3.3 Spatial use in functional zones
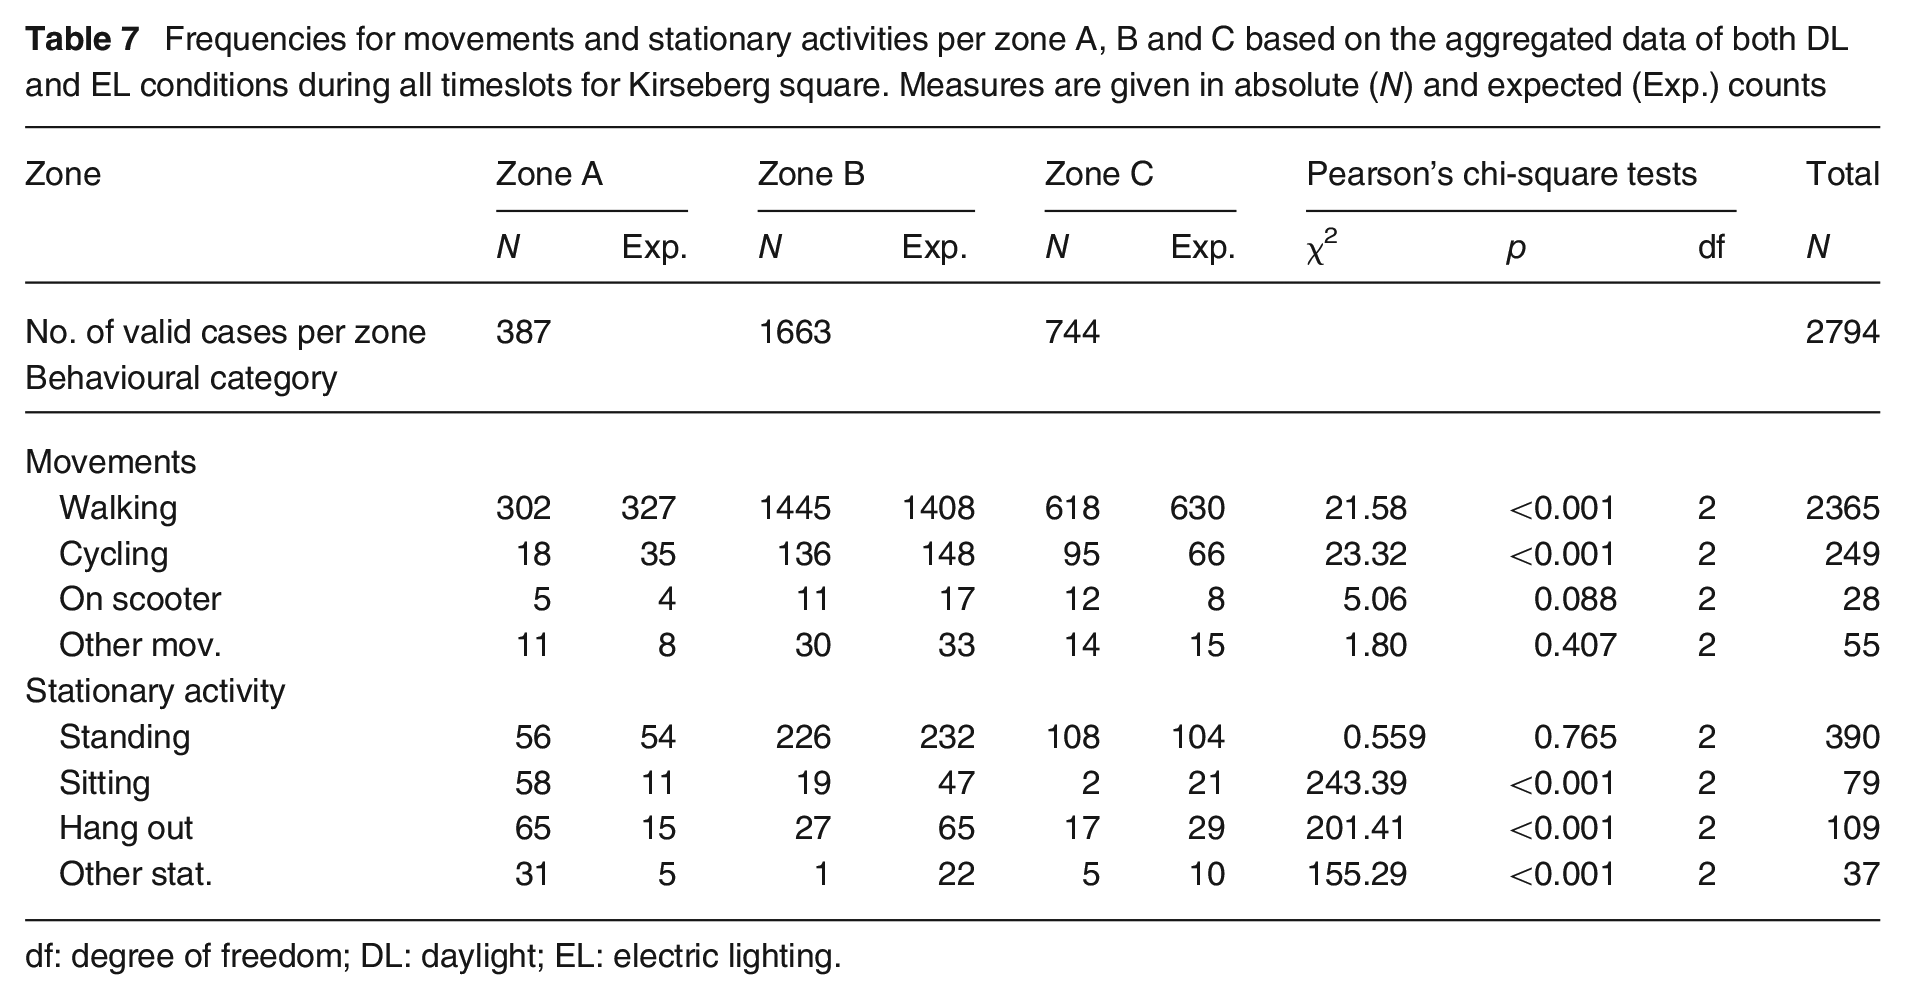
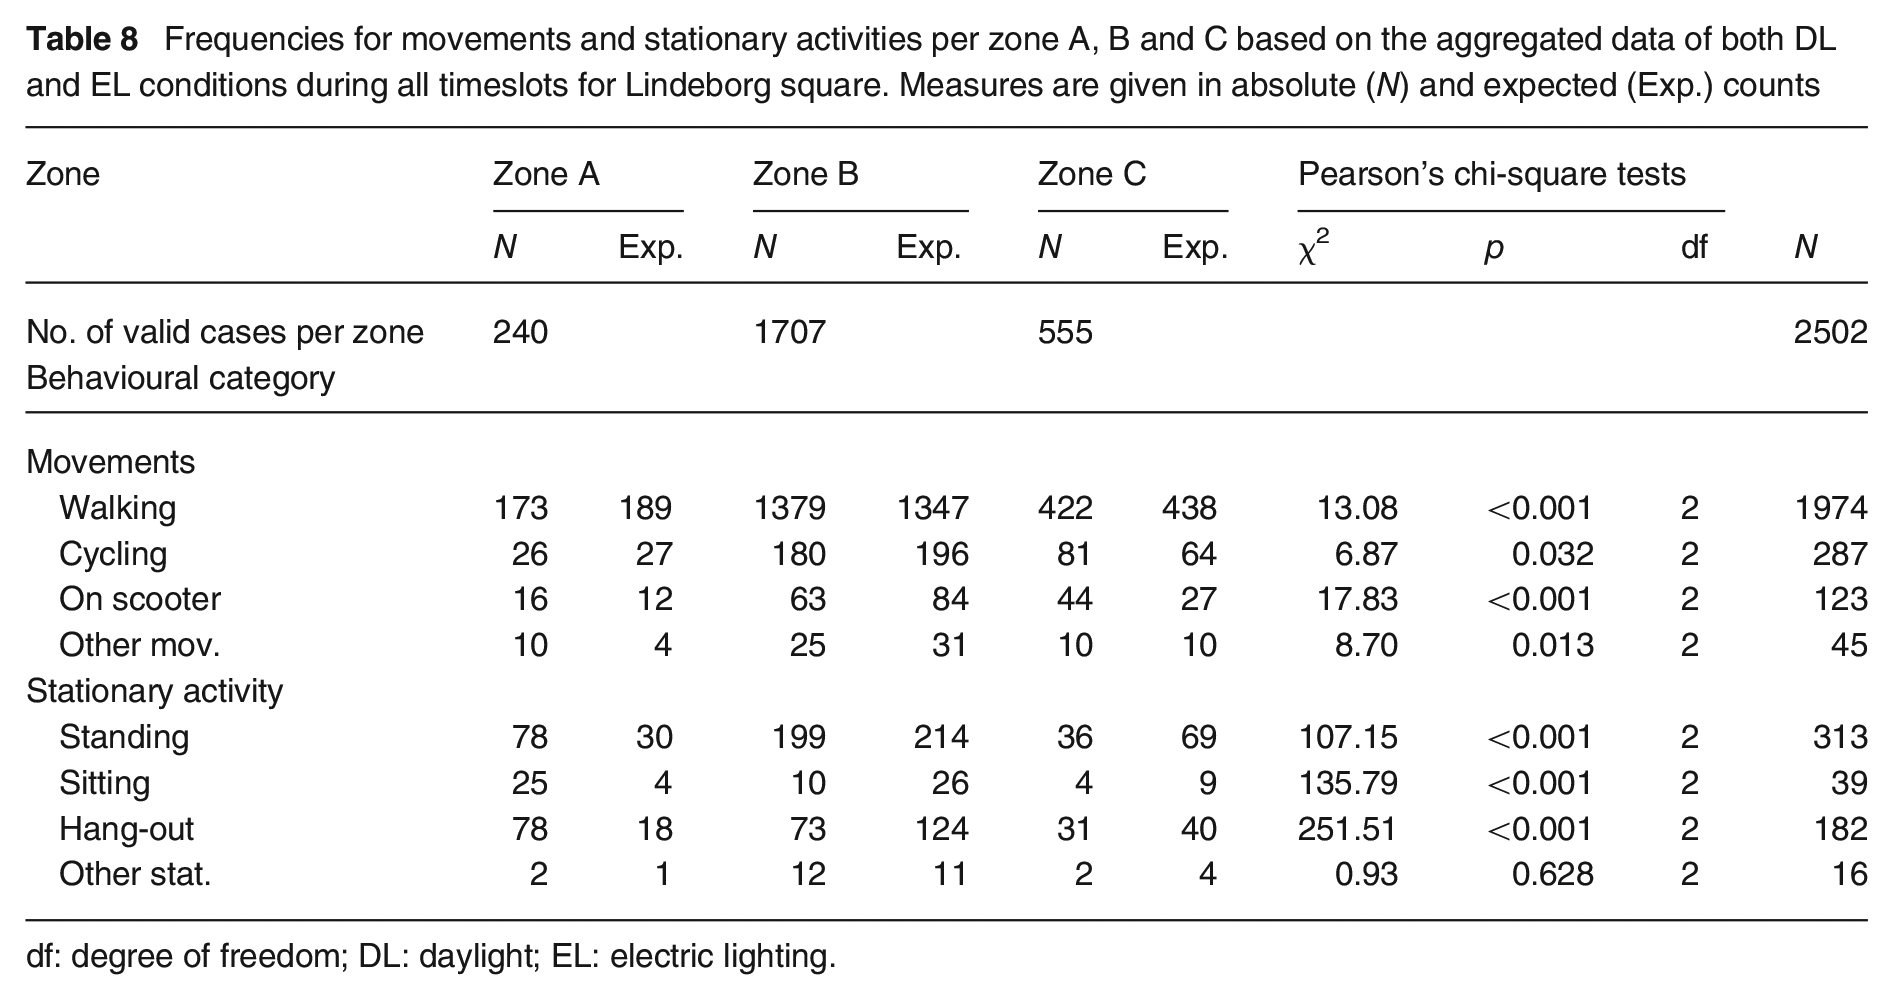
Tables 7 and 8 show the results of the frequency analysis and the results of Pearson’s chi-square tests for each type of behaviour within the categories, movements and stationary activities, between the functional zones (A, B and C).
Frequencies for movements and stationary activities per zone A, B and C based on the aggregated data of both DL and EL conditions during all timeslots for Kirseberg square. Measures are given in absolute (N) and expected (Exp.) counts
df: degree of freedom; DL: daylight; EL: electric lighting.
Frequencies for movements and stationary activities per zone A, B and C based on the aggregated data of both DL and EL conditions during all timeslots for Lindeborg square. Measures are given in absolute (N) and expected (Exp.) counts
df: degree of freedom; DL: daylight; EL: electric lighting.
Analyses are based on all timeslots in both lighting conditions. Results confirm significant difference in spatial use in the zones. In both squares more of the stationary activities, sitting and hanging-out, takes place in zone A than in zones B and C; Kirseberg square: sitting (χ2 (2, N = 79) = 243.39, p < 0.001), hanging-out (χ2 (2, N = 109) = 201.41, p < 0.001). Lindeborg square: sitting (χ2 (2, N = 39) = 135.79, p < 0.001), hanging-out (χ2 (2, N = 182) = 251.51, p < 0.001). In both squares, most movements take place in zone B followed by zone C; Kirseberg square: walking (χ2 (2, N = 2365) = 21.58, p < 0.001) and cycling (χ2 (2, N = 249) = 23.32, p < 0.001). Lindeborg square: walking (χ2 (2, N = 1974) = 13.08, p < 0.001) and cycling (χ2 (2, N = 287) = 6.87, p = 0.032).
3.4 OR for behaviour types in DL and in EL
In total, 2887 observations were identified within the control periods (timeslot 1) and case periods (timeslot 3), used for the OR tests for differences in frequencies of movements and stationary activities in DL and in EL. Figure 9 shows a summary of ORs and associated 95% CI for behaviour types across all zones for both squares. Figure 10 shows ORs for the main behavioural categories movements and stationary activities for zone A. All ORs and 95% CI are shown in Supplemental Tables S1 and S2.
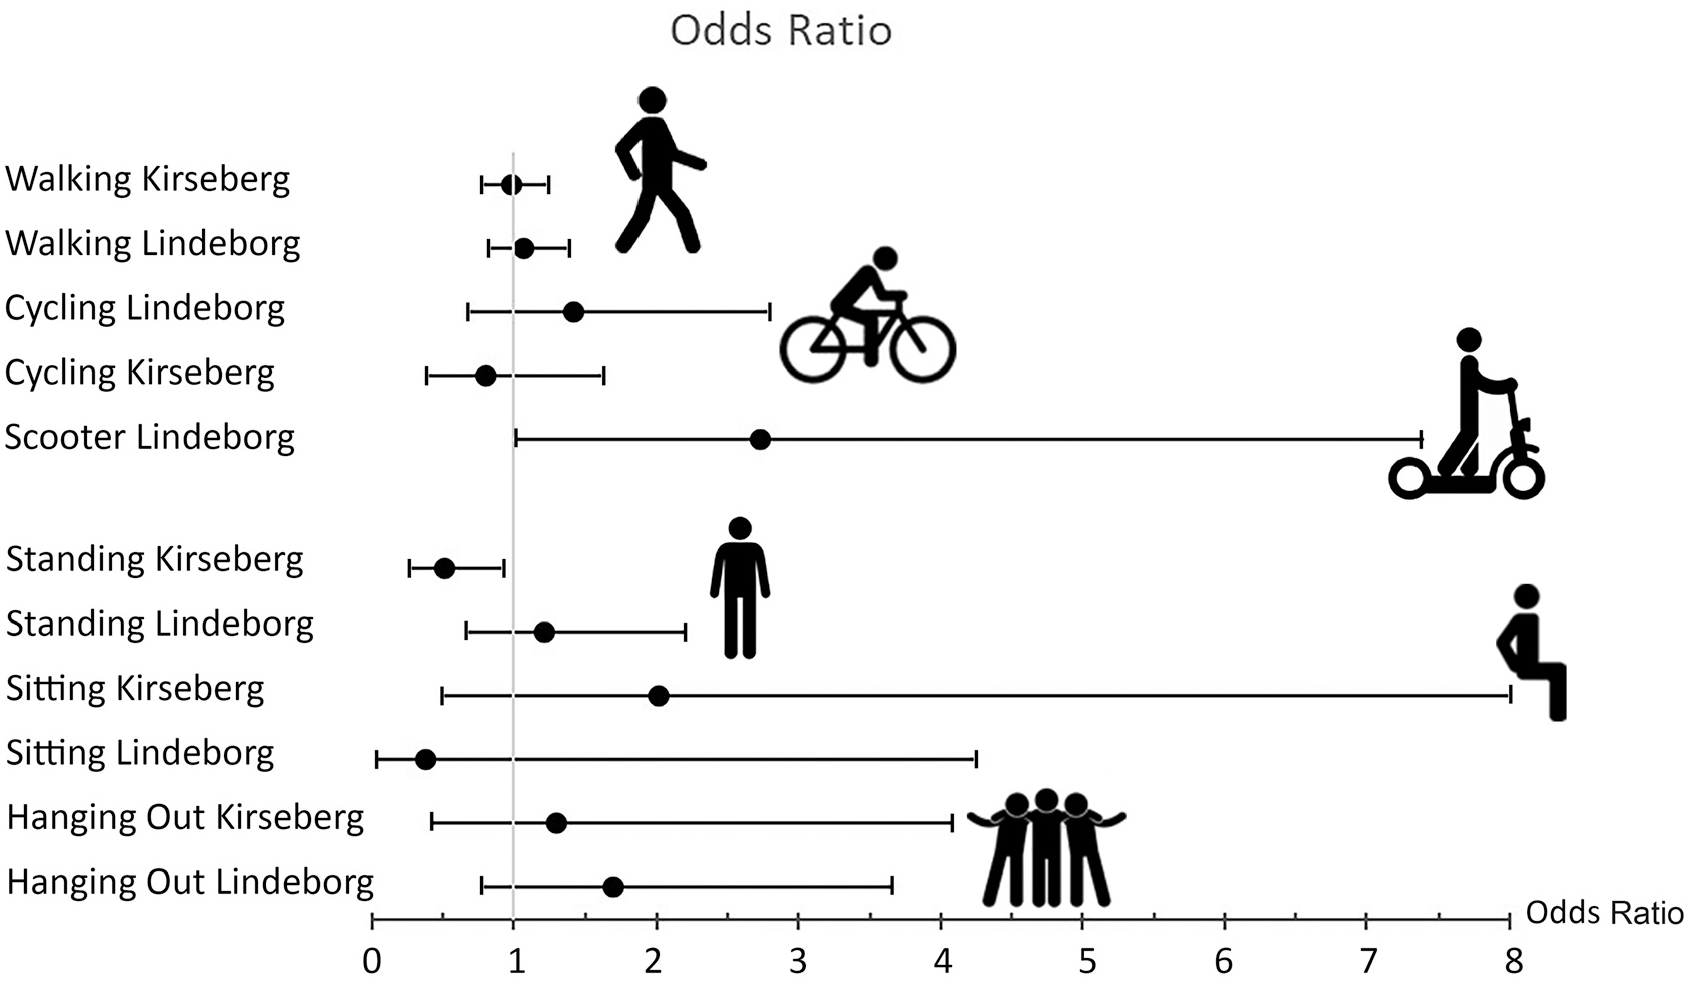
Summary of odds ratios for all behaviour types with 95% confidence intervals across all zones
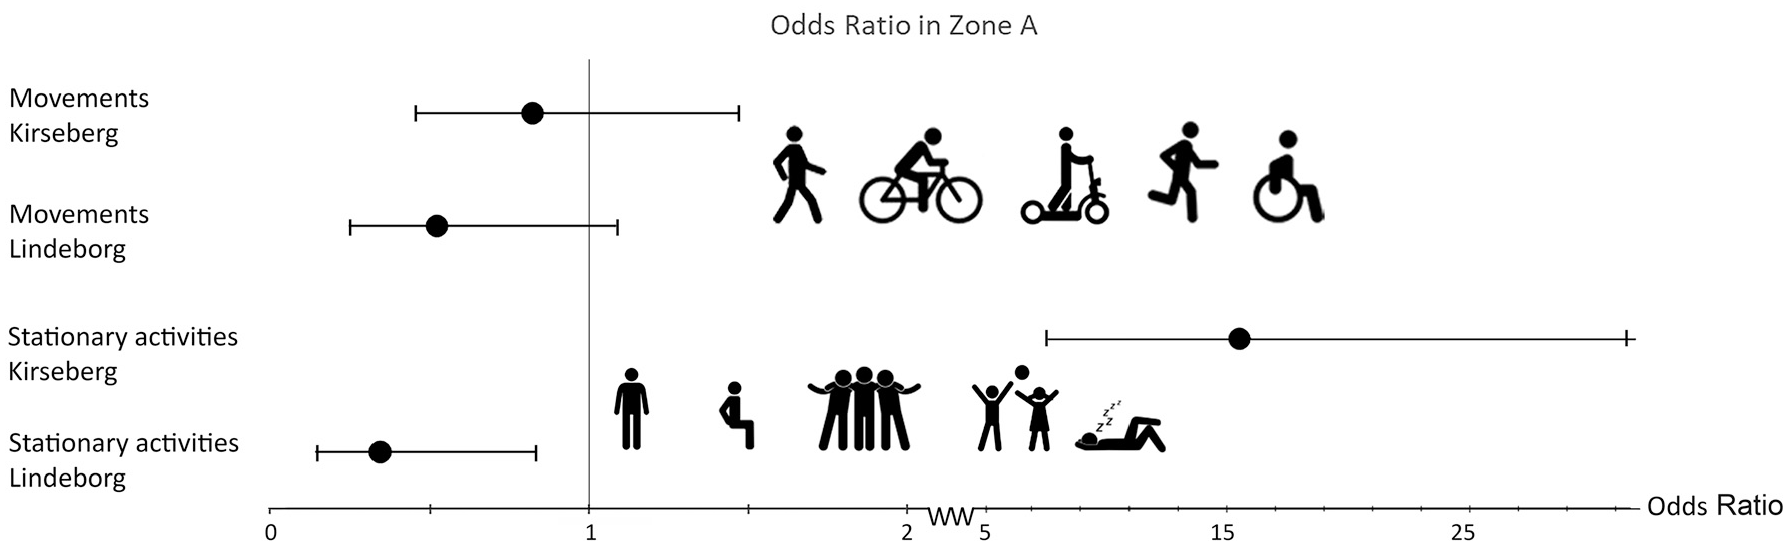
Summary of odds ratios for movements and stationary activities with 95% confidence intervals for zone A
ORs and 95% CIs for Kirseberg square do not suggest significant differences between daylight and darkness for walking or cycling. The OR for the stationary activity standing is 0.52 (95% CI = 0.29-0.91, p = 0.022), indicating a significant increase in EL compared to in DL. The observer’s notes confirm that these cases refer to withdrawals at the automated teller machine outside the grocery store and cases of people standing waiting outside the store for someone.
The ORs for Kirseberg square zone A (Figure 10 and Supplemental Table S1) show a significant decrease in stationary activities after dark in EL (OR = 15.6, 95% CI = 7.69–31.82, p < 0.0001). However, the difference in movements is non-significant (OR = 0.82, 95% CI = 0.46–1.47).
The ORs for Lindeborg square, shown in Figure 9 and Supplemental Table S2, indicate a significant decrease in the movement category on scooter in EL but do not suggest significant differences for any other movement. ORs for the stationary activities do not indicate significant differences. The ORs for Lindeborg square zone A, shown in Figure 10, indicate a tendency of increase in movements in EL in zone A. The OR for stationary activities in zone A (OR = 0.34, 95% CI = 0.14–0.83, p = 0.016) indicates a significant increase in this behavioural category in EL.
4. Discussion
This study analyses user behaviour at two local public squares in DL compared to EL after dark. Moreover, the spatial use related to different functional zones of the squares i.e. where different behaviour take place, is examined. To discern if the same types of user behaviour are sustained in EL or not, observations were made at the same times of day in the period before and after the daylight savings clock change. The two investigated squares are located in residential areas of similar size, and they are similar in terms of spatial arrangements, planning and function but have different lighting installations. The squares thereby provide two parallel cases to discuss the performance i.e. the facilitation of users’ movements and stationary activities after dark.
The frequency analysis showed that all of the studied types of user behaviour occurred during all timeslots at both squares, regardless of ambient light.
However, results of spatial use for both squares confirm that movements and stationary activities were related to functional zones of the squares, see Tables 7 and 8. In line with the physical design or the so-called ‘programming’,3,67 the zones A displayed more stationary activities than did the zones B and C, whereas the results were reversed for the other behavioural category with more movements in the zones B and C. It thereby becomes useful to explicitly consider spatial use in discussions on how lighting might support user needs in different functional zones after dark.
The frequency analysis (Tables 5 and 6) showed that movements generally were not affected by the change from DL to EL. This was confirmed by the OR analysis (Figure 9). According to the chi-square tests, Kirseberg square displayed an increase in walking after dark. One explanation for this discrepancy might be that people in Kirseberg tended to do their necessary errands in the twilight before it gets completely dark i.e. the observations excluded in the OR. Another explanation could be that behaviour displays different spatial-temporal patterns associated with each square at different time frames, due to somewhat different destination availability (Section 2.3), for example, movements to and from the children’s day-care centre in Kirseberg and movements associated with evening activities in the church in Lindeborg.
The lighting installation of Kirseberg square with asymmetric distribution and MH lamps gives high horizontal illuminance levels on paths in zones B and C (above 26 lx, exceeding class P1 in SS-EN 13201-2:2016) and low uniformity (around 0.25, i.e. below recommended values for the horizontal illuminance as per the same standard). In Lindeborg square with omni-directional distribution and HPS lamps in zone B and MH lamps on the path in zone C, average horizontal illuminance levels on the ground (7.1 lx and 11.1 lx for zones B and C, respectively) and uniformity (0.55 and 0.42, respectively) comply with class P4 and P2. Hence, movements that include necessary or habitual behaviour within the zones designed for walking, such as buying food at the local grocery shop may, be less sensitive to people’s experience of the after dark lighting condition such as horizontal uniformity of paths, and as previously suggested for such behaviour in daylight conditions, to be less sensitive to the perceived atmosphere. 71
Results of the frequency analysis and the OR showed that stationary activities, sitting and hanging-out, decreased after dark in Kirseberg square, in particular within zone A, which is the designated area for stationary activities. This indicated that the stationary activities that are of optional nature were not sustained in zone A, Table 7 and Figure 10.
On the contrary, in Lindeborg square, stationary activities in zone A increased from DL to EL. This result was confirmed by the OR test for zone A. One reason may be that a greater proportion of the movements in Lindeborg square than in Kirseberg were combined with stationary activities. A typical example would be a person who walks along the path to reach the grocery shop and runs into a neighbour and stops for a chat. This implies that a necessary behaviour might also evolve into a behaviour of optional nature. 25
A comparison of luminance maps of zone A of both squares, Figures 7 and 8, shows large differences in the light uniformity at ground level. In Kirseberg, dark and bright spots show luminance differing up to two orders of magnitudes, going from 0.1–0.3 cd/m2 to 1–20 cd/m2, whereas in Lindeborg square, zone A, with omnidirectional distribution, the luminance at ground level is in the range of 0.3–1 cd/m2 across the whole zone. The two A zones differed also in term of colour appearance due to lamps with different spectral power distribution, with MH in Kirseberg delivering CCT = 2800 K and CRI = 84 and the HPS in Lindeborg showing the characteristic yellow appearance for this type of lamp technology, with a nominal CCT = 2000 K and CRI = 25. Previous research suggests that appreciation of a space is related to the appraisals of brightness and perceived uniformity, which in turn is related to light levels and spatial distribution of light. 53 The present results raise questions regarding the importance of light distribution, perceived spatial brightness and uniformity to also sustain stationary activities in public squares. Moreover, appreciation of a visual scene after dark is related to the appearance of colours and colour temperature.54,57 Such associations should be considered in further research on EL and in particular, on stationary activities in squares.
European lighting standards provide no requirements for stationary activities in public space. However, the Australian road lighting standard AS/NZS 1158:3.1:2020 72 introduces public activity area classes for activity in public space and lists ‘amenity’ as one of the selection criteria, where low, medium or high amenity corresponds to average horizontal illuminances from 7 lx to 21 lx, implying that ‘amenity’ requires higher lighting levels. Users’ movements and stationary activities are of both necessary and optional character, where stationary activities to a greater extent are of optional nature and thus presumably more dependent on perceived affordances and amenity after dark.
Studies on pedestrian responses suggest that lighting may facilitate a range of user needs after dark such as accessibility, reassurance, comfort and pleasure and may therefore encourage use of public squares.35,36,38,41,43,45 Although both movements and stationary activities in public squares can be of both necessary and optional nature as part of the user’s everyday life, it is implied that stationary activities in particular requires amenity and therefore fulfilment of higher order needs i.e. beyond accessibility and reassurance.8,30,46 A key sentiment of public life studies proposes that, when a physical setting facilitates both necessary and optional activities, sociability is also supported. To what extent this applies also for dark conditions remains to be investigated.
The findings of this study are limited to the difference in behaviour recorded in two squares with different lighting installations. However, the results provide justification for further research on the lighting–behaviour relationship in local public squares. Future research should therefore strive to take users’ appraisal of the visual scene into account as well as inquire into how social interaction in public space is related to facilitation of movement and stationary activities.
5. Conclusion
The present study aimed to investigate the influence of electric light on user behaviour, in terms of facilitation of movements comprising walking, cycling, riding on scooter and other movements, and stationary activities comprising standing, sitting, hanging-out and other stationary, in local public squares.
A square includes different functional zones: those designed for movement and those designed for stationary activities. Given the complexity of a visual scene in a square, it seems valuable to analyse each functional zone in relation to its use. The observations of user behaviour at two different squares in daylight and electric light suggest that movements are sustained in zones designed for walking across different lighting conditions, as well as differences in average horizontal illuminance levels and uniformity. In zones designed for stationary activities, such behaviour seems more sensitive to changes in lighting conditions, supposedly as they may require an appreciation of the visual scene and of the perceived affordances. 73
When we understand why certain luminous conditions produce the behavioural outcomes we desire, then we will be able to re-create those conditions, and those outcomes, more reliably. 33
There are tremendous possibilities to improve the atmosphere of a public space with electric light, and thereby the opportunity to enhance public life in squares is at hand. However, there is a need for both theoretical and methodological development on how to relate lighting to behavioural dimensions in local public squares, also including the social dimension.
Supplemental Material
sj-pdf-1-lrt-10.1177_14771535231200390 – Supplemental material for User behaviour in public squares after dark
Supplemental material, sj-pdf-1-lrt-10.1177_14771535231200390 for User behaviour in public squares after dark by VKR Hennig, N Gentile, S Fotios, C Sternudd and M Johansson in Lighting Research & Technology
Footnotes
Declaration of conflicting interests
The authors declared no potential conflicts of interest with respect to the research, authorship, and/or publication of this article.
Funding
The authors disclosed receipt of the following financial support for the research, authorship, and/or publication of this article: This study was funded by the Swedish Energy Agency, project number 45201-1.
Supplemental material
Supplemental material for this article is available online.
References
Supplementary Material
Please find the following supplemental material available below.
For Open Access articles published under a Creative Commons License, all supplemental material carries the same license as the article it is associated with.
For non-Open Access articles published, all supplemental material carries a non-exclusive license, and permission requests for re-use of supplemental material or any part of supplemental material shall be sent directly to the copyright owner as specified in the copyright notice associated with the article.