
Abstract
Daylighting is desirable in classrooms but can pose a challenge to classroom illumination when there is a risk of discomfort from glare from windows and sunlight. There are several metrics in use for the evaluation of discomfort from glare from daylight, but none has yet been validated based on the field-of-view conditions of classrooms. A previous study found that Daylight Glare Probability (DGP) produced a relatively better predictive power of the reported discomfort from glare in a classroom compared to other metrics. However, the metric tended to correlate weakly with the reported glare in positions away from the window light source in a classroom. This prompted the current investigation on the possibility of improving the DGP equation. The modified equation produced a significantly better fit to the subjective glare evaluations from a dataset comprising 184 evaluations from 49 participants collected in a classroom. The results suggest that DGP can be improved to predict the reported discomfort from glare for the conditions of board-based work in a classroom, particularly when a logarithmic form of the adaptation term is integrated in the equation.
1. Introduction
Several school design codes and best practice recommendations in Europe specify that the main source of light in the classroom should be daylight or that a certain level of daylighting should be provided in classrooms.1–3 In addition, daylighting was found to have a significantly positive impact on student performance, resulting in an improvement of 21% in learning outcomes 4 and to an increase of children’s academic progress in primary school. 5 Daylighting is highly desirable in classrooms but poses a challenge to classroom illumination when there is a risk of glare from windows, 5 from sunlight 6 or from sunlight reflections. 7
In possibly the largest study carried out to date on the effects of daylighting on a student population, glare from daylighting was found to have a significant impact on the quality of the visual environment and to negatively impact student learning. 8 This impact was particularly related to the disciplines that resort to instruction using vertical task areas, such as the classroom board. In that study, direct sun penetration and lack of control of blinds to prevent intermittent sources of glare were found to be associated with negative student performance. Furthermore, teachers in daylit rooms were found more likely to report problems with glare, expressing a desire to have more daylight in their classrooms, provided that these problems were resolved. Glare from daylight can indeed create visually poor learning environments. The response to glare is often drawing the blinds and switching on the electric light, a behaviour that undermines the use of daylight and its benefits, and increases energy consumption.
In recent years, several country-specific school design codes have emerged, each of these approaching the quantification of discomfort from glare in classrooms in a different way. The methods proposed in these codes are either based on the horizontal (desk) illuminance 9 or on methods that lack a measure of eye adaptation. 3 Most of the time occupants of classrooms look towards a vertical task with their field of view dominated by the luminance of surfaces that extend far beyond the limits of their desks. In these conditions, the glare index formulation, 10 built upon a more complete description of the field-of-view luminance conditions, offers a more suitable way of quantifying discomfort from glare. Several studies have been conducted to adapt, develop and improve the glare index to the daylit environment, including the creation of the Daylight Glare Probability (DGP). 11 In a recent cross-validation study, 12 DGP was shown to produce the most robust and accurate results regarding the prediction of reported discomfort from glare. This validation of DGP is quite timely, as the metric has been adopted as the discomfort from glare evaluation method in the new EU standard EN 17037 – Daylight in buildings. 13 The standard applies to any daylight-oriented indoor space, which is mainly side-lit and where the expected activities are comparable to reading, writing or using display devices. However, the standard also indicates that the DGP should not be applied to the positions of a space that are far away from the daylight openings.
A question therefore emerged regarding the applicability of the current discomfort from glare metrics to the classroom space. There is a lack of studies that investigate the performance of discomfort from glare metrics in large spaces, with two of the very few studies suggesting that the predictive power of DGP and other glare indices is not as high as could be expected.14,15 In classrooms, occupants sit at a variety of distances to the window light source. When engaged in a board-based task and also in other classroom situations, occupants tend to look inwards, when sitting by the window or from a relatively long distance to the window, when sitting by the wall. The latter is a situation that very much differs from the situation for which DGP and other glare indices have been developed.16,17 Discomfort from glare from daylight can result from a saturation (excessive light intensity) and/or from a contrast effect (imbalanced light distribution). 18 It has been pointed out that the conditions of saturation glare in which the DGP has been developed makes the metric not applicable to conditions where the visual field is dominated by high luminance contrast.12,14 In the daylit classroom, windows are seen against a much lower brightness background in the positions deep in the room. In the positions near the window, occupants of a classroom are very often looking inwards, with a large portion of their visual field filled by the darker walls of the room, rather than by a large bright window.
The study by Viula and Hordjik 19 suggested that DGP provides a relatively better predictive power of the reported discomfort from glare in a classroom compared to other metrics. However, in that study, the metric showed a poor performance in the inner parts of the room, a result that warrants an investigation on how to improve the DGP.
The cross-validation study of discomfort from glare metrics by Wienold et al., 12 advised that future development in this field should aim at optimising the metrics that already contain terms that account for the saturation and contrast effects of discomfort from glare from daylight, that is the Unified Glare Rating experimental (UGRexp), 20 the Predicted Glare Sensation Vote (PGSV) 21 and DGP. DGP was not only the metric that performed the best in that study but does also offer a more complete characterisation of discomfort from glare in relation to PGSV and has been developed for a wider range of window configurations than UGRexp. As noted by Velds 22 and Boyce, 23 PGSV does not contain a term to account for the position of the glare source, making the metric only applicable to situations where the observer is looking directly at the window light source, whereas UGRexp has been developed for observers looking perpendicularly at the window and for one window configuration only. In a classroom, the apparent size and position of the window in the visual field is quite variable depending on sitting position, making DGP a metric with stronger potential for further development. DGP is therefore used in this paper as a starting point for an optimised metric for classrooms.
The DGP predicts the probability of the number of persons that report discomfort from glare in a scale from 0 to 1, as shown in Equation (1):
where Ev [lux] is the total vertical illuminance measured at the eye, and Ls [cd/m2], ωs [steradians] and P [–] are the luminance, solid angle and position index for each identified glare source, respectively.
The equation contains two coefficients: the coefficient of the adaptation term (5.87 × 10⁻⁵) and the coefficient of the contrast term (9.18 × 10⁻²), and a constant (0.16). The equation also has three exponents applied to the luminance of the source (2), to the position index (2) and to the vertical eye illuminance (1.87) in the contrast part of the equation. As the equation contains both an adaptation and a contrast term, it is classified as a ‘metric based on both contrast and saturation effects’, 12 where the adaptation term is expected to describe the saturation effect of glare and the contrast term the contrast effect.
The potential improvement of the DGP that is investigated in this study corresponds to an adjustment of the value of the components of the equation that have gone through previous modifications, namely its coefficients, the exponent of the vertical eye illuminance and its constant, designated as c1, c2, c3 and c4 in Equation (2), respectively.
In the study by Hirning, 14 the low correlation between DGP and the reported discomfort from glare was attributed to the dependence of the DGP equation on the linear form of the adaptation term (Ev). In that study, it was found that the logarithm of the vertical eye illuminance Ev provided a higher correlation to discomfort than its linear counterpart. The DGP and the metrics derived from DGP are in fact the only glare indices where the logarithm of the adaptation term was dropped in favour of a linear one, the reason for this being that in the DGP investigation, a better correlation was found for a linear form of the Ev. 16 This result was however met with surprise as, as it is explained in the same study, in the field of psychophysics the magnitude of perception is thought to be logarithmic towards the magnitude of the physical stimulus (Weber–Fechner law). 24 In the case of this dataset, glare was reported for conditions of low illuminance. The Weber–Fechner law expresses that in conditions of low illuminance, more glare is reported than what a linear relationship between stimulus and perception would predict, making this relationship relevant to test in the context of this study.
Based on the above, it was considered relevant to test a logarithmic form of Ev as part of the DGP definition, with an equation, DGPlog(Ev), as shown in Equation (3):
2. Method
2.1 Experimental setup
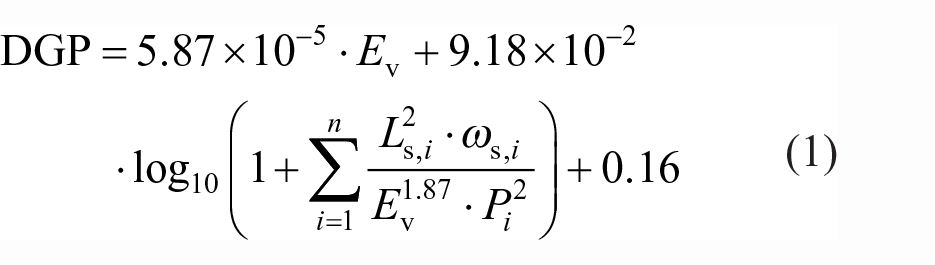
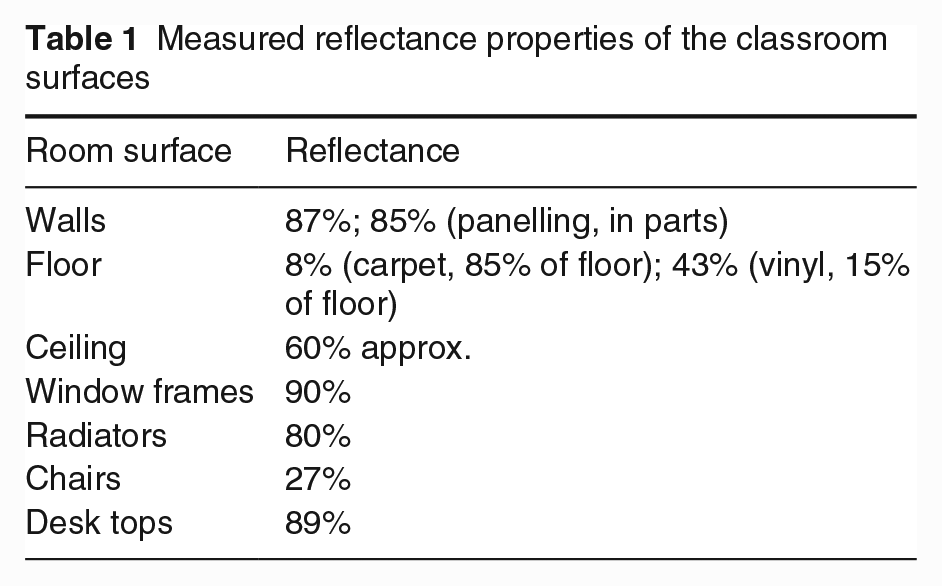
The experiment was set up in a classroom at the Faculty of Architecture and the Built Environment, TU Delft. The room has a typical size of a primary and secondary school classroom (7.6 m × 6.45 m) and is daylit from one side through a full-length window (63% transmission glass) to the Southwest (Figure 1). The interior of the room is mostly made of diffuse surfaces of light colour, except for a red carpet. Table 1 provides the reflection properties of the classroom surfaces.
Panoramic view of the experiment room in four photographs, taken from position 4
Measured reflectance properties of the classroom surfaces
The measurements took place in October and November 2016, August 2017 and July 2018, between the hours of 10.00 and 18.00, under naturally occurring sky conditions. The number of sunlight hours in the location of the study in wintertime is quite limited, the skies are generally overcast and glare events relating to the penetration of sunlight tend to occur sporadically in that season. The experiment does however cover situations of low solar angles in some of the afternoon sessions.
The experiment was attended by 50 participants, 21 females and 29 males. The participants were all higher education students of Asian, South American, African, Middle-Eastern and European origin with a median age of 28 years (ranging from 20 to 40 years). There was no particular criterion in the selection of participants other than being students within that range. A minimum age of 18 years ensured that participants could attend the experiment by their own decision and a maximum age of 40 years ensured a certain degree of control over the eye aging characteristics of the population.
The experiment consisted of collecting paired subjective discomfort from glare evaluations and luminance measurements in four sitting positions in the room, two positions next to the window and two positions next to the wall (Figure 2).
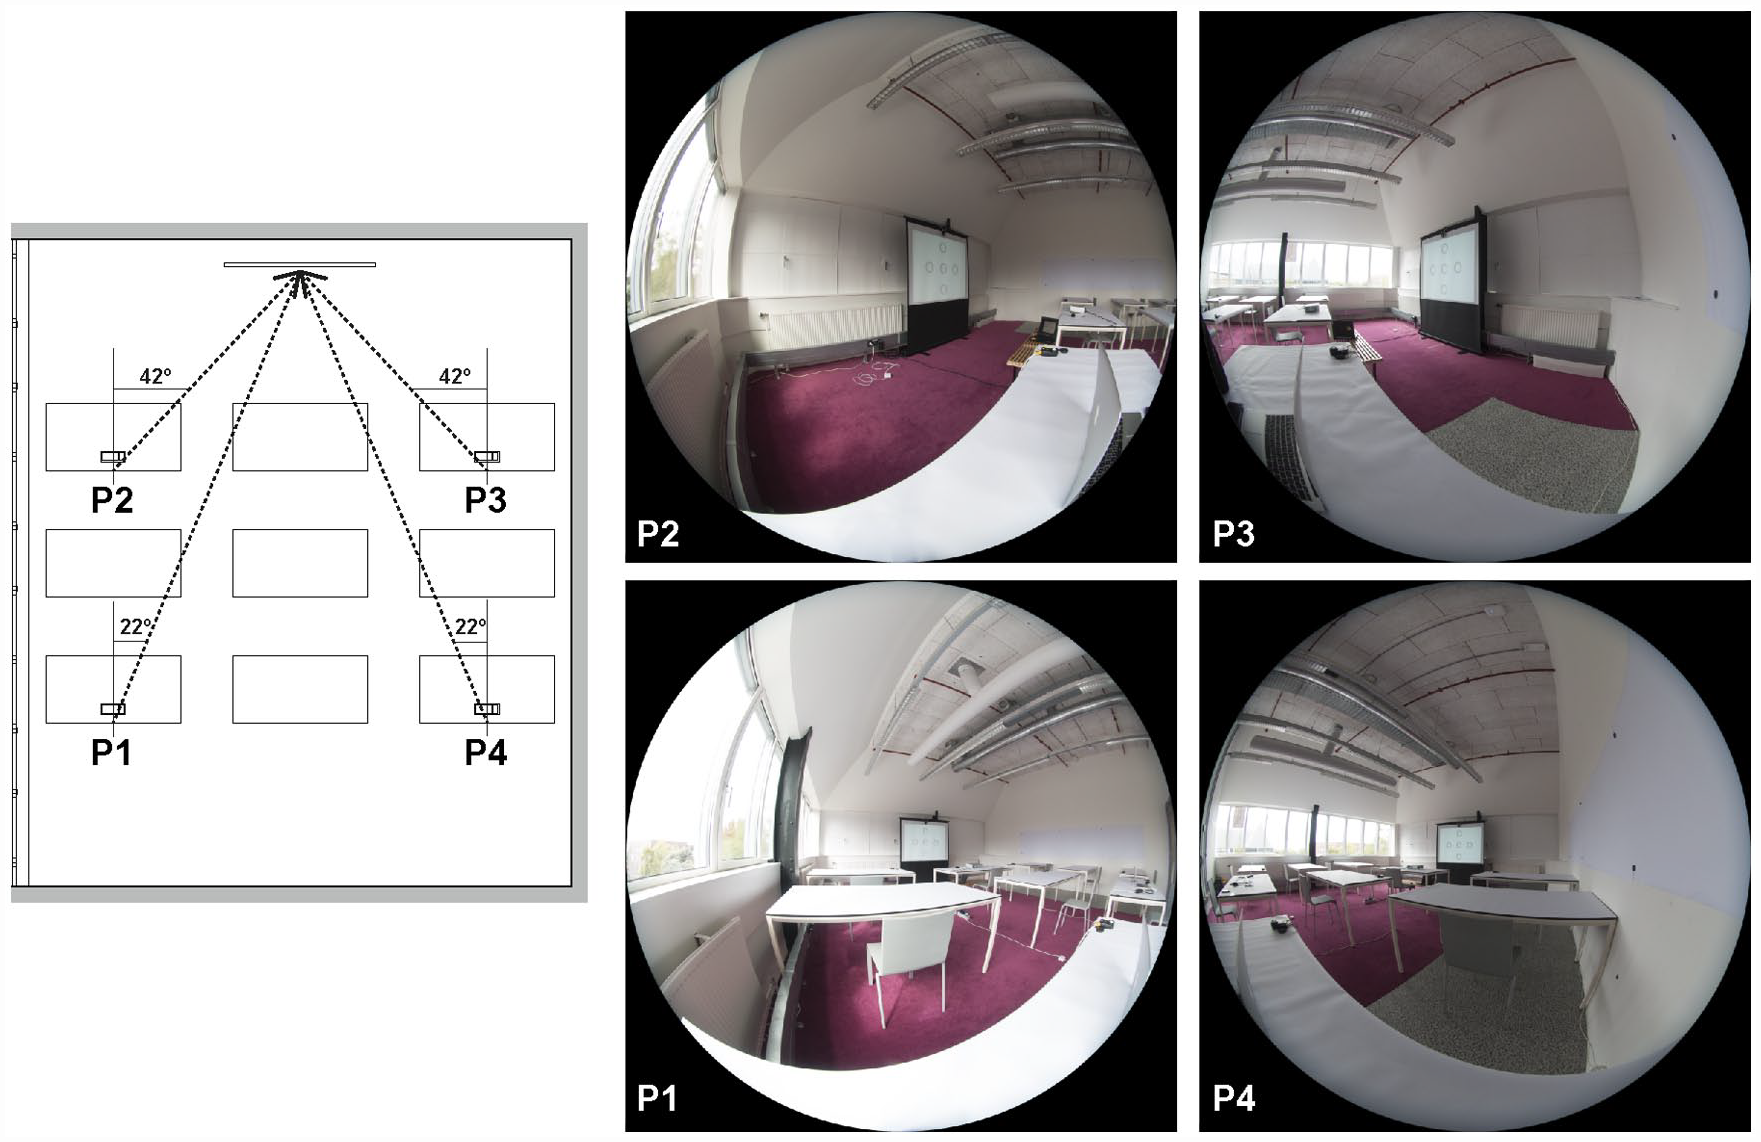
Plan view of the room (left) and field-of-view in the four sitting positions (right). P1 is the sitting position in the back of the room near the window, P2 is the sitting position in the front of the room near the window, P3 is the sitting position in the front of the room near the wall and P4 is the sitting position in back of the room near the wall
In each of these positions, the participants were asked to perform a visual task projected on to a screen centred on a wall at the front of the classroom and to respond to a questionnaire, while luminance measurements were being taken. This set-up results in a view direction with a horizontal angle from the window of 42° in the positions in the front of the room (P2 and P3) and of 22° in the positions in the back of the room (P1 and P4).
A view direction to the board, in this case a projection screen, was chosen instead of a view direction to the desk, as the former is the direction that introduces a significantly new field-of-view condition in comparison to previous studies, generally involving desk-based tasks. It can be expected that perception of discomfort from glare in the conditions of desk-based work in a classroom to not significantly depart from the results verified for that condition in the office space. On the other hand, the view direction to the board represents a much more critical case of risk of glare in the positions in the inner part of the room, P3 and P4, than the view direction to the desk.
The main objective of the task was to have the participants focus on a visual activity with their line of sight directed to the board, throughout the evaluation period. The task consisted of finding rings with gaps facing in a specified direction, in a field of Landolt ‘C’ rings, with each layout of rings appearing in random order every 2 seconds.
The questionnaire consisted of three parts: demographic information, a visual comfort and glare evaluation, and an evaluation of the general comfort conditions in the room. The discomfort from glare question was: ‘When doing the test in this position, which degree of glare from the window have you experienced?’ To ensure a common understanding of the different categories of the 4-point scale of the DGP, 11 the question was formulated using the descriptors defined by Osterhaus and Bailey 25 (Figure 3).
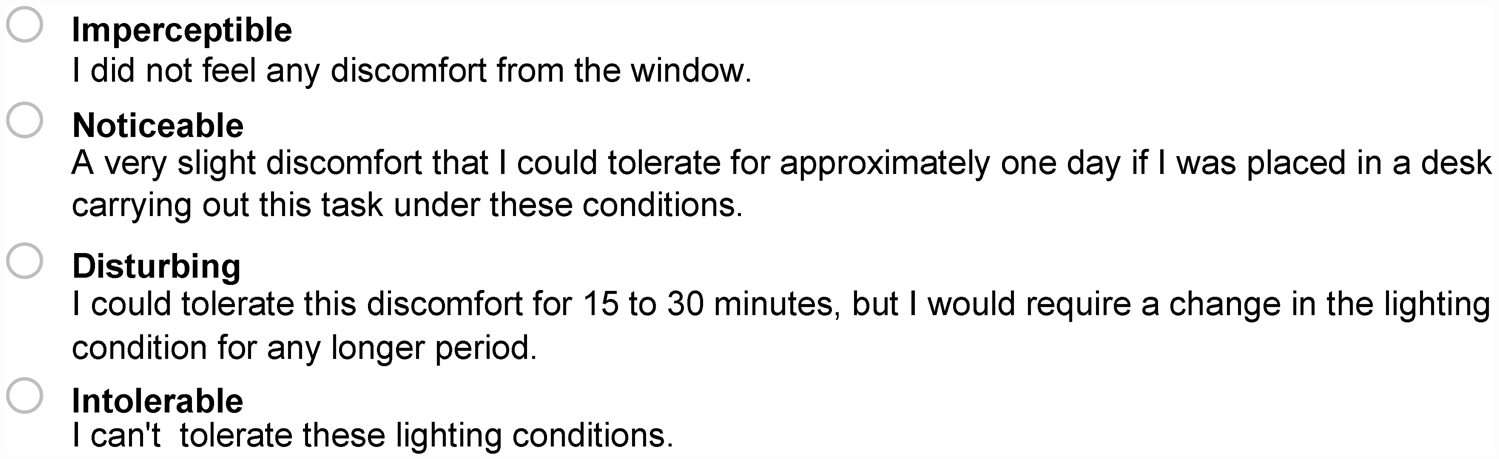
The 4-point glare evaluation scale with its descriptors
The luminance data were collected with the LMK mobile air, a calibrated photo camera produced by Technoteam. 26 The system is based on a Canon EOS70D and is equipped with a Sigma 4.5 mm/2.8 EX DC fisheye lens and with a Neutral Density Filter with 1% transmittance (Kodak ND2.0). The photometric calibration of the LMK is an absolute calibration made according to DIN 5032-6 27 in February 2016 and August 2017, with an estimated inaccuracy of ±8%, and measurements were conducted within the calibration guarantee period. The camera was transported to each desk by the researcher or researcher assistant, each time the participant changed position. A vertical eye illuminance measurement was collected with a Konica Minolta T10M illuminance meter adapted to the flash mount of the camera.
To obtain simultaneous luminance and subjective evaluations, the luminance measurements were collected on a radius of 0.75 m from the position of the participant’s head. This distance guaranteed that the participant would not obstruct the window view of the camera, particularly in positions 3 and 4. The relative difference that this approach introduces to the luminance measurement has been estimated to reach 20%. 28 However, a simulation study for a model representation of the experiment room showed that this difference tended to be smaller (0%–14%) in relation to the value of DGP (see Supplemental material). A deviation of 14% occurs in a situation where the sun is very peripheral in the visual field, a situation that is verified for only one data point of this dataset.
The participants spent 3.5 minutes to 4 minutes in each sitting position, with the order of sitting being randomised between participants (Figure 4).
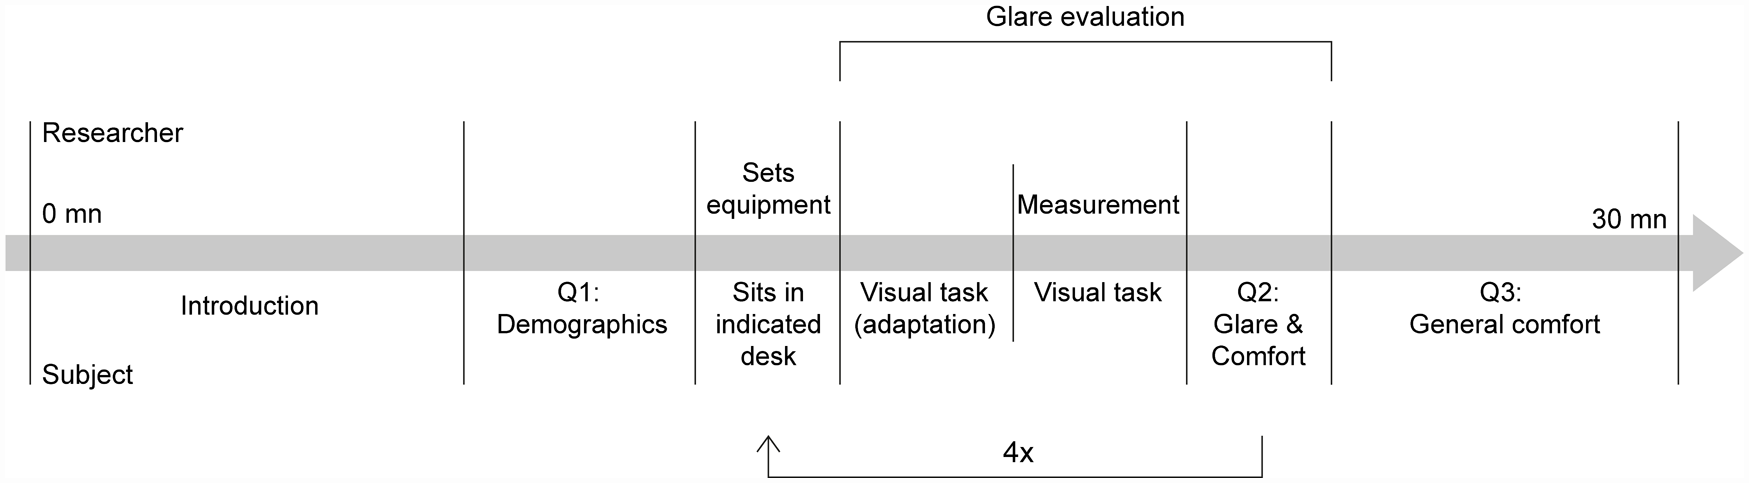
Experiment timeline, showing the different stages of the experiment and the relative time of each stage in relation to the total duration of the experiment (30 minutes). More detailed information regarding the workflow is provided in the Supplemental material
More information regarding the experimental workflow, characteristics of the used equipment and of the visual task are provided in the Supplemental material.
2.2 Data processing
The initial sample of the study is of 200 measurements (4 × 50), from which some were excluded due to accidental obstruction of the camera’s field of view, luminance image overflow, direct sunlight on the task, cases of veiling reflections on the task surface, one technical problem and the highest measured luminance combined with an ‘imperceptible’ glare evaluation. The final sample resulted in 184 measurements: 44 cases in position 1, 46 in position 2, 46 in position 3 and 48 in position 4.
Luminance overflow occurred in six measurements, always in the area of the visible sun or of a reflection of it. Four of these images were corrected using the evalglare 29 function that exists for that purpose. The other two images were eliminated, as the measured illuminance was lower than the derived illuminance, a situation that was attributed to the difference between the field of view of the camera and the field of view of the illuminance meter when the sun was visible and slightly obstructed by the window mullions.
The High Dynamic Range (HDR) luminance images were produced with Labsoft, 30 the LMK processing software. The images were converted to the Radiance Picture (PIC) file format 31 using pftopic, 32 re-projected from their original equi-solid angle to an equi-angle projection using pcomb 33 and reduced to a resolution of 1200 × 1200 pixels using pfilt. 33 The images were then processed with evalglare v2.09 29 to calculate the parameters Ev, Ls, ωs and P.
After comparing the results of several glare source detection methods for the calculation of DGP, the threshold method with factor 2000 cd/m2 showed a slightly better correlation with the reported glare than the task method with different factors and was chosen as the glare source detection method for the calculation of DGP (see Supplemental material). All other parameters of the glare calculation were left as the default evalglare 34 values.
Validation of the HDR luminance images was carried out by comparing the externally measured vertical eye illuminance with the vertical eye illuminance derived from the luminance images, using the function that is provided for that purpose in evalglare. The maximum relative difference between the two measurements was 27% (one measurement). After the exclusion of the 15 images with problems and overflow correction, the dataset shows a bias of 21 lx, a normalised bias of 2%, a root mean square error (RMSE) of 167 lx and a normalised root mean square error of 11%, between the two measurements.
3. Analysis
The analysis that is performed in this study is based on a division of the dataset into a window zone (positions 1 and 2, N = 90) and a wall zone (positions 3 and 4, N = 94), as there was no enough data for an analysis by position and a separation based on a front (positions 2 and 3) and back (positions 1 and 4) zone was found to be inadequate. The window and the wall zone correspond to two distinct daylighting conditions, resulting from the difference in distance to the window.
The metrics are analysed for their ability to predict the reported discomfort from glare for the two datasets: the window zone and the wall zone. The analysis was based on a Spearman rank correlation and on a receiver operating characteristic (ROC) curve. The predictive power of DGP and DGPlog(Ev) is measured based on the effect size and significance of these statistics. For the Spearman correlation, that corresponds to the correlation coefficient (ρ) and its p-value. For the ROC curve, that corresponds to the area under the curve (AUC) and its p-value, as well as the true positive rate (TPR) and the true negative rate (TNR) of the curve.
To perform an ROC curve analysis, the independent variable (reported glare) needs to be transformed into a dichotomous variable, where one of the values represents the positive condition (‘glare’) and the other value represents the negative condition (‘no glare’). For the performed analysis, the cut-off point is set to two different conditions: an ‘any glare’ condition, which includes the ‘noticeable’, ‘disturbing’ and ‘intolerable’ votes, as the ‘glare’ value and a ‘disturbing glare’ condition, which includes the ‘disturbing’ and ‘intolerable’ votes, as the ‘glare’ value.
According to Cohen, 35 the Spearman correlation shows a medium effect size for a correlation coefficient, ρ, between 0.3 and 0.5 and large effect size for ρ > 0.5. The higher the AUC, the better the performance of the metric, with an AUC > 0.7 being considered good and an AUC > 0.8 being considered very good. 36 Similarly, the higher the TPR and TNR of a metric, the better its performance, with a value lower than 0.5 (or 50%) indicating no discriminatory power of the two conditions, ‘glare’ and ‘no glare’. The effect size of ρ and AUC is considered significant when p < 0.05. Tables 2 to 4 show the results of the statistical tests, with values in italic indicating a non-significant correlation or a low effect size correlation.
Results of the Spearman rank correlation between the metrics (DGP and DGPlog(Ev)) and the reported glare. The results are provided for the two room zones: the window zone and the wall zone
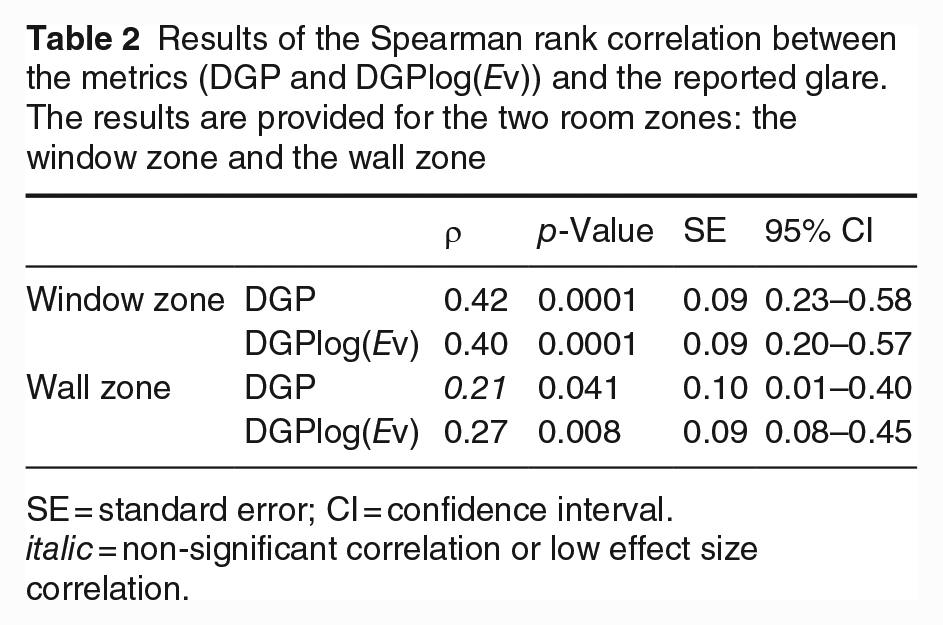
SE = standard error; CI = confidence interval.
italic = non-significant correlation or low effect size correlation.
ROC curve analysis results for the ‘disturbing glare’ classification. For this ROC curve analysis, the threshold value for discomfort is set at the ‘disturbing’ level
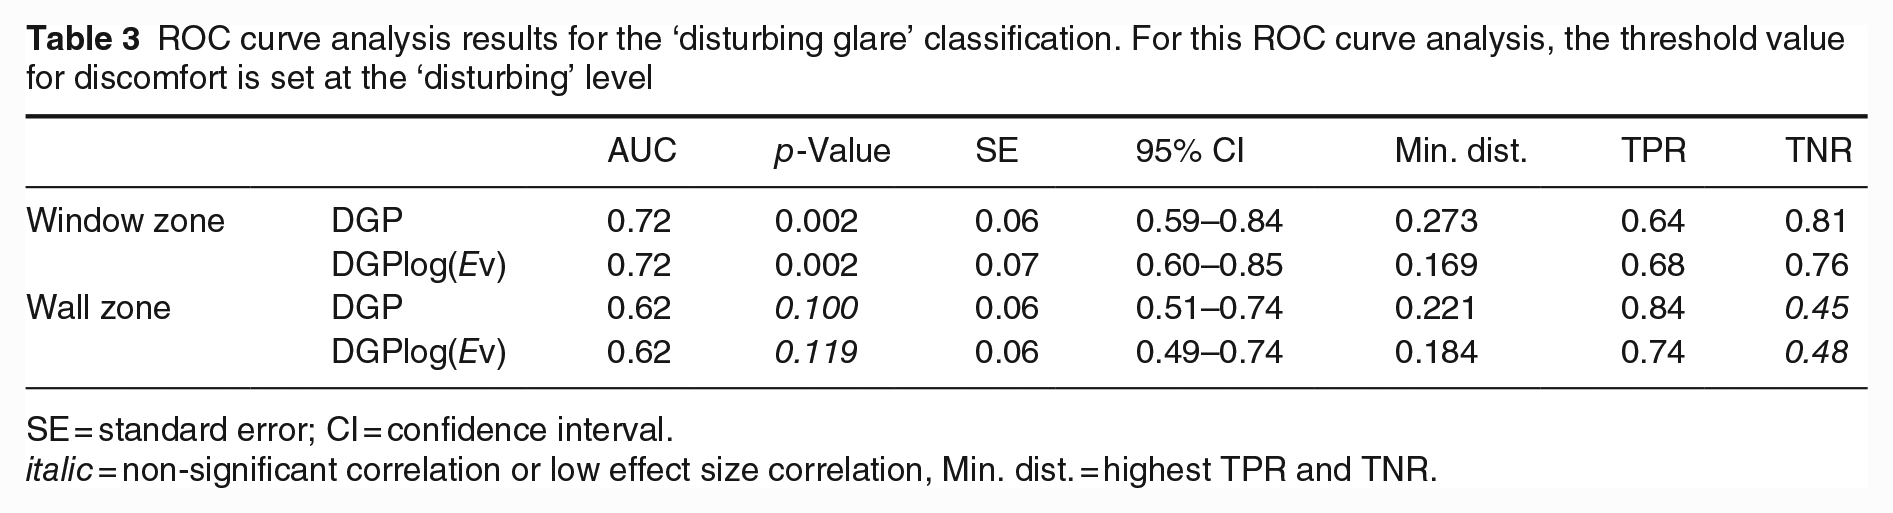
SE = standard error; CI = confidence interval.
italic = non-significant correlation or low effect size correlation, Min. dist. = highest TPR and TNR.
ROC curve analysis results for the ‘any glare’ classification. For this ROC curve analysis, the threshold value for discomfort is set at the ‘noticeable’ level
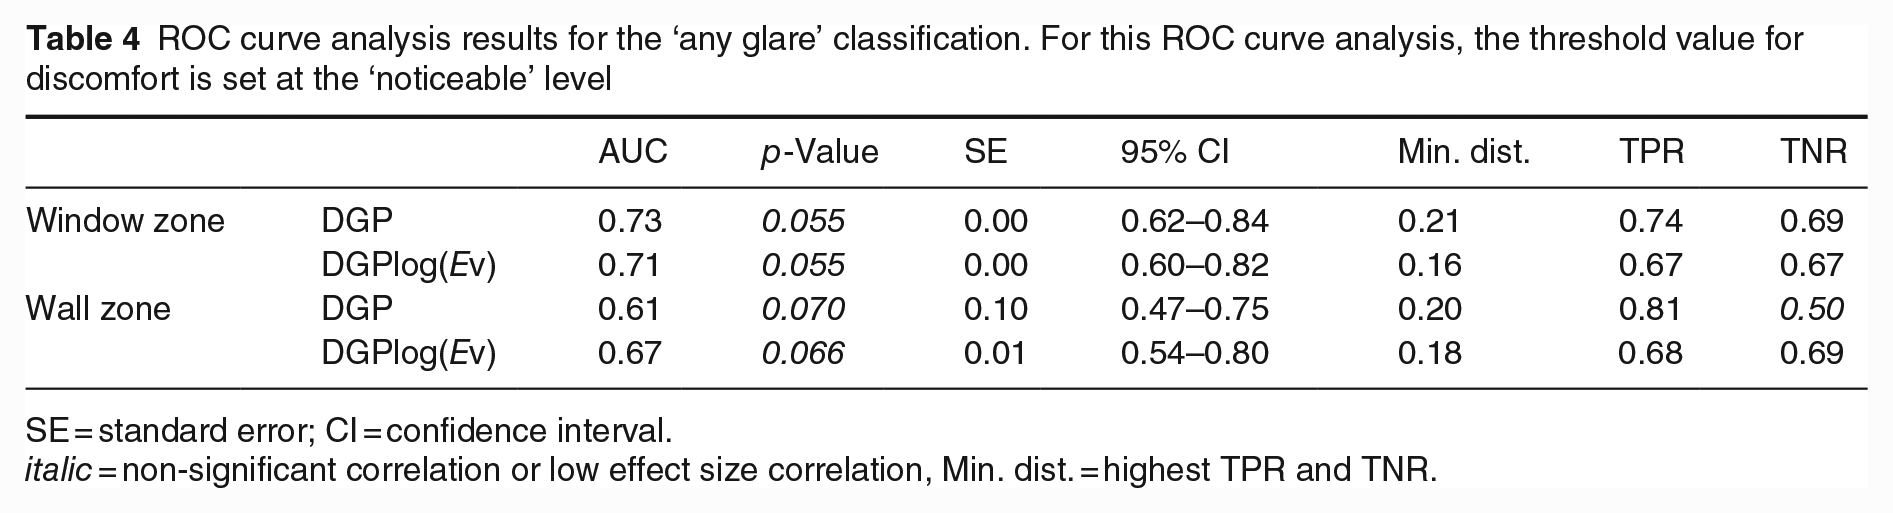
SE = standard error; CI = confidence interval.
italic = non-significant correlation or low effect size correlation, Min. dist. = highest TPR and TNR.
It can be observed that the effect size of the statistical tests is medium to good in the window zone and low in the wall zone. The significance of the tests can be poor in both window and wall zones, and the metrics tend to fail the TNR test in the wall zone. It can be said that the performance of DGP and DGPlog(Ev) is generally poor in the wall zone and acceptable in the window zone.
Descriptive statistics of the reported glare and metrics are provided in the Supplemental material.
4. Optimisation
4.1 Optimisation approach
An optimisation exercise is here carried out to find if the prediction of the reported discomfort from glare can be improved by a transformation of the DGP. Many of the existing metrics, including DGP, have been developed based on a transformation of an existing glare equation, a procedure that is followed in this study as well.
The development of glare metrics in previous studies has generally involved some form of statistical regression, where the developed or improved metric is evaluated based on the effect size of the statistic. In this case, as the dependent variable is of ordinal level (4-point glare sensation scale), two nominal-based statistical methods were tested beforehand: a binomial logistic regression and a multinomial regression. The first method resulted in high standard errors and extremely wide confidence intervals and the second in a high number of zero frequency cells, a problem that is generally attributed to the presence of a continuous independent variable. 37
A linear regression becomes a possibility when the dependent and independent variables are of continuous level. This can be achieved by transforming the dependent variable, the glare vote, into a percentage of discomfort from glare. This transformation was done by first ranking and then grouping the independent variable (glare metric) into a number of groups and calculating the percentage of persons affected by glare in each of these groups.
The percentage of people experiencing glare was derived based on a predefined ‘glare’ threshold, or cut-off point, with a similar procedure to that previously followed for the ROC curve being used to divide the data. This percentage is therefore derived for an ‘any glare’ definition and for a ‘disturbing glare’ definition of glare.
The process of grouping reduces the sample to a low number of data points. Some authors suggest that an optimal solution is found for a number of groups equalising the number of observations in each group,38–40 in order to avoid an overdetermined or an underdetermined coefficient of determination, r2. The strategy in this study was therefore to group the response variable into ten groups of 9 or 10 observations per group.
4.2 Statistical power
An analysis was carried out to identify the adequacy of the 10-point sample, based on a statistical power analysis. The analysis uses the ‘pwr’ package 41 for R to estimate the sample size for the general linear model, from the following inputs: effect size = 0.84, significance = 0.01, number of predictors = 3 and power = 0.8. The effect size of 0.84 corresponds to the average effect sizes from the studies of Wienold, 16 Hirning et al., 14 Karlsen et al. 39 and Konstantzos and Tzempelikos, 40 where the same statistical approach of grouped variables of this study was used. The number of predictors is defined as the number of coefficients in the model, minus the intercept, which in this case was set to 3. The minimum required sample size for these conditions was estimated as N = 9, showing that the 10-point sample has adequate statistical power.
4.3 Optimisation goal
The search for an improved equation is measured by an increase of the predictive power of the metric. The optimal form of the equation is obtained for the parameters c1 to c4 that lead to the best correlation with the reported glare. A linear relationship is therefore assumed between the optimised metric, and the percentage of persons that experience glare, with an equation of a form as shown in Equation (5).
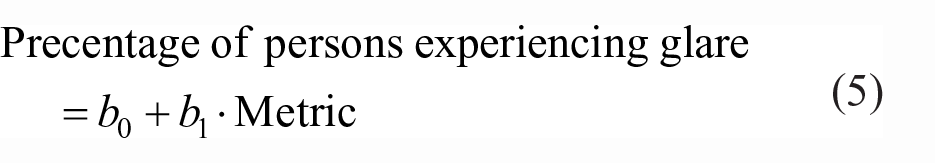
where b0 and b1 are the constant and coefficient of a linear regression.
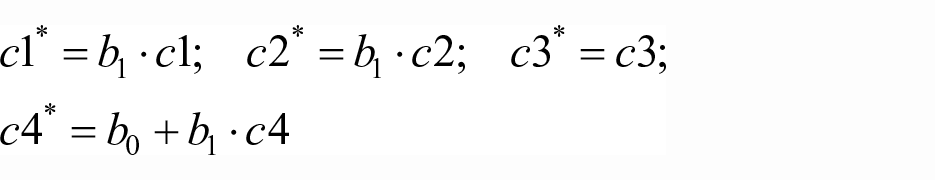
The objective of the optimisation process is to maximise the coefficient of determination, r2, of the linear regression, for an equation with components c1*, c2*, c3* and c4*, defined as:
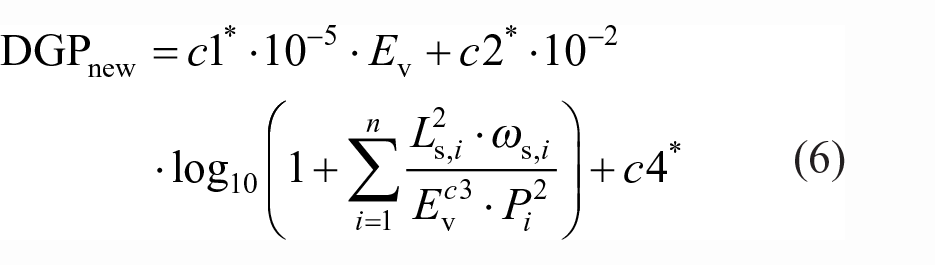
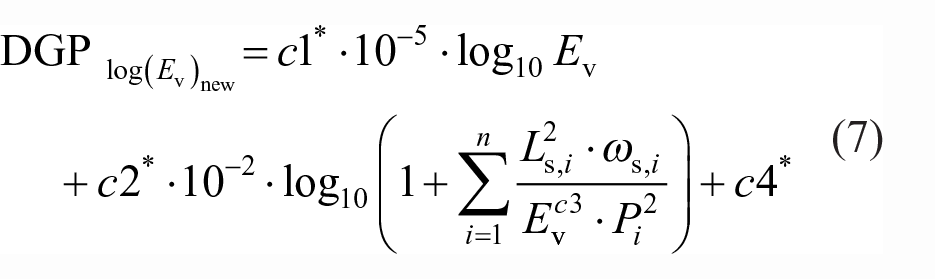
And the new equations, defined as in Equations (6) and (7).
The optimisation of the equations is performed for the eight conditions presented in Table 5.
Matrix of the performed optimisations. Eight optimisations were performed based on a combination of zone (two zones), metric (two metrics) and glare definition (two glare definitions)
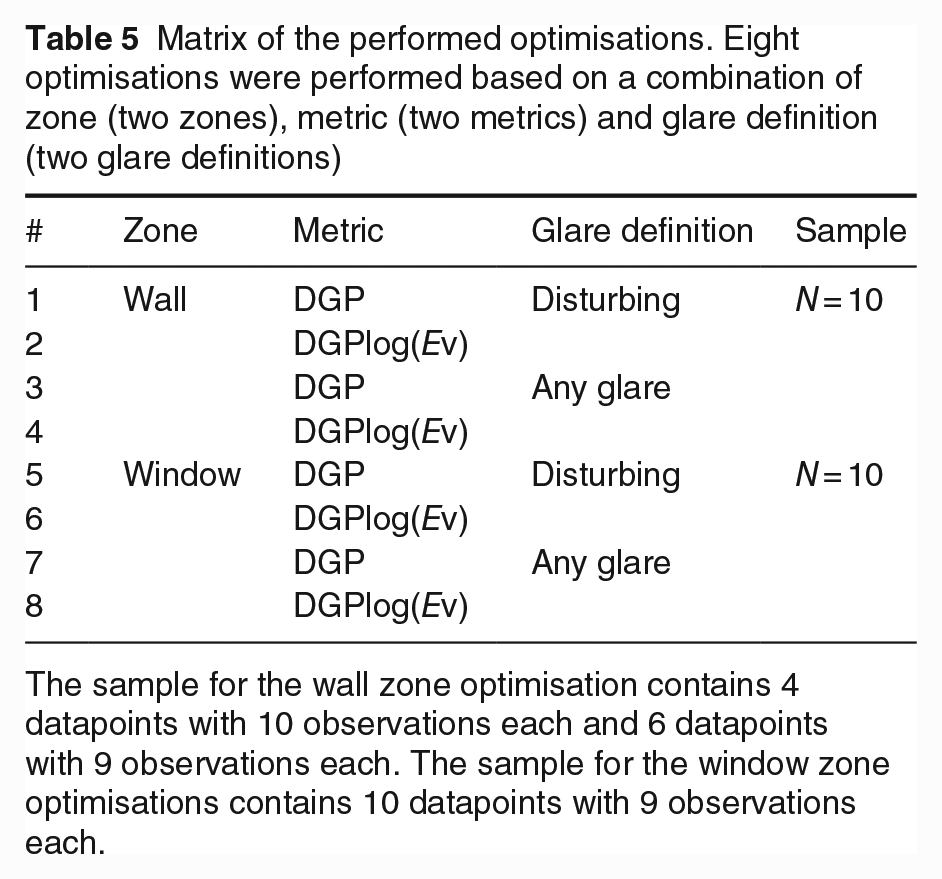
The sample for the wall zone optimisation contains 4 datapoints with 10 observations each and 6 datapoints with 9 observations each. The sample for the window zone optimisations contains 10 datapoints with 9 observations each.
The search for the new set of components c1 to c4 was carried out using a genetic algorithm optimisation approach, a computational technique that mimics the process of natural selection to produce a solution to a problem in a faster and more efficient way than a sequential computational approach. The optimisation was performed using the R programming language for statistical computing, 42 the RStudio development environment 43 and the ‘GA’ package 44 for R. To avoid a negative correlation, the Pearson r value is firstly checked and if r < 0, the equation solution is excluded. As the data need to be regrouped for the testing of each equation, a Cook’s distance function was integrated to check for outliers in the underlying data, with the candidate equation being excluded for a Cook’s distance higher than 1. Figure 5 provides an overview of the optimisation and fitness algorithms.
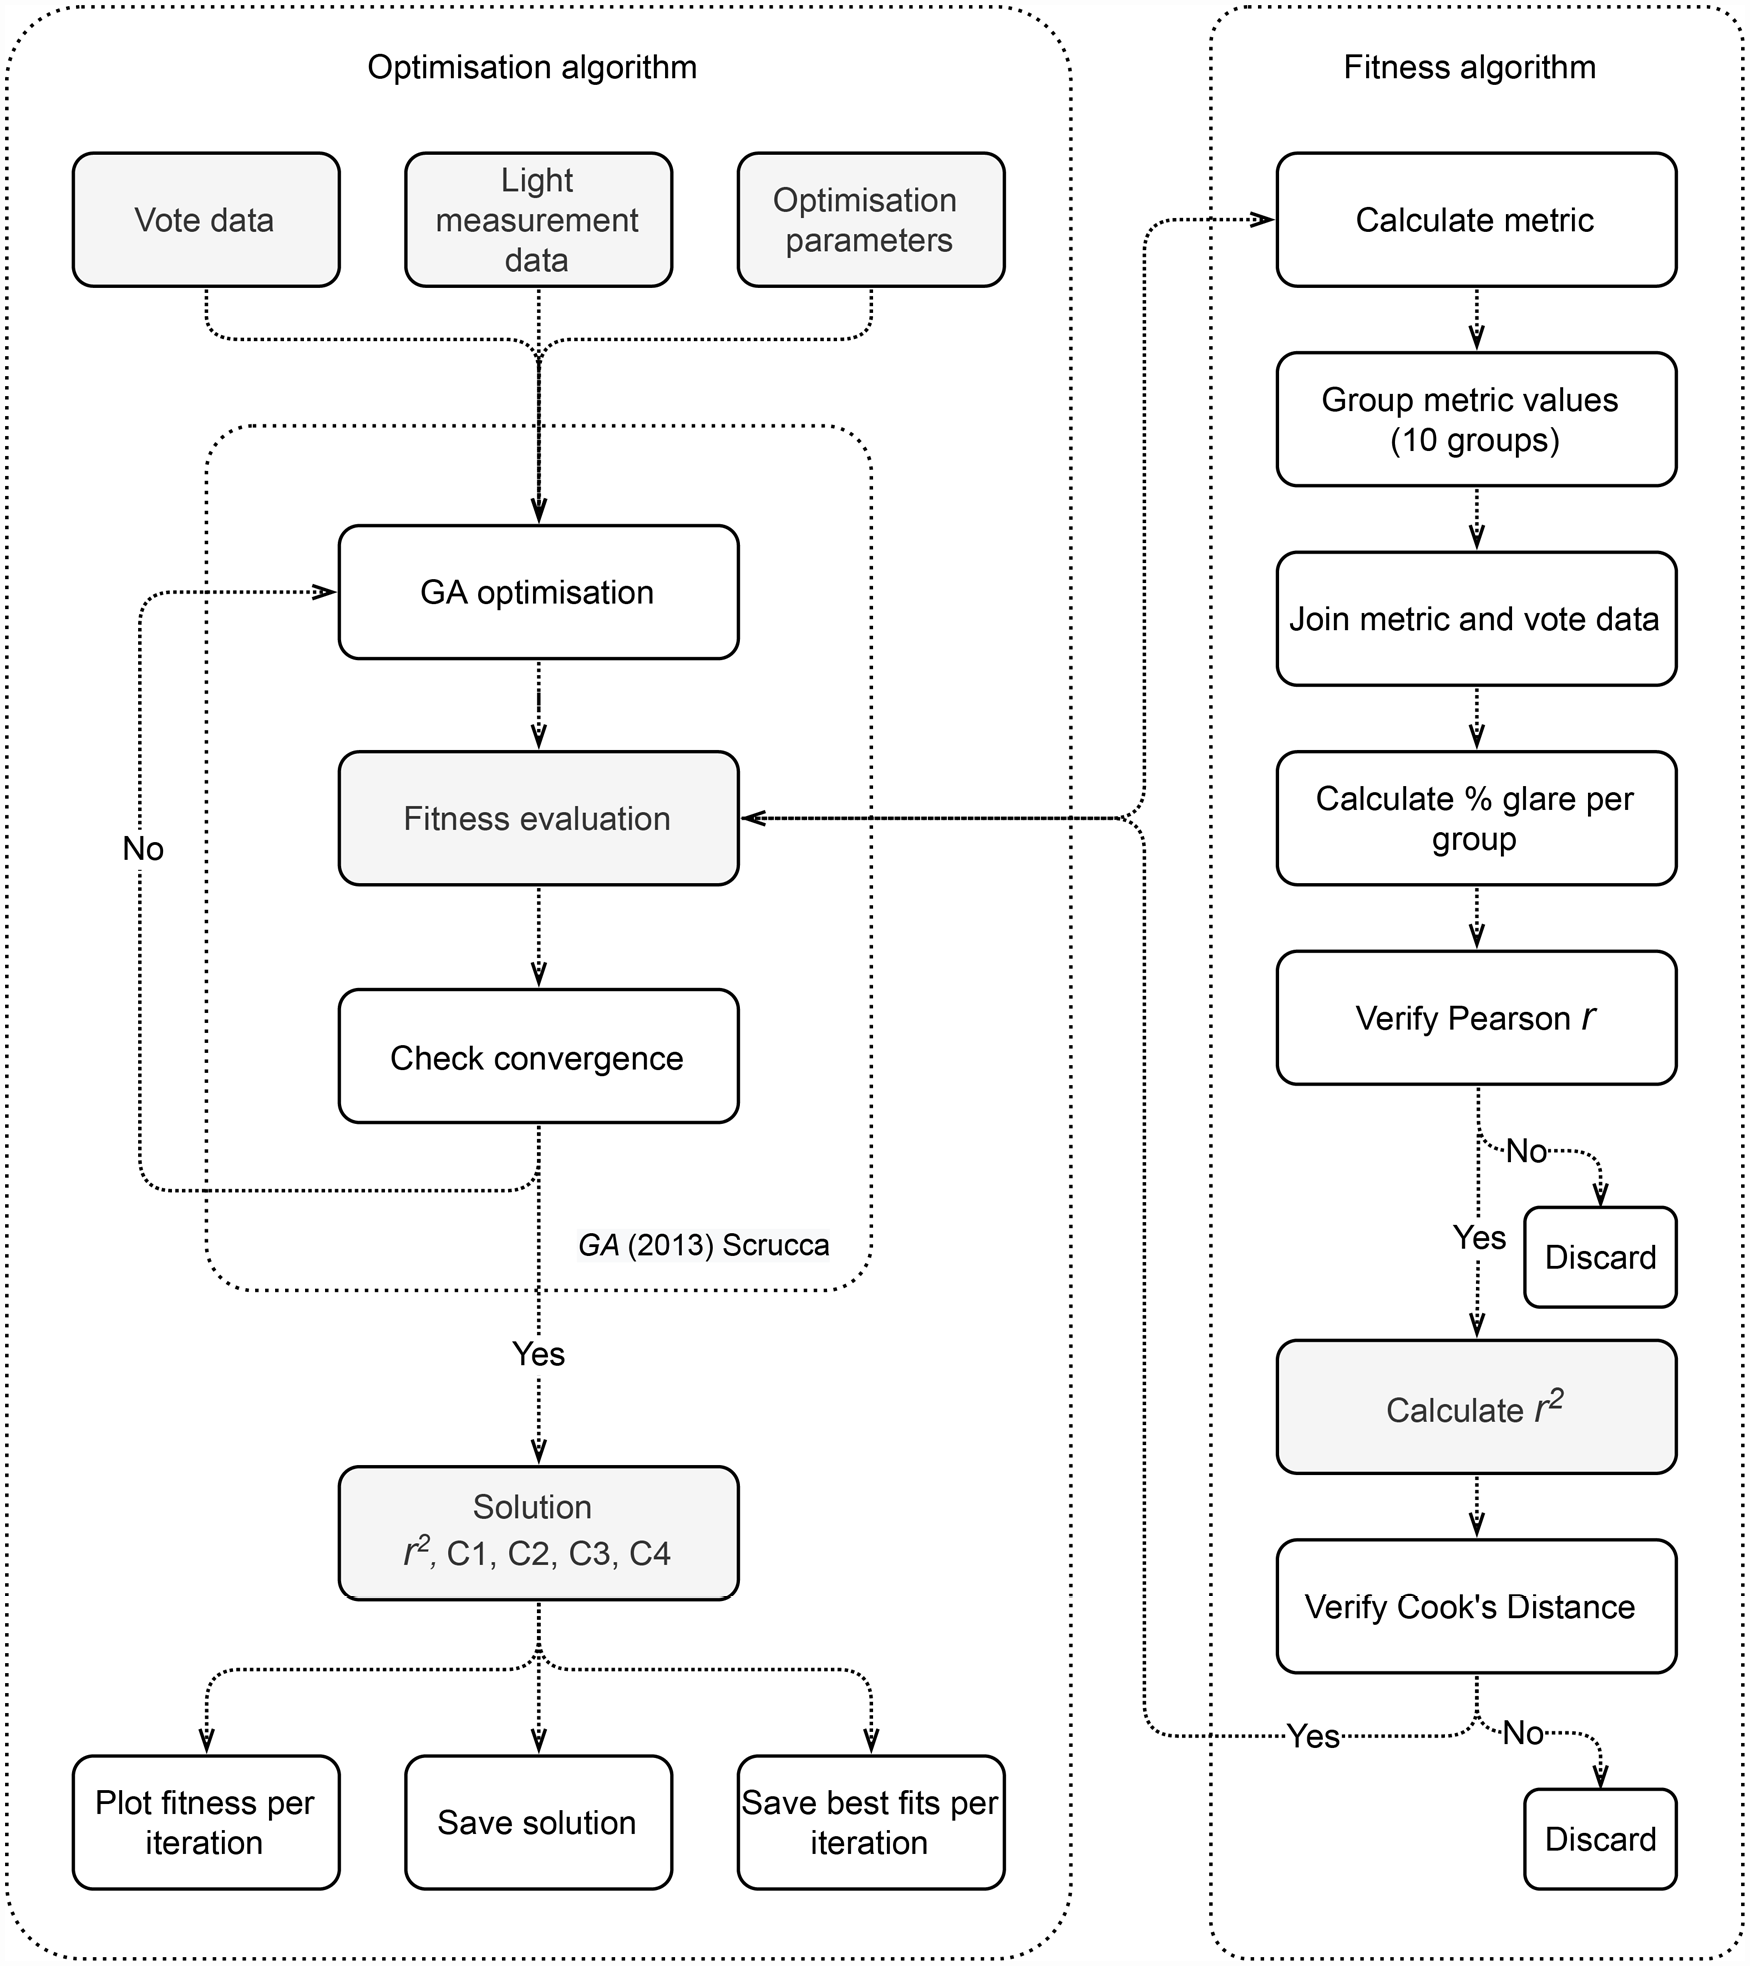
Flow chart of the optimisation and fitness algorithms
4.4 Results of the optimisation
The evolution of the optimisation process was monitored via the convergence plots of the r2 and by plotting the evolution of the c1, c2, c3 and c4 components. The convergence plots showed that the r2 evolved up until iteration number 7200, which means that all cases were properly converged at the number of iterations that was defined for the optimisation (10 000). The result of the c4 presented fluctuations after convergence of the r2 indicating that any change in c4 leads to a change in
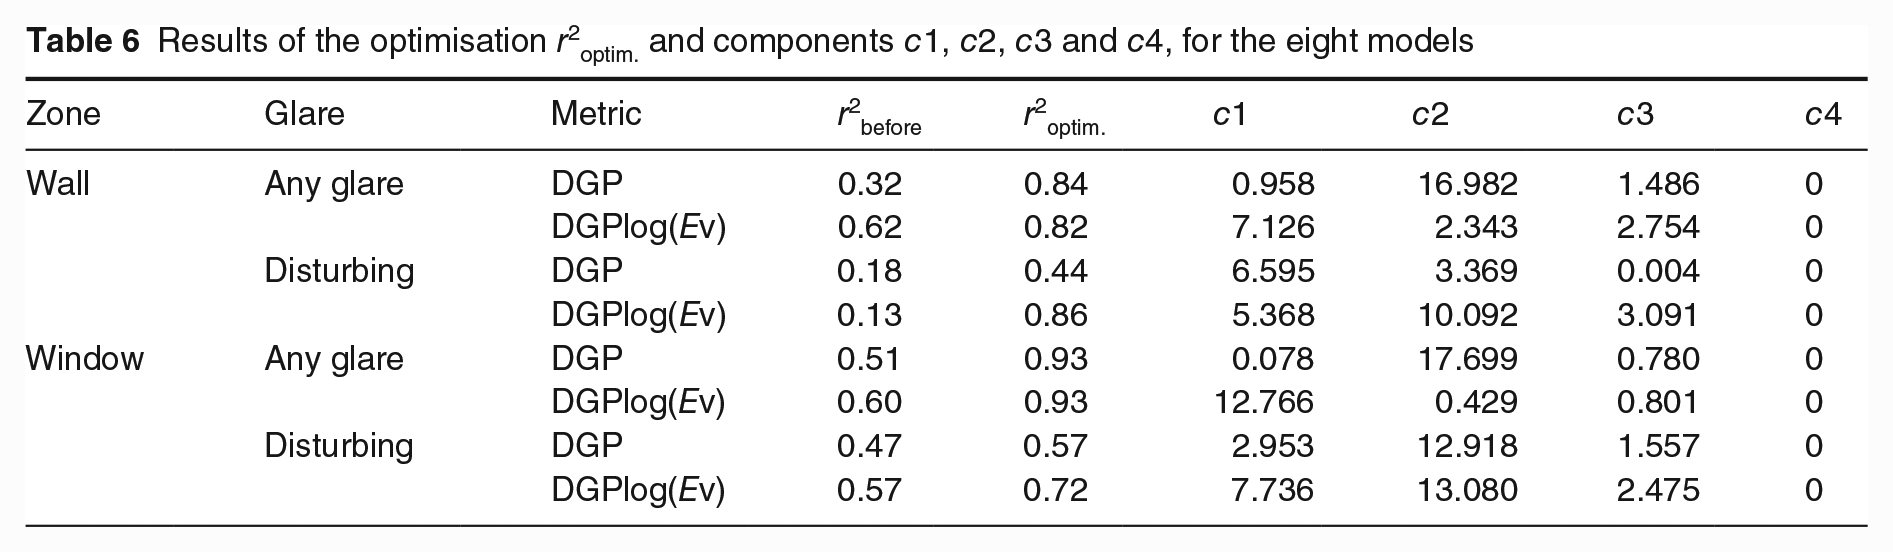
The coefficient of determination r2optim and the components c1 to c4 resulting from the optimisation for the eight different analysis models are presented in Table 6. The coefficients of determination obtained for the original DGP and DGPlog(Ev) equations before optimisation are also plotted for reference (r2before).
Results of the optimisation r2optim. and components c1, c2, c3 and c4, for the eight models
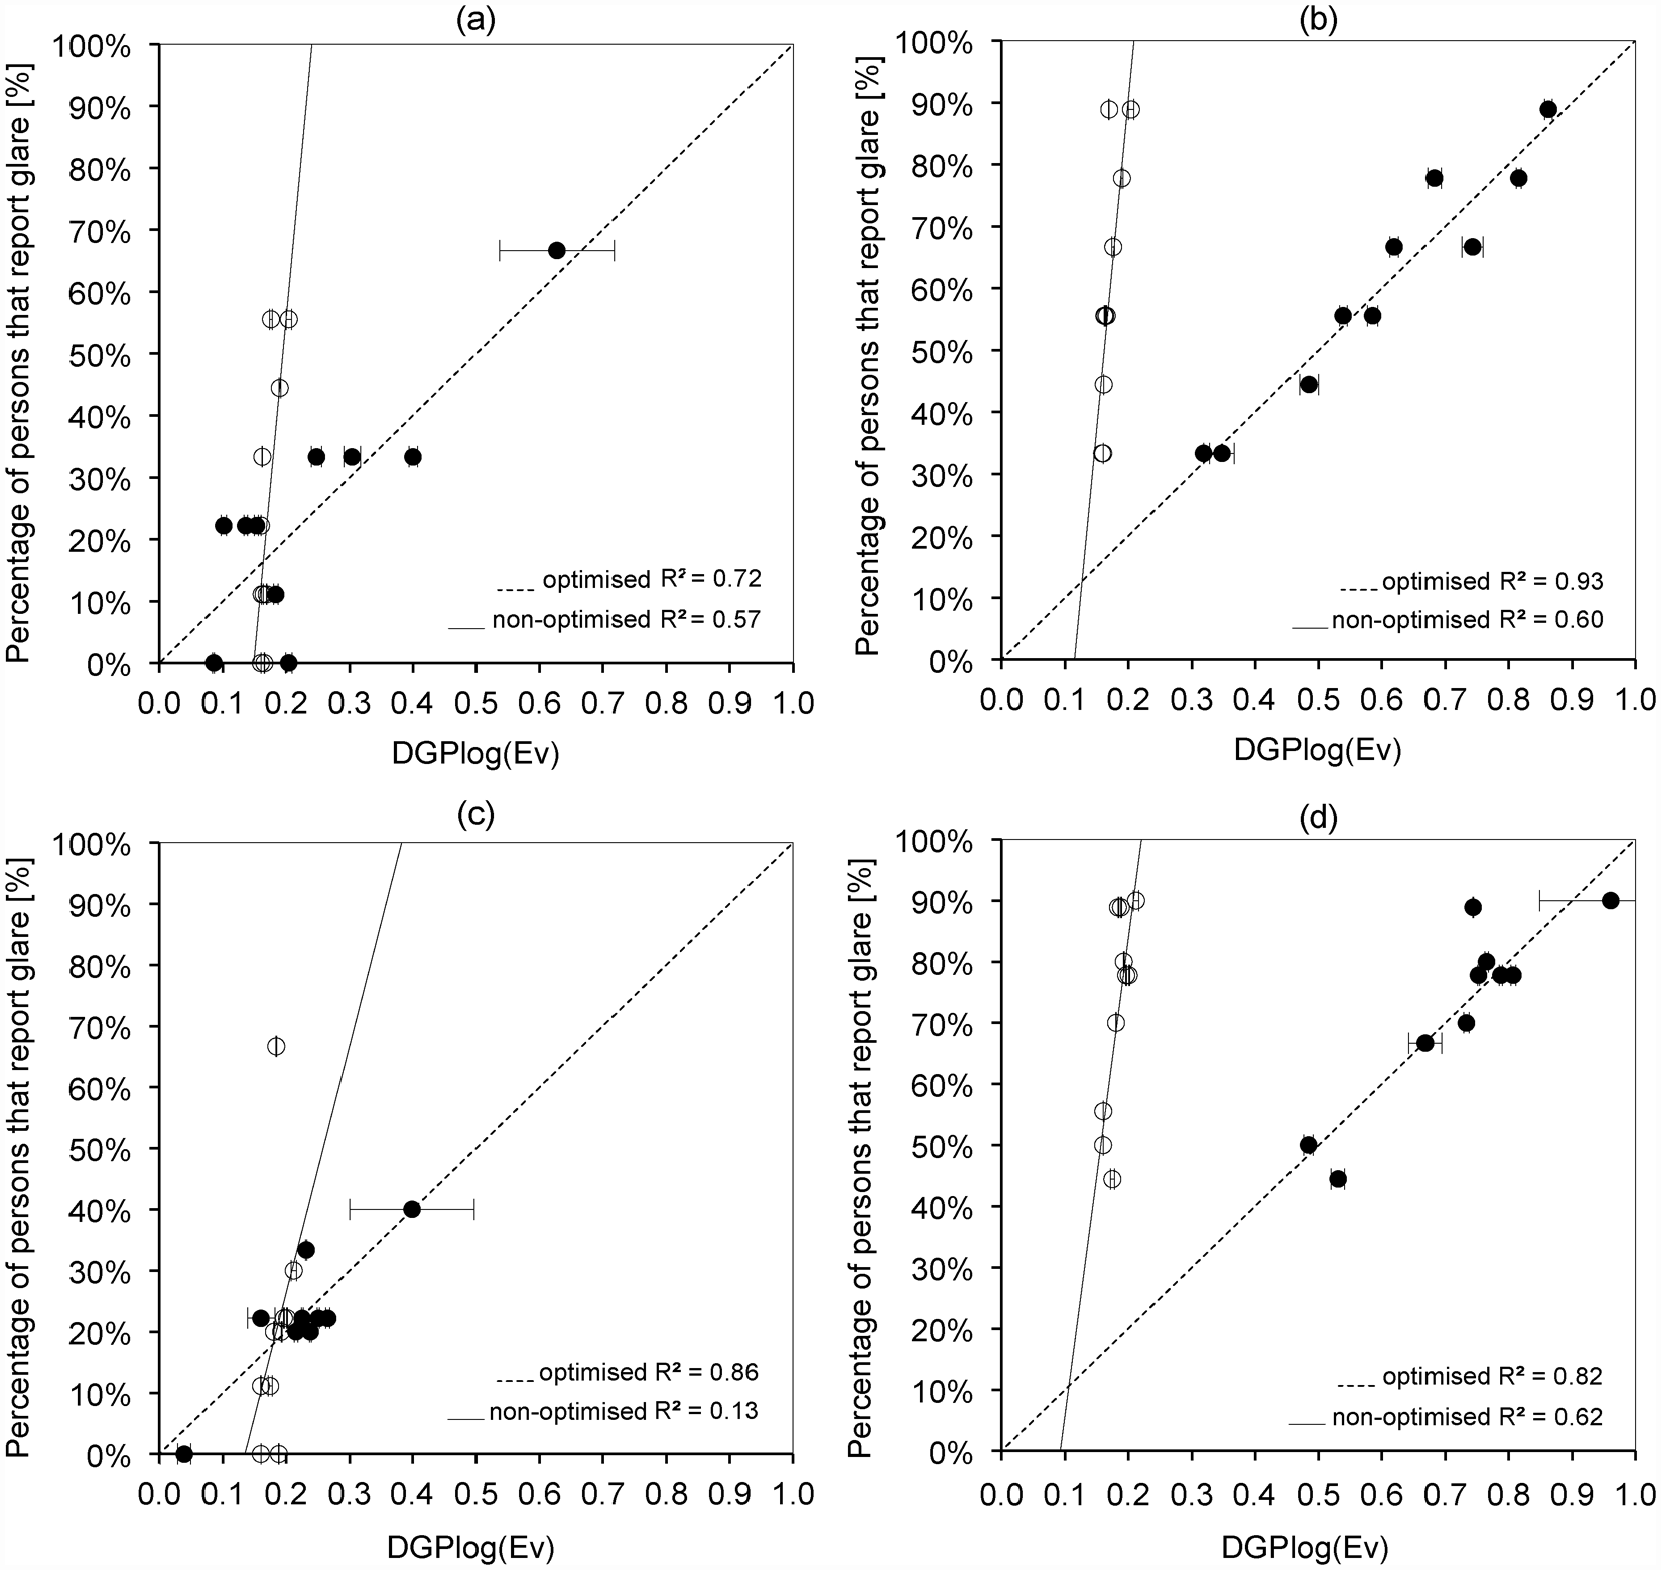
The fitness of the optimised equations is presented in Table 7, and the scatter plots for the regressions can be found in Figures 6 and 7, showing the optimised and non-optimised regression lines and respective r2 values.
Fitness of the models: detailed results of the regressions for the optimised equations
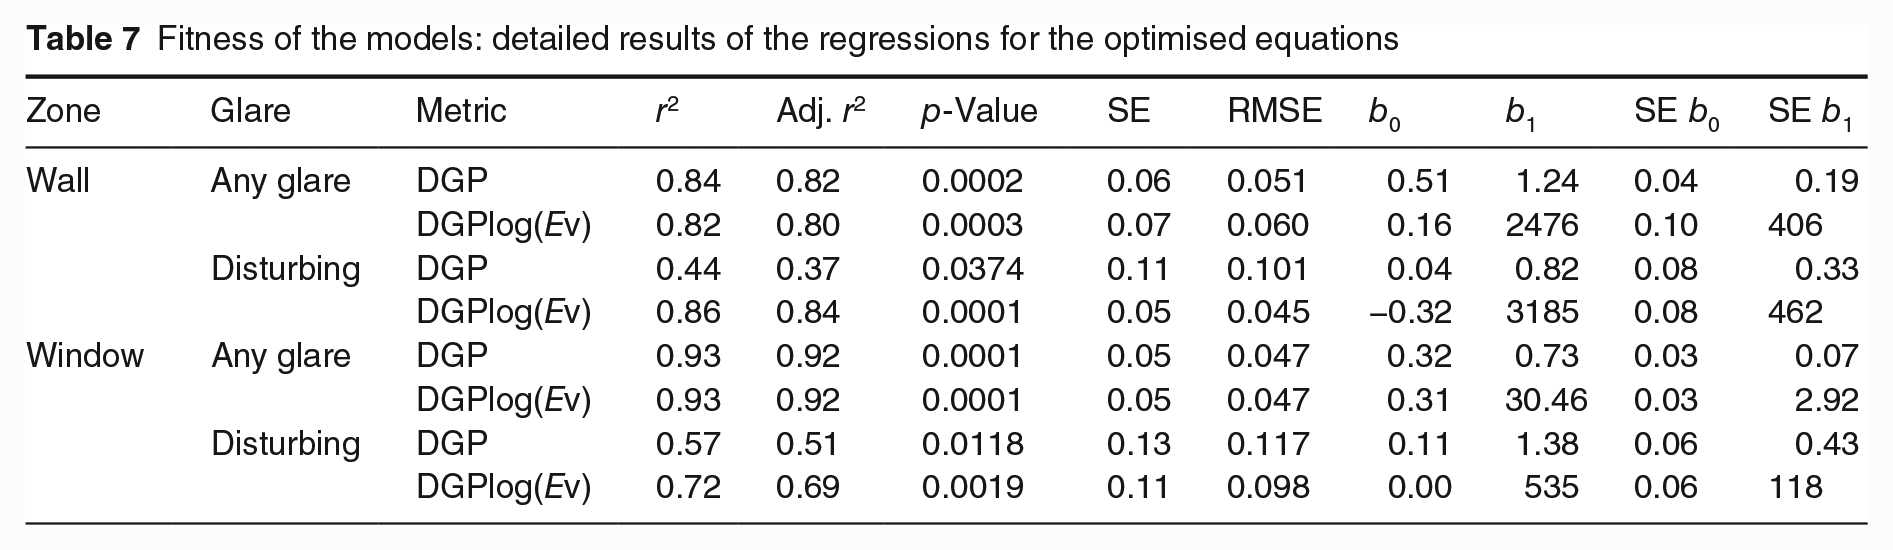
SE = standard error; RMSE = root mean square error
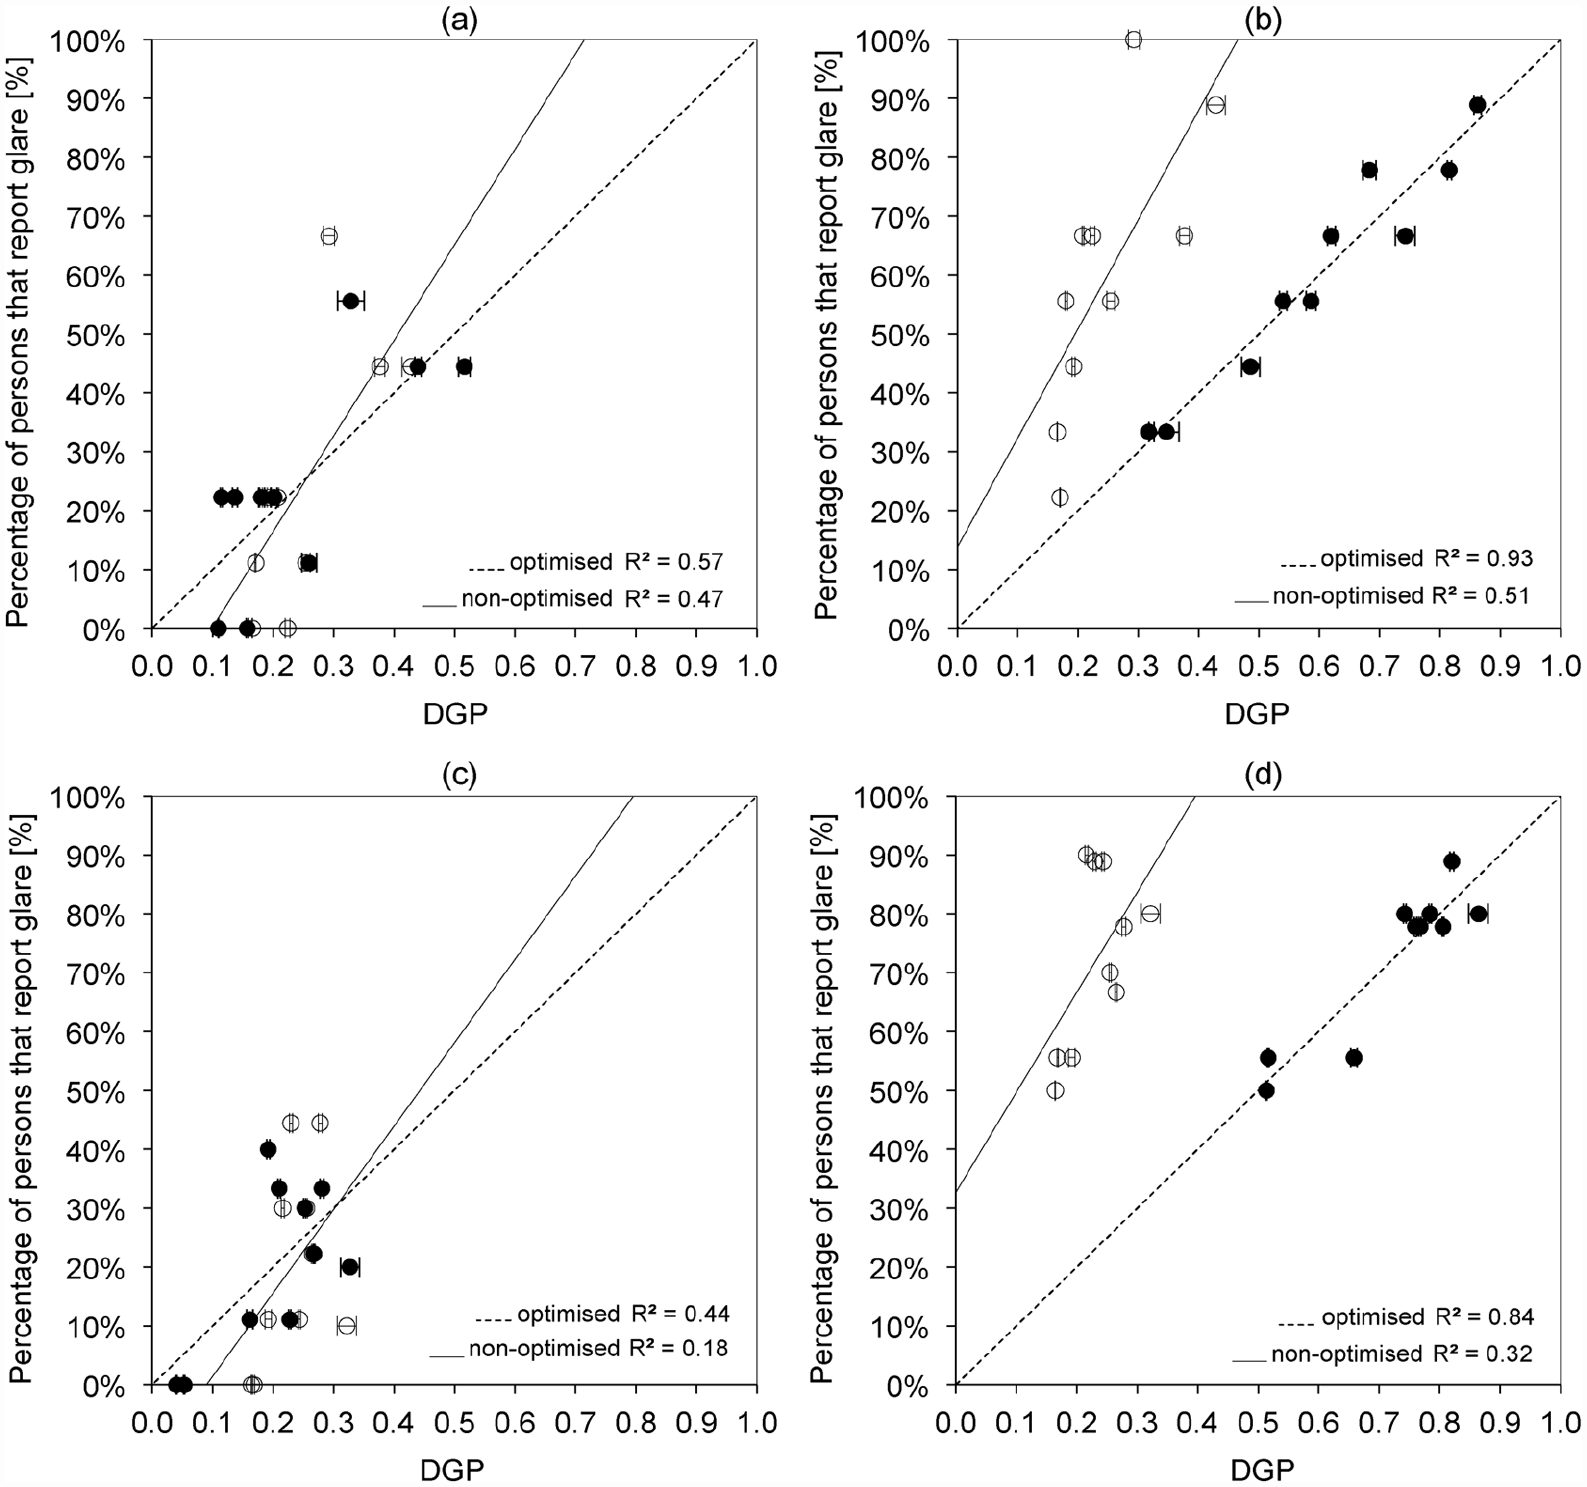
DGP optimised (solid shape) and DGP non-optimised (hollow shape): (a) ‘wall zone and disturbing glare’, (b) ‘wall zone and any glare’, (c) ‘window zone and disturbing glare’ and (d) ‘window zone and any glare’
DGPlog(Ev) optimised (solid shape) and DGPlog(Ev) non-optimised (hollow shape): (a) ‘wall zone and disturbing glare’, (b) ‘wall zone and any glare’, (c) ‘window zone and disturbing glare’ and (d) ‘window zone and any glare’
It can be seen that there is a significant improvement of the coefficient of determination for any of the metric definitions, with the DGPlog(Ev) generally achieving a better result for the ‘disturbing glare’ definition (r2 = 0.86, p < 0.0001 and r2 = 0.72, p = 0.0019) and the DGP showing slightly higher or similar results for the ‘any glare’ definition (r2 = 0.84, p = 0.0002 and r2 = 0.93, p < 0.0001). This indicates that the benefit of the logarithm of Ev over the linear form of Ev is mostly verified for the ‘disturbing glare’ definition. There is, however, a poorer performance of the DGP for the ‘disturbing glare’ definition in the wall zone (r2 = 0.44, p = 0.0374) and in the window zone (r2 = 0.57, p = 0.0118). For that reason it can be said that the DGPlog(Ev) equations provide for a better predictive model overall.
4.5 Deriving the equations
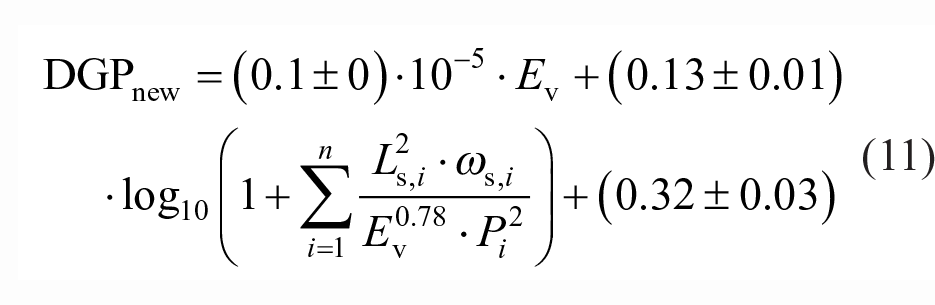
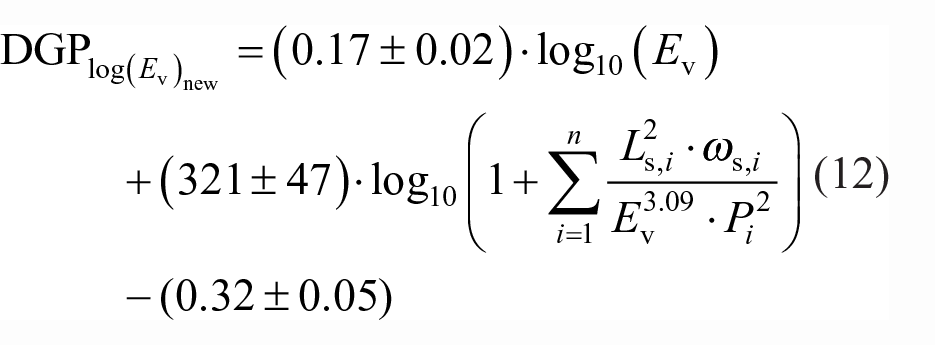
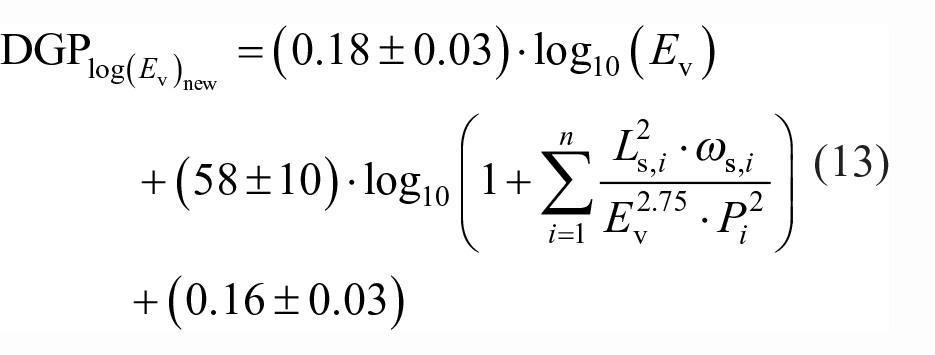
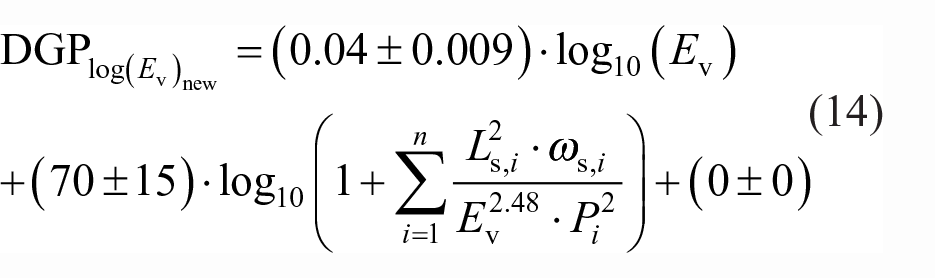
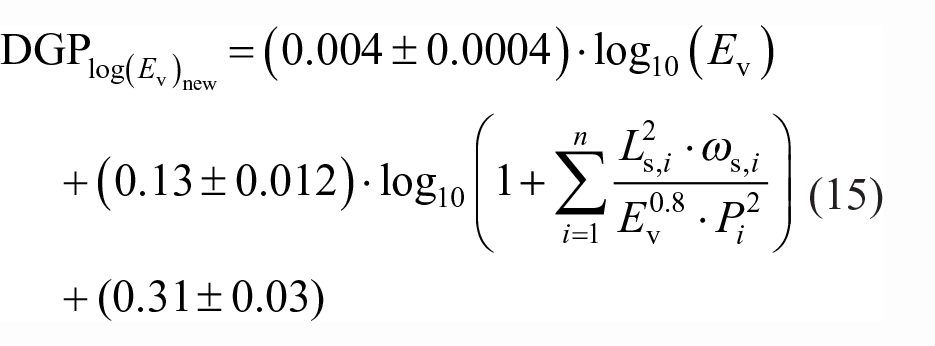
To derive the new equations, the components c1* to c4* are calculated based on the procedure explained in Section 4.3 (Equations (6) and (7)). This step guarantees that the metric values are reported in its original probability of discomfort scale from 0 to 1. Based on this, the derived equations, DGPnew and DGPlog(Ev)new, are as provided below (Equations (8) to (15)). These equations include the standard errors of the components that resulted from the linear regressions, identified by the ± symbol.
For DGPnew,
‘Wall zone and disturbing glare’:
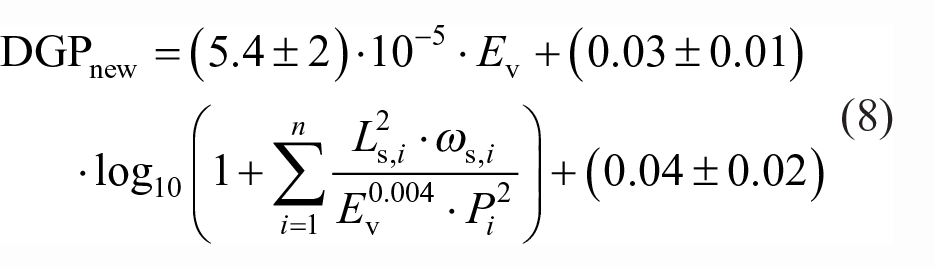
‘Wall zone and any glare’:
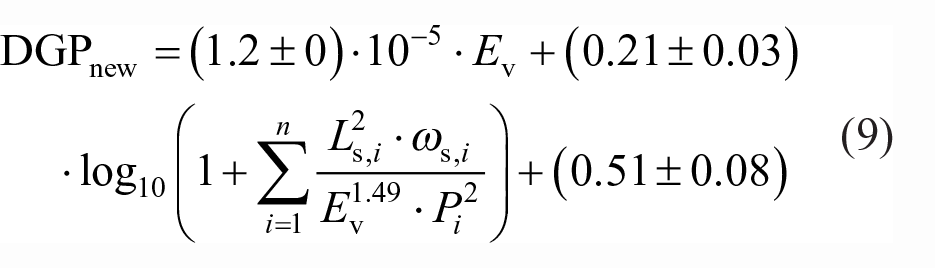
‘Window zone and disturbing glare’:
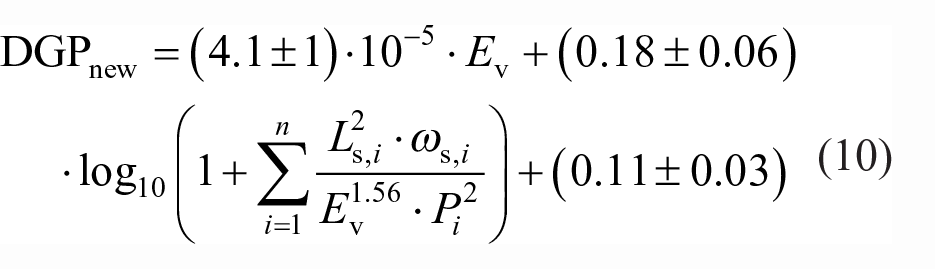
‘Window zone and any glare’:
For DGPlog(Ev)new,
‘Wall zone and disturbing glare’:
‘Wall zone and any glare’:
‘Window zone and disturbing glare’:
‘Window zone and disturbing glare’:
It is observed that for the cases where the optimisation of the DGP is successful, the equations present a much higher c2 and a much lower c1 in relation to the original DGP equation. This indicates that a better prediction of the reported glare occurs when the contribution of the contrast term of the DGP equation is increased and the contribution of the adaptation term is reduced. This is verified for the window zone and for the wall zone equations. The contrast part of the DGPnew equation has a much higher influence on the final value of the metric than the DGP currently accounts for. This is an indication that the discomfort from glare reported in this study results mostly from contrast rather than from saturation glare. The fact that this occurs for the window zone equations is particularly significant, as it seems to indicate that even in the proximity of windows, discomfort from glare can occur not only due to saturation but also due to contrast. In the case of this study the window is either more peripheral in the field of view or seen from a longer distance, compared to the conditions under which the DGP metric was originally developed. The visual field is not dominated by a bright large window but by a much darker background, against which a bright window is seen. This seems to result in a dominating luminance contrast effect. It can be expected that in the situation of real classrooms, where surfaces can be covered with all sorts of media, the luminance contrast effect to be even more accentuated than in the space of this investigation, which had bare walls of a very bright colour.
5. Limitations
The proposed discomfort from glare equations were developed based on a relatively small participant (N = 49) and data sample (N = 184). These equations explain a considerably high percentage of the variation on the reported discomfort from glare of this study, but due to the size of the sample it cannot be said to be representative of the wider student or classroom population. Grouping the data for linear regression also smoothens out individual differences so that the developed equations correspond to an averaged subjective response to discomfort from glare.
The small size of the sample also means that more robust analysis methods such as the ‘train and test split’ approach, which are becoming the state of the art in the field of predictive model development, could not be used in this investigation. Such an approach provides the possibility to test an equation in the process of its development, preventing the possibility of an overfitted solution and providing a test of its generalisability.
The evaluation of discomfort from glare in the positions in the middle of the room was also not part of this study as well as other view directions that may result from different room layouts. The equations therefore apply to the classroom conditions in which the participants are engaged in a board task only. However, as this corresponds to the conditions where there is less opportunity for adaptation, it can be said that the equations apply to the most critical discomfort from glare conditions in the classroom.
In this study, a choice was made to control the ‘variability of gaze’ in order to observe the impact of the ‘variability in space’. However, as in any other type of space and activity, gaze in classrooms can be variable (e.g. looking at board, teacher and tablet), producing a condition of ‘transient adaptation’. This aspect was not part of this investigation. It should also be noted that the duration of the evaluation (3.5 minutes to 4 minutes) might be short for a full adaptation of the participant to each experimental condition, and ideally the experiment would have run for a longer period of time.
6. Conclusion
In this study, it was investigated if the prediction of reported discomfort from glare from daylight in classrooms could be improved based on a modification of the DGP equation. The investigation is based on a search for an equation that produces a better fit to the glare reported by participants in two zones of a classroom space. It is verified that there is a significant improvement of the predictive power of the DGP when the components of the equation are modified, with the contrast term dominating the equation. However, the best improvement is verified when the adaptation term of the equation, based on the vertical illuminance at the eye (Ev), is also modified from a linear to a logarithmic form. Based on this, a modified version of the DGP, the DGPlog(Ev)new, is presented as the group of equations that provide the best prediction of the discomfort from glare for classrooms resulting from this investigation. The DGPlog(Ev)new is based on four equations corresponding to two definitions of glare, ‘disturbing glare’ and ‘any glare’, and two classroom zones, the ‘window zone’ and the ‘wall zone’. It is observed that for the same definition of glare, the new components c1, c2, c3 and c4 of the DGPlog(Ev)new equations differ significantly between the window zone and the wall zone. This suggests that an improved model of discomfort from glare for the classroom is better defined based on a range of equations for different sitting positions or that new variables, that account for sitting position, need to be included in the model.
The study demonstrates that improved equations of discomfort from glare can be created for the conditions of the classroom space, suggesting the need to develop more appropriate discomfort from glare models for this type of space.
Supplemental Material
sj-docx-1-lrt-10.1177_14771535231173291 – Supplemental material for Prediction of discomfort from glare from daylight in classrooms
Supplemental material, sj-docx-1-lrt-10.1177_14771535231173291 for Prediction of discomfort from glare from daylight in classrooms by R Viula, R Bokel and M Tenpierik in Lighting Research & Technology
Supplemental Material
sj-pdf-2-lrt-10.1177_14771535231173291 – Supplemental material for Prediction of discomfort from glare from daylight in classrooms
Supplemental material, sj-pdf-2-lrt-10.1177_14771535231173291 for Prediction of discomfort from glare from daylight in classrooms by R Viula, R Bokel and M Tenpierik in Lighting Research & Technology
Footnotes
Acknowledgements
The authors would like to thank Sylvia Jansen for clarifications regarding statistics, Jorge Gil for support regarding R scripting and all the participants who attended the experiment.
Declaration of conflicting interests
The authors declared no potential conflicts of interest with respect to the research, authorship, and/or publication of this article.
Funding
The authors disclosed receipt of the following financial support for the research, authorship, and/or publication of this article: Raquel Viula was funded by the Portuguese Fundação para a Ciência e Tecnologia (FCT) under the POCH programme, Grant number SFRH/BD/93536/2013.
Supplemental material
Supplemental material for this article is available online.
References
Supplementary Material
Please find the following supplemental material available below.
For Open Access articles published under a Creative Commons License, all supplemental material carries the same license as the article it is associated with.
For non-Open Access articles published, all supplemental material carries a non-exclusive license, and permission requests for re-use of supplemental material or any part of supplemental material shall be sent directly to the copyright owner as specified in the copyright notice associated with the article.