
Abstract
A laboratory experiment was conducted to investigate the alerting effect of light under lighting conditions typical of road lighting. After a 2-h adaptation period, under lighting representing a domestic interior, participants were exposed for a further hour to one of four lighting conditions, with illuminance at the eye and spectral power distribution varied to give a melanopic equivalent daylight illuminance of <0.5 lx to about 10 lx. During this latter phase, half of the participants remained seated, and the other half walked on a treadmill. The dependent variables were reaction time to an acoustic detection task, melatonin levels derived from saliva samples, self-reported sleepiness and skin temperature. The results did not suggest that differences between the four lighting conditions had a significant effect on any of the dependent variables, confirming the results of a previous study conducted on a test track. This suggests that any alerting effect of road lighting is not significant for driving or walking in the evening.
1.Introduction
The intended basis of current road lighting guidance, such as CIE-115:2010 and BS5489-1:2020,1,2 is to meet the visual needs of key road users such as pedestrians and drivers. 3 Research that might contribute includes evidence of the effect of changes in lighting on visual performance,4–8 visual perception9–11 and on indirect measures such as road traffic collisions (RTCs)12–14 or the tendency to use certain modes of travel.15,16
Current guidance, however, is not yet sufficient.3,17 One limitation is that it does not consider the impact, if relevant and substantively significant, of lighting on non-visual functions. We consider here alertness, also known as vigilance, arousal or sustained attention. 18 Alertness describes the activation state of the cerebral cortex and affects the ability to process information: a decrement in alertness means a decline in the performance of tasks requiring attention over an extended period. 19 Alertness is an important issue for road lighting because impaired alertness is associated with an increased risk of involvement in an RTC.20–22
The intrinsically photosensitive retinal ganglion cells (ipRGCs) feed into human responses including alertness. 23 Therefore, using lighting conditions which better stimulate the ipRGC gives the potential for improving alertness.24–27 Such lighting conditions are enhanced levels of light in the short wavelength region, as modelled by the Commission Internationale de l’Éclairage (CIE) using melanopic equivalent daylight illuminance (melanopic EDI), measured in lux. 28
The impact of lighting on alertness was investigated in two studies.29,30 Phipps-Nelson et al. 29 compared the effect of different lighting conditions on subjective and objective indices of sleepiness during prolonged nighttime performance testing taking place in a driving simulator from 23:30 to 05:30 following adaptation starting at 21:00. These two lighting conditions were a narrow band blue light (peak wavelength 460 nm, approximately 1 lx photopic illuminance at the eye and irradiance at the eye 0.02 W/m2) and a broad-spectrum light (peaks at 430 nm and 620 nm, 0.2 lx, and 0.005 W/m2). The melanopic illuminances of these conditions were not reported but suggested by others 31 to be around 12 lx. Results from their acoustic reaction time test suggested significantly faster reaction times under the blue lighting, although this difference was not revealed in the results of salivary melatonin levels nor subjective sleepiness as measured by the Karolinska Sleepiness Scale (KSS). 32
Plitnick et al. 30 investigated the impact of nighttime exposure to changes to the illuminance and spectral power distribution (SPD) of lighting. Their datum was dim red lighting (<1 lx photopic illuminance at the eye and peak wavelength 630 nm); their test lighting conditions were higher illuminances (10 lx and 40 lx) and an alternative SPD (blue light of peak wavelength 470 nm). Compared with the datum, these conditions reduced self-reports of sleepiness (as measured by the KSS and the modified Norris mood scale).33,34 Heart rate, a measure of alertness, 35 was recorded using electrocardiography (ECG), and differing results were found depending on the method of analysis.
For application to road lighting, one limitation of Phipps-Nelson et al. 29 and Plitnick et al. 30 is that their adaptation conditions were a relatively dim light level, followed by exposure to brighter conditions in the test phase. In the evening, a typical pattern of exposure might be the reverse case, relatively bright lighting (in the office or home) followed by relatively dim road lighting. This pattern of exposure was followed by Bhagavathula et al. 36 and that work did not reveal an effect of lighting on alertness.
Bhagavathula et al. 36 asked participants to drive for 2 h (01:00 to 03:00) on a closed loop road under five lighting conditions resembling conditions typical of road lighting (Table 1). This was done after 2 h of adaptation (23:00 to 01:00) to lighting representing indoor home lighting. Their findings did not suggest a statistically significant impact of lighting condition on either of their dependent variables – melatonin levels derived from saliva samples, self-report of sleepiness, or on response to a visual reaction time test. In the reaction time test, participants were asked to detect objects appearing on the roadway ahead: the distance ahead at which objects and their colour were recognised was used to estimate reaction times. Bhagavathula et al. 36 also measured percentage of eye closure and standard deviation of lateral position when driving; neither of those measurements suggested significant effects of lighting.
Lighting conditions reported by Bhagavathula et al. 36
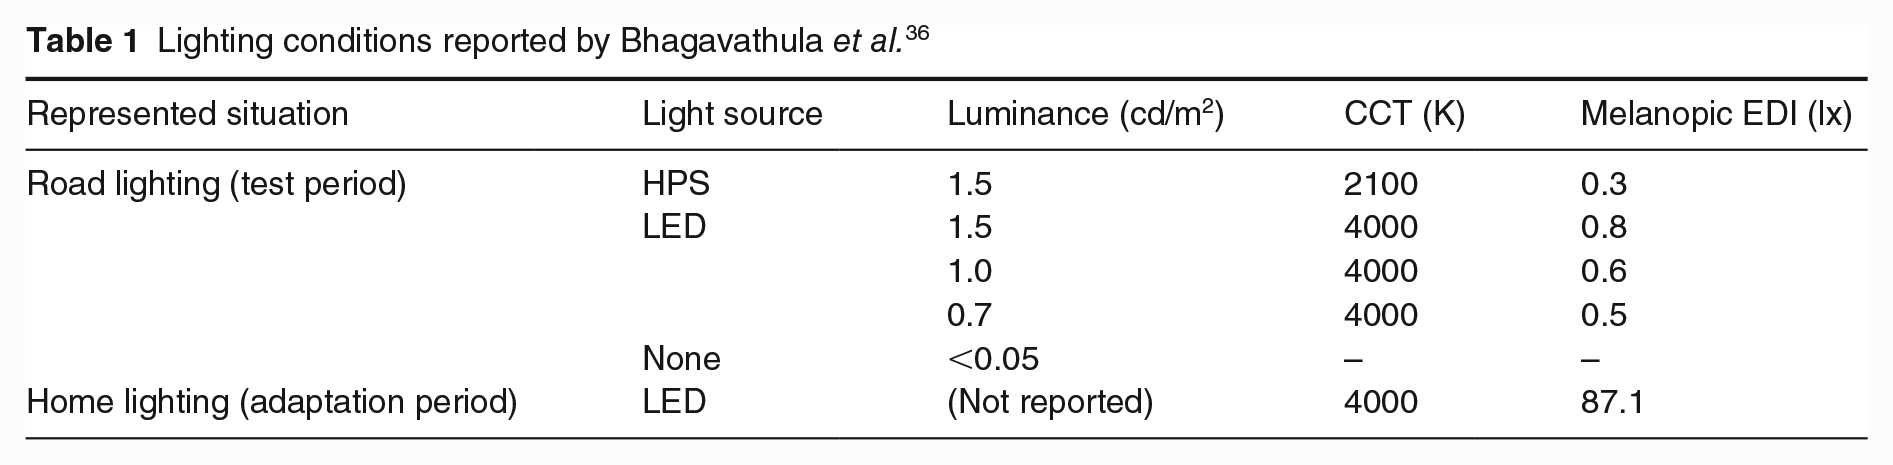
A null finding, such as that from Bhagavathula et al., 36 does not reveal whether there is no effect or whether the experiment failed to reveal a real effect. Bhagavathula et al. 36 used road lighting conditions typical of current practice. It may be that their highest melanopic EDI (0.8 lx) was insufficient to stimulate greater alertness. During this work, test participants were driving, and driving demands a significant cognitive load:37,38 it may be the case that the demands of driving during this experiment outweighed any effect of lighting on alertness measurement.
In the current paper, we report an experiment conducted to verify the results of Bhagavathula et al. 36 by conducting the experiment in a laboratory and including a test lighting condition of higher melanopic illuminance than was used in their study.
2. Method
The effects of change in light level and spectrum on alertness were investigated in a laboratory study in which the light levels and test participant posture were selected to resemble driving and walking.
2.1 Apparatus
The experiment was conducted in a laboratory (Figure 1), a room of dimensions of 3.45 m length, 2.43 m width and 2.8 m height. The walls were white, with a reflectance of approximately 0.81. During trials, the room lighting was switched off and windows were screened to block daylight. The test environment was lit using a pair of light-emitting diode (LED) arrays (THOUSLITE LED Cubes), these having 11 different primary sources allowing the SPD to be finely tuned. The context of this experiment was a person seated at home for 2 h (the adaptation period) followed by a 1 h test period representing a walk or drive. In each test session, there were two test participants. Both remained seated for the adaptation period, but for the 1 h test period, one remained seated to resemble a driver and the other walked upon a treadmill to resemble the physical exertion of a pedestrian.
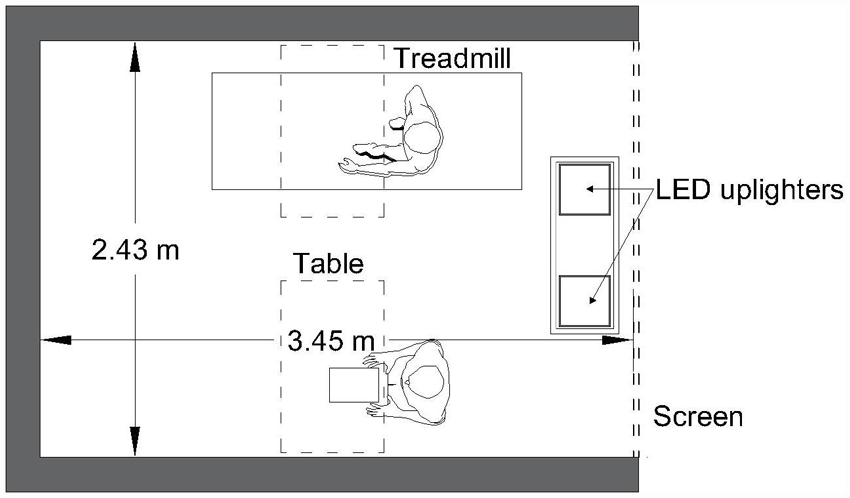
Plan layout of the test environment
2.2 Independent variables
There were two independent variables: the lighting condition (four combinations of light level and SPD) and the participant’s posture (seated or walking) during the test phase.
The lighting conditions are shown in Table 2. The illuminances reported here are vertical illuminance at 1.5 m above the floor, facing the participants’ direction of view. The height of the participant seats were adjustable so that eye heights remained at approximately 1.5 m above the floor level when seated or when walking. The lighting condition for the adaptation period (AD) was chosen to represent the luminous conditions of a typical residential setting.
Light settings (illuminance and SPD-related metrics) used in the adaptation and test conditions
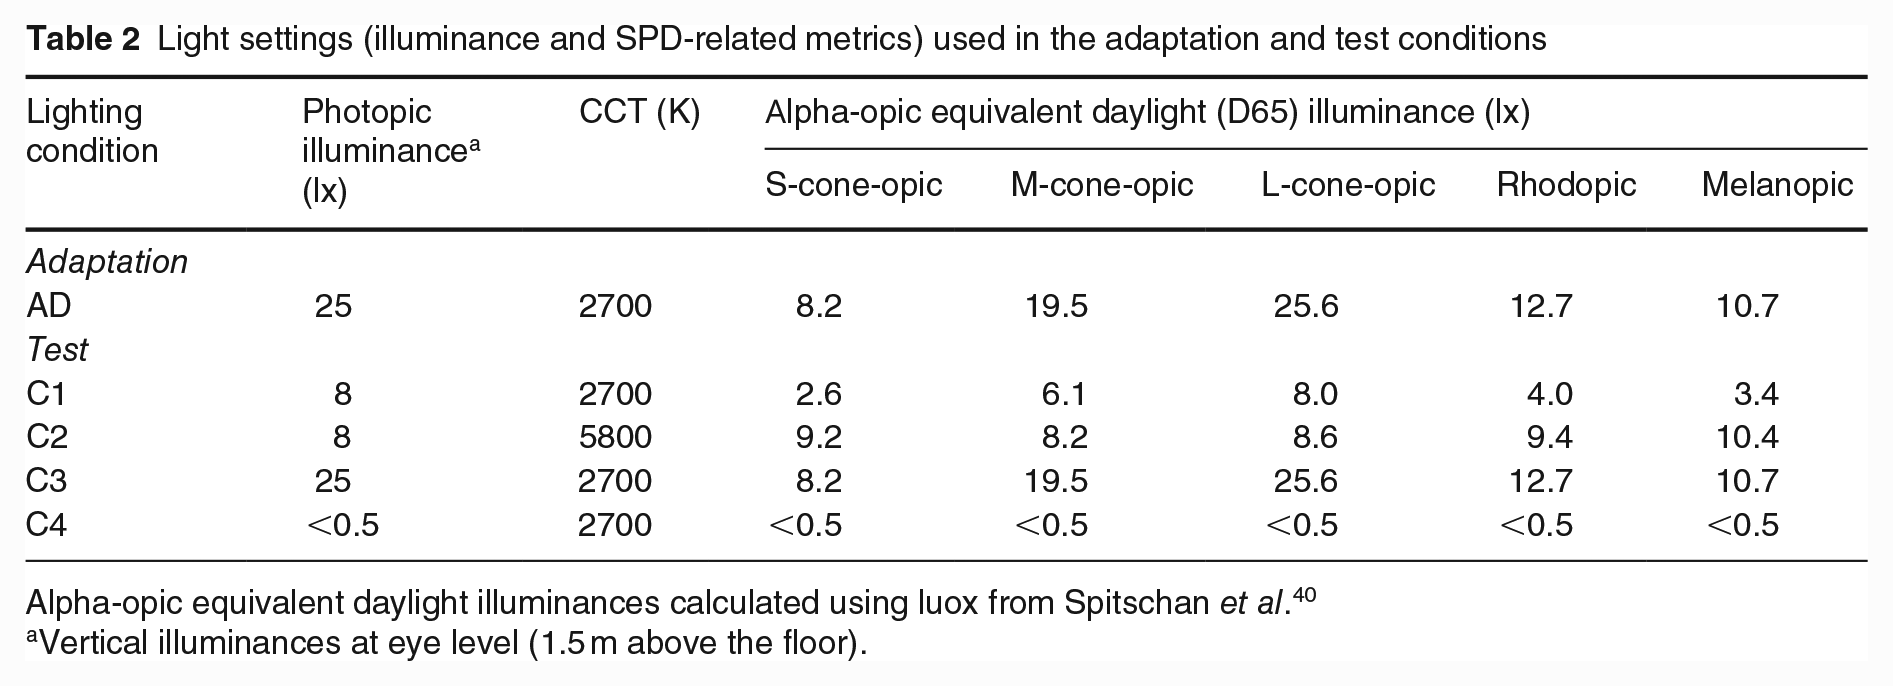
Alpha-opic equivalent daylight illuminances calculated using luox from Spitschan et al. 40
Vertical illuminances at eye level (1.5 m above the floor).
Following the test period, participants were exposed for 1 h to one of four test conditions. The first test condition (C1) used an illuminance within the range of the P-classes for pedestrian environments 1 and subsidiary roads, 2 a lower illuminance but the same SPD as that for the adaptation period. This was a vertical illuminance of 8 lx at 1.5 m above the floor facing the participants direction of view. For outdoor environments, CIE 39 has suggested that adaptation illuminances are estimated as the average horizontal illuminance, which for P-class roads range from 2.0 lx to 15.0 lx. Informal measurement of vertical illuminance on minor and major urban roads revealed a range of 0.5 lx to 30 lx, which confirmed that 8 lx was within the range of likely experience. The second test condition (C2) used the same photopic illuminance as C1, but with the SPD changed to increase the melanopic EDI from 3.4 lx to 10.4 lx. This value was chosen because a melanopic EDI of 10 lx is the maximum recommended for unavoidable activities for the (at least) 3 h before bedtime to avoid melatonin suppression, which would affect sleep quality. 41 The third condition (C3) used the same SPD as C1 but with the illuminance increased to offer similar melanopic EDI as C2. C3 is the same lighting condition as used in the adaptation period. The fourth condition (C4) was a benchmark condition representing an outdoor setting with no road lighting.
2.3 Dependent variables
The effect of changes in lighting and posture was measured using four dependent variables: melatonin level, audio reaction time, self-reported sleepiness and skin temperature.
Melatonin levels were determined from saliva samples, captured using salivettes at intervals of approximately 30 min during the adaptation period and test periods. Participants were required to chew a cotton bud for 1 to 2 mins and then place it into a tube. The tubes were labelled and stored in a freezer set to −20°C. Upon completion of all trials, the samples were packaged in dry ice to reduce degradation and transported to the
Alertness was measured using an auditory psychomotor vigilance test (PVT); in other words, reaction time from onset to detection of an acoustic stimulus (a 1000 Hz tone). This was the version (aPVT-B) developed by Basner et al. 43 but with the inter-stimulus interval ranging from 2 s to 6 s. The loudness of this signal was established at the start of each session to be near the audibility threshold for each test participant: doing so maximises response delay differences between different experimental conditions. 44 The signal was played for 0.5 s at randomised intervals ranging from 2 s to 6 s. Test participants wore headphones and were instructed to press a desk-mounted response button as soon as they heard a stimulus. Trials were conducted in pairs. A different stimulus pattern was delivered to each participant to avoid the other participant’s mechanical action being used as a cue.
Subjective evaluation of alertness was captured using the KSS. This is a 9-point category response scale with the categories labelled from 1 (very sleepy) to 9 (extremely alert). Participants were asked to state their sleepiness level at 30-min intervals throughout the adaptation and test periods.
Skin temperature was measured using temperature sensors (iButtons, DS1922L) attached to each participant at four locations: the neck, both wrists and the shin. After being attached before the start of the adaptation period, the temperatures subsequently measured by these sensors were recorded at intervals of 3 s throughout the 3 h test period. To estimate the representative skin temperature at a specific interval, we first established at each location the average (mean) temperature for the 60 s periods before and after that interval and then determined the mean of the averages at the four locations. As in previous work, 45 room temperature was also measured using an iButton, here with one suspended at a height of approximately 1 m, beside the test participants.
2.4 Procedure
The adaptation period started at 21:00, chosen to be around 3 h before the normal sleep time of the recruited participants. Participants were asked to arrive 45 mins before the adaptation period to enable preparation, with the light condition of this preparation period being the same as that for the adaptation period. They wore their normal clothing and were asked to bring paper-based reading material for the intervals between tests.
Several tasks were undertaken before the adaptation period started. In accordance with ethical approval, participants were first invited to sign the consent form. Two tests were conducted to confirm normal vision. Visual acuity was checked using a Landolt C chart, to ensure an acuity of at least 6/12 with participants wearing their normal corrective lenses, which is the minimum standard for driving in the UK. 46 Colour vision was evaluated using the Ishihara colour plates illuminated by a D65-simulating source. The four iButton temperature sensors were fixed onto the skin with adhesive tape. The participants were seated at their chairs for the adaptation period. The choice of seated or walking for the test period was initially assigned at random by drawing lots from a sealed bag, but towards the end of the experiment, this was assigned by the experimenter to assure a gender-balanced participant assignment.
Each participant’s hearing threshold was measured by presenting in random order a series of tones of different loudness, with the participant instructed to press a button upon detection. The loudness threshold was estimated as that associated with a 50% detection rate. For the PVT test, the loudness of the tone played to a test participant was their estimated hearing threshold, increased by 10 dB, an increase which is perceived to be about twice as loud. 47 Headphones were worn for this threshold assessment and subsequently for the PVT trials.
Within the adaptation period and the test period, the dependent variables were recorded at regular intervals. Saliva samples, PVT and KSS were recorded at intervals of approximately 30 mins.
The PVT test was split into two 3 min blocks, one immediately before and one immediately after the interval point at which salvia samples and the KSS evaluation were taken. The results of both 3 min blocks were considered as one, having responses to typically approximately 60 stimuli. Since these data were not found to be normally distributed, the reaction time for a given test interval was characterised using the median reaction time.
The measurement points for the KSS, the saliva samples and the PVT were centred on minutes 5, 30, 60, 90 and 110 in the adaptation phase and minutes 10, 30 and 60 in the test phase. The intervals were labelled AD1 to AD5 in the adaptation phase and T1, T2 and T3 in the test phase. In the adaptation phase, at minutes 30 (AD2) and 90 (AD4), the KSS and saliva samples were recorded, but the PVT test was not conducted. Skin temperature was recorded continuously and subsequently interpolated for the two-minute period centred on those same points.
After 2 h from the start of the adaptation period, the light setting changed to one of the four test conditions (Table 2), and one participant changed from being seated to walking on the treadmill. The treadmill was set to comfortable walking speed (as chosen by the participant; ranged between 1.2 km/h and 2 km/h). The measurement schedule in the adaptation period was set so that the second part of the final PVT test was completed just before the change in lighting condition.
2.5 Sample
Participants were recruited through emails posted on volunteer recruitment lists to staff and students of the university. Participants were selected from those meeting the following criteria: aged between 18 years and 30 years; healthy (assessed using self-report of no short- or long-term medication, regular sleep, non-smoker, no history of mental or physical health issues); habitual bedtime not later than midnight; not employed for nighttime shift work in the past year and not having travelled over a time zone in the past 3 months.
Forty participants were recruited, with 10 (five males and five females) allocated to each of the four test conditions. Their mean age was 22.1 years. Participants were asked to keep a steady sleep–wake schedule for the 7 days prior to the experiment, and this was confirmed through a self-reported sleep–wake diary for that period. On the day of their experiment, participants were asked to not eat bananas or chocolate during the day, nor take any medication, 48 to avoid consuming substances after midday, which contain alcohol or caffeine, and to refrain from napping: otherwise, these might influence the melatonin analysis. During the experiment, participants were provided with a range of snacks including pure orange juice, nuts and water. Participants were paid £40 upon completion of the experiment.
3. Results
3.1 Data normality
The data recorded for each dependent variable were first examined to determine whether they were drawn from a normally distributed population. This was done by four methods of analysis: comparing measures of central tendency, graphical representations (histogram and box chart), measures of dispersion (skewness and kurtosis) and statistical tests (Shapiro–Wilks and Kolmogorov–Smirnov tests). The results suggested that skin temperatures and PVT reaction times were normally distributed, but melatonin levels and KSS ratings were not.
3.2 Melatonin levels
Figure 2 shows the median melatonin levels at each test interval. Melatonin is a hormone that helps to regulate the diurnal sleep–wake cycle: high levels of melatonin are secreted by the pineal gland during the dark phase of the day and low levels during the light phase.49,50 It would therefore be expected that melatonin levels would progressively increase as the measurement interval approached habitual bedtimes, and that is the finding shown in Figure 2. The Friedman test indicated a statistically significant difference in melatonin levels (p < 0.0001).
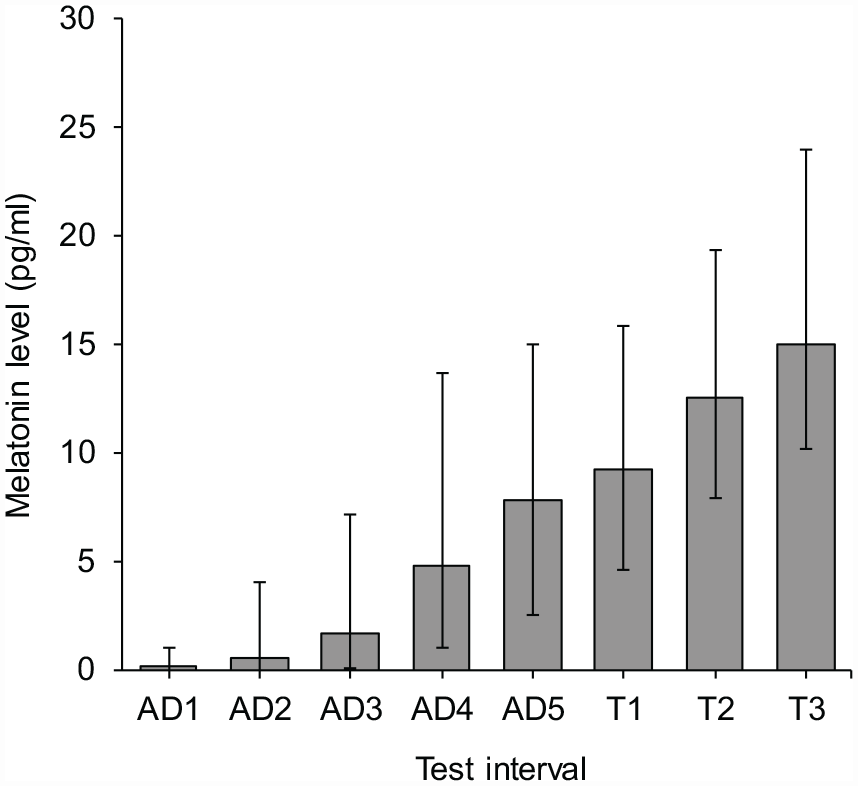
Median melatonin levels derived from saliva samples collected at each test interval. Error bars show the inter quartile range (IQR)
The effects of light condition and posture were tested using the Kruskal–Wallis test. This did not suggest significant effects of lighting condition during T1, T2 or T3 (p ⩾ 0.837 in each case). As a control, the effect of light condition was also checked in the adaptation phase, where the four groups experienced identical lighting conditions: this also did not suggest a significant difference between the groups (p ⩾ 0.414 in each case). For posture, the Kruskal–Wallis test did not suggest a significant effect at any interval in the test phase (p ⩾ 0.433 in each case).
3.3 Self-reported sleepiness
Figure 3 shows the median KSS scores at each test interval. As expected, these decreased as the measurement interval approached habitual bedtimes – a tendency to report feeling more sleepy. The Friedman test indicated that this change was statistically significant (p < 0.0001).
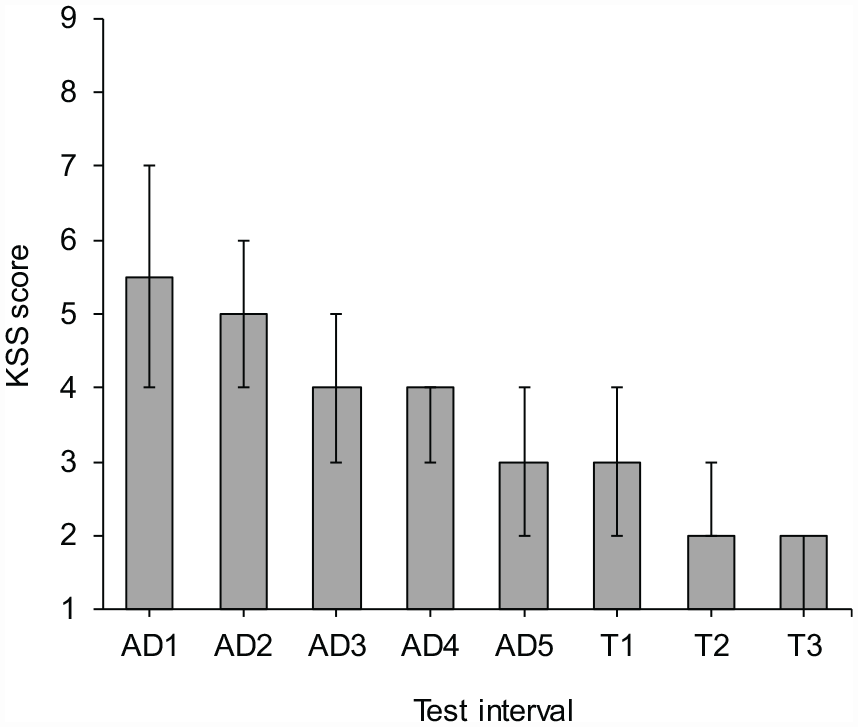
Median KSS scores reported at each test interval. Error bars show the IQR
The effects of light condition and posture were tested using the Kruskal–Wallis test. This did not suggest significant effects of lighting condition during T1, T2 or T3 (p ⩾ 0.662 in each case). Comparison across the relevant samples in the adaptation phase, where the lighting condition was constant, also did not suggest a significant effect (p ⩾ 0.455 each case).
For posture, the Kruskal–Wallis test suggested effects of near statistical significance at T1 (p = 0.056) and T2 (p = 0.091) but not at T3 (p = 0.208). As shown in Figure 4, this was a tendency for the seated participants to report being more sleepy than the walking participants. During the adaptation phase, the test did not suggest a significant effect at any interval (p ⩾ 0.244 in each case).
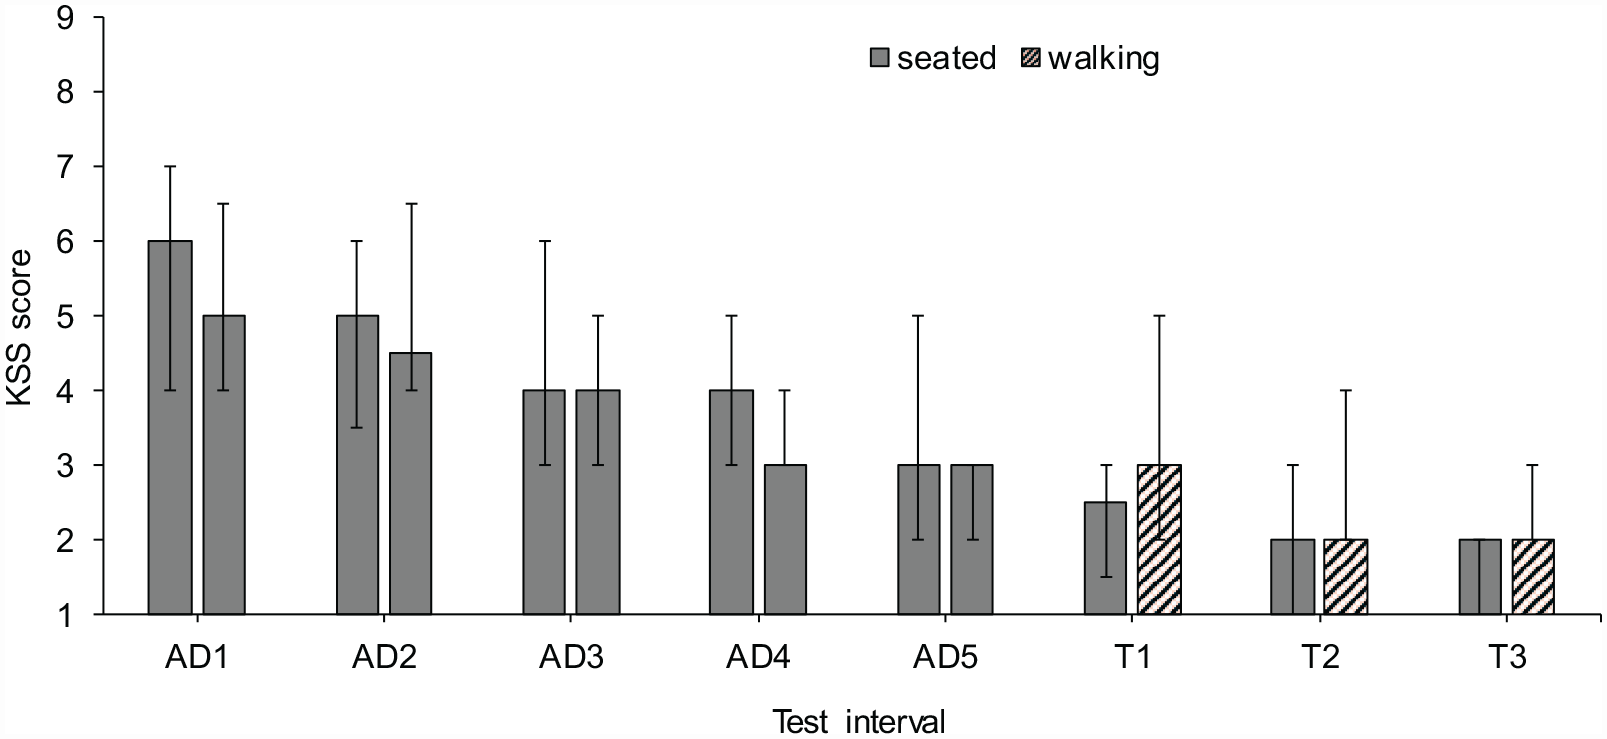
Median KSS scores reported at each test interval according to whether the test participant was seated or walking during the test phase. Error bars show the IQR. Note: During adaptation phase all participants were seated
3.4 Psychomotor vigilance test
Figure 5 shows the mean reaction times at the six test intervals where this was measured (AD1, AD3, AD5, T1, T2 and T3). This indicates a slower reaction time at AD1 than at the other test intervals. Analysis of the data using a repeated measures analysis of variance (ANOVA) suggested a significant effect of test interval (F(2.299, 73.560) = 5.947, p = 0.003, Greenhouse–Geisser correction). Pairwise comparison suggested a difference only between the first and subsequent intervals (p < 0.05). The interactions between trial and light condition, and between trial and posture, were not suggested to be significant (p = 0.602 and p = 0.271 respectively). The analysis was repeated for only the three test sessions (T1, T2 and T3) where light condition and posture were varied. This did not suggest significant main effects of trial (p = 0.825), light condition (p = 0.15) nor posture (p = 0.587) nor did it suggest significant interactions.
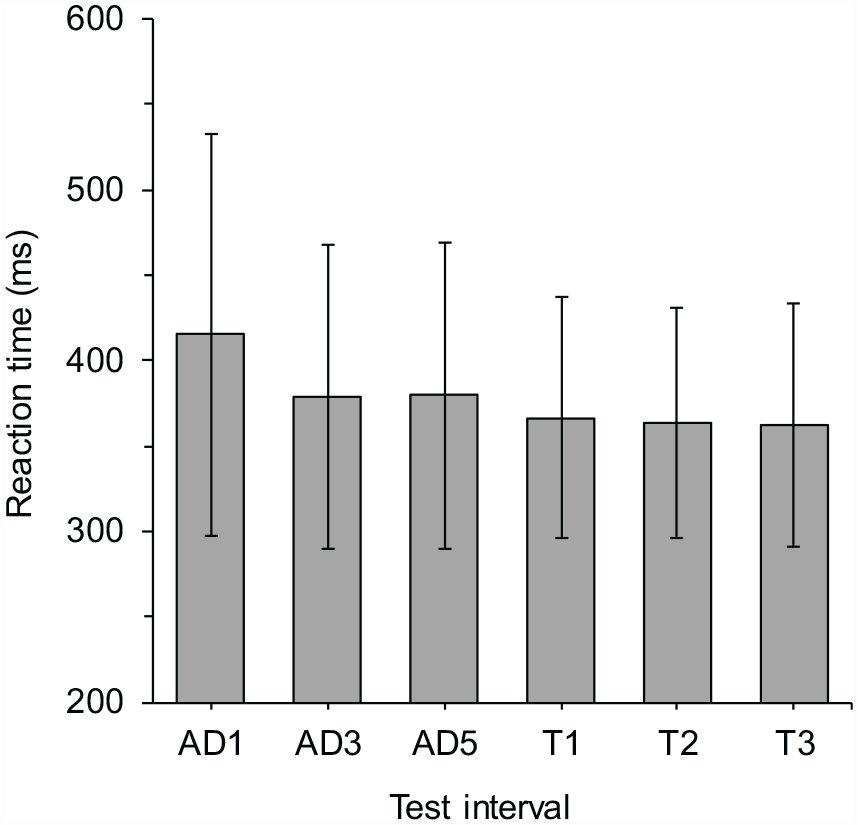
Mean reaction times at each test interval as measured using the acoustic PVT. Error bars show one standard deviation above and below the mean
3.5 Skin temperature
Figure 6 shows the mean skin temperature at each interval. Across the 3 h period, analysis of the data using a repeated measures ANOVA suggested a significant effect of test interval (F(3.924,125.553) = 4.427, p = 0.002, Greenhouse–Geisser correction). Pairwise comparisons suggested there were differences between just two pairs: T1 versus AD2 (p = 0.015) and T1 versus AD5 (p = 0.042). The interaction between trial and posture was not suggested to be significant (p = 0.393), but it was significant between trial and light condition (p = 0.034).
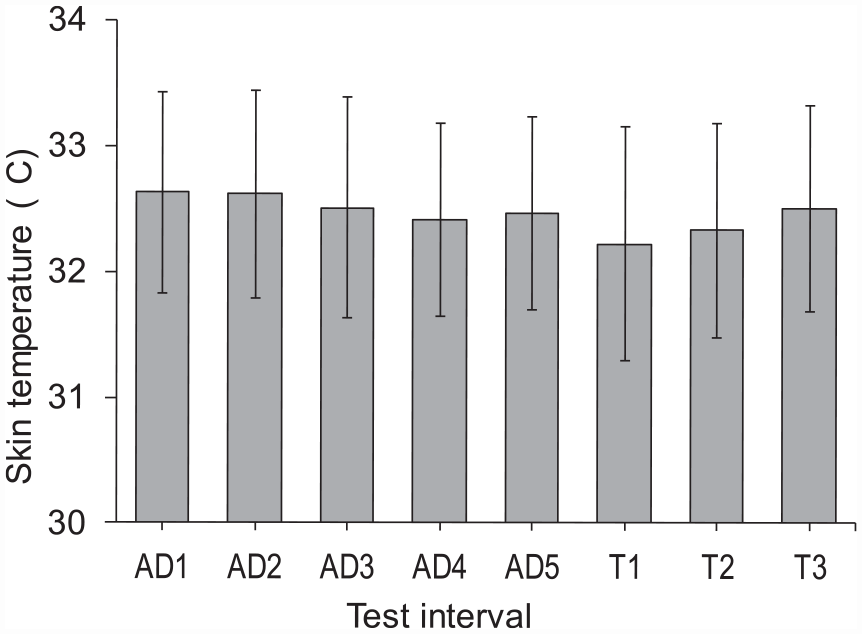
Mean skin temperature at each test interval. Error bars show one standard deviation above and below the mean
To investigate the effect of change in lighting condition (C1 to C4) and posture (seated vs walking) the ANOVA was repeated for evaluation intervals T1, T2 and T3. This suggested significant main effects of trial (F(2,64) = 6.225, p = 0.003), Pairwise comparison suggested a difference only between T1 and T3 (p = 0.009). The interactions between trial and light condition, and between trial and posture, were not suggested to be significant (p = 0.393 and p = 0.106, respectively).
Average temperature in all sessions was 23 °C, ranging from 20.9 °C to 24.1 °C in specific test sessions. Within any one test session, the air temperature varied by an amount from near 0 to 1 K, with an average variation of 0.6 K.
4. Discussion
In this work, investigating road lighting in the evening, changes in the state of alertness were measured using four dependent variables.
At successive test intervals, there was a significant increase (p < 0.0001) in melatonin level (Figure 2) and a significant increase (p < 0.0001) in self-reported sleepiness (Figure 3); these are the expected changes.49,51 Results of the acoustic PVT suggested a learning effect, with a slower reaction time in the first trial (AD1) than in latter intervals, but did not suggest significant differences in reaction times between those other intervals. While analysis of the skin temperature data suggested a significant change with test interval, these changes did not appear to be systematic.
Neither the melatonin level, the KSS, the PVT nor skin temperature suggested an effect of light condition. These results therefore confirm the earlier findings of Bhagavathula et al. 36 These results suggest that lighting conditions within the range currently recommended 1 are not sufficient to influence alertness in drivers or pedestrians and hence lead to a reduction in RTC risk.
For posture, self-reported sleepiness was higher for the seated participants than for the walking participants to an extent that nearly reached statistical significance at T1 (p = 0.056) and T2 (p = 0.091). Neither melatonin level, reaction time in the PVT test nor skin temperature suggested an effect of posture.
The highest melanopic EDI used in this work was approximately 10 lx (Table 2). While this was a value higher than that used by Bhagavathula et al., 36 being the recommended maximum threshold for the 3 h before bedtime to avoid melatonin suppression, 41 it may not be surprising that no effect on alertness was found. The walking speed in the current work was self-chosen by test participants to be comfortable, but the speeds chosen (ranging from 1.2 km/h to 2 km/h) were lower than typical walking speeds for adults aged 20 years to 29 years (4.5 km/h to 5.2 km/h). 52 A faster walking speed can increase physical arousal which in turn can lead to better performance on secondary cognitive tasks, such as reduced reaction time,53,54 despite the expected negative effect of dual-tasking, 55 and the relationship is not revealed in all work. 56 For the current work, this suggests that a change from self-chosen walking speed to one more representative of typical walking might affect performance in the PVT task. In further work, it would be interesting to investigate whether increases in the EDI of lighting and/or the walking speed change the conclusions drawn here about the effect of changes in lighting conditions on measures of alertness. Similarly, to better represent natural driving, further work might include a more challenging cognitive load than the relatively monotonous conditions of the current work.
5. Conclusion
A laboratory experiment was conducted to investigate the effect on alertness-related measures of different lighting conditions, these chosen to represent outdoor lighting. The four test conditions presented melanopic equivalent daylight illuminances of approximately <0.5 lx to 10 lx, and this was not sufficient to reveal significant differences in reaction time to an acoustic stimulus, melatonin levels derived from saliva samples, self-reported sleepiness nor skin temperature. These results, which confirm the earlier findings of Bhagavathula et al., 36 do not suggest that lighting can be used to improve the alertness of road users after dark.
Footnotes
Declaration of conflicting interests
The authors declared no potential conflicts of interest with respect to the research, authorship, and/or publication of this article.
Funding
The authors disclosed receipt of the following financial support for the research, authorship, and/or publication of this article: The LightCAP project has received funding from the European Union’s Horizon 2020 research and innovation programme under the Marie Skłodowska-Curie Grant agreement No. 860613.