
Abstract
Cycling has a range of benefits and should be encouraged, but darkness may put people off from cycling due to reductions in visibility, road safety and personal security. We summarise previous work that consistently demonstrates how darkness reduces the number of people cycling after dark, after accounting for confounding factors such as time of day and seasonal variations in weather. We extend this previous work by analysing cyclist counts in Norway, a country at a higher latitude than those examined previously. An effect of darkness on cycling rates was found but this effect was smaller than that found in previous work, suggesting certain unknown factors may be important in mediating the impact of darkness on cycling rates. One factor that is known to mediate the effect is road lighting. Previous findings indicate that increased illuminance can offset the reductions in cyclists caused by darkness and also that there may be an optimal illuminance after which no further benefits may be achieved.
1.Background
Cycling has a range of health, environmental and economic benefits. Regular engagement in cycling can reduce risk of coronary heart disease, 1 and higher rates of cycling are associated with lower levels of obesity. 2 Measures to increase the modal share of cycling are linked with improvements in air quality 3 and reductions in carbon emissions. 4 The promotion of cycling can provide national economic benefits through job creation as well as local economic benefits through increased spend. 5 Despite these clear benefits, many people are put off from cycling because cyclists are seen as vulnerable road users and cycling can be considered by some to be a dangerous mode of transport. For example, the 2020 National Travel Attitudes study found that 66% of people thought that UK roads were too dangerous to cycle on. 6 Feeling uncomfortable with the idea of cycling with traffic has also been identified as the biggest barrier to cycling for those who do not currently cycle. 7 Cycling after dark is considered to be more dangerous than cycling during daylight because of reductions in the visibility to others and the visibility of potential hazards, with fewer people feeling safe to cycle after dark compared with daylight. 8 Being able to make the trip during daylight hours has also been highlighted as one of the key factors likely to motivate someone to cycle. 9
Changes in ambient light are expected to influence travel decisions because after dark the visual system is impaired, with reductions in contrast discrimination and depth perception and an increase in reaction time responses to potential hazards. 10 This visual impairment contributes to the significant increase in risk of some types of road traffic collisions (RTCs) after dark compared with during daylight.11,12 Ambient light is also likely to influence feelings of reassurance and fear of being a victim of crime. Pedestrian reassurance is reduced after dark 13 and qualitative research also suggests some cyclists, particularly female cyclists, are more fearful of cycling after dark due to the increased perceived danger of being victimised. 14
Changes in ambient light, specifically a transition from daylight to darkness, may reduce the number of people cycling due to perceived reductions in visibility, road safety and reassurance. However, transitions between daylight and darkness are not consistent across different locations. At latitudes closer to the equator the seasonal variation in the onset time of darkness is much less than at latitudes further away from the equator for example. The daily transition between daylight and darkness also varies by latitude. At the Spring equinox, civil twilight lasts for 21 minutes in Kuala Lumpur (latitude = 3.14°). In contrast, civil twilight lasts for 42 minutes in Helsinki (latitude = 60.2°). Different locations also vary in their levels of cycling infrastructure and cycling culture. The modal share for cycling across 17 different countries was found to vary from 0.8% (Brazil) to 26.8% (Netherlands) for example. 15 These locational variations in the transitions between daylight and darkness, and the cycling infrastructure and culture, may influence the effect that darkness has on cycling rates.
A useful question to ask is how large any effect of ambient light might be on the number of people cycling, and whether the size of this effect varies depending on location, latitude and local cycling culture. Answers to these questions can inform road lighting design policy and whether it can encourage cycling, as a well-lit route may encourage people to cycle after dark. 9 Road lighting is installed to reduce impairment to vision after dark and increase feelings of reassurance. Road lighting installed to meet the P-classes of CIE 115:2010 16 will have an average horizontal illuminance in the range of 2 lx to 15 lx. This is a smaller variation than the difference between daylight and dark, so it would be interesting to compare the effect of changes in road lighting illuminance with changes in ambient light level. This will help assess whether road lighting can be effective in offsetting any negative effect darkness has on cycling rates. If the size of this negative effect of darkness varies depending on location and local cycling culture though, this may dictate how road lighting is best used to encourage more cycling after dark in specific localities.
In this paper we summarise recently published data that aims to quantify the effect of ambient light on cyclist numbers. We focus on studies that used a case–control method to produce an odds ratio as a measure of the effect of darkness on cyclist numbers, to ensure the studies are comparable. We extend this previous work by presenting data from cycle counters in a new location (Norway) which represents a higher latitude than the locations used in those previous studies. We also review previous research related to the effects of road lighting on cycling rates after dark. This previous research related to a single location, Birmingham (UK), where data associated with after-dark illuminance levels were available. We also discuss new work underway that extends our understanding of the relationship between lighting and cycling rates by examining a greater number of locations.
2 Assessing the effect of light on cycling rates
2.1 Ambient light
Cycling behaviour is influenced by the time of day, regardless of the ambient light. Fewer people are likely to cycle at night simply because most daily activity tends to happen during daylight hours, for example. However, some people may also prefer to cycle when it is dark because there is less traffic on the roads. 14 Time of day therefore needs to be controlled for when assessing the effect of ambient light on cycling rates. This is done by selecting a specific time of the day and comparing cyclist numbers when this time is in daylight during one period of the year and in darkness for another period of the year.
Two methods can be used for comparing cyclist numbers at a specific time of day but under different ambient light conditions. The first is the clock-change method. This compares the days just before and just after the biannual clock change that occurs in many countries. A specific hour of the day can be chosen where this hour is in daylight immediately before but in darkness immediately after the clock change (or vice versa, depending on whether the clock change occurs in the Spring or Autumn). The second method is the whole-year approach. This takes advantage of seasonal variation in daylight. A specific hour of the day can again be chosen that is in darkness for part of the year but in daylight for the rest of the year. In both methods, the chosen period of the day that will experience the transition in ambient light is referred to as the Case period. To account for seasonal or calendar-related factors that will influence cycling behaviour, such as weather and vacation periods, cyclist numbers are also recorded for a Control period, chosen to be a time of day that remains at the same ambient light condition throughout the measurement period.
The Control period acts as a control for other potentially confounding factors such as weather because any changes in this factor are assumed to affect the Case and Control periods equally, and to not vary systematically between the two periods. Clearly there could be a change in weather conditions between the Case and Control periods on any particular day, but any such difference in weather between Case and Control period is assumed to be distributed randomly over the length of time being observed – some days it may rain in the Case period and not the Control period, other days it may rain in the Control period and not the Case period. It is possible that even random distribution could follow a spurious pattern when sample sizes are relatively small though, such as when the clock-change method is used. However, even if a spurious difference in weather conditions between Case and Control periods happened to occur, the effect on conclusions related to the influence of ambient light on cyclist counts will be minimal: this was demonstrated in previous work that found that consideration of weather conditions such as temperature and precipitation did not change conclusions about the effect of darkness, suggesting the case–control method adequately controls for variation in weather. 17
The day/dark ratio of cyclist numbers in the Case period are compared with a similar ratio for the Control period to establish an odds ratio (Equation (1)). An odds ratio greater than 1.0 indicates a reduction in the number of cyclists due to darkness, after time of day and seasonal factors have been controlled for.
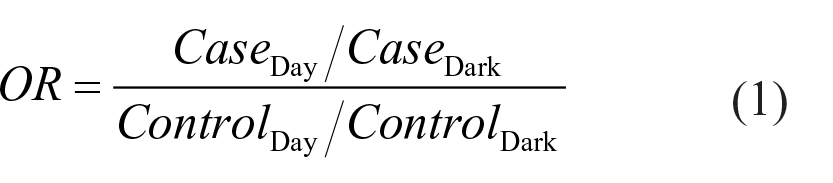
Where:
OR is the Odds Ratio
CaseDay is the count of cyclists in the Case period when it is in daylight
CaseDark is the count of cyclists in the Case period when it is in darkness
ControlDay is the count of cyclists in the Control period when the Case period is in daylight
ControlDark is the count of cyclists in the Control period when the Case period is in darkness
The case–control method for assessing the impact of ambient light on cyclist numbers has been applied in a number of locations in recent years, as summarised in Table 1. These locations vary in terms of their latitude and also potentially their cycling culture and infrastructure. Table 1 shows a proxy measure of each location’s cycling culture and infrastructure – the modal share of cycling in those locations.
Locations where cyclist count data has been captured and analysed to assess impact of ambient light on cycling rates
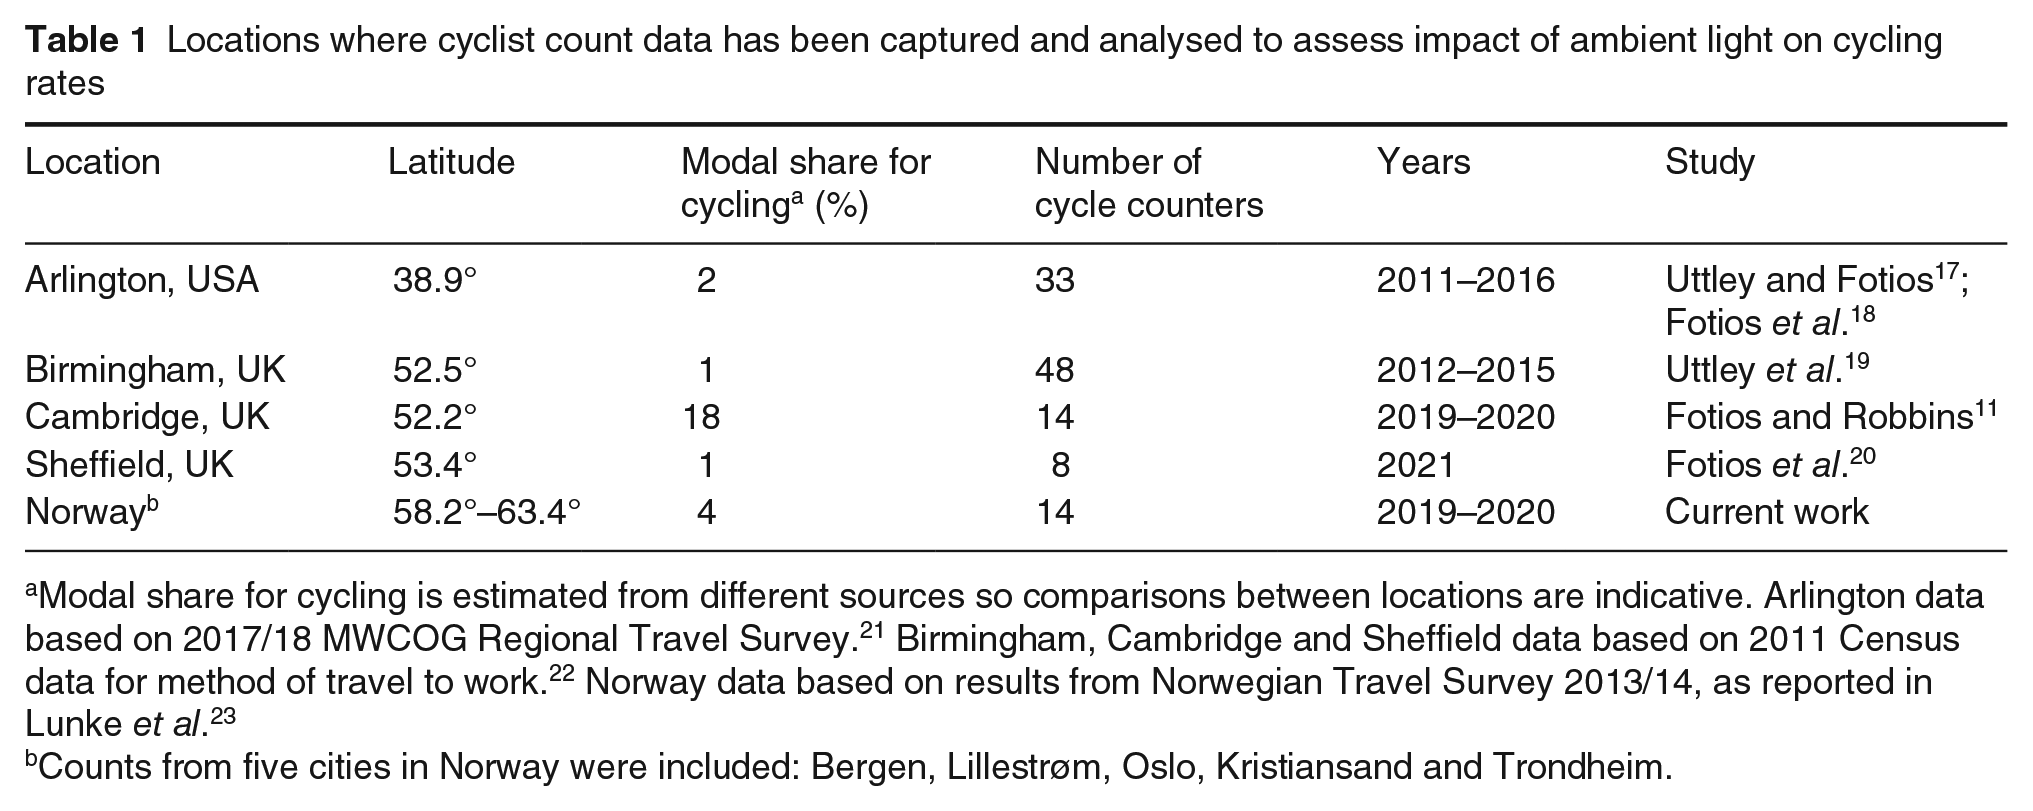
Modal share for cycling is estimated from different sources so comparisons between locations are indicative. Arlington data based on 2017/18 MWCOG Regional Travel Survey. 21 Birmingham, Cambridge and Sheffield data based on 2011 Census data for method of travel to work. 22 Norway data based on results from Norwegian Travel Survey 2013/14, as reported in Lunke et al. 23
Counts from five cities in Norway were included: Bergen, Lillestrøm, Oslo, Kristiansand and Trondheim.
Further details of the data sources and method used to obtain odds ratios from the Arlington, Birmingham, Cambridge and Sheffield data can be found in the relevant publications, as listed in Table 1. The method for analysis of the Norway data is given below.
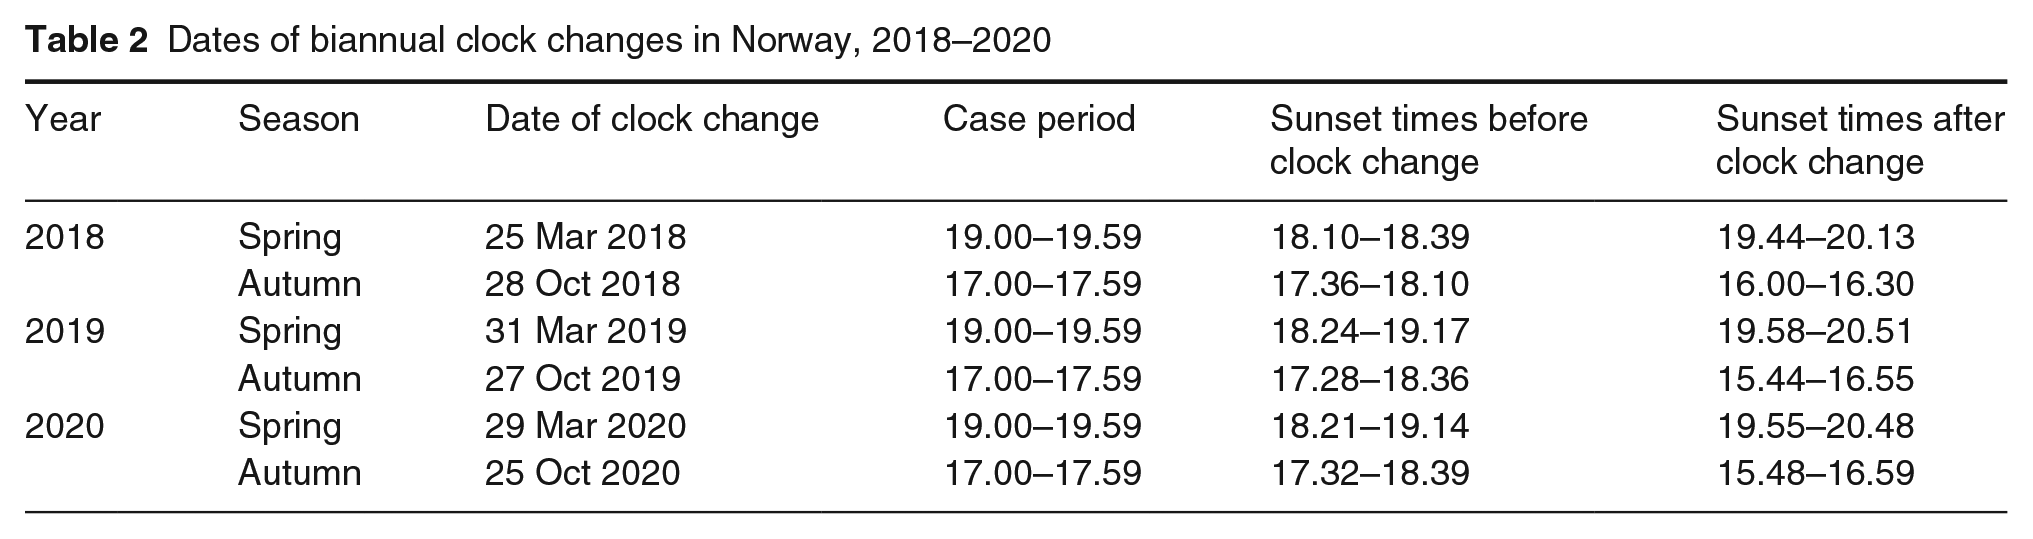
Open data from 14 automated cycle counters across five cities in Norway (Bergen, Lillestrøm, Oslo, Kristiansand and Trondheim) were obtained for the period 2018–2020. The data were retrieved from the Traffic data service of the Norwegian Public Roads Administration. 24 These data provided hourly counts of the numbers of cyclists at each counter location. The clock change and the whole year methods of analysis were both applied to this dataset. For the clock change method, counts were included for the two weeks either side of the clock change date, Monday to Saturday inclusive. The date of the clock change, always a Sunday, was not included. The dates of Spring and Autumn clock changes between 2018 and 2020 in Norway are given in Table 2, as are the times used for the Case period. Table 2 also gives the range of sunset times for each period. A range is given because the time of sunset varies depending on the location and the date within the two-week period either side of the Clock change. We define the transition between daylight and darkness as occurring at the time of sunset, when the sun’s altitude drops to 0°, although we acknowledge that in reality the transition from daylight to darkness is gradual. However, the clock change creates a clear transition in ambient light condition. This is shown by the mean altitude of the sun during the two weeks when the Case period is classed as in darkness (−6.77°) or in daylight (4.59°). For a Spring clock change the majority (>30 minutes) or entirety of the Case period occurred after sunset before the clock change, meaning it was predominantly or entirely in darkness. After the clock change, the majority (>30 minutes) or entirety of the Case period occurred before sunset, meaning it was predominantly or entirely in daylight. For an Autumn clock change this was reversed, with the Case period being predominantly or entirely in daylight before the clock change and predominantly or entirely in darkness after the clock change. Two Control periods were selected for use in the clock change method, one that was entirely in daylight (14.00–14.59) and one that was entirely in darkness (21.00–21.59) throughout the two weeks either side of each clock change.
Dates of biannual clock changes in Norway, 2018–2020
For application of the whole year method, a Case period of 18.00–18.59 was selected. This hour was defined as being in darkness if the sun’s altitude was below 0° for at least half of the hour, otherwise it was defined as being in daylight. Control periods were selected as 13.00–13.59 (entirely in daylight throughout the year) and 22.00–22.59 (entirely in darkness throughout the year). Note that 21.00–21.59 was not used as the dark Control period, as it was for the clock change method, because this hour would be in daylight for part of the year. Therefore, a later dark Control period had to be selected for use in the whole year method. The time of sunset ranged between 14.30 at the Winter solstice and 23.37 at the Summer solstice, depending on the latitude of the counter location.
2.2 Road lighting
The case–control method and resultant odds ratio described in Section 2.1 provides a measure of how large any effect of darkness is in reducing the number of people cycling – the larger the odds ratio, the bigger the reduction in cyclists due to darkness.
This method can also be used to assess the impact road lighting might have in offsetting any negative impact of darkness on cycling rates. If road lighting does offset the impact of darkness in this way, we would expect to see differences in the odds ratios at different locations depending on the road lighting that was present in those locations.
An important parameter of road lighting to assess is the illuminance provided. Night-time aerial photography provides a useful way of estimating illuminances across a large number of locations. The pixel intensities in these night-time aerial images correlate well with illuminances measured on the ground using an illuminance meter, with pixel values explaining 91% of the variance in measured illuminance levels. 25 Such night-time aerial imagery was available for only one of the locations discussed in Section 2.1, Birmingham (UK). These images were captured by the UK’s Environment Agency in March 2009 at a height of 900 m. Three-channel RGB images were combined to provide an overall raster layer for the Birmingham district. This was converted to a single-channel greyscale image from which single-digit pixel intensities could be obtained. Further details about the data source and process for extracting pixel intensities from these night-time aerial images are described in Uttley et al. 19 In this original analysis, pixel intensities were used to estimate a ‘brightness factor’, giving a measure of the brightness of the area around the counter relative to the average brightness across the whole city. Here we convert the pixel intensities extracted in the original work by Uttley et al. into something more meaningful – estimated illuminance (lux). This is done using Equation (2), which is based on the relationship that Hale et al. 25 recorded between pixel intensities and measured illuminances on the ground, using the same aerial imagery source we use. The average illuminance at each counter location was estimated by drawing a 15 m fixed distance buffer around the road or path segment that the counter was located on and calculating the average estimated illuminance of all pixels within that buffer area.
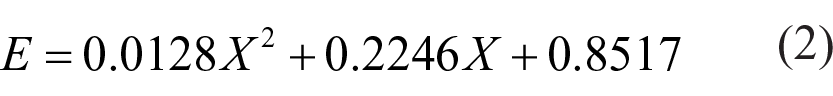
Where:
E is the estimated horizontal illuminance at the pixel position
X is the pixel intensity value
Odds ratios were calculated at each of the 48 cycle counter locations and compared against the location’s average estimated illuminance; see Uttley et al. 19 for further details.
3 Results
3.1 Effect of ambient light on cycling rates
Odds ratios calculated for Norway are shown in Table 3, along with those for the locations previously reported. Also shown are their 95% confidence intervals and whether the odds ratio significantly deviates from 1.0.
Odds ratios indicating effect of darkness on cycling rates at different locations
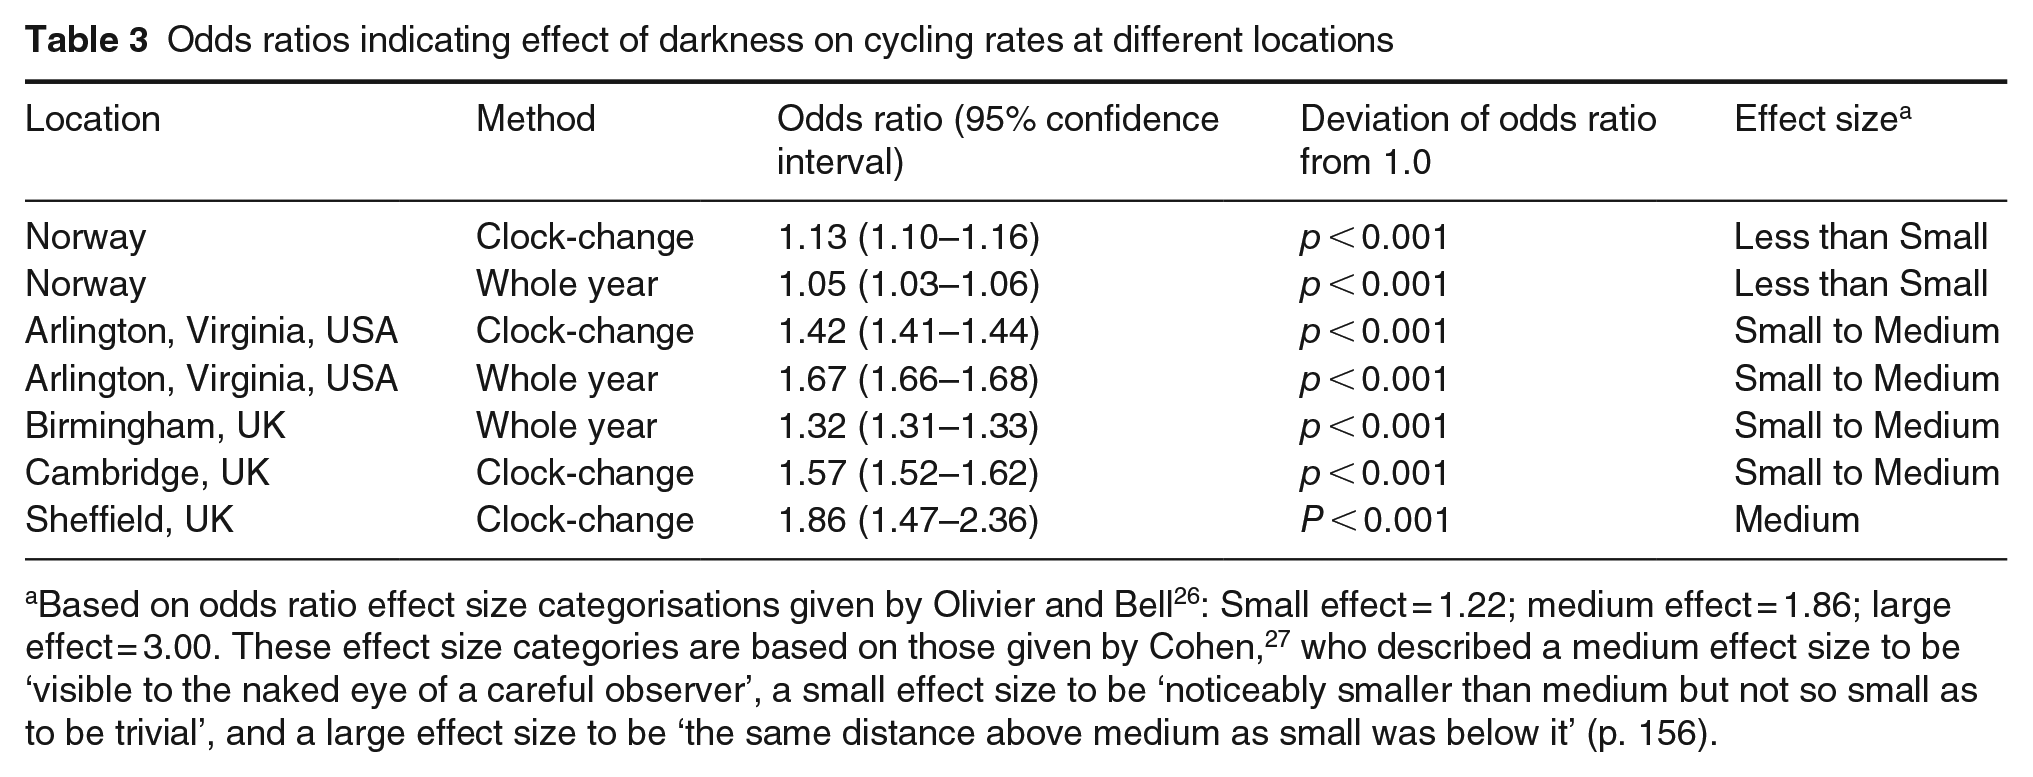
Based on odds ratio effect size categorisations given by Olivier and Bell 26 : Small effect = 1.22; medium effect = 1.86; large effect = 3.00. These effect size categories are based on those given by Cohen, 27 who described a medium effect size to be ‘visible to the naked eye of a careful observer’, a small effect size to be ‘noticeably smaller than medium but not so small as to be trivial’, and a large effect size to be ‘the same distance above medium as small was below it’ (p. 156).
The odds ratio for all locations and methods was significantly greater than one, indicating a consistent effect of darkness on cycling rates – fewer people cycle when it is dark compared with daylight, after accounting for time of day and other seasonal factors. In Arlington (USA), Birmingham (UK), Cambridge (UK) and Sheffield (UK) the size of this effect of darkness can be classed as small to medium, based on recommended categorisations, 26 with odds ratios between 1.32 and 1.86. In Norway however the effect is smaller, with odds ratios of 1.05 to 1.13 depending on which method of analysis is used.
3.2 Effect of illuminance on cycling rates after dark
Odds ratios were calculated at each of the 48 cycle counter locations in Birmingham, UK. These odds ratios ranged from 0.80 to 4.15. Average illuminances were also estimated at each cycle counter location based on the aerial image pixel intensities at that location. Estimated average illuminances ranged from 4.2 lx to 14.3 lx. Odds ratios and estimated average illuminances were then plotted against each other, see Figure 1. A clear curvilinear relationship is shown between odds ratios and estimated average illuminance. Initial increases in illuminance produce a large reduction in the odds ratio, but this effect plateaus and further increases in illuminance have minimal effect as the odds ratio is brought down close to 1.0. Figure 1 shows the linear regression best-fit line modelling this relationship, using a reciprocal model. The regression equation for this model is given in Equation (3).
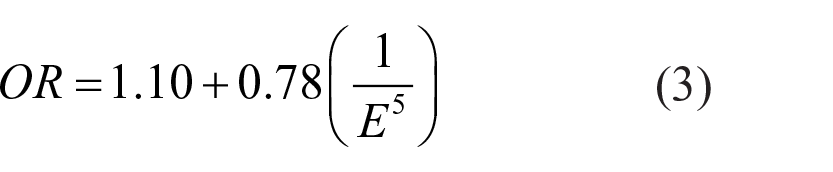
Where:
OR is the odds ratio at a particular counter location
E is the estimated average illuminance at that counter location
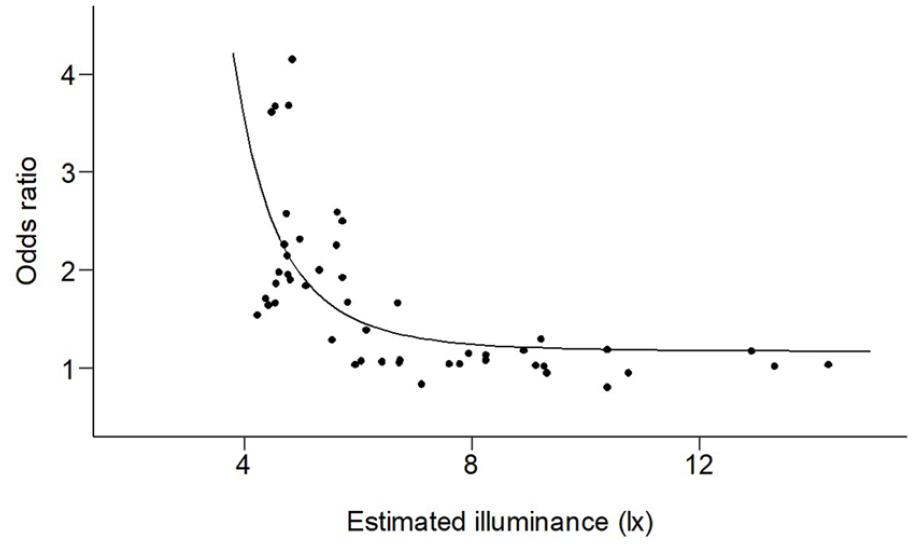
Odds ratios by estimated illuminance for 48 cycle counter locations in Birmingham, UK (after Uttley et al. 19 ). A linear regression best-fit line using a reciprocal model is also shown
4 Discussion
The summary of previous and new analyses of the effect of darkness on cycling rates shown in Table 3 suggests a consistent and generally strong association – darkness reduces the number of people cycling, after controlling for time of day and seasonal factors. This effect is demonstrated across different countries and latitudes. Although the odds ratio doesn’t provide a direct measure of the change in absolute numbers of cyclists due to darkness, as it is a ratio of two odds, the relative reduction in cyclists can be estimated using equation 4.

Where,
ChangeCyc is the estimated relative change in cyclists due to darkness
OR is the odds ratio
Using this equation, darkness causes a relative reduction in cyclists of between 5% (for Norway using the whole year method) and 46% (for Sheffield using the clock change method), depending on the location and method of analysis used.
One thing to note is this effect of darkness is not as large in Norway compared with locations assessed in the UK and USA. It is unclear why this may be the case. One possible factor is latitude. Norway is at a higher latitude than the locations analysed in the UK and USA. The higher latitude means locations in Norway spend more time in darkness during the winter, compared with lower latitude locations. For example, Trondheim (Norway) only has 4.5 hours of daylight at the Winter solstice, compared with 8 hours in Birmingham (UK) and 9 hours in Arlington (USA). It is possible that Norwegian cyclists are more willing to cycle when it is dark as much of the year may be spent in darkness compared with lower latitude locations.
An alternative explanation for the lower odds ratio in Norway could be related to a difference in cycling culture; cycling is a more common mode of transport in Norway than in the UK and the USA. 2 Around 70% of cycling in Norway is carried out as a mode of transport to and from work. 23 Given the long hours of darkness during winter months in Norway due to its high latitude it is likely that anyone who regularly commutes by bicycle will at some point in the year cycle during hours of darkness. People in Norway may therefore be more used to cycling after dark, compared with people in countries where cycling is less dominated by commuting and more by leisure cycling, that has greater flexibility around the time of day someone chooses to cycle.
The infrastructure for cycling in Norwegian cities might also play a role. A study comparing cycling between the four biggest cities in Norway found that cities with higher satisfaction rates for the extent and quality of cycling paths showed a higher modal share of cycling compared to cities with lower focus on cycling infrastructure. 23
Weather conditions could also potentially explain the difference between the odds ratio for Norway and for other locations. Norway experiences more adverse weather conditions compared with the locations analysed in the UK and USA, for example more snow and ice and colder temperatures. Cycling in such weather conditions may be more common for people in Norway, making them more resilient to adverse cycling conditions, including darkness. Another study that investigated how environmental conditions (including ambient light) affected travel mode choices found that darkness had no influence on the decision to cycle in a city in Norway (Stavanger). 28
A further explanation for differences in odds ratios between different locations may be due to the locations of the cycle counters and the type of cyclist they tend to monitor. Counters at locations where utilitarian cycling tends to occur, for example on common commuting routes, may show smaller odds ratios than counters where recreational cycling is more likely to occur. A recreational cyclist has more choice in when they choose to cycle and can therefore avoid periods of darkness, whilst a utilitarian cyclist is more likely to travel at a regular time of day, for example on their commute to and from work, regardless of ambient light conditions. Some evidence for this comes from previous work that has shown higher odds ratios for counters at ‘off road’ locations compared with counters situated on roads. 19 A city with a higher proportion of ‘utilitarian’ counters could produce a smaller overall odds ratio than a city with a higher proportion of ‘recreational’ counters.
The above explanations for the lower odds ratios seen in Norway compared to the locations reported in previous work are only speculation and further evidence is needed. This includes further data from other locations in Norway and for more extended time periods to confirm whether the effect of darkness really is less significant in Norway compared with other locations. We have only used an evening Case period in the new analyses presented for Norway as this follows both the previous work highlighted in Table 1 and in other work that has applied a similar case–control approach to RTCs,11,29,30 but future work could include a morning Case period to increase the sample of data and assess any differences between effects of darkness in the morning and evening.
We have shown that darkness reduces the number of people who cycle. This effect of darkness has also been shown in research using alternative methods. Studies that have used surveys to assess the factors influencing travel mode choice have shown darkness makes people less likely to choose an active travel mode of transport, 28 and that reduced hours of sunlight makes people less likely to cycle, particularly women and those that are only occasional cyclists. 31 Surveys of travel behaviour have also suggested darkness is a greater deterrent to cycling than characteristics of the built environment such as bike-friendly design and retail density. 32 A study using regression methods with observational count data, as opposed to the case–control method we use, has also shown better light conditions generally lead to higher numbers of people cycling, and that this effect is moderated by the type of cycling undertaken (utilitarian vs. recreational) and whether it is morning or evening. 33 There appears to be a clear consensus within the literature that darkness is closely related to the choice to cycle, and this relationship is shown through a range of different methods. A key benefit of using the case–control method we summarise and adopt in this paper, however, is that the quasi-experimental nature of the design (controlling for time of day and seasonal effects whilst varying the ambient light) allows us to partially infer a causal relationship between darkness and cycling rates. A further benefit of the case–control method is the simple quantification of the magnitude of any effect of darkness on cycling rates, through the calculated odds ratio. Quantification of the magnitude of this effect is useful as it allows us to assess the impact of variations in road lighting on cycling rates after dark, which can help us to optimise lighting conditions to encourage more cycling.
Our analysis based on the findings from Uttley et al. 19 shows a clear relationship between illuminance and the reduction in cycling rates after dark (as measured by the odds ratio – see Figure 1). This first implies that road lighting can be beneficial in encouraging people to cycle after dark, by increasing illuminance on roads and routes used by cyclists. However, the relationship is not linear meaning there may be an optimal illuminance beyond which no further benefit is gained. Based on the data we have analysed this optimal average illuminance is around 6 lx, but a larger sample of data is needed to confirm this, and also to understand if the optimal illuminance may vary depending on type of location. These results are based on illuminances estimated from night-time aerial imagery. Whilst a good correlation has been shown between pixel intensities and measured illuminances 25 there is potential for error in basing illuminance values on aerial images. A more accurate assessment of illuminance values, as well as other lighting characteristics that could influence cycling rates after dark such as uniformity and spectrum, is needed using on-the-ground photometric surveys. We are currently undertaking such work as part of the EPSRC-funded SATURN project: Supporting Active Travel Using Road-lighting at Night (grant number EP/V043463/1). A goal of this work is to develop a large evidence base about the relationship between lighting and cycling rates after dark, to inform development of lighting design policy related to cycling and encourage more people to cycle after dark.
5 Conclusion
People are likely to be put off from cycling when it is dark. We have shown this by summarising a number of analyses of cycle count data, using a case–control method that accounts for confounding factors such as time of day and seasonal variations in weather or vacation periods. The negative effect darkness has on cycling rates has been found consistently across different locations and countries. However, the size of this effect may vary, as suggested by lower odds ratios in Norway compared with other locations, and further work is needed to understand the factors that mediate the effect of darkness on cycling rates.
Road lighting can reduce the negative impact of darkness on cycling rates and therefore encourage more cycling after dark, by increasing average illuminances on routes that may be used by cyclists. There is likely to be an optimal illuminance for encouraging people to cycle after dark, and going beyond this illuminance will have no further beneficial effect, at least in terms of increasing cycling rates. To find this optimal illuminance, and optimal values for other lighting characteristics such as uniformity and spectrum, further evidence in this area should be gathered. We are currently starting to gather this evidence through the SATURN project.
Footnotes
Acknowledgements
A version of this work was presented at the CIE 2021 Midterm Session.
Declaration of conflicting interests
The authors declared no potential conflicts of interest with respect to the research, authorship, and/or publication of this article.
Funding
The authors disclosed receipt of the following financial support for the research, authorship, and/or publication of this article: This work has been supported by the EPSRC grant EP/V043463/1 for the SATURN project.