
Abstract
A facility for calibration of temporal light modulation (TLM) photometers has been developed. The facility is based on a laser-fed reference integrating sphere source, the optical input power of which can be modulated with an acousto-optic modulator. A system of photodiodes, amplifiers and an analogue-to-digital converter is used to sample the temporally modulated irradiance at one of the exit ports of the source. With the facility, a TLM photometer was calibrated for display contrast ratio root mean square with an absolute combined standard uncertainty of 0.037%. In addition, the facility has been characterised with the aim of measuring flicker and stroboscopic effect, considering the Ecodesign ‘Single Lighting Regulation’. The frequency response of the facility is shown to be sufficient to accommodate measurements of flicker and the stroboscopic effect.
1 Towards SI-traceable TLM measurements
Light-emitting diode (LED)-based light sources are often used in pulse width modulation mode to enable dimming and to lower their operating temperature. This is known to introduce temporal light modulation (TLM): a fluctuation of the emitted light over time. The resulting visual effects, for example, flicker and stroboscopic effect, are known as temporal light artefacts (TLAs).
The severity of these two TLAs can be expressed as
A crucial step towards SI-traceability for a TLM measurement device under test (DUT) is calibration and characterisation. A first step towards this is a calibrated reference TLM source. This source, which can be used for both illuminance and luminance meters, is calibrated against a well-characterised and calibrated TLM irradiance reference meter. The TLM facility, shown in Figure 1, which includes the above-mentioned reference meter and source, has been initially designed for calibration of photometers in terms of Percent Flicker, Flicker Index and display contrast root mean square (RMS) method. 3 In this paper, an uncertainty budget for calibration of a TLM DUT for display contrast ratio RMS will be given. In addition, the facility has been characterised to assess its potential for calibrations in terms of the metrics used in the Ecodesign, that is, flicker and stroboscopic effect.
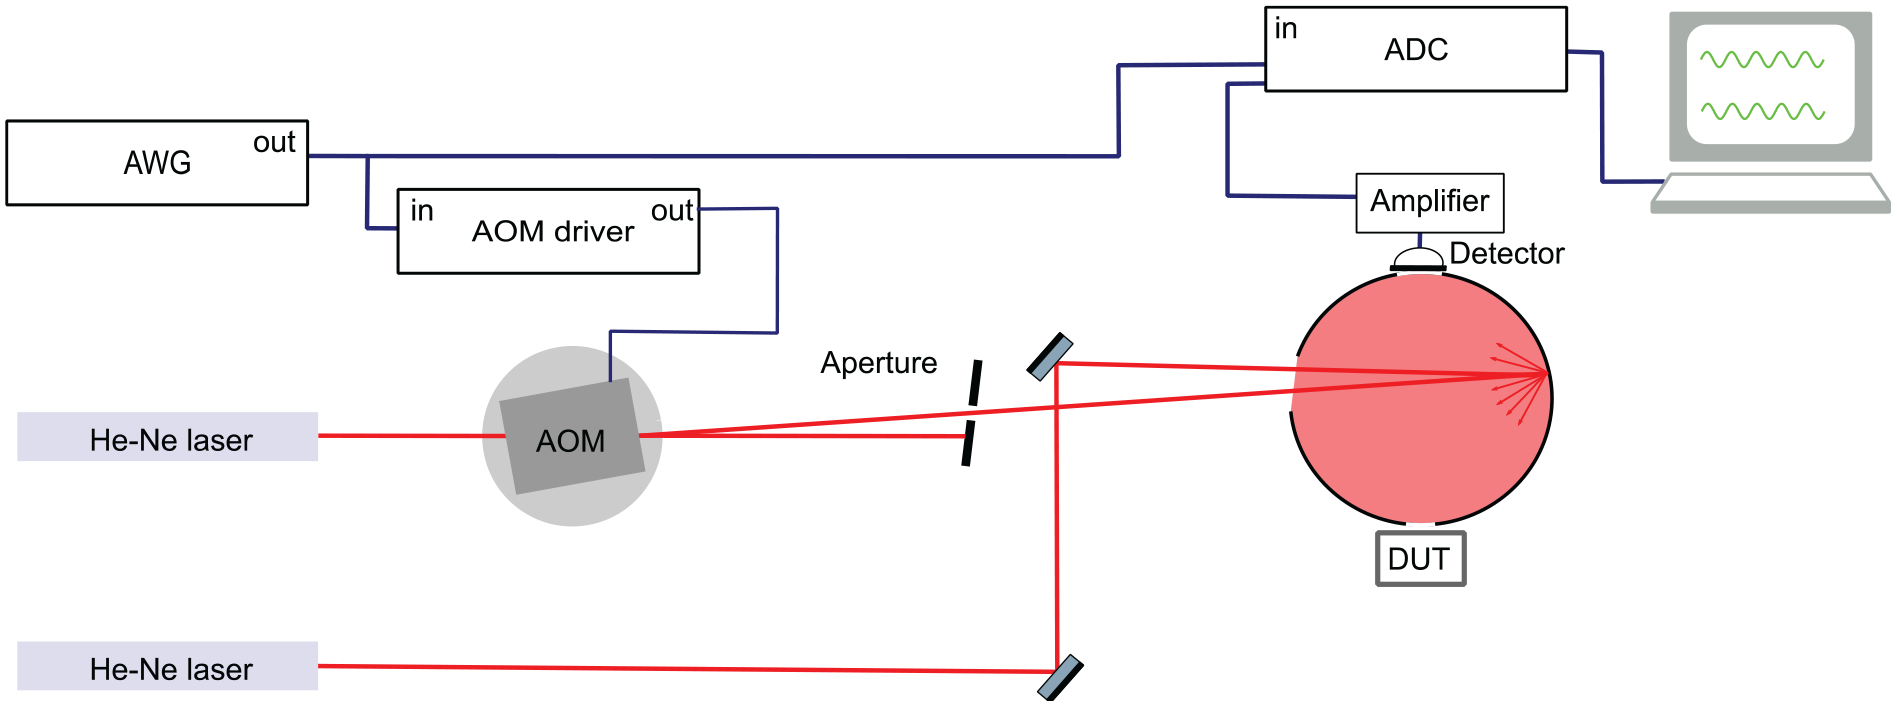
Schematic of facility for calibration of TLM photometers
2 Method
2.1 TLM reference meter
The TLM reference meter consists of silicon photodiodes, optional external amplifiers and an analogue-to-digital converter (ADC). To accommodate a broad range of modulation frequencies two different photodiodes are used. An 18 × 18 mm2 silicon photodiode (Hamamatsu, Japan S1337-21) amplified with an external transimpedance amplifier is used to measure signals modulated with a frequency typically below 1 kHz. For faster signals, a smaller photodiode (Thorlabs, New Jersey, United States PDA8A) with diameter of 0.8 mm and built-in amplifier is used. The amplified temporally modulated photocurrents are sampled as function of time with the ADC. The sampling resolution can be selected from 16 bits to 24 bits depending on the sampling frequency, which ranges from 50 kHz up to 15 MHz. The voltage scale of the reference ADC is traceable to a Josephson voltage standard, through a multifunction calibration facility. The time scale is traceable to a 10 MHz reference frequency.
13
TLM metrics are calculated from the measured temporally modulated irradiance using software algorithms. For the metrics of
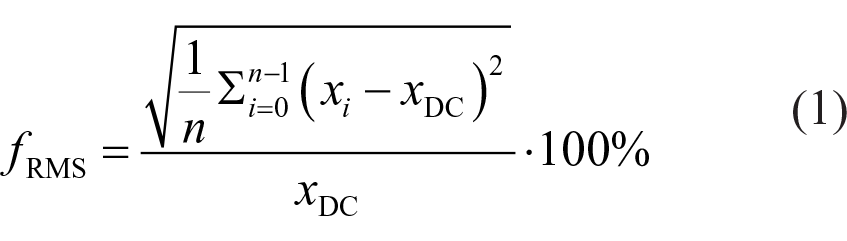
where
2.2 TLM reference source
The TLM reference source is realised by coupling temporally modulated light from a He–Ne laser, with a wavelength of 632.8 nm, into an integrating sphere. The laser light is modulated with an acousto-optical modulator (AOM). The proportion of the optical power diffracted to the first-order beam can be controlled by adjusting the energy of the sound wave that drives the AOM. Both a manual adjustment of the carrier level and a driver voltage, supplied by an arbitrary waveform generator (AWG), can thus be used to modulate the proportion of the optical power that is diffracted into the first-order beam. An adjustable iris is used to block the zero-order beam from the entrance of the integrating sphere. To provide additional optical power, light from a second unmodulated He–Ne laser is coupled into the integrating sphere. Note that the additional laser light effectively lowers the TLM of the reference source. The modulation depth and shape (e.g. sinusoidal, sawtooth or square) of the perceived waveform can be altered by supplying a different waveform with the AWG.
2.3 Determination of linear range of AOM
AOMs are known to exhibit nonlinearity in the lower and upper part of their operation range. This results in deformation of the wave shape due to a nonlinear amplitude modulation of the diffracted first-order beam. The linearity of the optical power diffracted by the AOM has been evaluated by using the TLM reference meter to measure the diffracted beam as a function of changes to either the manually set carrier level or the driver voltage. Thereafter, to generate the reference waveforms, both the manual carrier level and AOM driver voltage range are chosen such that the AOM operates within the linear range of optical output. To confirm proper selection of carrier level and driver voltage range, for a sinusoidal 50 Hz modulation, the amplitude of the modulated optical power is compared with the amplitude of the AOM driver voltage.
2.4 Frequency response
Quantification of the stroboscopic effect requires accurate measurements of waveforms up to much higher frequencies, i.e. 2 kHz. To assess suitability of the TLM facility for
3 Results
Figure 2 shows the averaged normalised optical power measured with the TLM meter, for AOM carrier levels from 1 to 10. The optical power of the diffracted beam of the AOM is linear for carrier levels from 4 to 6. Outside this range, nonlinearity is clearly present. Figure 3 shows the normalised optical power measured for an AOM driver voltage from 0 V to 3 V. The closed circles show the linear range in both figures. As expected, both measurements show a similar nonlinear behaviour. Within the linear range, the optical power of the diffracted first-order beam could be modulated from about 25% to 80%. Further measurements of the frequency response are carried out within this linear range of amplitude modulation. To assess the frequency bandwidth of the TLM facility, the amplitude of the modulated laser beam and LED have been measured with the reference meter at frequencies from 50 Hz to 50 kHz.
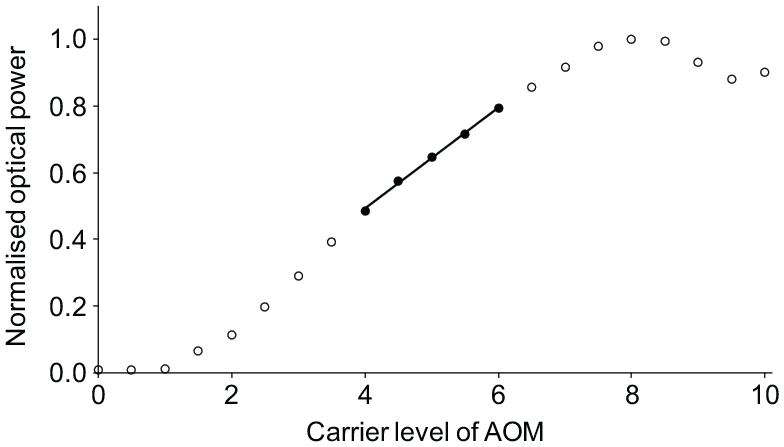
Power of diffracted beam against the carrier level setting of the acousto-optic modulator (AOM). The measurement points are indicated by open circles. In addition, points within the linear range are marked by closed circles
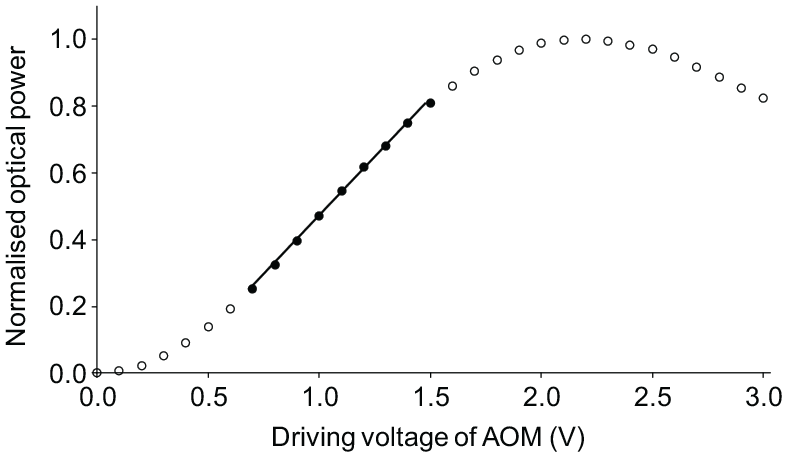
Power of diffracted beam against the driving voltage of the acousto-optic modulator (AOM). The measurement points are indicated by open circles. In addition, points within the linear range are marked by closed circles
The Bode magnitude plot in Figure 4 shows the gain (or magnitude) of the transfer function of the system configurations as a function of frequency, as determined from the measurements. It should be noted that the negative gain means that the amplitude of a signal will be attenuated. The gain is determined with respect to the maximum amplitude, measured for each of the three system configurations shown. From the figure, it can be concluded that the laser reference source in combination with the reference meter, based on the 18 × 18 mm2 silicon photodiode, can be used for frequencies up to about 1 kHz, without unwanted attenuation of the magnitude of signal. In contrast, the measurements for the LED source show an attenuation of the amplitude starting from about 200 Hz. The bandwidth of the TLM reference laser source in combination with the reference meter, based on the photodiode with diameter of 0.8 mm, is shown to be greater than 50 kHz. This well accommodates the upper frequency for flicker of about 200 Hz and the upper frequency for the stroboscopic effect of 2 kHz. The existing data analysis software of the facility has been updated for flicker computation. The newly implemented algorithms have been validated against the waveforms given in IEC TR 61547-1:2020. 1
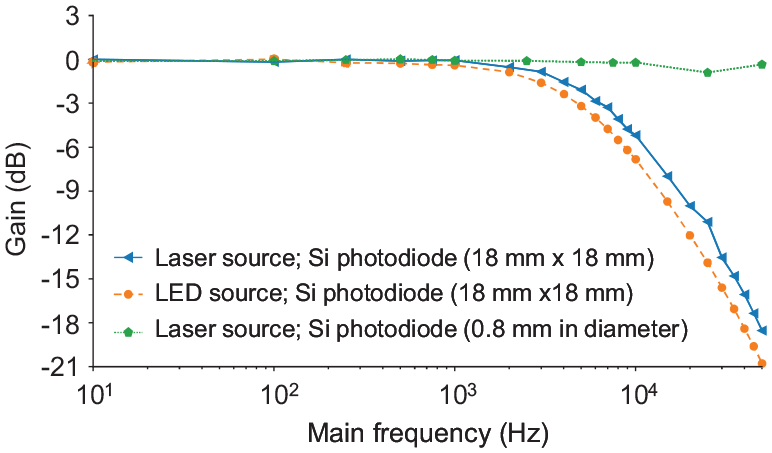
Bode magnitude plot of temporal light modulation (TLM) reference sources in combination with reference meter
Table 1 shows a typical uncertainty budget for the calibration of a luminance TLM meter for display contrast RMS. The following uncertainty components are taken into account:
Nonlinearity of ADC, which is derived directly from the calibration of the ADC against a multifunction calibration facility, that in turn is traceable to the DC Josephson voltage standard.
Standard deviation of reference TLM measurement, determined for three consecutive measurements.
Standard deviation of three consecutive readings of the DUT.
Resolution of the display reading of reference value.
Resolution of the display reading of the DUT.
Due to the noise performance, some DUTs show a baseline flicker reading when observing an unmodulated luminance. The uncertainty due to noise-induced baseline flicker of the DUT is determined according to Equation (2):
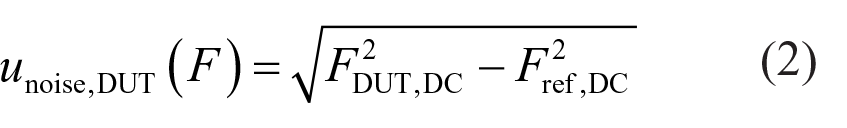
where
Uncertainty budget for calibration of TLM meter at 2% display contrast RMS.
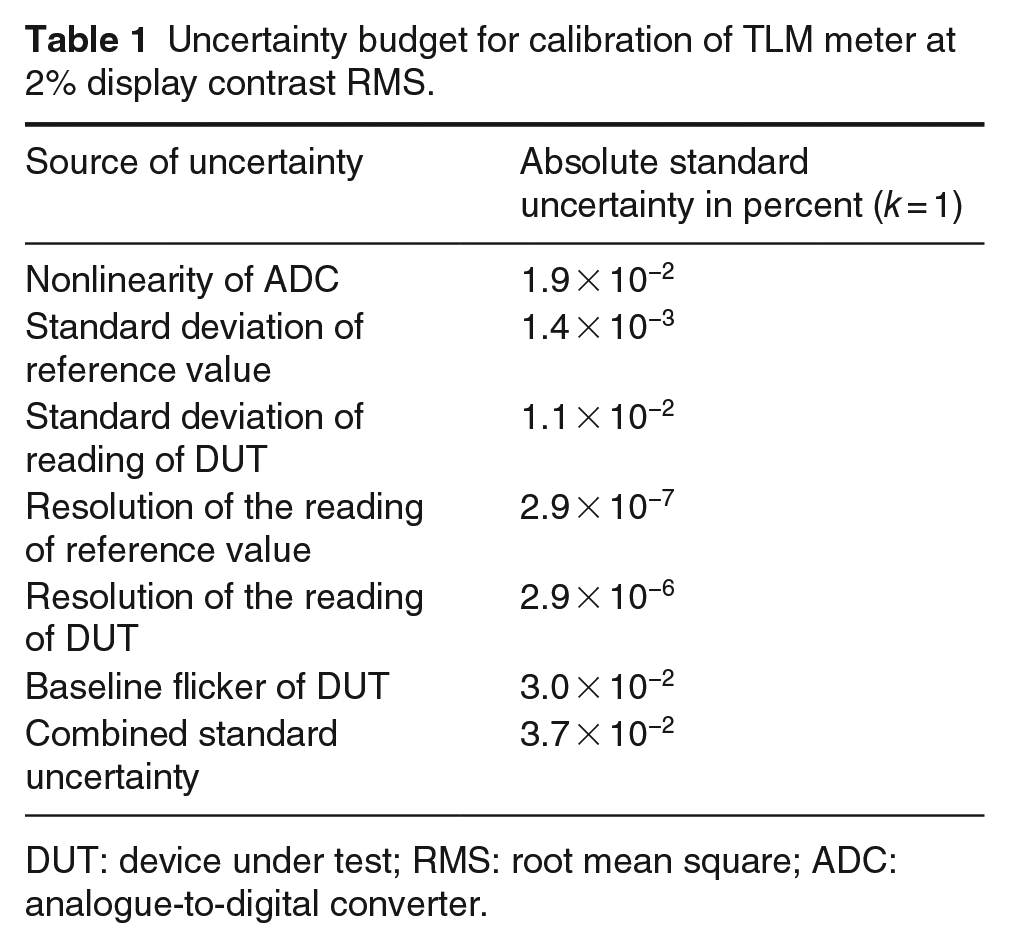
DUT: device under test; RMS: root mean square; ADC: analogue-to-digital converter.
4 Conclusion
A facility, based on modulation of laser power with an AOM, has been realised to calibrate photometers with respect to TLM. To generate a sinusoidal modulated optical stimulus at a single frequency, for example, 50 Hz, linear conversion of the AOM driving voltage to diffracted optical power is essential. As expected, the AOM showed a nonlinear behaviour of transmitted optical power at the low and high end of its range. This nonlinearity would introduce a deformation of the sinusoidal modulation of the optical power. To avoid this, care was taken to operate the AOM within its linear range. The optical power could be modulated linearly by approximately a factor of three. Relatively low levels of TLM could be achieved by adding a second continuously operating laser providing additional unmodulated optical power to the sphere. The voltage read out of the ADC was made traceable to the SI via a multifunction calibration facility traceable to a Josephson voltage standard. The time scale of the ADC is traceable to a 10 MHz reference frequency. A commercial photometer was calibrated for display contrast RMS with an absolute combined standard uncertainty of 0.037%. Though the facility was initially built for calibration in the units of Percent Flicker, Flicker Index and display contrast ratio RMS, the methods used proved suitable for flicker and the stroboscopic effect, expressed in
Footnotes
Acknowledgements
The authors thank Roland van Bemmelen and Erik Dierikx for calibrating the ADC. A version of this work was presented at the CIE 2021 Midterm Session.
Declaration of conflicting interests
The authors declared no potential conflicts of interest with respect to the research, authorship, and/or publication of this article.
Funding
The authors disclosed receipt of the following financial support for the research, authorship, and/or publication of this article: The work published in this paper is funded by the European Metrology Programme for Innovation and Research (EMPIR) Project 20NRM01 MetTLM ‘Metrology for temporal light modulation’. This project has received funding from the EMPIR programme co-financed by the Participating States and from the European Union’s Horizon 2020 research and innovation programme.