
Abstract
In everyday scenes, the effective light (the actual light in a space) can be defined as a complex light field, resulting from a mixture of emissive light sources and indirect mutual surface (inter-)reflections. Hence, the light field typically consists of diffuse and directional illumination and varies in spectral irradiance as a function of location and direction. The spatially varying differences between the diffuse and directional illumination spectra induce correlated colour temperature (CCT) and colour rendition variations over the light fields. Here, we aim to investigate the colourimetric properties of the actual light, termed the effective CCT and colour rendition, for spaces of one reflectance (uni-chromatic spaces). The spectra of the diffuse light-field component (light density) and the directional light-field component (light vector) were measured in both physical and simulated uni-chromatic spaces illuminated by ordinary white light sources. We empirically tested the effective CCT and colour rendition for the light density and the light vector, separately. There were significant differences between the lamp-specified CCT and colour rendition and the actual light-based effective CCT and effective colour rendition. Inter-reflections predominantly affected the CCT and colour rendition of the light density relative to the light vector. Treating the diffuse and directional light-field components in a linear model reveals the separate influences of the light source and scene. These effects show the importance of a 3D version of colour checkers for lighting designers, architects or in general computer graphics applications, for which we propose simple Lambertian spheres.
1. Introduction
In natural scenes, light fields are often composed of directional illumination emanating from a radiating source and diffuse illumination from inter-reflections by objects (e.g., the floor, walls and ceiling of a room). The chromatic properties of inter-reflections are a product of the spectral power distribution (SPD) of the incident light and the spectral reflectance function (SRF) of a material. The dependency on the SRF varies exponentially as a function of the number of bounces the inter-reflections went through. Therefore, the SPDs of the illuminant and inter-reflections are different1–5 except if the inter-reflections originate from spectrally neutral surfaces (ones which reflect light equally at all visible wavelengths). Here we will focus on the optical effects of material SRFs on the light field. Even if the light source SPD(s) and the material SRF(s) are invariant for most static natural scenes, the chromatic properties of the effective light are still subject to spatial and directional variations due to inter-reflections. Such material-space-light interactions impact how 3D objects and people will look in such spaces, in which the diffuse and directed components of the light will have differential effects on the shadowed and directly illuminated parts of the objects and people.6,7 Our aim is to capture and understand such spatially and directionally varying chromatic effects in a light-field framework.
Colour rendering 8 refers to the interaction between light SPD and surface SRF. This is one of the principal factors determining how objects appear, in addition to illuminance level and light diffuseness. Colour rendering metrics (CRMs) apply to lamps and characterise a specified source by its effects on the colour appearances of a representative set of surfaces, compared to a reference illumination. The reference illumination has a precisely defined broad-band spectrum. It is usually a Planckian radiator or a mathematical model of daylight illuminant that is close to or on the Planckian locus. The reference illumination is chosen as a common point of comparison 9 for normal colour vision.
There are multiple types of CRMs associated with lighting applications. These include colour fidelity, which refers to the degree to which colours appear under a test illumination as they are expected to appear on the basis of previous observations under a defined reference illumination. 10 Other attributes of colour rendering include memory, 11 discrimination, 12 preference, 13 fluorescence 14 and many other effects, which tackle very specific visual tasks. For simplicity, we focus on the colour fidelity aspect in this study. SPDs that are reasonably smooth and evenly distributed tend to have higher fidelity.
With complete immersion in and adaptation to the chromaticity of the test illumination, CRMs assume that the reference illuminants have maximum colour fidelity. 8 Electric illumination spectra such as blue-pump LEDs often lack power in certain wavelength ranges compared to full-spectrum radiators, negatively impacting their colour fidelity. Illumination with high or low colour fidelity, in general, makes object colours appear as expected or unexpected under reference illumination.
There are multiple CRMs in use to quantify colour rendering performance, among which the CIE general colour rendering index (CRI) Ra is the most widely used measure. Despite its prominence, Ra has a variety of limitations,15–17 such as a harsh cut-off at 5000 K for defining the reference illuminant. The scalar index also fails to indicate the types of colour effects, that is, whether it concerns saturation and/or hue shifts.
Progress has been made in examining other CRMs as a replacement11,18–22 or an adjunct 23 to the CRI. The global consensus was reached on assessing colour rendering via TM-30.10,22,24,25 TM-30 specifies both an improved fidelity index (Rf) and a gamut index (Rg), accompanied by a colour vector graphic. Its high number (99 in total) of colour evaluation samples (CESs) covers a wide range of reflectance spectra, corresponding to a range of consumer goods and natural materials. Instead of a sharp cut-off at 5000 K, TM-30 uses a proportional blend of Planckian radiation and a D Series illuminant between 4000 K and 5000 K. The additional Rg, colour vector graphic and local measures provide detailed information on the hue and saturation shifts. In 2018, the TM-30 Rf was updated to match the new CIE Rf, 26 as an agreed scientifically accurate measure of colour fidelity. However, in practice, a switch to TM-30 involves software upgrading and therefore time, so characterising colour rendition by the CRI is still in use. Therefore, the current study utilises both the conventional and the state-of-the-art colour fidelity measures to characterise the effects of inter-reflections on colour rendition, which we coin the effective colour rendering.
Lighting professionals generally rely on lamp-based CRMs, which apply well in common lighting applications. The impact of inter-reflections on the effective colour rendering throughout spaces is usually not considered. However, overlooking this can lead to unintentional colour distortion in lighting designs in which coloured materials are used.18,27–30
In order to quantify spatially varying lighting distributions, the current study uses the Delft light-field framework. 31 Light fields capture the effective light in a space, including inter-reflections, shadowing effects, etcetera, so it describes the complete lighting distribution that is potentially available to the human visual system (or plenoptic function 32 ). The light field thus depends on the light source characteristics, the space’s geometry and the materials. The physical light field (the spectral power as a function of location, direction and wavelength) can be decomposed as the sum of qualitatively different components via spherical harmonics (SH).33–35 Here we consider just the first two components since those are the main determinants of the modelling and (colour) contrast.36–39 The zeroth-order SH, the light density, is associated with the diffuse light-field component, namely the integration of the spectral power over the sphere. The first-order SH represents the light vector, indicating the net flux transport or directional light-field component. In past studies, up to first-order chromatic light fields were described, measured and visualised via cubic spectral irradiance measurements.3,6,40
This study aims to predict and measure chromatic light fields and the impact of (inter-)reflections on the effective correlated colour temperature (CCT) and colour fidelity. Hypotheses are that (A) the lamp-specified CCT and colour fidelity are noticeably different from the actual light-based effective CCT and effective colour fidelity in the presence of materials with non-neutral SRFs, and (B) the major determinants of the CCT and colour fidelity for the light density are the scene material SRFs, while that for the light-vector CCT and colour fidelity is the illuminant.
We first summarise our earlier work showing how different bounces of inter-reflections shape the chromaticity of the light field. 40 We then empirically demonstrate the disjunction between the lamp-specified and the light-based CCT and colour fidelity by measuring the spectra of the light density and the light vector in physical and simulated uni-chromatic spaces illuminated by ordinary white light sources. We also show how to understand the diffuse and directional light-field components’ differential spectral properties and use their linear combination to capture the separate influences of the light source and scene material interactions.
2. Chromatic effects of inter-reflections
The SPD of the lamp is denoted as E0(λ), and the surface SRF of the room as ρ(λ). The spectrum of the ith bounce of the inter-reflections is then:
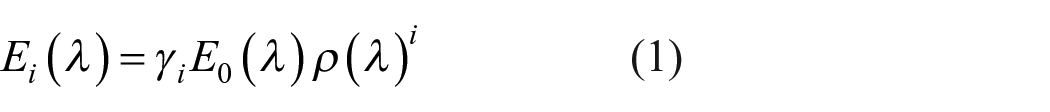
where γi is the geometrical factor, determined by the surfaces’ geometry, the bidirectional reflectance distribution function (BRDF) and scene layout. The ith reflection results in a multiplier of E0(λ) with the ith power of the material SRF or ρ (λ). As a result, the SPDs of inter-reflections depend strongly on the SRF. If the room surfaces are achromatic, each reflection has the same SPD. But if the room surfaces are chromatic, the SPD will change with each reflection. Since the absolute spectral power attenuates exponentially, the relative differences between the peak(s) and trough(s) of the material SRF increase with each bounce. The ratios between the spectral power of short-, middle- and long-wavelength parts determine the chromatic effects of inter-reflections,3,40 that is, brightness, saturation and hue shifts. For our earlier work on this topic and an extensive explanation of these fundamental mechanisms, see Yu et al. 3
Figure 1 shows such effects for an achromatic material and three chromatic materials representing brightness, saturation and hue effects under two typical white illuminations. The chromatic materials were selected based on their qualitatively different effects, namely on brightness, saturation and hue, in a coarse-grained spectral approach that resembles the human ecological context.3,41,42 The coarse-grained spectral bandwidths are similar to the spectral channels of human vision (50 nm–120 nm half-widths),43,44 that is, short-wavelength blue channel (400 nm–500 nm), middle-wavelength green channel (500 nm–600 nm) and long-wavelength red channel (600 nm–700 nm). 45 In ecological contexts, red, green and blue (RGB)–coordinates suffice to predict the chromatic effects of inter-reflections.41,46,47 The maroon SRF peaks in the red channel, and the rest of the bands have minimal reflectivity. Thus, the exponential attenuation of high orders shows diminishing spectral energy in the red channel as a brightness effect. The coral SRF has its peak in the red channel with a relatively low but similar value in the green and blue channels, resulting in saturation effects towards the peak reflectance for high-order reflections. The orange has different reflectivity in the RGB channels, and the RGB ratios of reflected SPDs consecutively change, causing hue effects. Figure 1(a) shows the SRFs of the selected materials. Figure 1(b) to (g) shows the SPDs, luminous energy and chromaticity coordinates of the 0th, 1st, 2nd, 3rd and 10th reflections for broad-band xenon (Rf 94, CCT 5461 K) and blue-pump LED light (Rf 77, CCT 4745 K). The Supplementary Files (see SupplementaryMaterial.docx and SupplementaryMaterial_Spectra.xlsx) include the SRFs of selected materials and the SPDs of the illuminants, so that the interested reader may reanalyse the data.
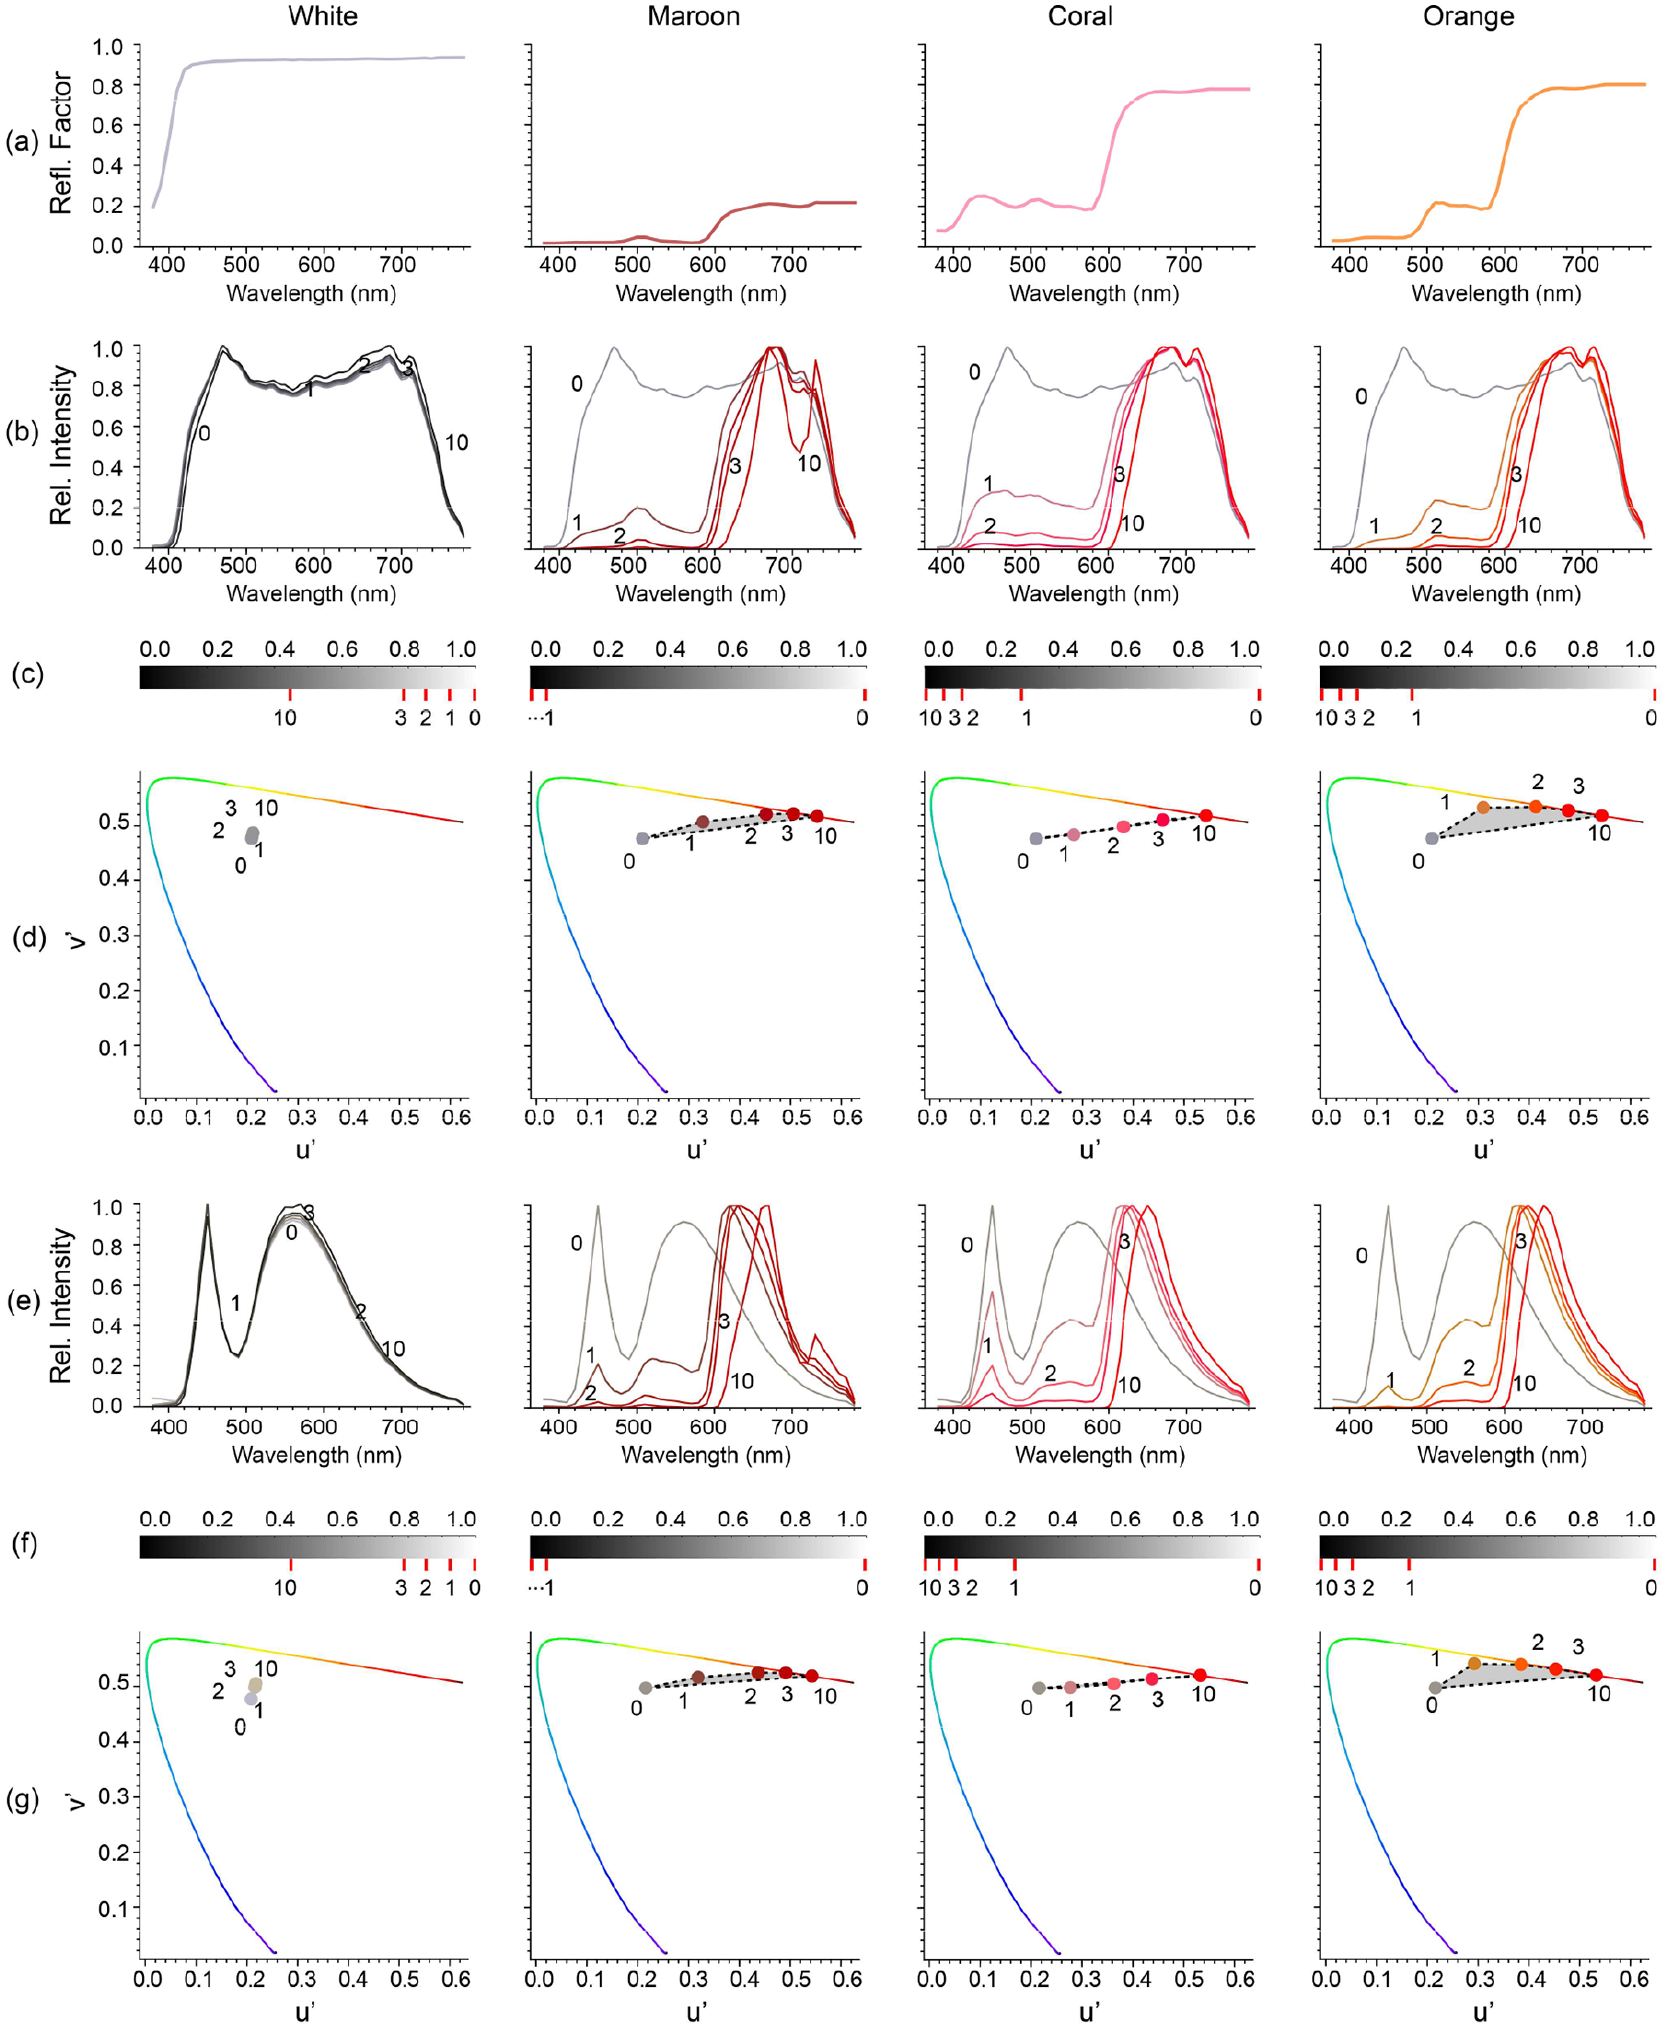
Chromatic effects of inter-reflections. (a) SRFs of white, maroon, coral and orange colours. For photographs, see Supplemental Figure F2. (b–d) Inter-reflection effects under xenon lighting. (b) The normalised SPDs of the 0th, 1st, 2nd, 3rd and 10th reflections of selected materials. See Supplementary Figure F1 for non-normalised SPDs. (c) The relative luminance of the associated reflections in ascending order marked by red dashes. (d) The chromaticity coordinates of the associated reflections in the CIE 1976 UCS diagram based on CIE 1964 10° colour-matching functions. (e–g) as (b–d) for blue-pump LED lighting
The chromaticity coordinates of high-order reflections hardly vary for the white room (see Figure 1, white-room chromaticity plots). However, the maroon material shows brightness effects; the relative luminance diminishes from the first reflection on for its low albedo, regardless of the chromatic variations. The coral colour shows saturation effects at high-order inter-reflections, that is, the chromaticity with each bounce shifts closer to the colour’s dominant wavelength on the spectral locus. For the orange colour showing the hue shift effects, the chromaticity of individual bounces forms a curve in the chromaticity diagram, from orangish to reddish (see Figure 1(c), (d), (f) and (g), the right three columns). The line between the illuminant (point 0) and the material SRF’s dominant wavelength on the spectral locus (approached by point 10) and the lines between points 0, 1, 2, . . . span the area of the effective light chromaticities.
Rendering of object colours will be impacted by these chromatic effects of light-material-geometry interactions. This affects the CCT and CRM of the actual effective light in the space instead of the source-based CCT and CRM, in other words, light instead of lighting based. Moreover, these effects vary throughout space; spectrally, directionally and spatially, thus forming important metrics to include in a light-field approach together with the already studied characteristics of light density, vector, diffuseness, squash, brilliance, flow and zones. This paper tested these interaction effects in physical and simulated scenes for an extensive range of material and illuminant spectra.
3. Experiment 1 – CCT and colour rendition variations in a physical box scene
Chromatic effects of inter-reflections have a major influence on the diffuse light-field component due to their omnidirectional nature and a minor influence on the directional light-field component. 40 The effective CCT and colour fidelity properties of the actual light in a space are therefore predicted to vary as a function of the contribution of the diffuse and directional light-field components: the more direct lighting (often consisting of a major directional and minor diffuse contribution), the more it will be consistent with the original CCT and colour fidelity of the lamp, and the more indirect lighting (often a major diffuse and minor directional contribution), the more the CCT and colour fidelity will deviate. Here we empirically test how chromatic effects of inter-reflections affect the CCT and colour fidelity for up to first-order light-field components.
3.1 Method
3.1.1 Physical test scenes
We constructed four physical windowless box spaces with a length, width and height of 1200 mm × 660 mm × 660 mm. The spaces were uniformly covered in four different material colours. The surface materials were created by matte white paint, or A3 paper sheets printed with RGB colours including maroon (0.5, 0.1, 0.1), coral (0.9, 0.5, 0.5) and orange (0.9, 0.5, 0.1). The SRFs of those materials were measured with an X-Rite portable handheld spectrophotometer (Ci60 Series) (Figure 1(a)). As verified by full spectral modelling in Section 2, the selected chromatic material colours under typical white illumination show brightness, saturation and hue effects in the presence of inter-reflections, respectively. 3
The box spaces were illuminated by a ceiling-recessed planar luminaire (377 mm × 155 mm). The luminaire employed a micro prismatic diffuser that evenly dispersed the light in the space. We specifically selected two lamps with typical SPDs, that is, xenon lights (Rf 94, CCT 5461 K) with a broadband spectrum and fluorescent (Rf 83, CCT 4284 K) with a spiky spectrum. We combined these two illuminants with the four materials for a total of eight light scenes.
3.1.2 Data collection
We measured the local light fields via the cubic illumination system36,48,49 in the centre and left-back corner of the physical space for all eight scenes, capturing the spectral irradiance on the six faces of a small reference cube (Figure 2) centred at the measurement point. The cube was aligned with the principal surfaces of the surrounding environment. The spectral irradiance was acquired over a wavelength range from 380 nm to 780 nm in 11 nm increments and was internally interpolated to 1 nm increments. Each cubic measurement, including placement of the apparatus, lasted about 1 minute. The experimenter (the first author) was covered in black to minimise disturbing reflections. A total of 16 cubic measurements (96 irradiance spectra) were collected.
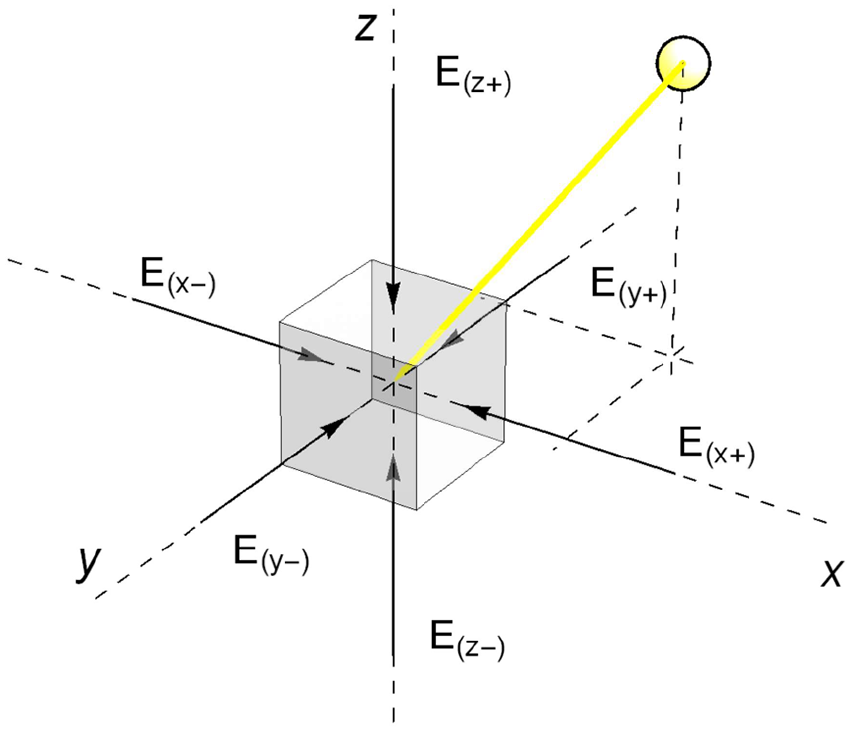
The frame of reference for the cubic illumination measurements
3.1.3 Data processing and analysis
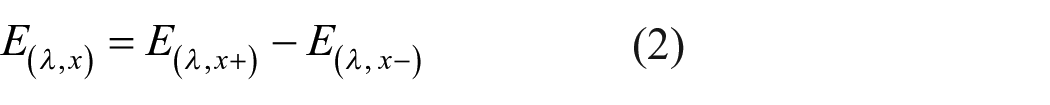
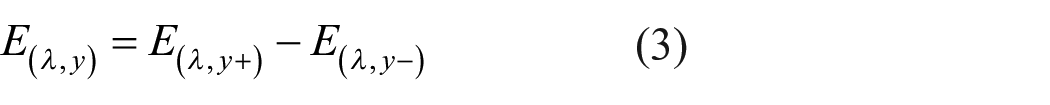
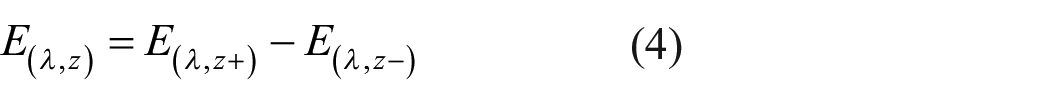
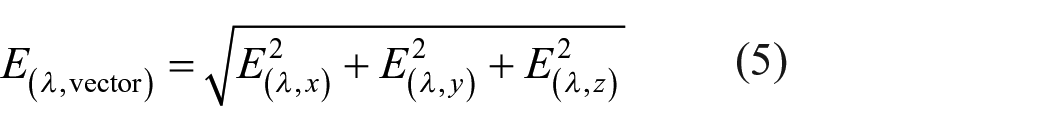
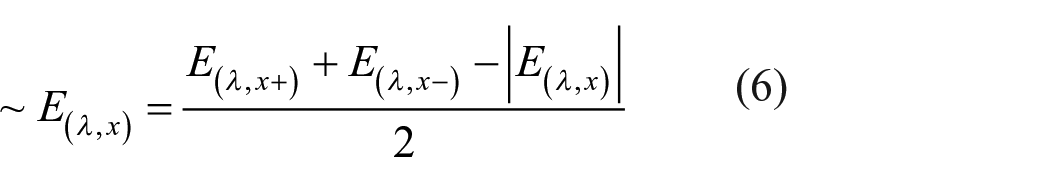
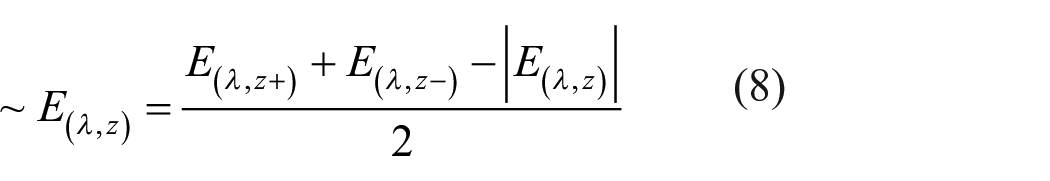
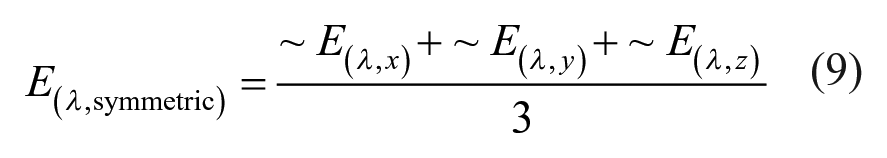
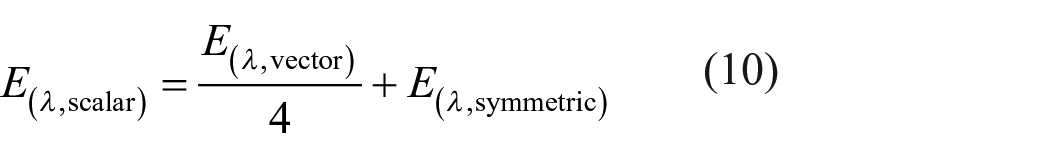
For each cubic measurement, the six spectral irradiance values are designated E(λ, x+), E(λ, x−), E(λ, y+), E(λ, y−), E(λ, z+) and E(λ, z−), representing the measurements in the positive and negative directions along the coordinate axes. The subtractions of the opposed paired measurements correspond to the light vector components in the coordinate-axis directions, that is, E(λ, x), E(λ, y) and E(λ, z) (Equations (2)–(4)) and define the direction of the light vector. The length of the vector corresponds with the magnitude of the light vector E(λ, vector) (Equation 5). The light density E(λ, scalar) is obtained via the sum of the symmetric component E(λ, symmetric) and the weighted vector’s contribution (Equation 10). E(λ, symmetric) equals the average value of the symmetric components of all directions (Equation 9). The light vector’s contribution to the light density is E(λ, vector)/4, which was derived analytically. 36

We used both CRI Ra and TM-30 Rf to quantify the colour fidelity. The illumination’s chromaticity is spatially and directionally varying within a scene, while chromatic adaptation is assumed to be based on the scene’s white point (the anchor).50,51 The reference illuminant of the whole scene is thus defined as the broadband spectrum sharing the same CCT as the lamp, under the brightest-is-white assumption.51–54 The Ra was calculated in the conventional manner. 55 The Rf calculation was based on the TM-30-18 standard framework via Luxpy. 56
3.2 Results
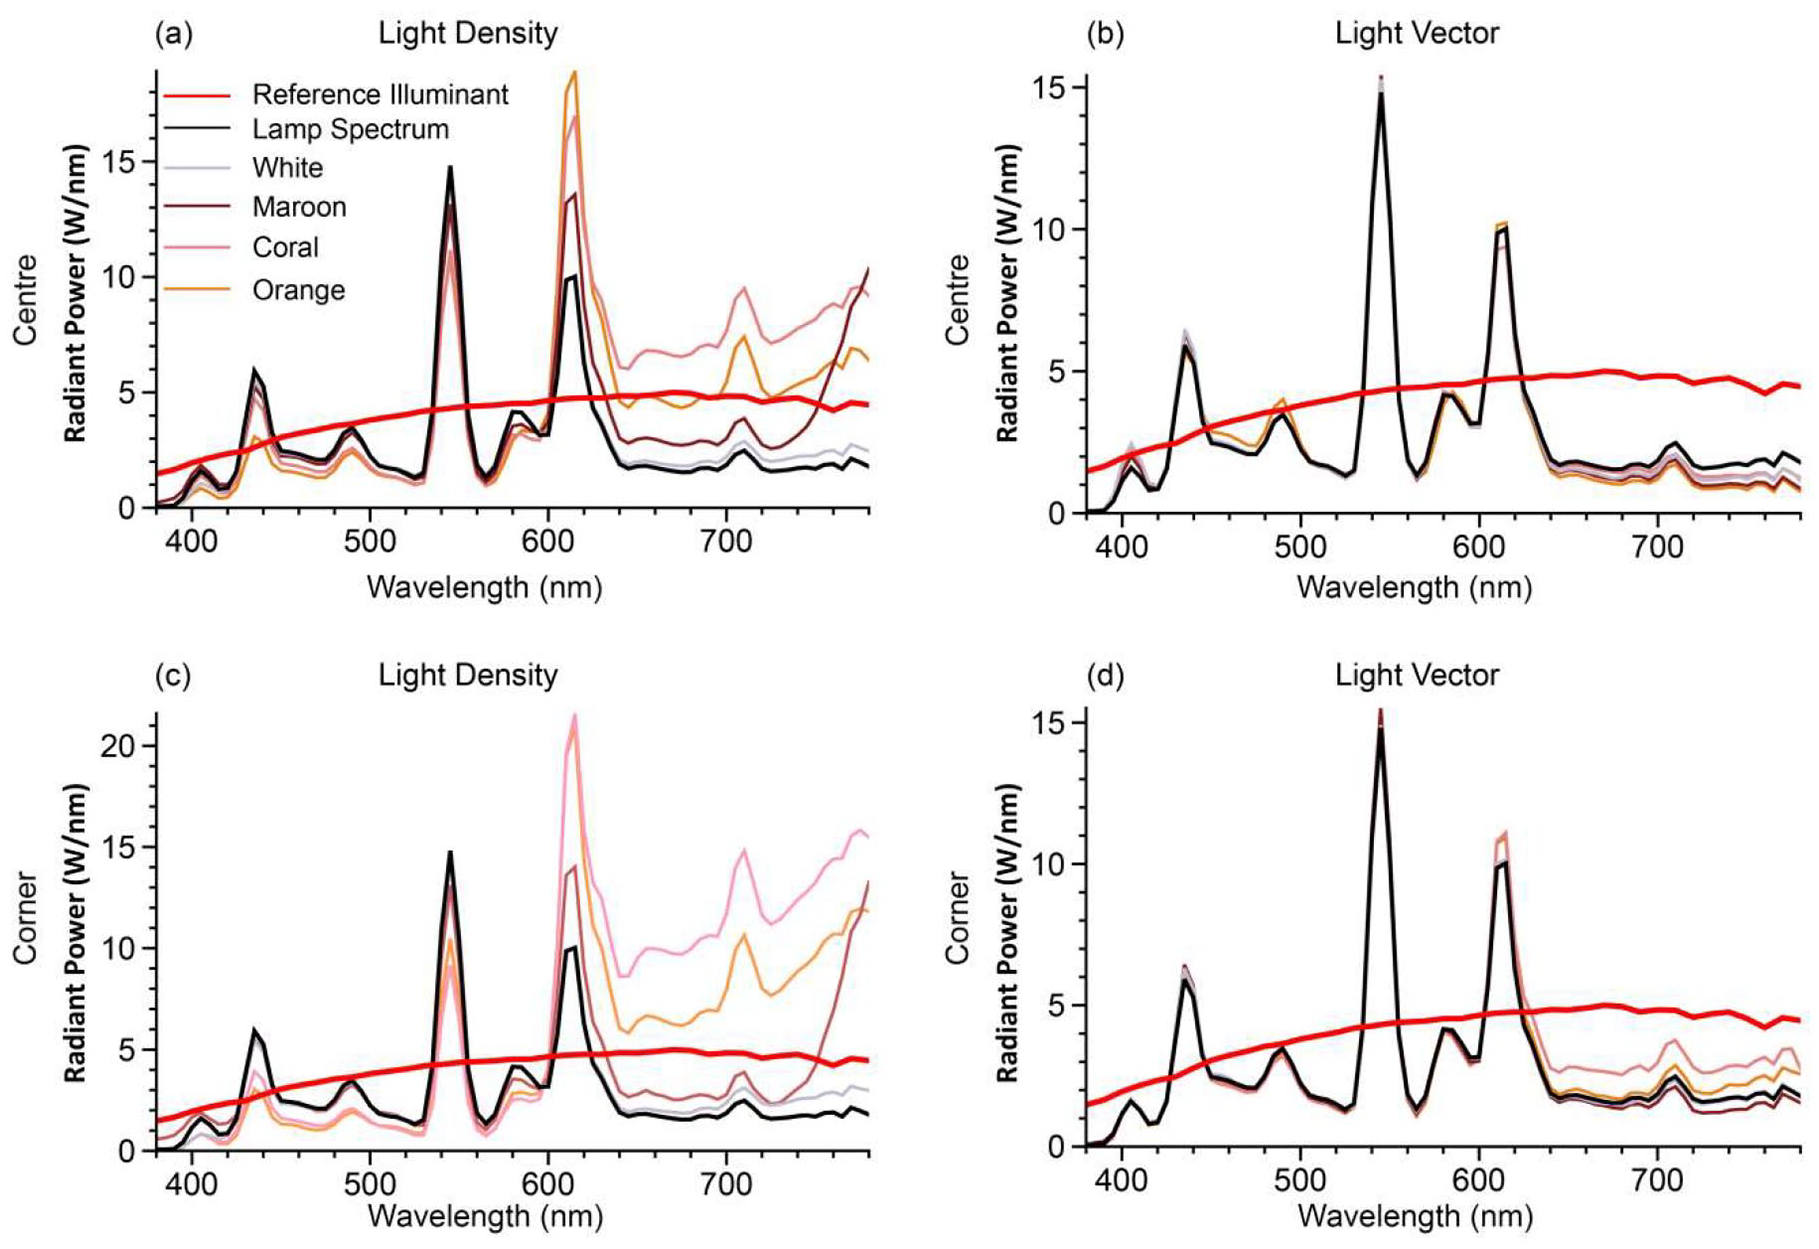
Figure 3 shows the SPDs of the light densities and vectors in the centre (a–b) and corner (c–d) of the box rooms under xenon illumination. We plotted the SPDs of the xenon lamp (black line) and CIE D Series reference illuminant having the same CCT (red line) as the baselines. The measured effective spectra were included in Supplemental Material Section S5.
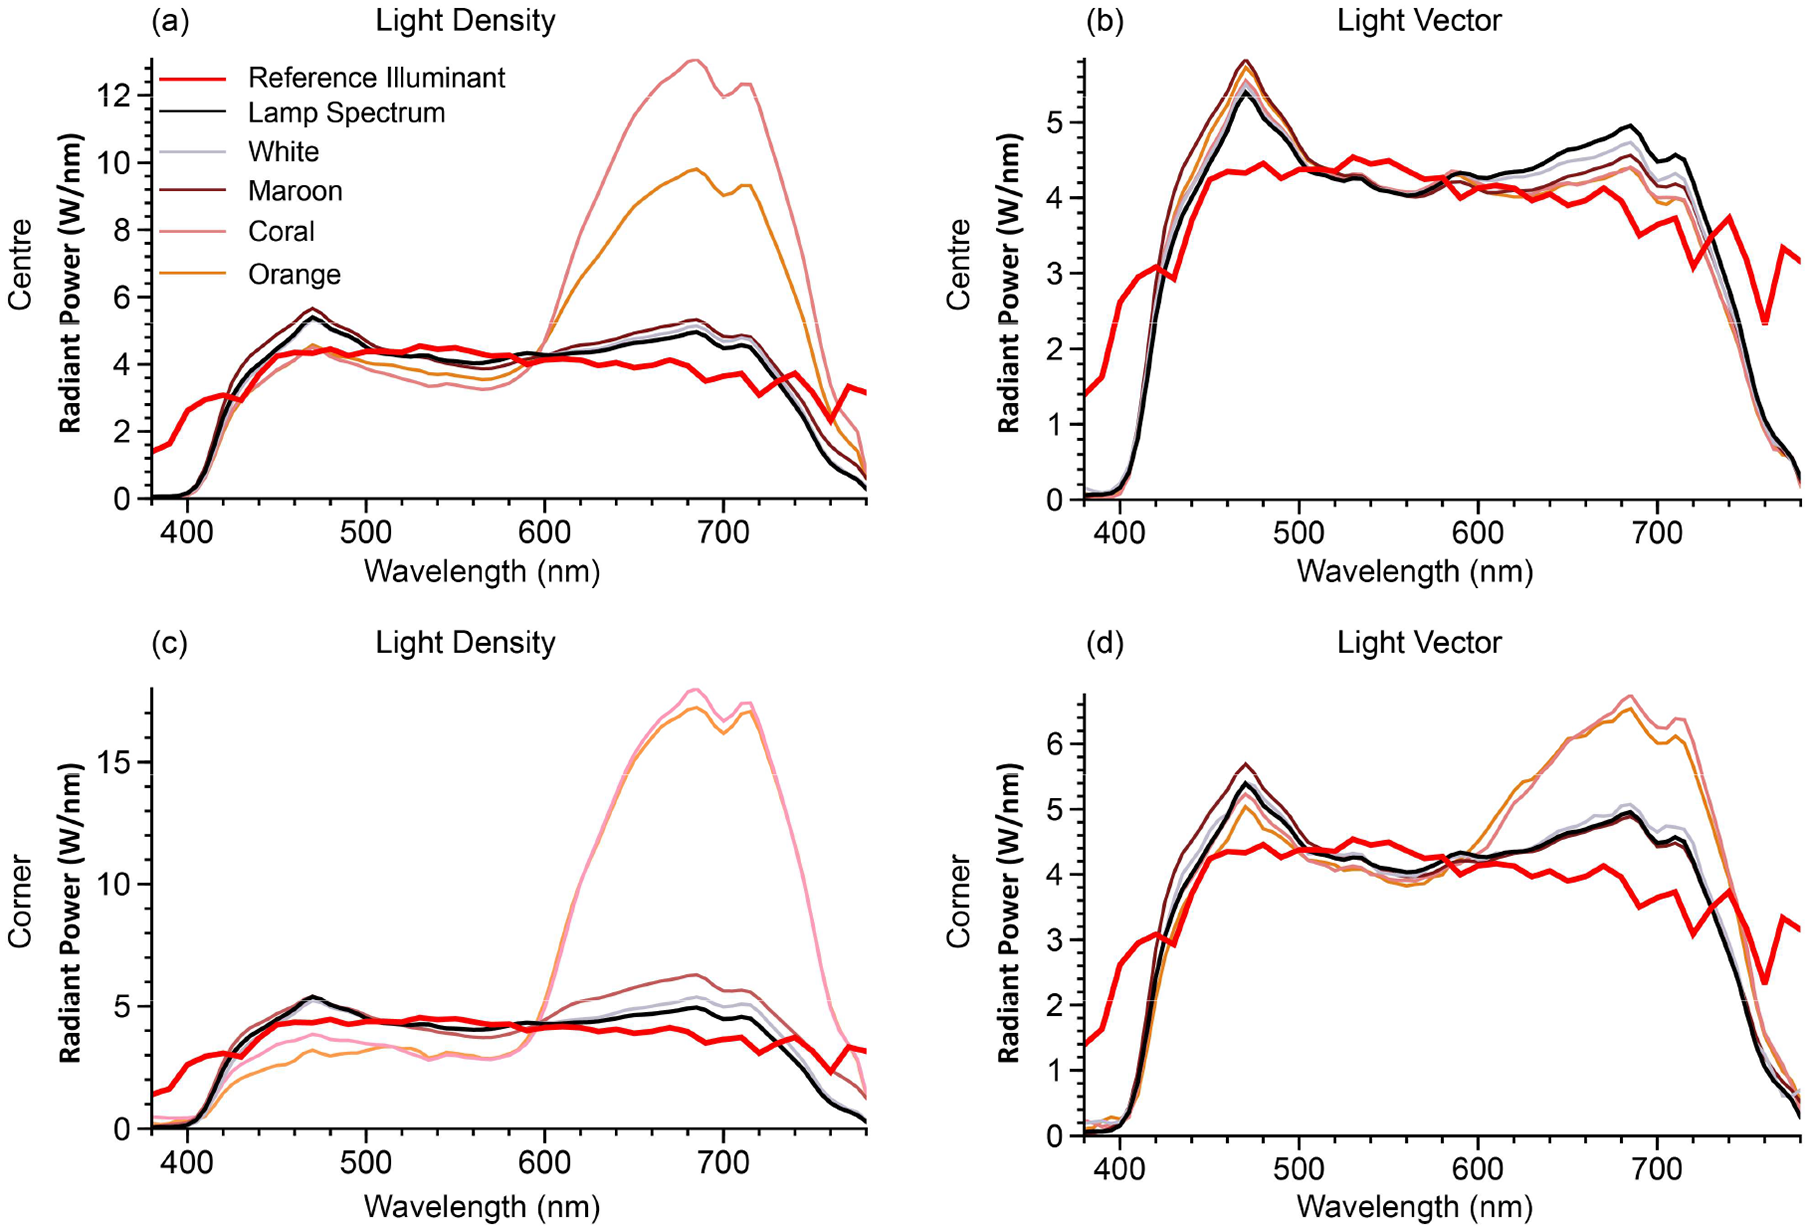
Spectral effects of light-material interactions. The SPDs of the light density ((a) and (c)) and light vector ((b) and (d)) in the centre (a–b) and corner (c–d) for the four finishes illuminated by a xenon lamp. The black line indicates the lamp spectrum. The red line is the reference spectrum (CIE D Series reference illuminant having the same CCT as the lamp). The other coloured lines are the effective light spectra corresponding to the room colours
The light densities’ and vectors’ SPDs in the white room were consistently similar to the lamp spectrum. For the other three finishes, the SPDs of the light densities differed from the lamp spectrum, showing a peak in the long-wavelength part and attenuation in the short-wavelength part, corresponding to the materials’ SRF shapes. The spectral differences in the corner were larger than those in the centre. The effects in the maroon room were smaller than in the coral and orange rooms. The light vectors’ SPDs were quite similar to the lamp spectrum in the centre but also showed deviations in the corner of the coral and orange rooms. These results thus are in line with the hypothesis that the light vector (directional light-field component) corresponds better with the illuminant spectrum and the density (diffuse light-field component) with the paint reflection spectrum.
Figure 5 shows the relative differences of the effective CCT, Duv (distance from the Planckian locus), Ra and Rf of the light density (grey bars) and vectors (black bars) relative to those of the lamp for the centre (a) and the corner (b) of the box rooms under xenon illumination. Ra and Rf are designated to quantify the colour fidelity of white primary illumination. Multiple effective Duv values are beyond Ra and Rf’s stated limits, and thus, these metrics cannot be applied formally. However, this type of scene is intended to be illuminated by white light, and excessive Duv is due to chromatic inter-reflections. These metrics are conventionally used in such a scene as a standard benchmark for the light qualities, and we thus still applied them to assess how inter-reflections can modify the effective light qualities. It is important to note that for the values beyond the Duv limits, the effective light cannot even be classified as white anymore according to ANSI C78.377-2017, 57 but is actually chromatic. The associated absolute colour fidelity values are unlikely to correspond to perception, but the relative differences between light density and light vector in the centre and corner give an estimate of directional and spatial colour fidelity variations due to inter-reflections.
As shown in Figure 5, all colourimetric values for the white room are almost identical to the lamp’s with minor variations. For the other three finishes, the effective CCTs of the light densities (grey bars) are up to 2905 K lower than those of the light vectors (black bars) and up to 3353 K lower than the reference lamp CCT. The light vectors’ CCTs were more consistent with the reference illuminant values and deviated maximally 857 K in the corner.
The Duv of the light densities and vectors for all room cases were consistently negative, indicating that their chromaticity coordinates were below the Planckian locus. The Duv for the light densities were lower than the lamp values.
The effective Ra and Rf results for xenon lighting were found to be similar in the sense that the colour fidelity measures for the light densities were consistently lower than for the vectors in the coloured rooms. However, light-density Ra values tended to be lower than Rf values for the chromatic rooms. The light densities’ Ra and Rf decreased up to 63% and 36% compared to that of the lamp, respectively. The deviations in the corner were larger than in the centre. Also, material colours with a high albedo and brightness value (coral and orange) showed stronger effects than for a low albedo and brightness value (maroon).
Figures 4 and 5(c) and (d) show the same information for fluorescent light. The reference illuminant was a mixture of Planckian radiation and the D Series illuminant. The lamp spectrum differs markedly from the reference illuminant. The measured effective spectra were included in Supplemental Material Section S6. The results in the white room were consistent with the lamp. The chromatic materials caused lower CCTs and larger Duv magnitudes for the light density, similar to the xenon condition. The Ra of the light density in the maroon space increased. The decrease of Ra and Rf for the light densities in the coral and orange space was smaller than those under xenon illumination. We again found differential colourimetric properties between the light density and light vector and major differences between lamp-specified and light-based CCT and colour fidelity.
Spectral effects of light-material interactions. The SPDs of the light density ((a) and (c)) and light vector ((b) and (d)) in the centre (a–b) and corner (c–d) for the four finishes illuminated by a fluorescent lamp. The black line indicates the lamp spectrum. The red line is the reference spectrum (a mixture of Planckian radiation and the CIE D Series reference illuminant having the same CCT as the lamp). The other coloured lines are the effective light spectra corresponding to the room colours
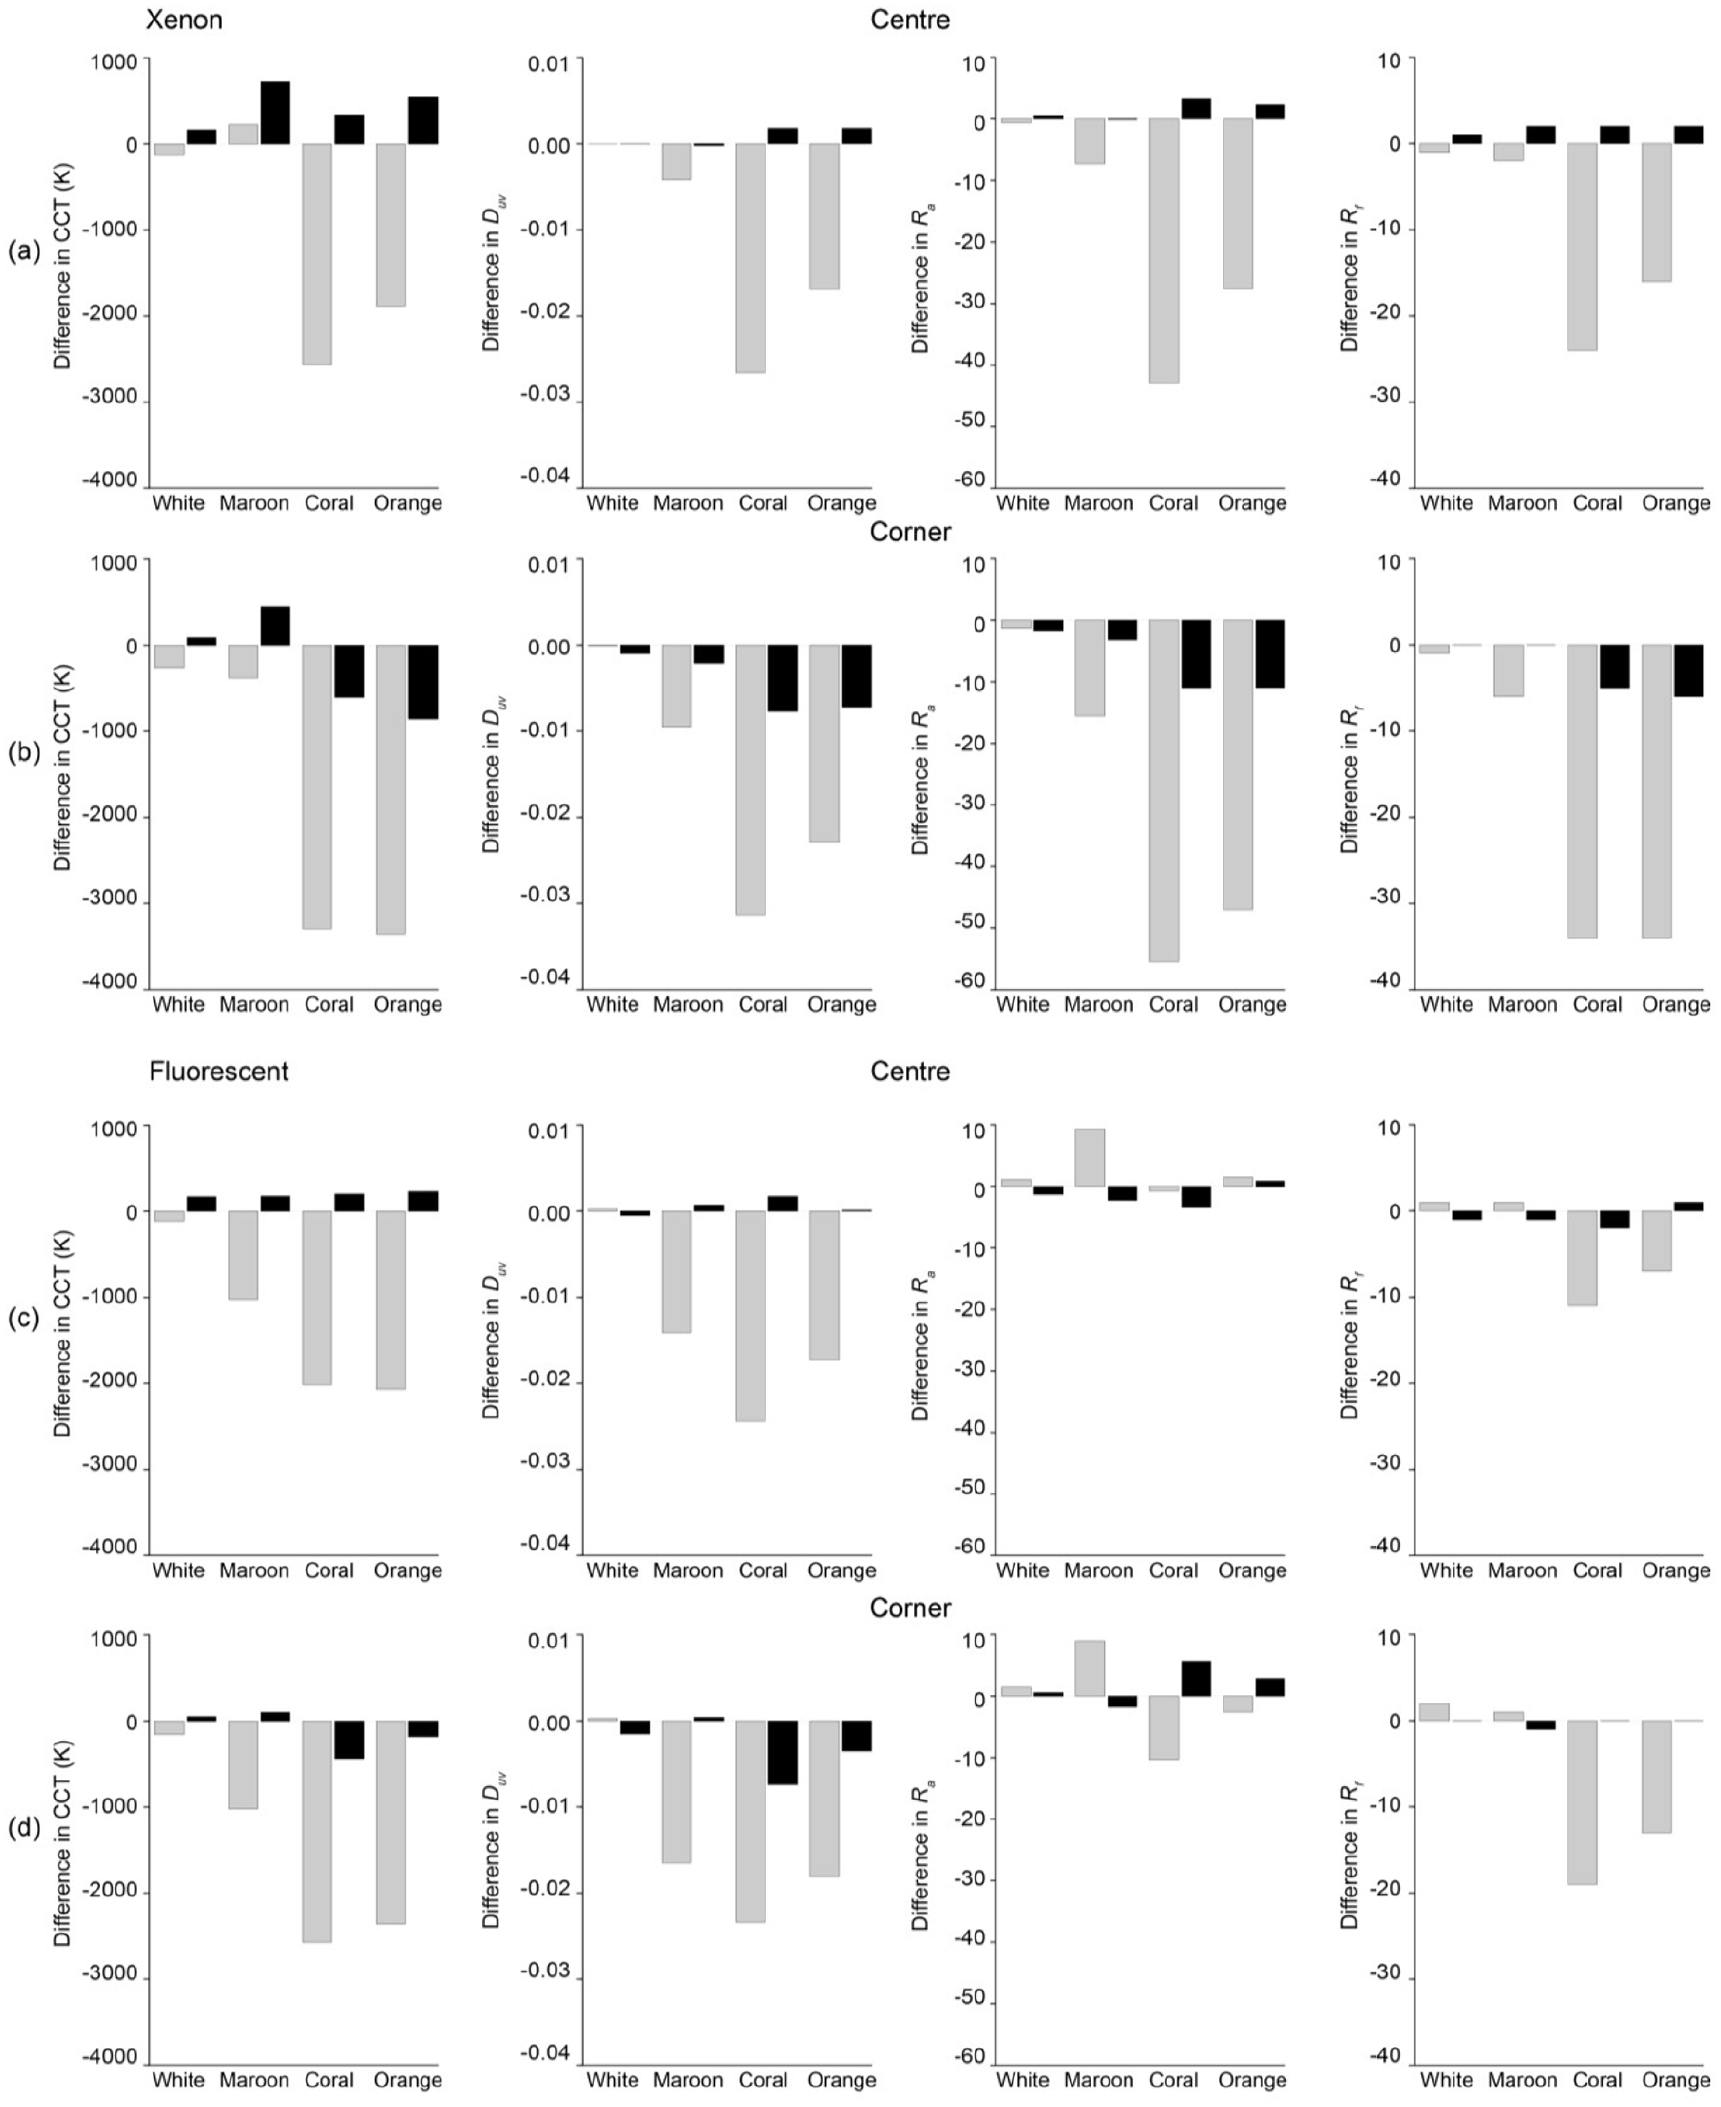
The relative differences between the effective colour metrics and lamp-specified colour metrics. The CCTs, Duv, Ra and Rf differences of the light densities (grey bars) and the light vectors (black bars) relative to those of the lamp in the centre (a) and corner (b) of the four selected finishes illuminated by a xenon lamp. (c) and (d) as (a) and (b) for a fluorescent lamp. The raw tabular colourimetric values are supplied in Supplemental Material Section S7
3.3 Overview of findings
Chromatic materials of a space can alter the light density’s colourimetric properties in that space due to inter-reflections. Their impact on the light vectors is relatively small, except for deep parts of the space where the chromatic diffuse inter-reflections dominate and directed white illumination attenuates, but on the light density can be large. The colour temperature of the lamp and effective light is in the coral and orange cases too large to be called the same ‘nominal’ CCT. 57 Additionally, for those cases we find differences for the colour fidelity larger than five points, which tends to be noticeable. 15 This will cause chromatic gradients on 3D objects (and people) in the space, in which diffusely scattered light greatly affects the shadows and shaded parts and the direct light has major effects on highlights and directly lit parts. Effects were major in our uni-chromatic cases with high purity, namely the coral and orange rooms. For the maroon room the low reflectivity resulted in relatively minor effects on the effective metrics. Colour fidelity was impacted in most coloured rooms. The selected room colours also decreased the CCT, which can be explained by the profile of their SRFs, having peaks in the long-wavelength range. The colours used here were chosen for their qualitatively different effects (brightness, saturation, hue shifts) and all had long dominant wavelengths. This raises the question how different types of SRFs will impact the effective light’s chromatic properties.
4. Experiment 2 – CCT and colour rendition variations in a simulated box space
This section aimed to quantify the spatial variations of the effective CCTs and colour fidelity measures for more extensive and representative material-light interactions in the box space. Using hyperspectral computer simulations, we systematically varied the room material SRFs and illuminant SPDs of the space to study their effects on the chromatic light-field properties and effective CCTs and colour fidelity measures.
4.1 Methods
4.1.1 Simulated test scenes
A digital model of a 6000 mm × 3300 mm × 3300 mm box scene was constructed. The space was uni-chromatic and illuminated by a planar luminaire (1884 mm × 773 mm) recessed in the centre of the ceiling. Its luminous flux was 3500 lm. The scene geometry was the same as the physical scene from experiment one but built at a scale of 5:1, representing a realistic single-floor space.
The illuminant spectra (see Supplemental Material Figure F3) were selected from the sources enumerated in the CIE publication on colourimetry 58 and representative LEDs from the ‘example SPD library’ of the ANSI/IES TM-30-18 Advanced Calculation Tool 59 (Table 1). We included representative sources that are extensively used in lighting research and applications. These spectral samples (380 nm–780 nm with a 5 nm wavelength increment) comprise three broadband spectra, three fluorescent sources and six LEDs. As the selected broadband spectra have (nearly) perfect colour fidelity, the inclusion of these sources helps to understand how material colours influence effective CCTs and colour fidelity measures. Three fluorescents represent typical warm, neutral and cool white illuminants. The first three LEDs (no. 7–9) are yellow phosphor-coated types with warm, neutral and cool white CCTs. Hybrid pump LED (no. 10) utilises both phosphor coating and red LED to generate white illumination. The last two LEDs are three-primary and four-primary types with similar CCTs but with major colour fidelity differences.
Specifications of lamps used
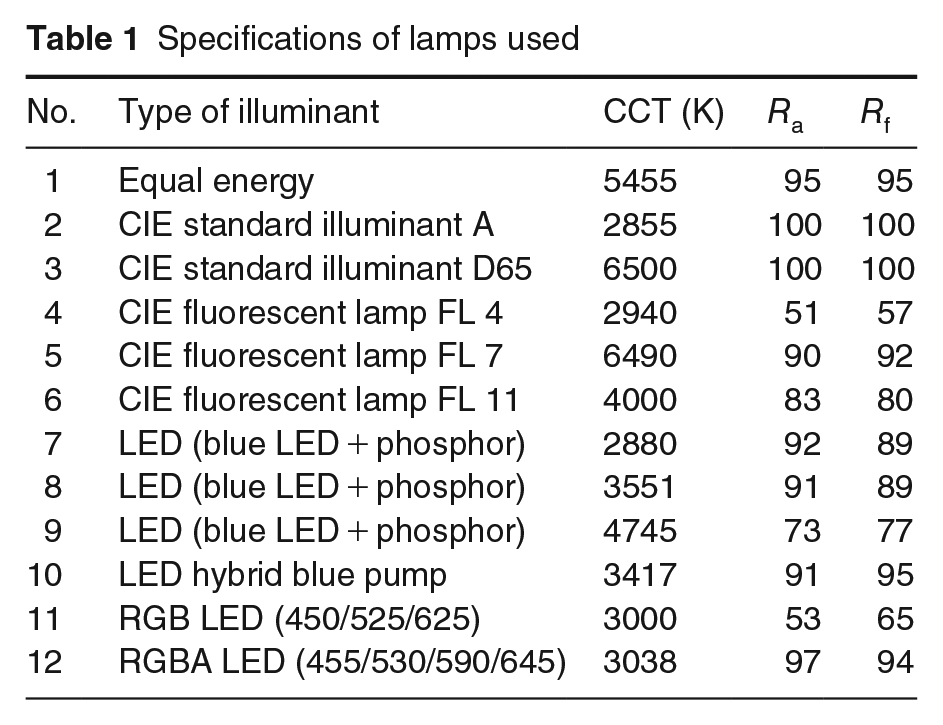
The material colours were sampled based on the Munsell system due to its wide usage in colour testing and perceptual uniformity. We first selected five pure colours (high chroma and high value) from the Munsell principal hues, that is, 5RV70C08, 5GV70C08, 5BV70C08, 5YV70C08 and 5PV70C08. Another 15 colours were sampled systematically by reducing the chroma and values of the pure colours (see Supplemental Figure F4). Altogether we sampled 20 colours with varying levels of colour purities. The SRFs of the sampled colours were from the ‘Munsell colours matt’ dataset of the University of Kuopio 60 (see Supplemental Figure F5), reported from 400 nm to 700 nm with a 5 nm increment. Thus, a total of 240 combinations of illuminant and reflectance spectral pairs were applied to the test scene.
4.1.2 Hyperspectral simulation and analysis
We used the Autodesk® 3ds Max Mental Ray engine. This system’s Lighting Analysis Assistant allows irradiance calculations via the virtual light sensor over a specific area without rendering the whole scene. 61 We placed two cubic light meters in each test scene, one in the centre and another in the left-back corner. The cubic light meter was configured by placing six sensors facing the negative and positive sides of the principal dimensional axes. The default lighting calculation in 3ds Max utilises RGB coarse-grained wavebands. The RGB radiant power weighted to approximate the CIE-Y tristimulus provides photometric outputs, such as illuminance and luminance. The simulated photometric outputs are reliable, 62 but physically accurate colourimetric outputs demand finer spectral resolution. 63
Therefore, instead of default RGB bands, we implemented N-stepping.64,65 This approximates the radiant power per waveband in N steps, where N can be any positive integer. The spectrum is divided into N consecutive, equally spaced wavebands, with N defining the spectral resolution and the number of monochromatic channels during the calculations. The light sensor reading from each waveband indicates the irradiance value of the corresponding waveband. Since the spectral resolution of the sampled reflectance spectra was lower than the sampled light spectra, we subsampled the latter. So, we did hyperspectral cubic measurements based on 61 channels (from 400 nm to 700 nm with 5 nm steps) for all simulated box scenes. We then applied the same methods as in experiment one to estimate the light density and vector SPDs and their associated CCTs and colour fidelity measures.
4.2 Results: Colourimetric analysis
Figures 6 and 7 show the CCT and Rf differences between the lamp and the two light-field components, ordered according to the numbers of the lamps in Table 1. Negative values indicate decreases of CCT or Rf relative to lamp properties, while positive values show increases. The colours of the bars correspond to the room material colours grouped by their hues.
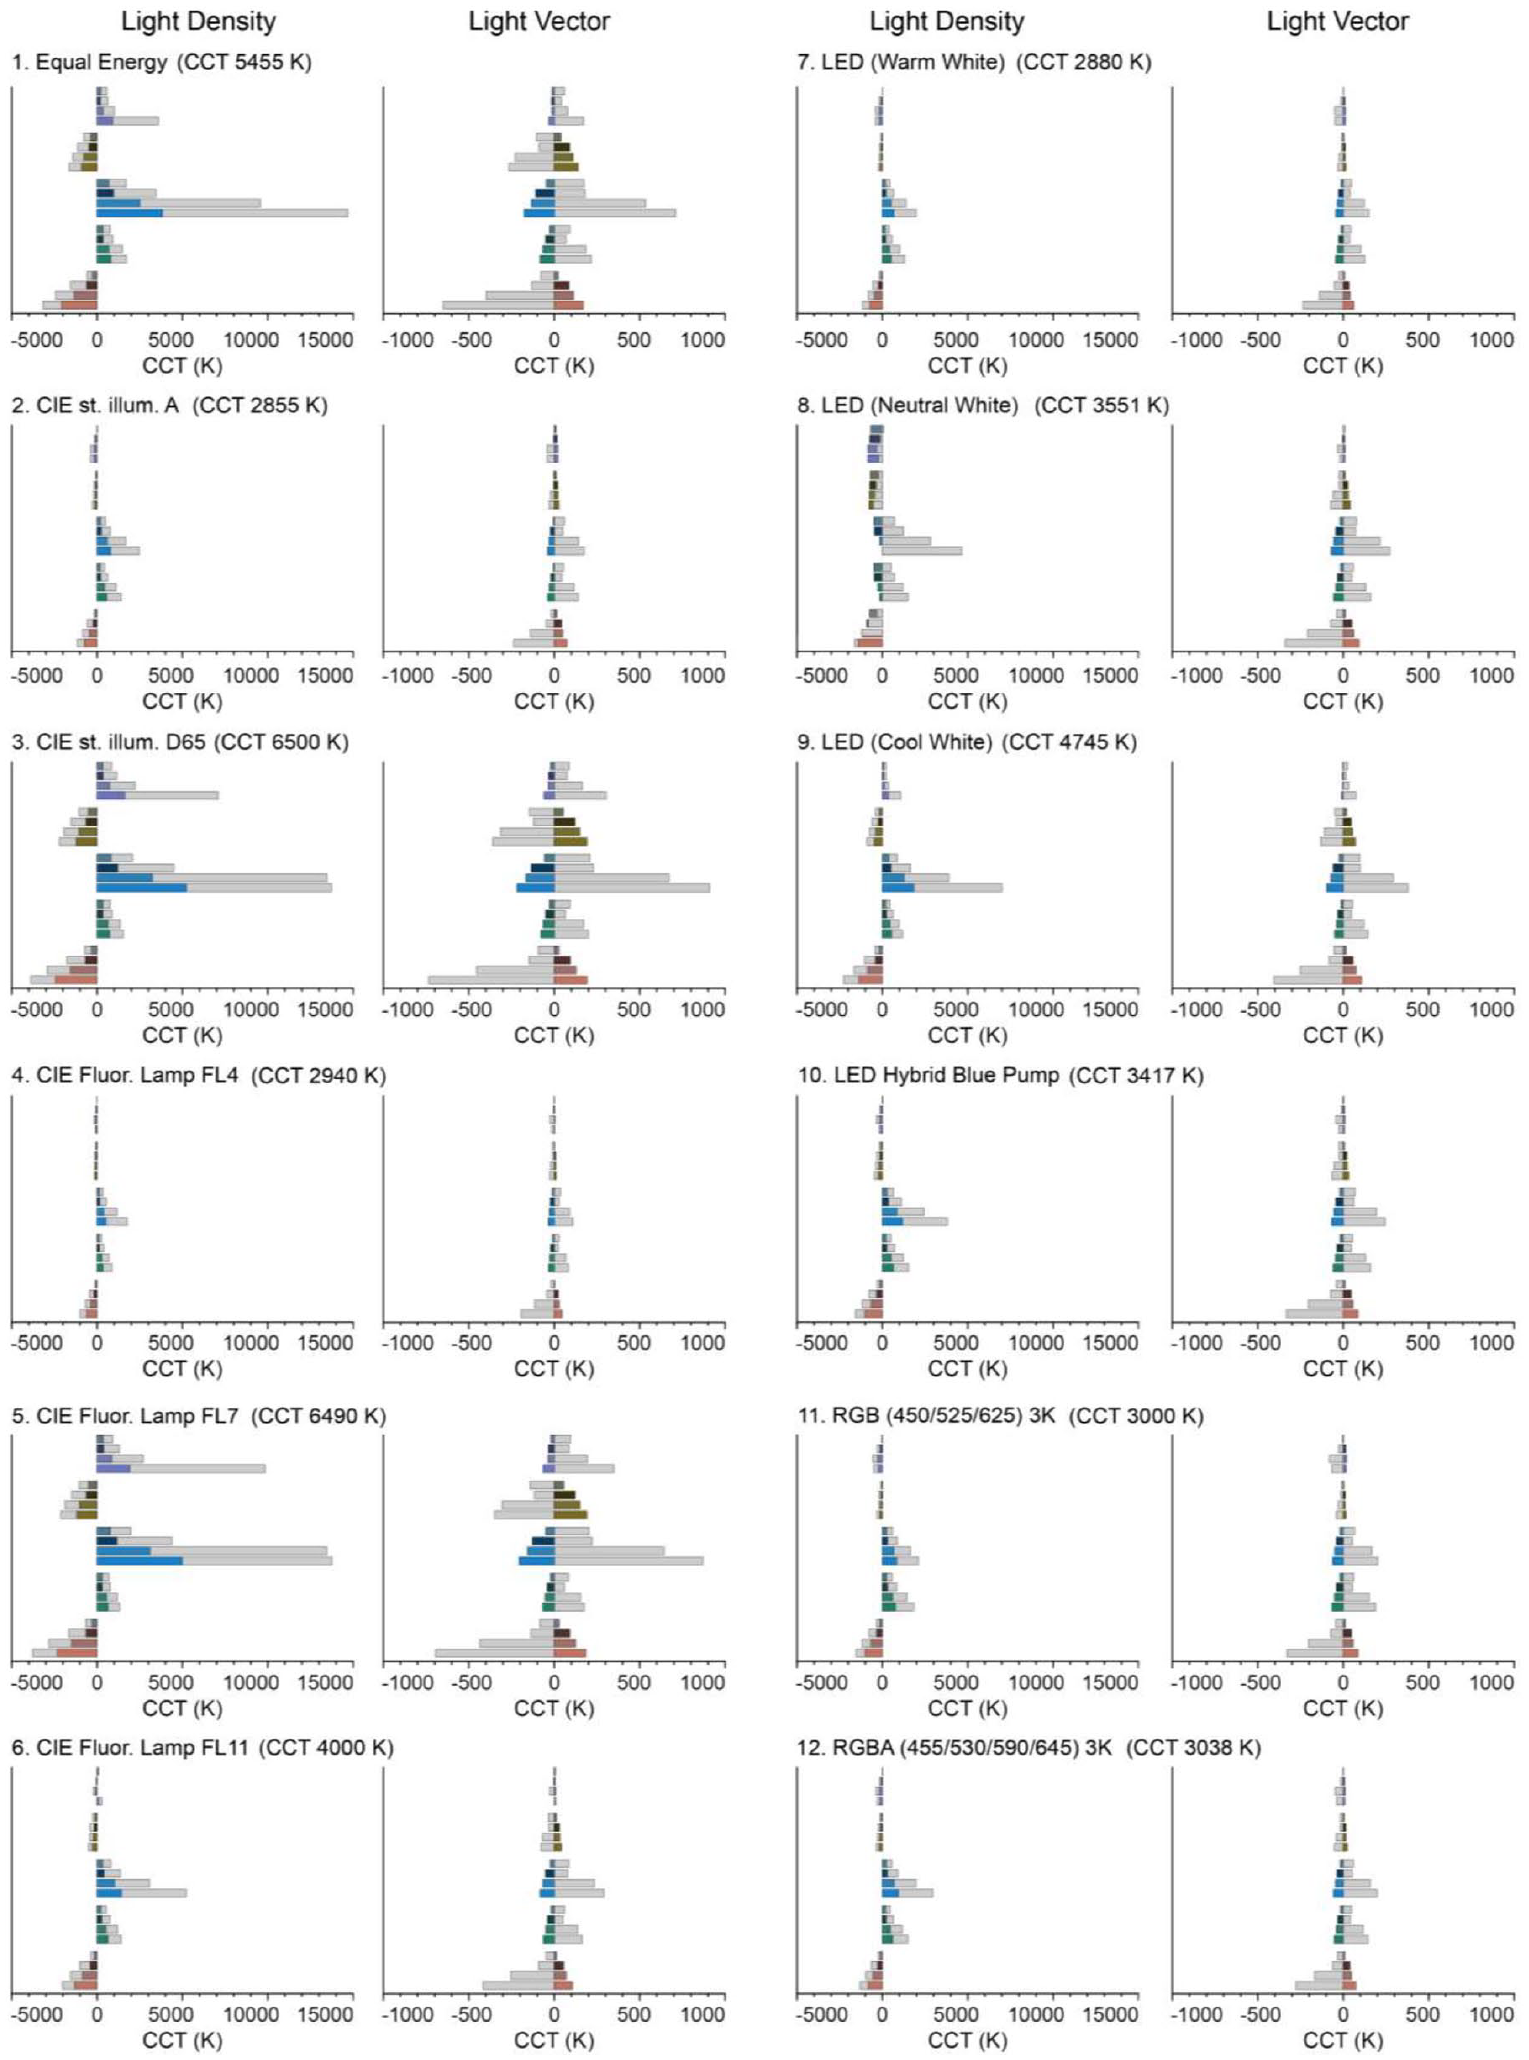
The relative differences between the light-field CCTs and lamp-specified CCTs. The plots were numbered as Table 1. The bars were grouped according to the hues of material colours in the order of R-G-B-Y-P. The colours within each hue group were arranged by decreasing colour purity from bottom to top. The coloured bars indicate the results of the centre location, while superimposed grey bars indicate those for the corner location. The associated tabular values are supplied in Supplemental Material Section S13. The light-field Duv values are included in Supplemental Figure F8
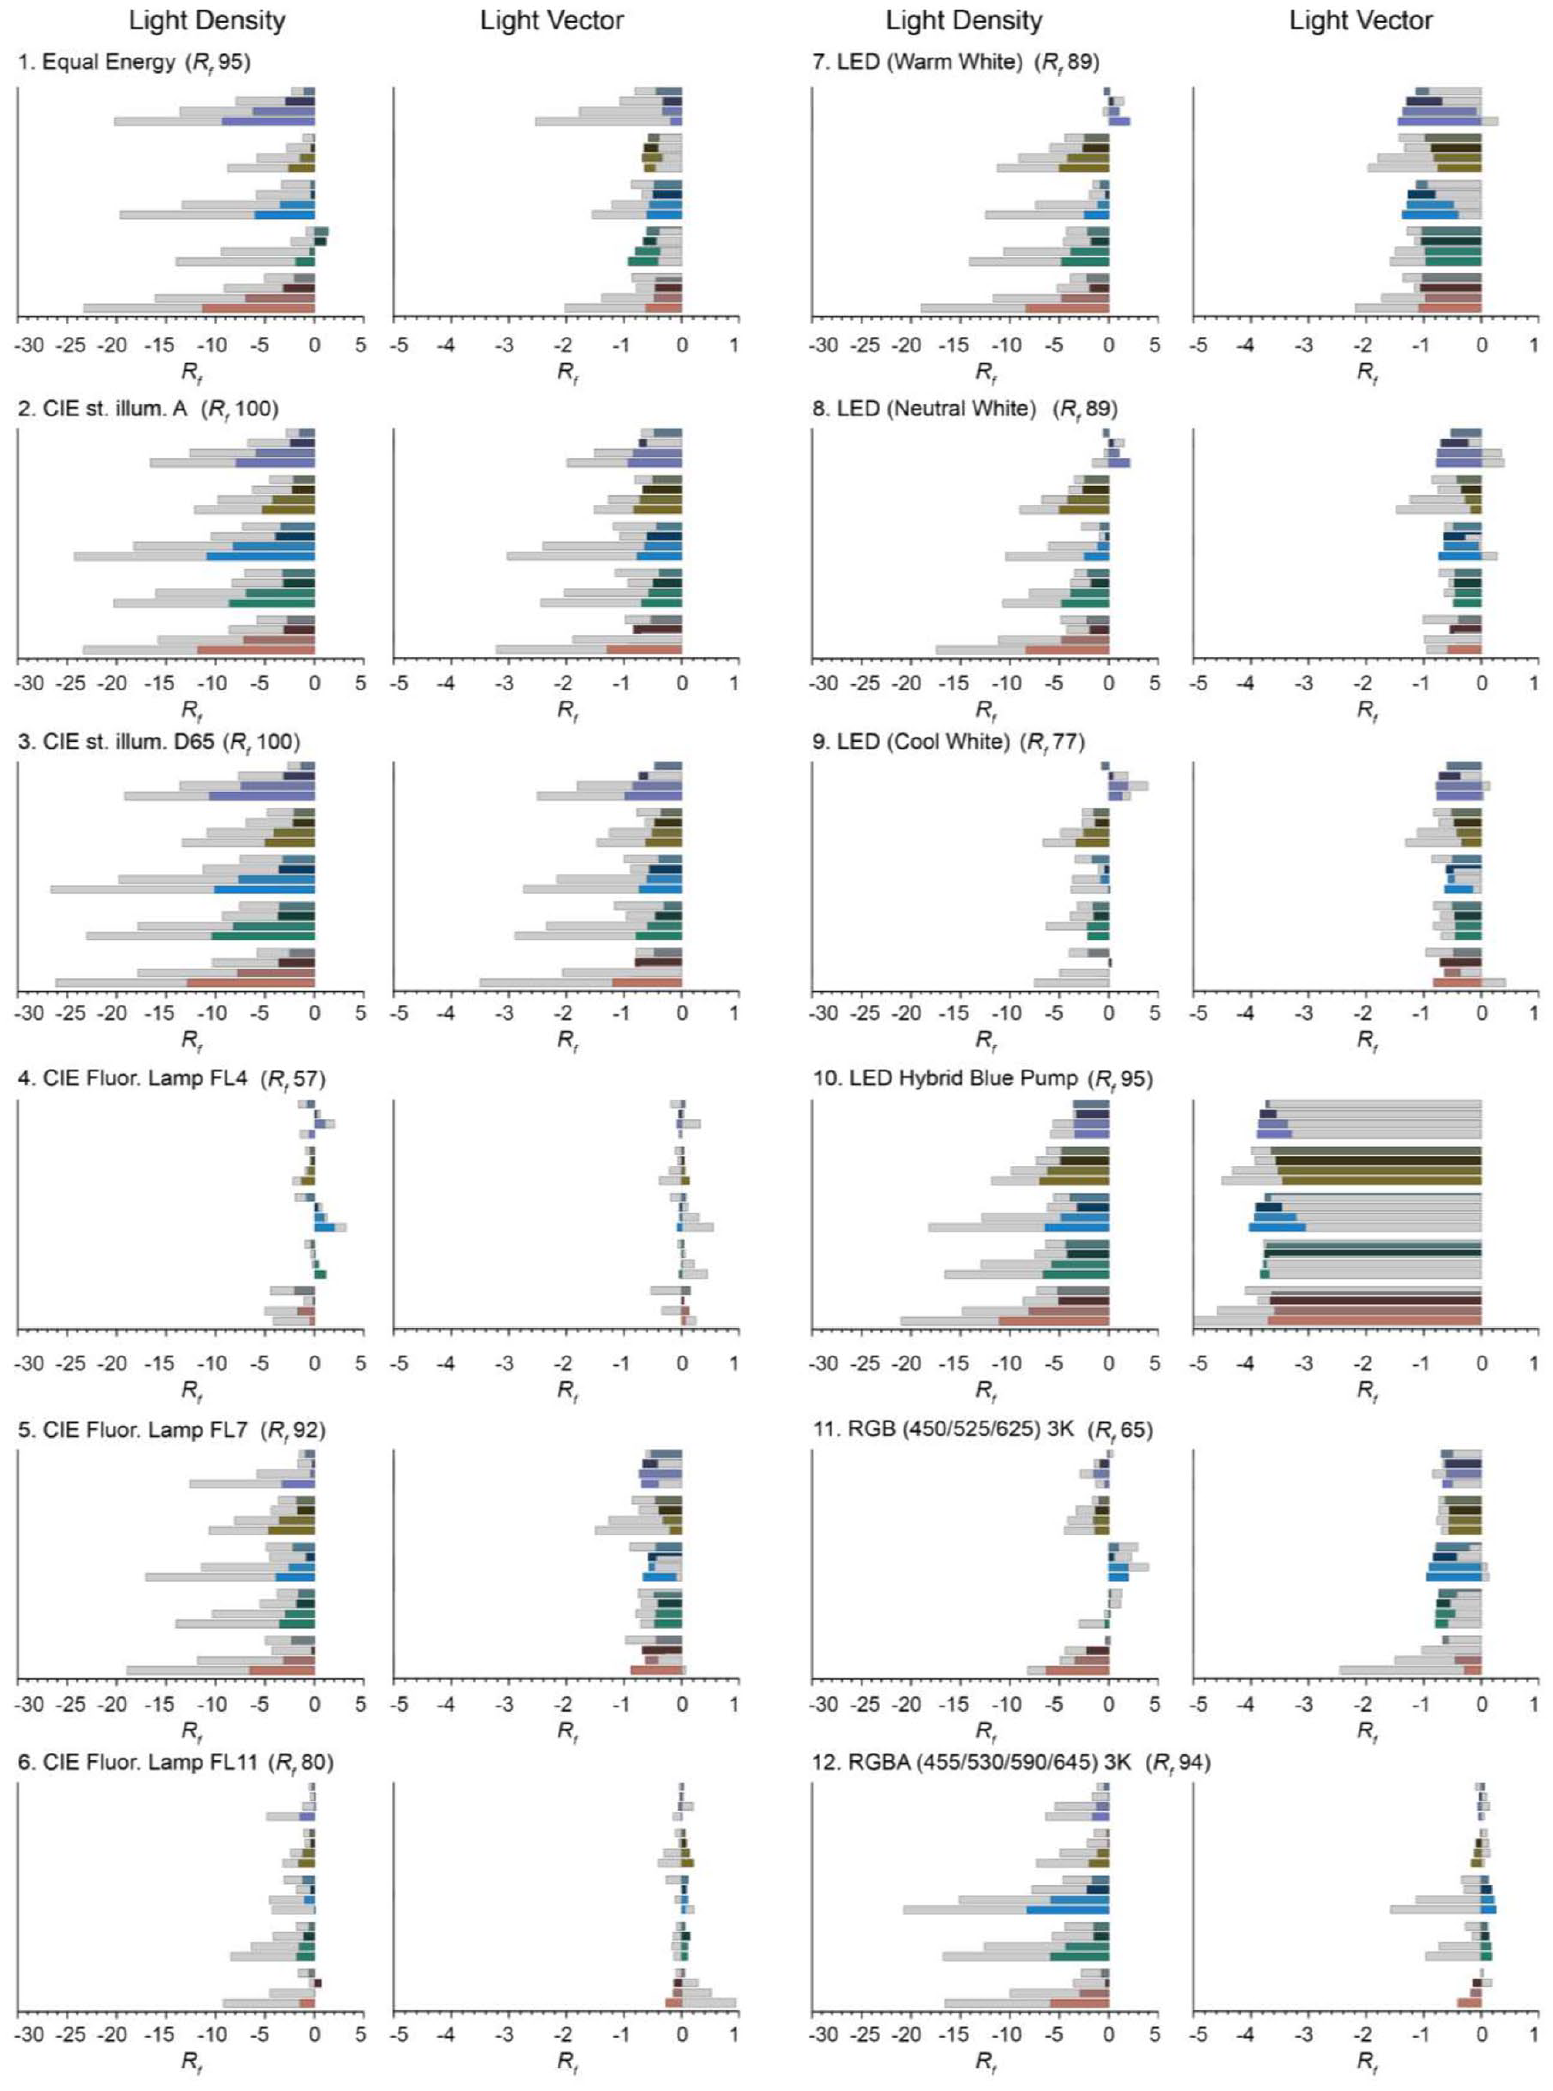
The relative differences between the light-field colour fidelity and lamp-specified colour fidelity. The plots were arranged in the same way as in Figure 7. The bars were grouped according to the hues of material colours in the order of R-G-B-Y-P. The colours within each hue group were arranged by decreasing colour purity from bottom to top. The coloured bars indicate the results of the centre location, while superimposed grey bars indicate those for the corner location. The associated tabular values are supplied in Supplemental Material Section S13
The effective CCTs (Figure 6) of the light density and vector were lower or higher depending on the room colours. The directions of CCT differences were consistent among the selected lamps except lamp no. 8, while effect magnitudes varied. The SRFs with peaks in the long-wavelength part caused a decrease of the light densities’ CCTs, whereas short-wavelength peaked SRFs induced increased CCTs for the light density. The variations in the corner were larger than those in the centre. The influences on light vectors’ CCTs were minor (note that the plot scale differs from the light-density plots), and the directions of the CCT changes in the centre and corner were opposite. The effects became smaller with reductions of material chroma or value.
The Rf (Figure 7) was found to be close to that of the lamp (note the plot scale differences) for the light vectors and to decrease up to 27% for the light density in the corner for the broadband illuminants (no. 1–3). The effects in the corner were always larger than in the centre. Interestingly, in several cases (lamps 4, 6–9, 11, 12), the light densities’ Rf under a lamp increases for some material colours while it decreases for other colours. In Supplemental Figures F6 and F7, we provided the measured spectra for reference.
4.3 Results: Visualising the light-field colourimetric properties
In the former sections we analysed how inter-reflection effects influenced light-field CCT and colour fidelity. Here we study visualisations of the consequences for object colour appearance. We spectrally simulated colour checkers in the white and orange rooms illuminated by a D65 lamp (see Figure 8). The standard colour checker was made of the 15 CIE test colour samples and 5 achromatic colour samples. The effects that we studied vary also as a function of angle, which is not visible on the 2D checkers. Varying the orientation of the 2D checkers would be one way to show those angular variations, but such variations demand either large numbers of images or videos. Therefore we propose using 3D checkers with hemispheres instead of flat colour patches, which allows visual inspection of a hemisphere of directions at once. Moreover, such 3D checkers also show the colour gradients that will result on 3D objects, in one glance. The checkers were placed in the centre and bottom left corner of the room. The colours of the checkers in the white room were primarily affected by the inter-reflections in terms of luminance but not their chromaticities, and thus provided the references to compare against the orange room. The apparent colour appearances of the colour checkers in the orange room were affected by inter-reflections showing an orange colour cast. The colour cast in the corner is visually stronger than in the centre for both 2D and 3D checkers. The 3D colour checker also showed differential apparent colour appearances for the shading and attached body shadow, creating colour gradients on 3D objects which designers might want to take into account in their decisions in practical applications.
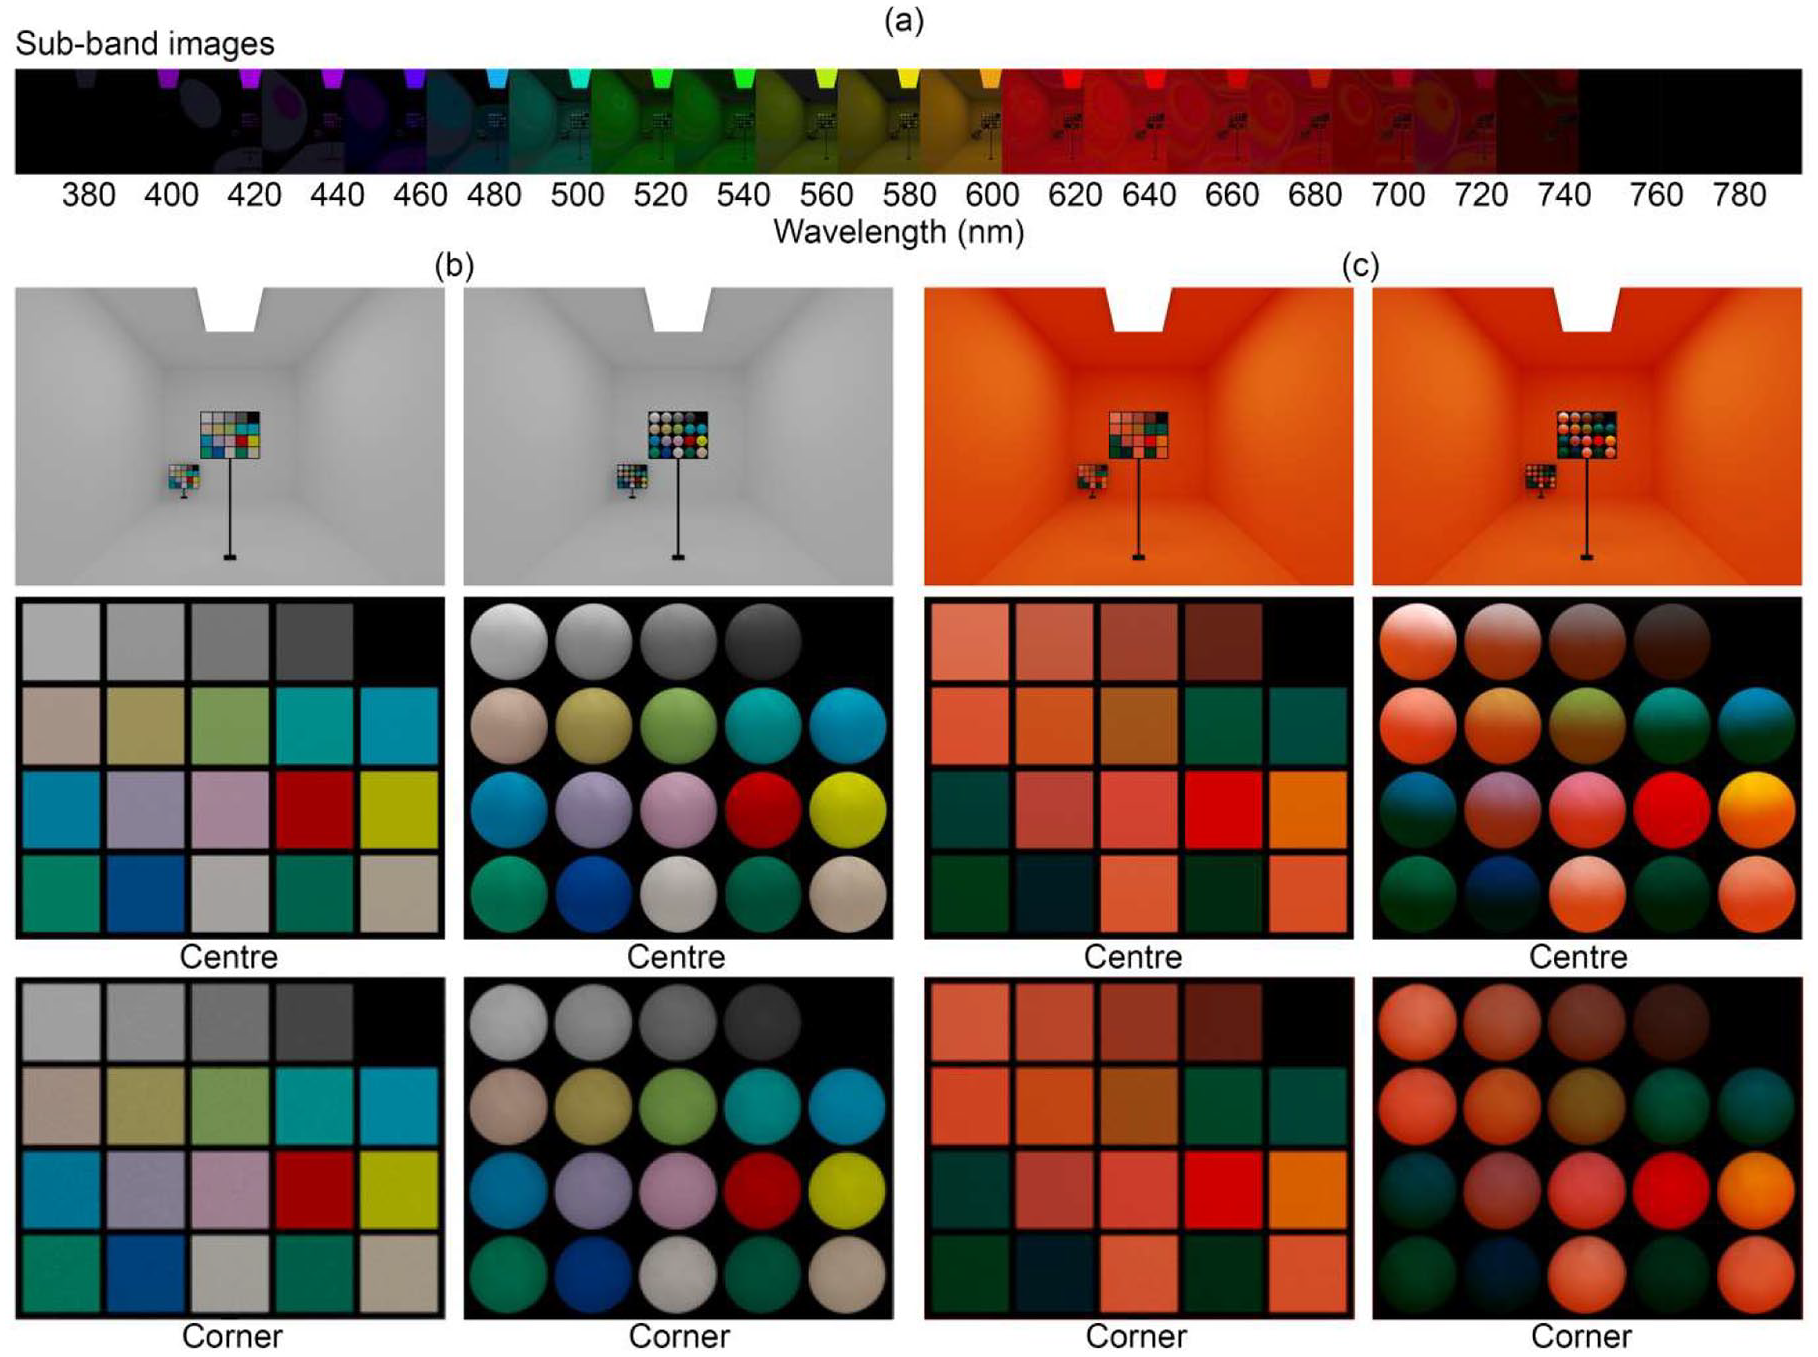
2D vs. 3D colour checkers. (a) Sample wavelength sub-band images for the orange room with 3D checkers made of Lambertian hemispheres. (b) The sRGB representations (gamma 2.2) of spectral renderings showing the white room with 2D (left) and 3D checkers (right) with their corresponding close-ups. (c) as (b) for the orange room. The mutual illumination between coloured spheres was omitted
Figure 9 shows an example of a technical visualisation of such effects throughout a space: the CCT and colour fidelity of the light density and vector for a cross-section of an orange box room illuminated by the D65 spectrum. The spatial variations of the CCT and colour fidelity for the light density are large, while for the light vector they stay almost constant throughout the space. The connections between these technical visualisations and the foregoing visual impressions are providing insights into the complex interactions between scene and lighting.
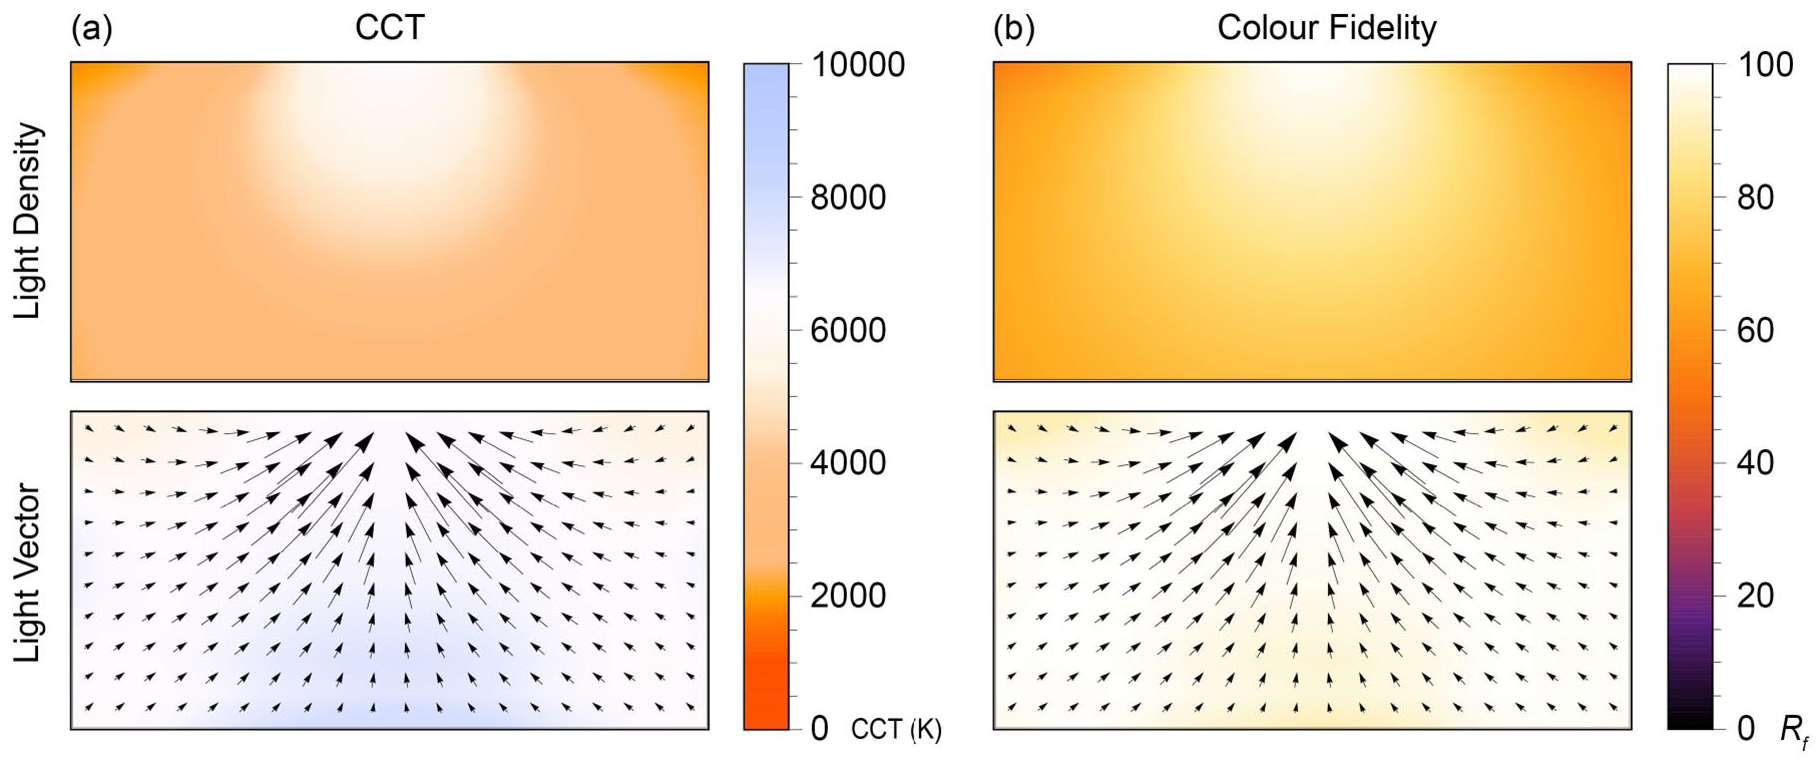
Chromatic light fields. The CCT (a) and colour fidelity (b) distributions of the light density (top row) and light vector (bottom row) light fields for a cross-section (a vertical plane right under the illuminant) of the box space furnished in orange illuminated by the D65 lamp in the centre. The ensemble formed by the superimposed light vectors represents the light flow
4.4 Overview of findings
The results of experiment one were confirmed for simulated box spaces. In addition to that, we found systematic effects of material colour spectral properties. As expected, peaks in the long-wavelength and short-wavelength parts caused a decrease and increase of light densities’ CCTs, respectively. In most cases, Rf decreased, but interestingly, Rf increased for some light sources and material colours. Effects showed the same dependencies as in experiment one, namely that the density was impacted more than the vector, and effects were stronger in the corner than in the centre. This has important implications for the appearance of 3D objects and people in the space, dependent on where they are in the space. Our 3D colour checker allowed visual assessments of the diffuse and directed light’s separate impacts on apparent object colour appearance.
5. Discussion
In earlier work, we described spectral variations of natural light fields.6,40,66–68 Here, we made initial steps to extend the light-field descriptions with colour metrics, presenting a method for measuring the effective CCT and colour fidelity for the light density and light vector and showing results for physical and rendered scenes to explore and understand the effects of material-light interactions. For non-neutral coloured scenes, the SPDs were found to vary spectrally, spatially and directionally within the light field, and our approach revealed the complex effects of material-light interactions on colour rendition.
In experiment one, we measured spectral light fields in physical settings under white light. The light densities’ chromatic properties were strongly affected by inter-reflections, while those of the light vectors were found to be closer to the lamp. It was demonstrated that in some cases the differences between the lamp-specified CCT and colour fidelity and the actual light-based effective CCT and effective colour fidelity were substantial and thus worth considering. Colour constancy mechanisms will certainly help to perceptually discount these optical effects in many cases. Nevertheless, discounting mechanisms of inter-reflections by human vision have neither been explored in depth for its differential effects of diffuse and directed lighting (impacting shadowed and highlighted parts differently and causing chromatic gradients) nor for the spatial and directional variations of these effects throughout spaces.
In experiment two, we simulated 20 coloured spaces under 12 typical white sources. The spatial and angular variations of CCT and colour fidelity due to (inter-)reflections were reproduced in hyperspectral renderings and confirmed the conclusions of experiment one. The CCT and colour fidelity differences between the lamp and the light field, and between the density and vector were again found to be substantial in many cases, and as expected were found to decrease with material colour value and chroma. Interestingly, combinations of material colours and lamp spectra were found to increase or decrease CCT and colour fidelity, offering possibilities for spectral tuning. These effects could be easily understood for the CCT; so-called warm or cold material colours increase or decrease the CCT, respectively. This is regularly implemented in practice and an example of it is covering lampshades inside with a golden layer. The effects on colour fidelity are much more complex and specific.
Since these context-dependent, spatially and directionally varying, space-material-light-interaction effects can be substantial, applications involving 3D objects (and people; and thus relevant for most applications) need to be tested. To that aim, we propose to test real samples in mock-ups or create physically accurate renders of spaces embedded with colour checkers in various locations. Traditional 2D checkers will not show these effects because they are flat and matt and thus will average out the differential effects of diffuse and directed light. The 3D version of the colour checkers in Figure 8 show those directional effects.38,39,69 In this manner, it is possible to visually assess chromatic, spatial and directional effects of lighting-scene interactions on colour appearance.
We have identified the following limitations of our method, which will be addressed in future work. Both Ra and Rf are defined within certain Duv limits and considered meaningful to quantify the colour fidelity of direct white illumination (lamp). Here we also considered spaces illuminated by direct white illumination, while the secondary illumination was chromatic due to inter-reflections originating from coloured materials. In some instances, the chromatic inter-reflections had major impacts. As a result, the light density due to diffuse scattering became highly chromatic, even beyond the Duv limits of those metrics. Those spaces were intended to be illuminated by white light with suitable colour rendition rather than chromatic light. Additionally, those metrics assume complete chromatic adaption to the test illuminant while adaptation might be incomplete due to spatially and directionally varying chromaticities, and hence, the built-in CAT (chromatic adaptation transform) might overcompensate the colour constancy effect. Moreover, the differences between light density and light vector will have differential effects on shad(ow)ed and (high)lighted parts of 3D objects and people, rendering their appearance with chromatic gradients. Other cognitive and perceptual effects such as discounting inter-reflections might affect whether humans perceive such effects, but have only been investigated in limited settings.70,71 Nonetheless, these works showed that in many cases, discounting inter-reflections by human observers was far from complete, and the level of discounting depended on geometrical configurations and shape perceptions. In addition, Figure 8 shows how these mechanisms can have aesthetic effects that might be wanted or not, for example, as can be seen when comparing the colour appearance of the green spheres in the white and coloured rooms. Furthermore, we used simple box spaces furnished with materials mainly scattering diffusely and coloured evenly, while natural scenes have complex geometries and diverse materials with various BRDFs. Direct lighting can also exist in combinations of various spectral and spatial properties. Our spectral light-field framework is well suited also for capturing angular, spatial and spectral power variations of light in such complex natural scenes.
6. Conclusion
This article aims to quantify the impact of (inter-)reflections on the effective CCT and colour fidelity within the light field. We measured light-density and light-vector spectra and calculated their associated colourimetric values in uni-chromatic box spaces illuminated by ordinary white light. The effective CCT and colour fidelity varied as a function of location and direction within the light field and depended on the illuminant SPDs, material SRFs and scene geometry. We found major differences between the lamp-specified CCT and colour fidelity and the actual light-based or effective CCT and colour fidelity. The SPD of the diffuse light-field component is predominantly defined by material SRFs, and the directional component by the illuminant. The existing lamp-based metrics work well in common lighting applications; however, we found that the effects of material-light interactions on the chromatic properties of effective light can be substantial and vary spectrally, spatially and directionally. Therefore, applications that involve colour rendering in spaces composed of chromatic materials could potentially benefit from not only assessing the CCT and CRM of the light source but by also assessing the effective CCT and CRM in context. Further research that addresses the chromatic effects of inter-reflections on the overall perception of real scenes is necessary to confirm these findings. Capturing the light density and light vector and calculating their metrics separately allows us to understand the interactions between illuminant and scene and to systematically analyse the spatial and directional variations of spectral power throughout a scene; in other words, the chromatic light field. In addition, 3D versions of colour checkers, for which we proposed simple Lambertian spheres, allow lighting designers, architects and computer graphics artists to visually assess the light density and vector effects.34,61,72–76 In summary, we showed that our proposed methods of capturing the light density and vector, calculating their colour metrics separately and throughout spaces, and using 3D colour checkers for visual assessment provide insights to measure, visualise and understand complex material-space-light interactions in a systematic approach.
Supplemental Material
sj-docx-2-lrt-10.1177_14771535221126902 – Supplemental material for Effects of inter-reflections on the correlated colour temperature and colour rendition of the light field
Supplemental material, sj-docx-2-lrt-10.1177_14771535221126902 for Effects of inter-reflections on the correlated colour temperature and colour rendition of the light field by C Yu, M Wijntjes, E Eisemann and S Pont in Lighting Research & Technology
Supplemental Material
sj-xlsx-1-lrt-10.1177_14771535221126902 – Supplemental material for Effects of inter-reflections on the correlated colour temperature and colour rendition of the light field
Supplemental material, sj-xlsx-1-lrt-10.1177_14771535221126902 for Effects of inter-reflections on the correlated colour temperature and colour rendition of the light field by C Yu, M Wijntjes, E Eisemann and S Pont in Lighting Research & Technology
Footnotes
Declaration of conflicting interests
The authors declared no potential conflicts of interest with respect to the research, authorship, and/or publication of this article.
Funding
The authors disclosed receipt of the following financial support for the research, authorship, and/or publication of this article: This work was supported by the Marie Skłodowska-Curie Action – Innovative Training Network (MSCA-ITN-ETN) DyViTo: ‘Dynamics in Vision and Touch – the look and feel of stuff’ under the European Union’s Horizon 2020 research and innovation programme (grant number 765121, 2017).
Supplemental material
Supplemental material for this article is available online.
References
Supplementary Material
Please find the following supplemental material available below.
For Open Access articles published under a Creative Commons License, all supplemental material carries the same license as the article it is associated with.
For non-Open Access articles published, all supplemental material carries a non-exclusive license, and permission requests for re-use of supplemental material or any part of supplemental material shall be sent directly to the copyright owner as specified in the copyright notice associated with the article.