
Abstract
Modern high-resolution headlamp systems are capable of adjusting to different driving situations. However, the existing road lighting is not yet taken into account when setting the headlamp’s light distribution. This article investigates the influence of the automotive headlamp systems on the visibility of targets in different road lighting conditions and proposes a new lighting strategy based on these results. The luminances of square targets of different surface reflectances and at different distances ahead of the vehicle were measured in road lighting designed to meet classes varying from M3 to M6. For each combination the visibility level (VL) of the targets was determined, with road lighting alone and also when additionally illuminating the scene with the car headlamps. The influence of the headlamps on target visibility was found to depend on the road lighting class, the target distance and its reflectance. In some situations, additional light from the headlamp decreased the target VL and therefore the probability that a driver would detect it. Different ranges of headlamp light distribution were proposed for different road lighting classes to bring light only where it is needed.
1. Introduction
The main goal of automotive lighting is the prevention of road traffic collisions and the establishment of an overall high level of safety for all road users. One contribution to this is improving the probability of the driver to detect obstacles and hazards. 1 The detectability of an object is connected with the photometric conditions.2,3
While driving after dark is often done using only vehicle headlamps in an otherwise non-illuminated environment, the ongoing process of urbanization results in a steady increase in average illuminance due to road lighting.4,5 However, headlamp systems are developed and used without giving consideration to the road lighting conditions. 6 Similarly, the design and installation of road lighting does not take into account vehicle lighting. Headlamps can be a source of glare for oncoming drivers and other road users, causing discomfort7,8 and disability. 9 To maintain the detection of obstacles10,11 road lighting must create bright background luminances. In consequence, it is necessary to combine the possibilities of modern road lighting and headlamp systems.
Modern state-of-the-art headlamps are high-resolution systems with the capability to precisely shape their light output. They can be of different types:
Additive matrix systems which consist of arrays with several thousands of light-emitting diodes (LEDs), each individually addressable to emit light in a specific direction.12,13
Digital light processing systems based on millions of digital micromirror devices, which can independently reflect light onto the road. 14
Projector headlamps with a high-resolution panel in the optical path, which can tune the transmission for each pixel the same way a liquid crystal display (LCD) works. 15
While all these systems are based on different technological approaches, the result is a high-resolution headlamp that can adjust to different driving situations. 16 These adaptive driving beam systems can individually shape their light distribution for different scenarios. It can be differentiated between driving in a city, on a rural road or on the highway. 17 Specific vehicles in oncoming traffic can be individually greyed out to prevent it from being dazzled. Additionally, different symbols can be projected onto the road to support the driver 18 and different weather situations can be taken into account. 19 However, the present road lighting conditions are not further considered.
Meanwhile, with modern road lighting systems it is possible to adjust the luminance provided by road luminaires according to traffic volume 20 or even on demand by radar or PIR sensors. 21 With lighting poles as 5G-carrier 22 real-time communication is possible and communication from vehicle to infrastructure (V2I) via Dedicated Short Range Communication (DSRC) 23 or lighting fidelity is realizable. 24 With open access systems like the one Solingen is developing, where all data from the whole of a city are collected on a FROST-Server, we see smart city and V2I or infrastructure to vehicle (I2V) communication on a completely new level. 25 Big technology companies are also trying to invest in this areas. For example the AI-based road lighting systems that are being developed by Microsoft. 26
Road lighting and vehicle headlamps unfortunately have different approaches to illuminating a scene. Road lighting provides a bright horizontal road surface due to its relatively short distance (around 6 m) to the surface and its upright illumination angles. Surfaces of targets perpendicular to the road tend to appear darker than the road surface, which enables them to be revealed by negative contrast (dark target in front of bright background). 27 Vehicle headlamps, on the other hand, generate high luminances on vertical target surfaces rather than illuminating the road surface, creating a positive contrast (bright target in front of a dark background). To brighten the background, however, it would require more illumination than possible due to the sharp illumination angle between headlamp beam and road surface and the further distance (30 m and more).
To propose new requirements for future light distributions, these two contrary characteristics and how they influence the visibility of targets require investigation with a special focus on which illumination task is best met by which system. By coordinating both – the headlamps and the road luminaires – there is potential to improve the overall energy efficiency and sustainability of outdoor lighting.
There is previous research on this topic by Bacelar, 28 Ekrias et al., 29 Gibbons et al. 30 and Bhagavathula et al. 31 Bacelar measured the loss in visibility of square targets (200 mm wide, 20% reflectance) when using road lighting and headlamps. However, this used only one road lighting scenery with a high luminance (2.45 cd/m2), the reflectance of the targets was fixed and only two distances (40 m and 90 m) were investigated. Ekrias et al. also showed a loss in target contrast for two different road lighting sceneries. However, they did not compare the contrast with the corresponding threshold contrasts and did not differentiate between positive and negative contrasts.
Gibbons et al. showed for different distances of targets and different road surface luminances the transition between positive and negative contrasts of targets and defined distances, where road lighting and headlamp contributed differently to the visibility of targets, but they did not compare different reflectances and positioned the targets off the road. Bhagavathula et al. focused on different road lighting configurations at an intersection and compared their influence on the contrasts of different targets. Similar to Gibbons et al., they also found transitions between positive and negative contrasts with vanishing luminance differences between the target and background. However, they neither compared the contrasts to the threshold contrasts nor investigated the influence of reflectance. In addition, the targets’ position relative to the road lighting was fixed and instead the car approached the scenery.
The above-mentioned authors had in common used halogen or xenon headlamps. In this research, especially the various road lighting classes according to the European standardization DIN EN 13201-2 32 and different reflectances of targets regarding their visibility level (VL) are investigated. Additionally, the capabilities of modern headlamps using LED light sources are taken into account.
The photometric quantity typically used in visibility research is the luminance and respectively the luminance contrast, or Weber contrast, as defined in Equation (1):
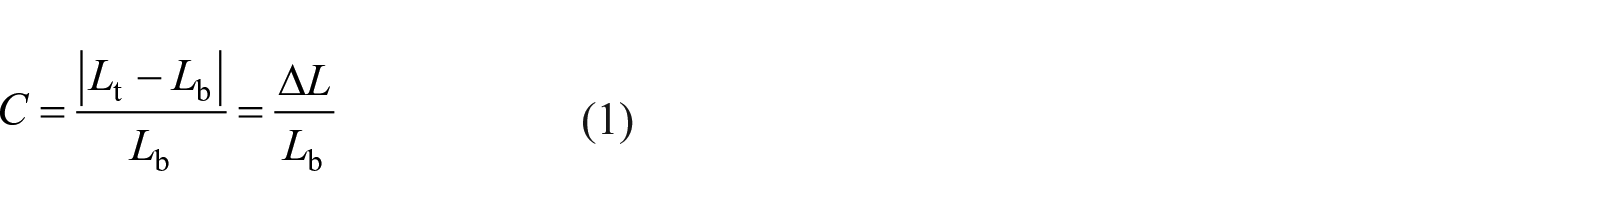
where
The target contrast is highly dependent on the target’s reflectance, its distance from the driver, its relative position in the headlamp’s light distribution, the given road lighting setting, the road surface and the headlamp types.
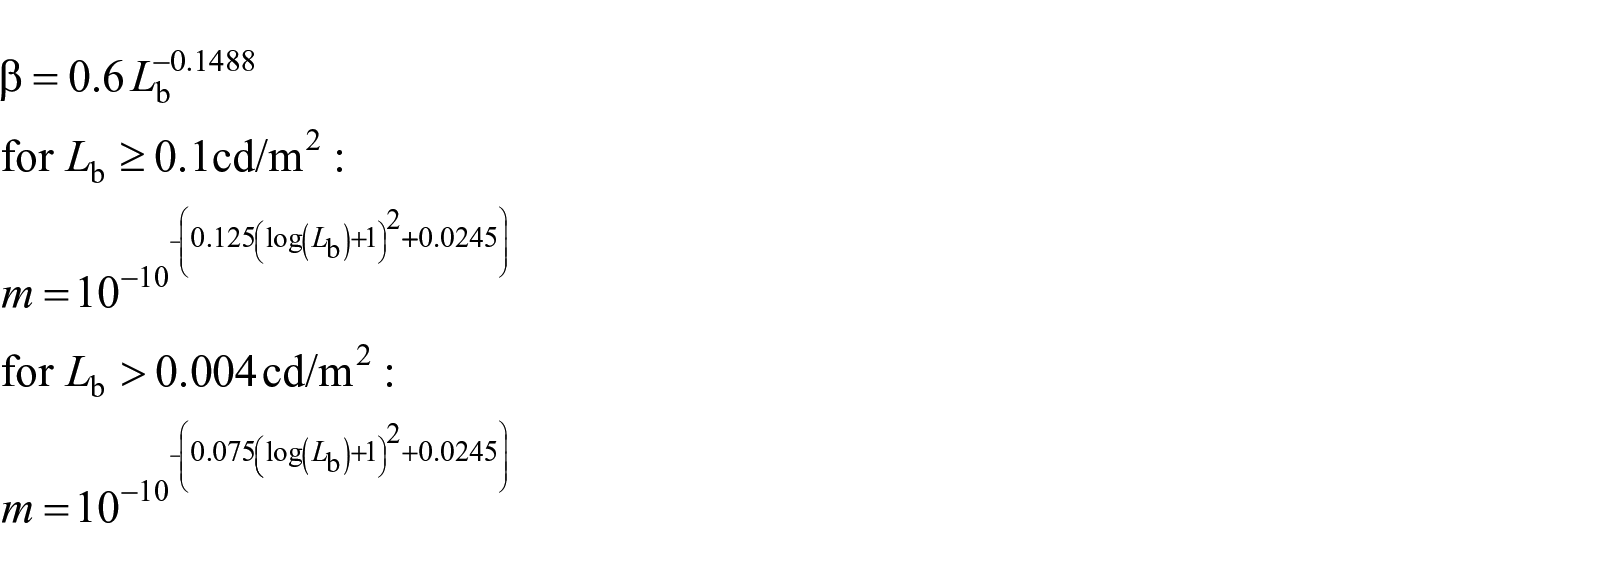
Luminance contrast holds only limited information about the visibility of a target. To gain a better understanding of visibility, the luminance contrast must be compared with the threshold contrast, an experimentally determined value describing the required contrast to detect it with a specific probability. The threshold contrast is highly dependent on the object size (Ricco’s law 33 ), the background luminance (Weber’s law 34 ), the exposure time, the polarity of the contrast and the age of the observer.
The ratio of contrast and threshold contrast (or luminance difference and threshold luminance difference) is the VL as shown in Equation (2):
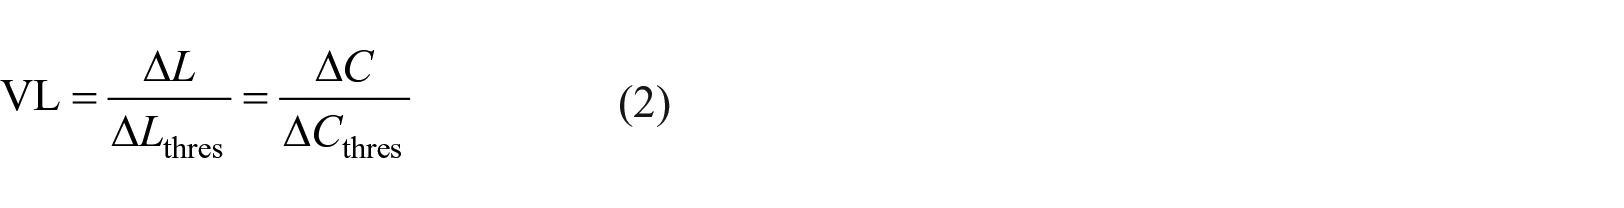
where ∆L and ∆C are the actual luminance difference and contrast, ∆Lthres and ∆Cthres are the corresponding threshold luminance difference and threshold contrast.
The current article investigates the change in VL of a target with and without a low-beam headlamp light distribution. The VL was determined for targets of different reflectances at varying distances (30 m–80 m) in front of the car, and with road lighting designed to meet classes M3–M6 according to DIN EN 13201-2. 32
2. Method
2.1 Field measurements
The measurements were carried out at the LED Laufsteg test track in Berlin, Germany, a test track particularly designed for scientific measurements. 35 An overview of the setting is shown in Figure 1.
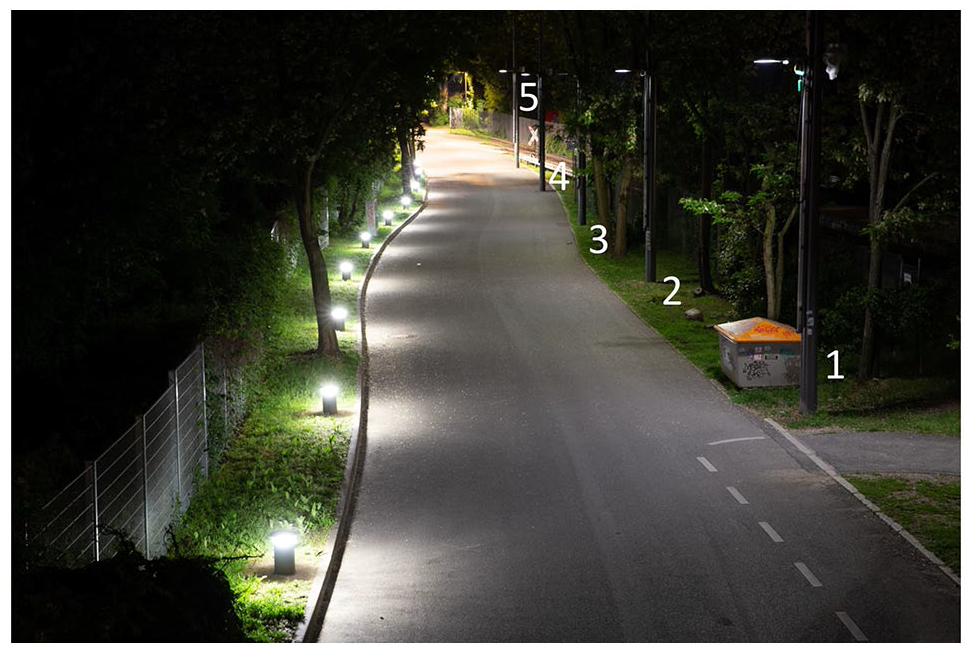
Measurement setting at the LED Laufsteg in Berlin with controllable road luminaires on the right-hand side of the road. Four-channel light output was tuned to create different road lighting classes according to DIN EN 13201-2. 32 The height of each luminaire was 5.9 m, and the distance between each lamp post was 20 m. Luminaires are numbered from 1 to 5. The test car is not shown in this photograph
The test segment was equipped with five road luminaires, one every 20 m. They were fitted with four-channel modules, which could be individually controlled to realize different luminances on the road surface and with varying luminance uniformities according to the standardization DIN EN 13201-2. 32 The road luminaires were of height 5.9 m.
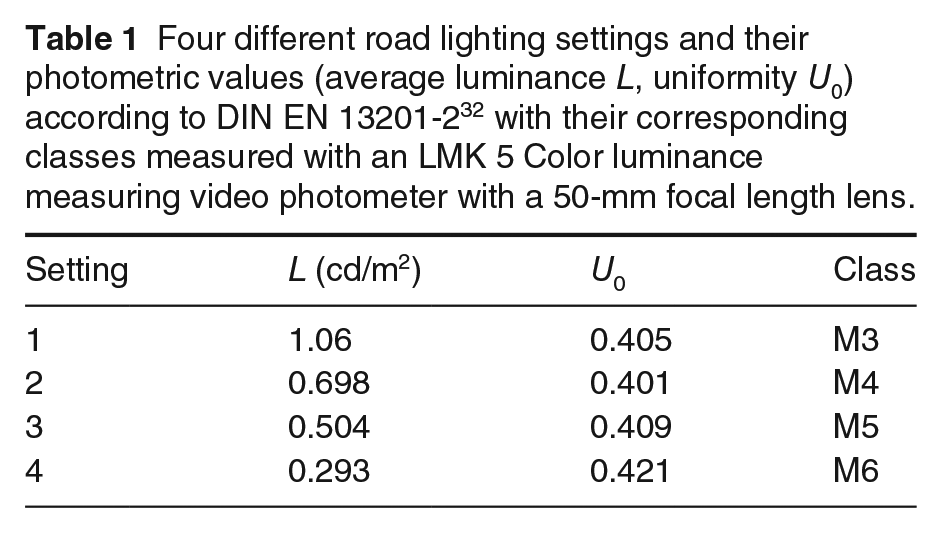
Four different road lighting luminance distributions were measured beforehand using a calibrated LMK 5 Color luminance measuring video photometer (TechnoTeam Bildverarbeitung GmbH, Ilmenau, Germany; relative expanded measurement uncertainty of 4.7%) following the procedure in the standard DIN EN 13201-2. 32 These settings and the resulting photometrical characteristics are shown in Table 1.
Four different road lighting settings and their photometric values (average luminance L, uniformity U0) according to DIN EN 13201-2 32 with their corresponding classes measured with an LMK 5 Color luminance measuring video photometer with a 50-mm focal length lens.
The car was positioned in the middle of the right-hand driving lane of a two-lane road having an overall width of 5.5 m. The driver’s position was at a distance of 2.40 m from the road luminaires on the right.
Three square viewing targets with a side length of 200 mm were positioned ahead of the car, on the road surface and perpendicular to it, at distances from 30 m to 80 m in steps of 5 m. This size of target can be considered as a lower boundary to being dangerous. 36 The distances were chosen to cover typical ranges of stopping distances for cars driving in a city and respective detection distances of drivers. While stopping within 30 m can only be achieved with emergency braking on a dry surface, distances around 40 m are typical estimates for a speed of 50 km/h. 37 Reflectances of the target (ρ) varied from 15% (right-hand target) to 30% (middle target) and to 50% (left-hand target). These reflectances cover a wide range of those suggested to be relevant. For example, Goldmann 38 and Hansen and Larsen 39 estimated typical pedestrians’ clothing to be below 20%, and the American standard RP 8-00 40 uses targets with 50% reflectance. The targets were ideal diffusely reflecting surfaces. Thus, the behaviour of an unknown reflectance can be calculated by scaling the object luminance of the target for a given reflectance with the ratio of these two reflectances. The right-hand target was positioned 2.40 m away from the road luminaire on its right and exactly in front of the driver. The other two targets were positioned next to it towards the left curb. A layout of the target distances is shown in Figure 2.
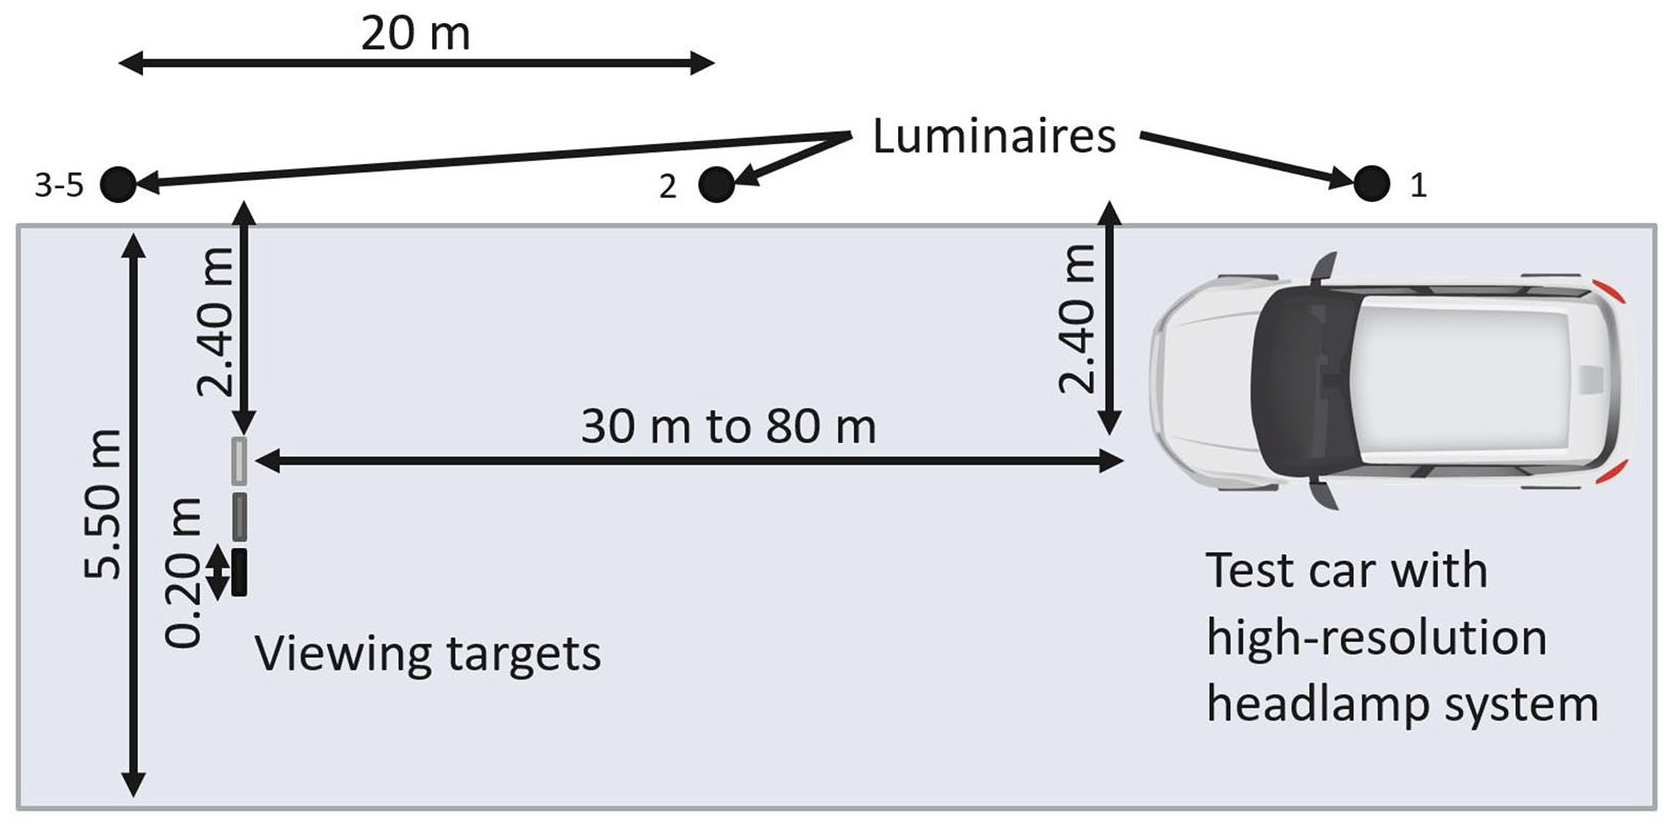
Layout of the measurement set-up, test car positioned on the right lane. Viewing targets in varying distances in front of it. Distances between objects are otherwise fixed for all measurements, not up to scale
For these luminance measurements, another LMK 5 Color luminance measuring video photometer was used (TechnoTeam Bildverarbeitung GmbH). The photometer was positioned on the driver’s seat at a height of 1.50 m above ground level, equal to the measuring point in the road lighting standard DIN EN 13201-02. 32 A lens with a focal length of 16 mm was used. All measurements were done using the HighDyn measurement mode, which is able to cover a wide range of different luminances in the scenery without running into overexposure. The luminance measuring video photometer had a measurement uncertainty of 4.7% according to its calibration sheet. An example luminance measurement is shown in Figure 3.
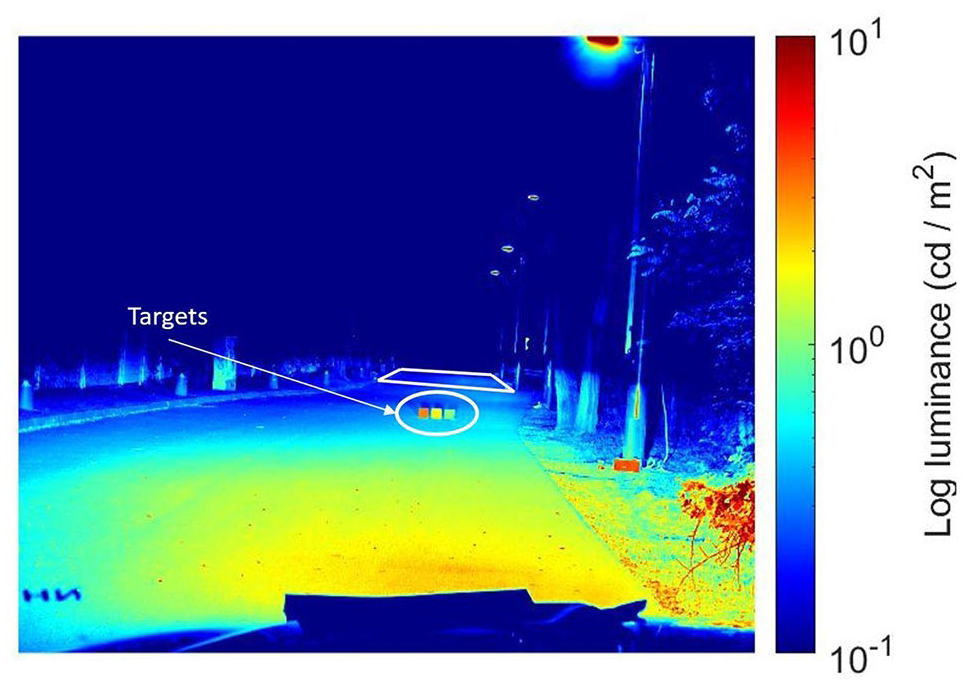
Example luminance measurement of three viewing targets with different reflectances (from left to right, 50%, 30% and 15%) 30 m ahead of the car. Road luminaires are on the right side of the road. Road lighting class is M6; headlamps are turned on. Square-shaped evaluation field is marked in white. Measurements were done with an LMK 5 Color luminance measuring video photometer positioned on the driver’s seat at a height of 1.50 m
2.2 Headlamp system
The headlamp system of the car consisted of two different subsystems: a high-resolution LCD system responsible for low beam and high beam, which is able to dynamically adapt to the driving situation, and a module creating a constant brightness in front of the car up to 25 m–30 m (hereafter named the prefield module).
The prefield module was turned on during all measurements. Its influence on the object luminance of targets further away than 30 m is small and therefore it was considered as a constant in the experiment. It also guarantees that the car is recognized as a moving vehicle by other traffic participants even when the dynamic LCD module was switched off.
In Figure 4 the radial illuminance distribution on the road generated by the LCD module is shown. The typical characteristics of a low beam such as the reduction of light on the oncoming lane to prevent glare and the increased range on the right-hand side of the road for further visibility range are clearly visible.
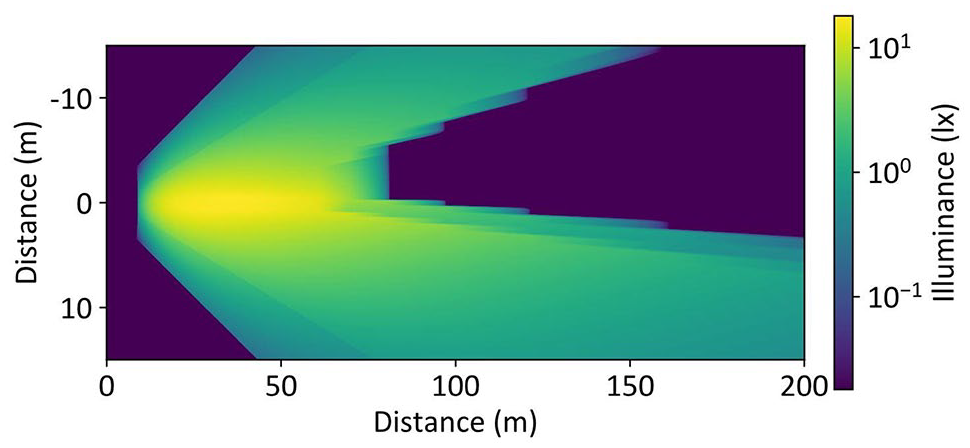
Aerial perspective of the radial illuminance on the road created by the high-resolution headlamp system. Characteristics of the low beam are visible. Prefield illumination is not shown; data are based on ray-tracing simulations
The investigated targets were horizontally placed within the area of reduced range on the oncoming traffic lane. This makes the comparison with the town light easier. The town light is a light function, which is basically a low-beam light distribution but with a reduced range and without the asymmetrical parts above the cut-off line. It is typically used in urban areas and it is depending on the vehicle speed. When a specific speed is surpassed, the headlamp systems automatically return to the low-beam function. The luminous flux of the low-beam distribution was 213 lm. The luminous flux of the prefield illumination was 1447 lm; it was significantly higher but had a very limited range in front of the car.
Since the technology of the LCD headlamp system is not important for the results, it is not further explained here. Additional information can be found elsewhere.15,41–43
2.3 Calculation of VL
In order to evaluate the influence of the headlamp on the visibility of the viewing target, an assessment criterion is needed. Here, the VL as introduced in Equation (2) is used. While the luminance difference between object and background can be directly determined from the measured data, the threshold luminance difference needs to be calculated using different models, which are typically based on the experimental data of Blackwell. 44
Common models were presented by Adrian,
45
Kokoschka,
46
Commission Internationale de l’Éclairage (CIE)
47
and Schierz.
48
After comparing these models with the Blackwell dataset, the model of Adrian showed the smallest deviation from Blackwell’s measured data and therefore it was used for this research. It also made the comparison with other experiments less complicated, since it was used by many other researchers28,30,49–51 in the lighting community before. Adrian’s model used a detection probability of 99.93%. Thus, a calculated VL of 1.0 implies a detection probability of 99.93%. This is important to take into account when comparing VL values because other models
46
instead use a detection probability of 50%. The different probabilities can be converted into each other using a correction factor
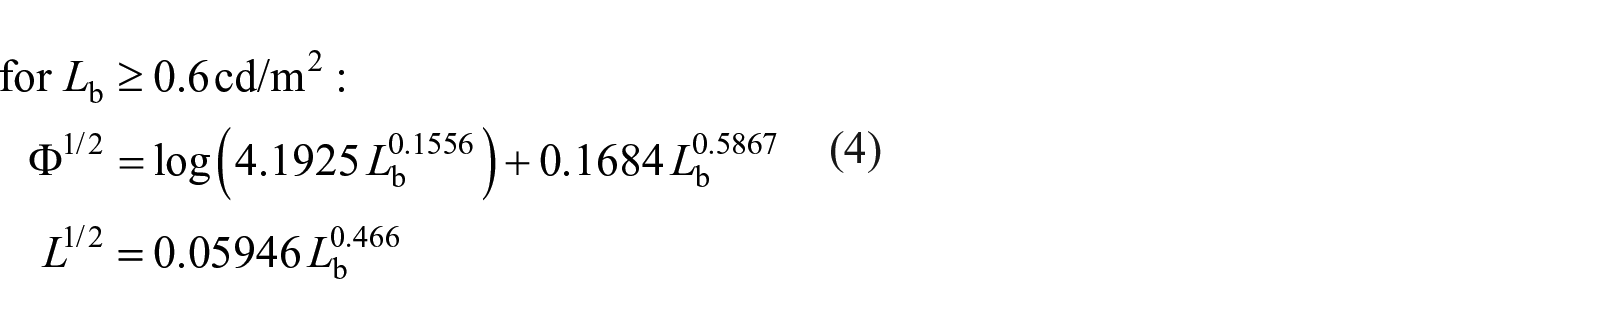
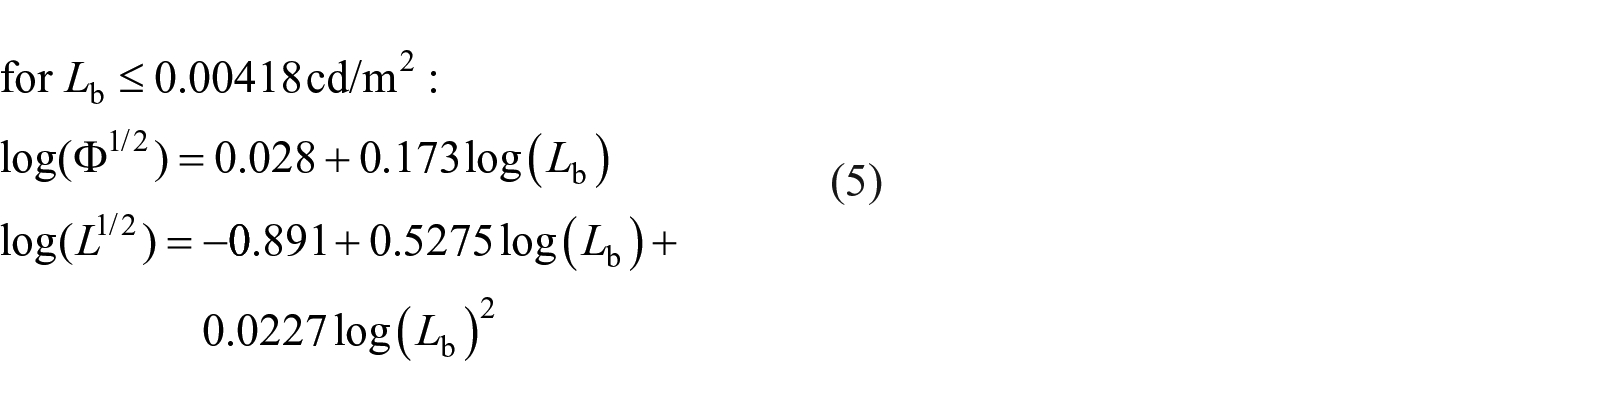
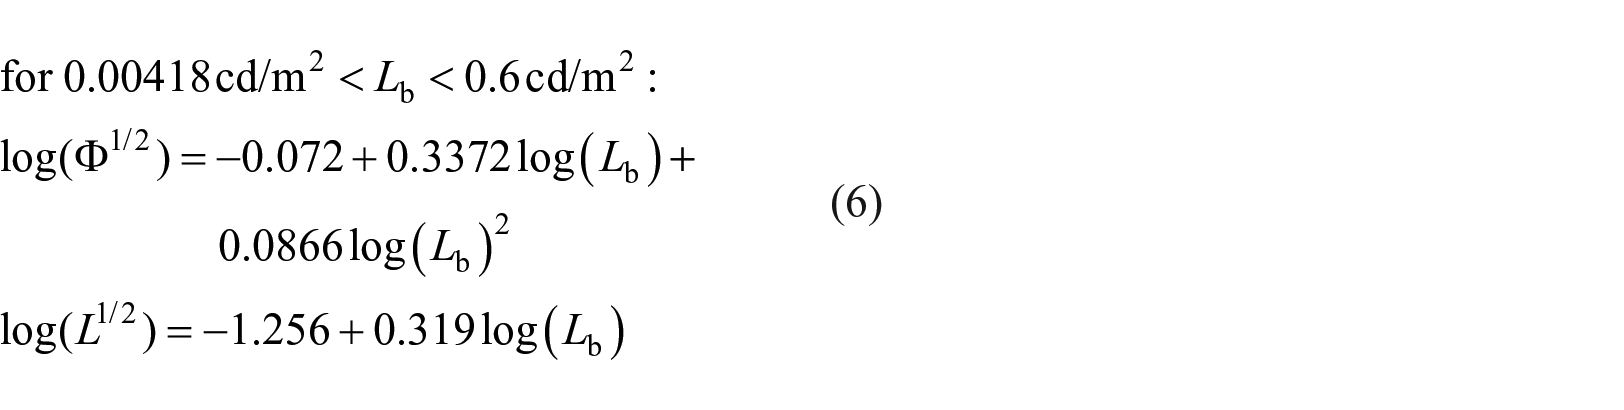
While the model of Adrian has been published in several publications already, the equations and all the parameters used for this research are briefly introduced. The equations can be found in Adrian. 45 All logarithms are base 10.
The threshold luminance difference ∆Lthres is as shown in Equation (3):
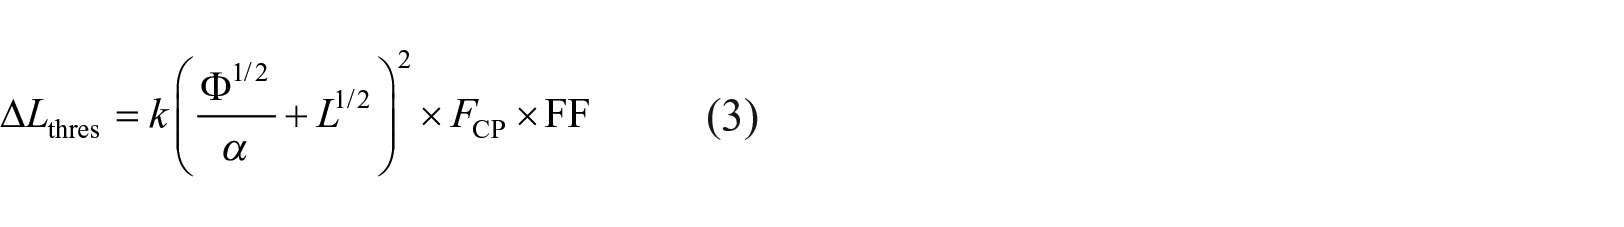
where
Additional correction terms regarding the viewer’s age and the exposure time of the targets cannot be analysed and are not considered.
For inhomogeneous luminance scenes the background luminance
The contrast polarity factor
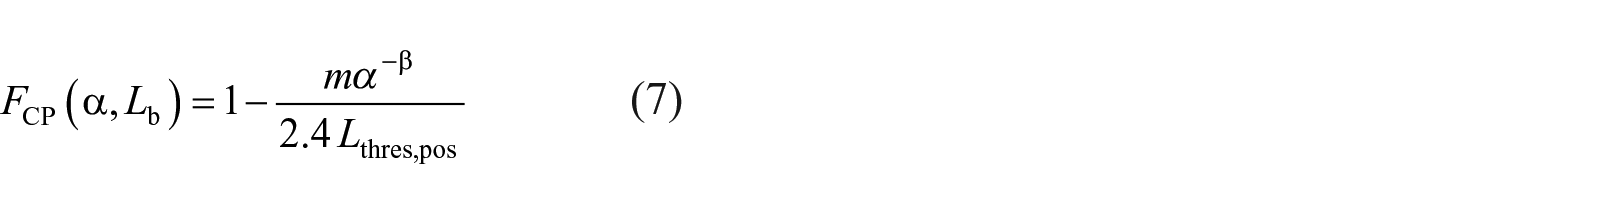
with
The field factor was determined by others46,50 and also by a study under comparable conditions 53 (square viewing target perpendicular to the road 50 m ahead of the test persons, who were seated in a car-like position with headlamp-like illumination but without road lighting). It was found to be around 10. The size of the field factor heavily changes the scale of the VL. Thus, discussing absolute VL values can be difficult without individually determined field factors. However, in this research VL values were only compared to each other and their actual size was not of utter importance for the results, but the authors are aware of possible inconsistencies with other investigations.
According to Equation (2) the VL is calculated from the luminance difference and the threshold luminance difference. While the threshold luminance difference is model-based value, the luminance difference and the contrast have to be determined from the luminance measurement. For this, object and background luminances have to be defined. The approach of this investigation is shown in Figure 5.
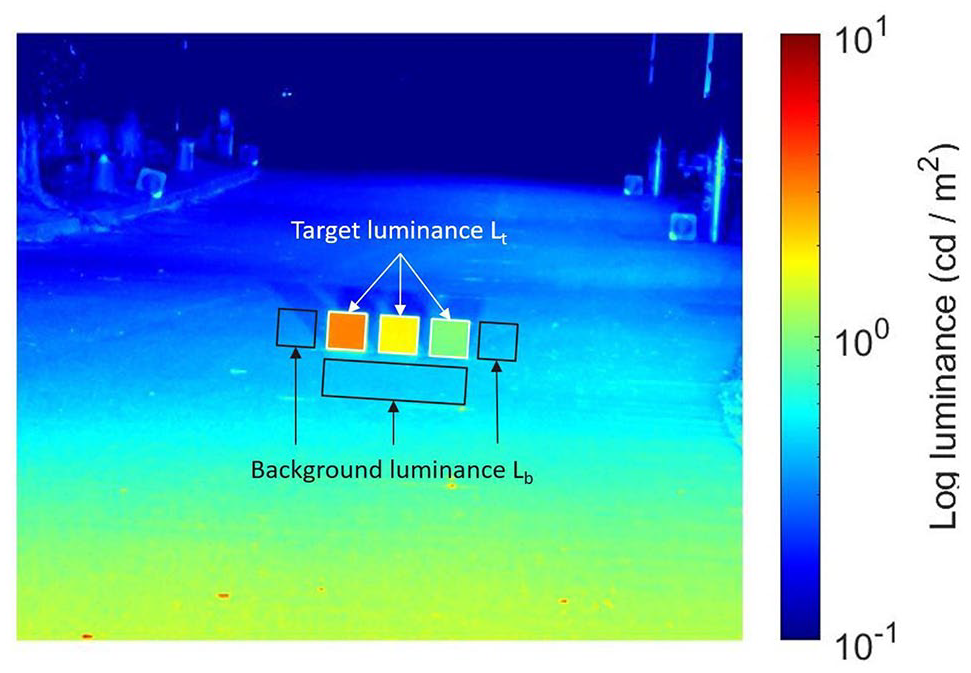
Example luminance measurement showing six different evaluation areas. White-bordered areas are used to determine the average luminance of each target. Three average background luminances are determined in the three black-bordered areas
The three different target luminances were determined by averaging the luminance measurement results over each target (white-bordered boxes in Figure 5). Due to their homogeneous surfaces and their size the luminance values varied only slightly over the object (standard deviation < 20%). Background luminances were calculated as the average luminance in the black-bordered boxes (see Figure 5) to the left, to the right and below the targets. An additional background luminance above the targets would have been reasonable; however, the limited length of the test track and the fixed number of road luminaires resulted in a lower luminance above the targets, which would not exist like this in real-life scenarios. Thus, there were only three different areas to be considered. Due to the decision to measure three different targets at the same time, the background boxes to the left and right were not directly adjacent to the right and left target respectively. However, the authors expected this assumption to be valid as comparable background luminances would be measured with just a single target and their horizontal variation in this case is negligible. Unfortunately, these methods are prone to errors because the boxes were set manually and there were pixels which can be labelled as belonging to the target area, background area or to neither.
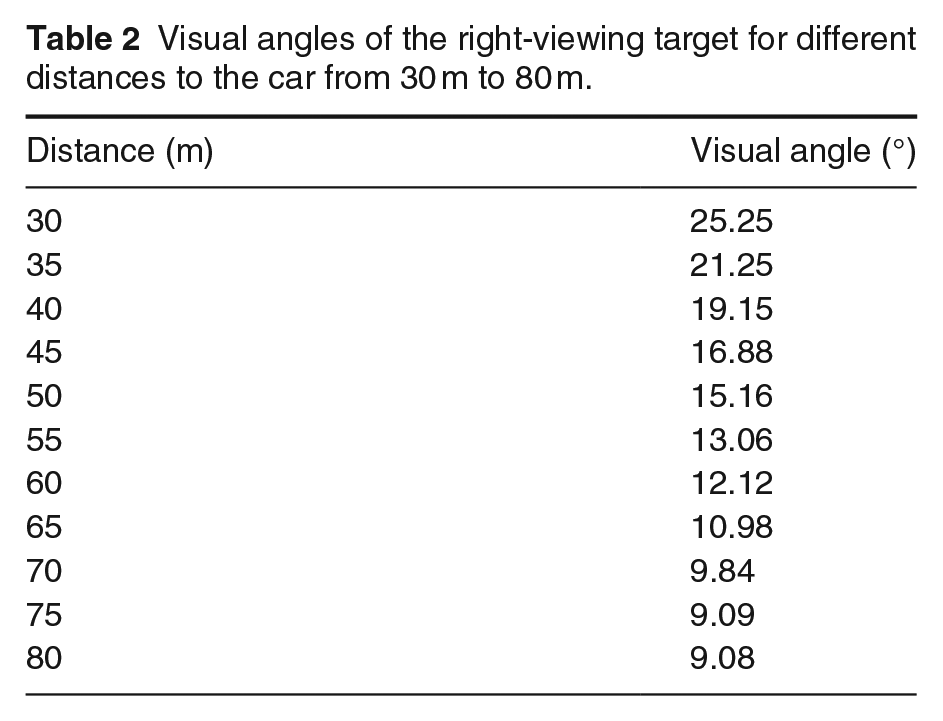
Once object luminance and background luminances were determined, the three possible luminance differences were calculated and the highest was chosen to be the actually strongest stimulus used for the calculation of the VL. This method was used by previous researchers and showed the best results.3,50 The final input factor to determine the VL was the size of the viewing target. This was calculated by summarizing the solid angle of each target pixel
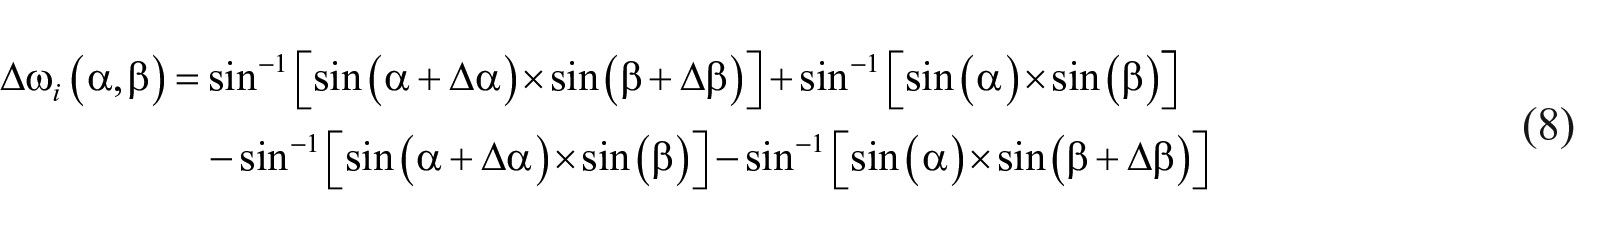
where
Visual angles of the right-viewing target for different distances to the car from 30 m to 80 m.
3. Results
3.1 Luminance distribution on the road
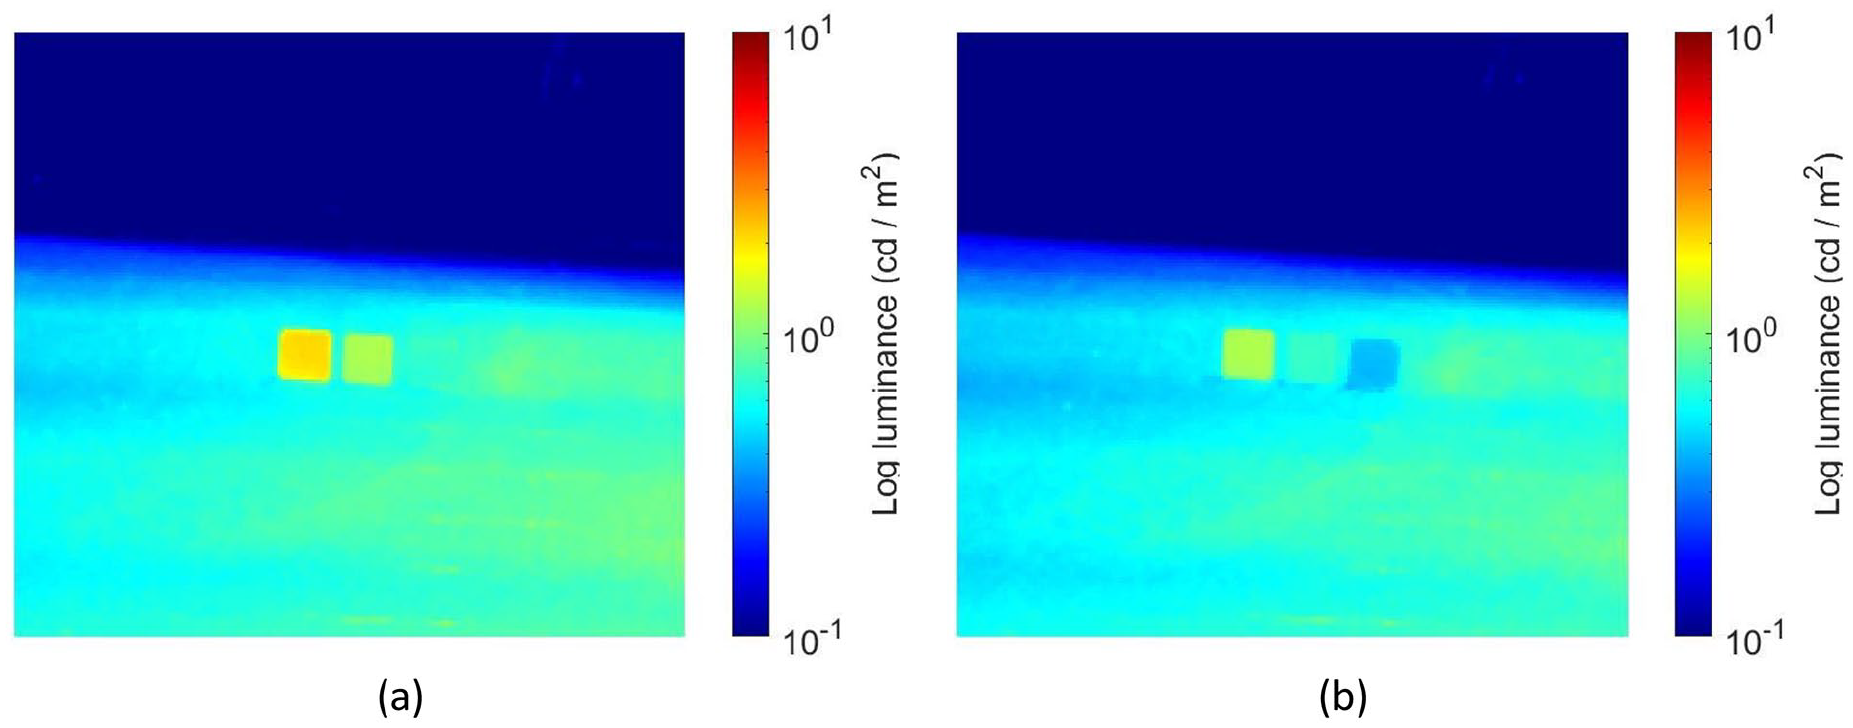
Figure 6 shows the road surface luminance distributions with the low-beam module together with the prefield module and only the prefield module without any road lighting. The limited range of illumination with the prefield module is clearly visible; however, it still had an influence on the object luminance for closer targets. On the other hand, the additional range of the low-beam module can be seen by the increase in luminance not only on the road but also on the objects left and right of it.
Measured luminance distribution of the low-beam module together with the prefield module and only the prefield module without any road lighting: (a) LCD low-beam module and prefield module and (b) prefield module
3.2 Target VL
Figure 7 shows the VL of the target with ρ = 15% for five different road lighting conditions. The investigated road lighting conditions included M3, M4, M5 and M6 and a reference situation without any road lighting. The VL values were calculated for targets in different distances to the car from 30 m to 80 m. For each distance a measurement with and without the low-beam light distribution was done. Note: the prefield illumination is switched on in all situations.
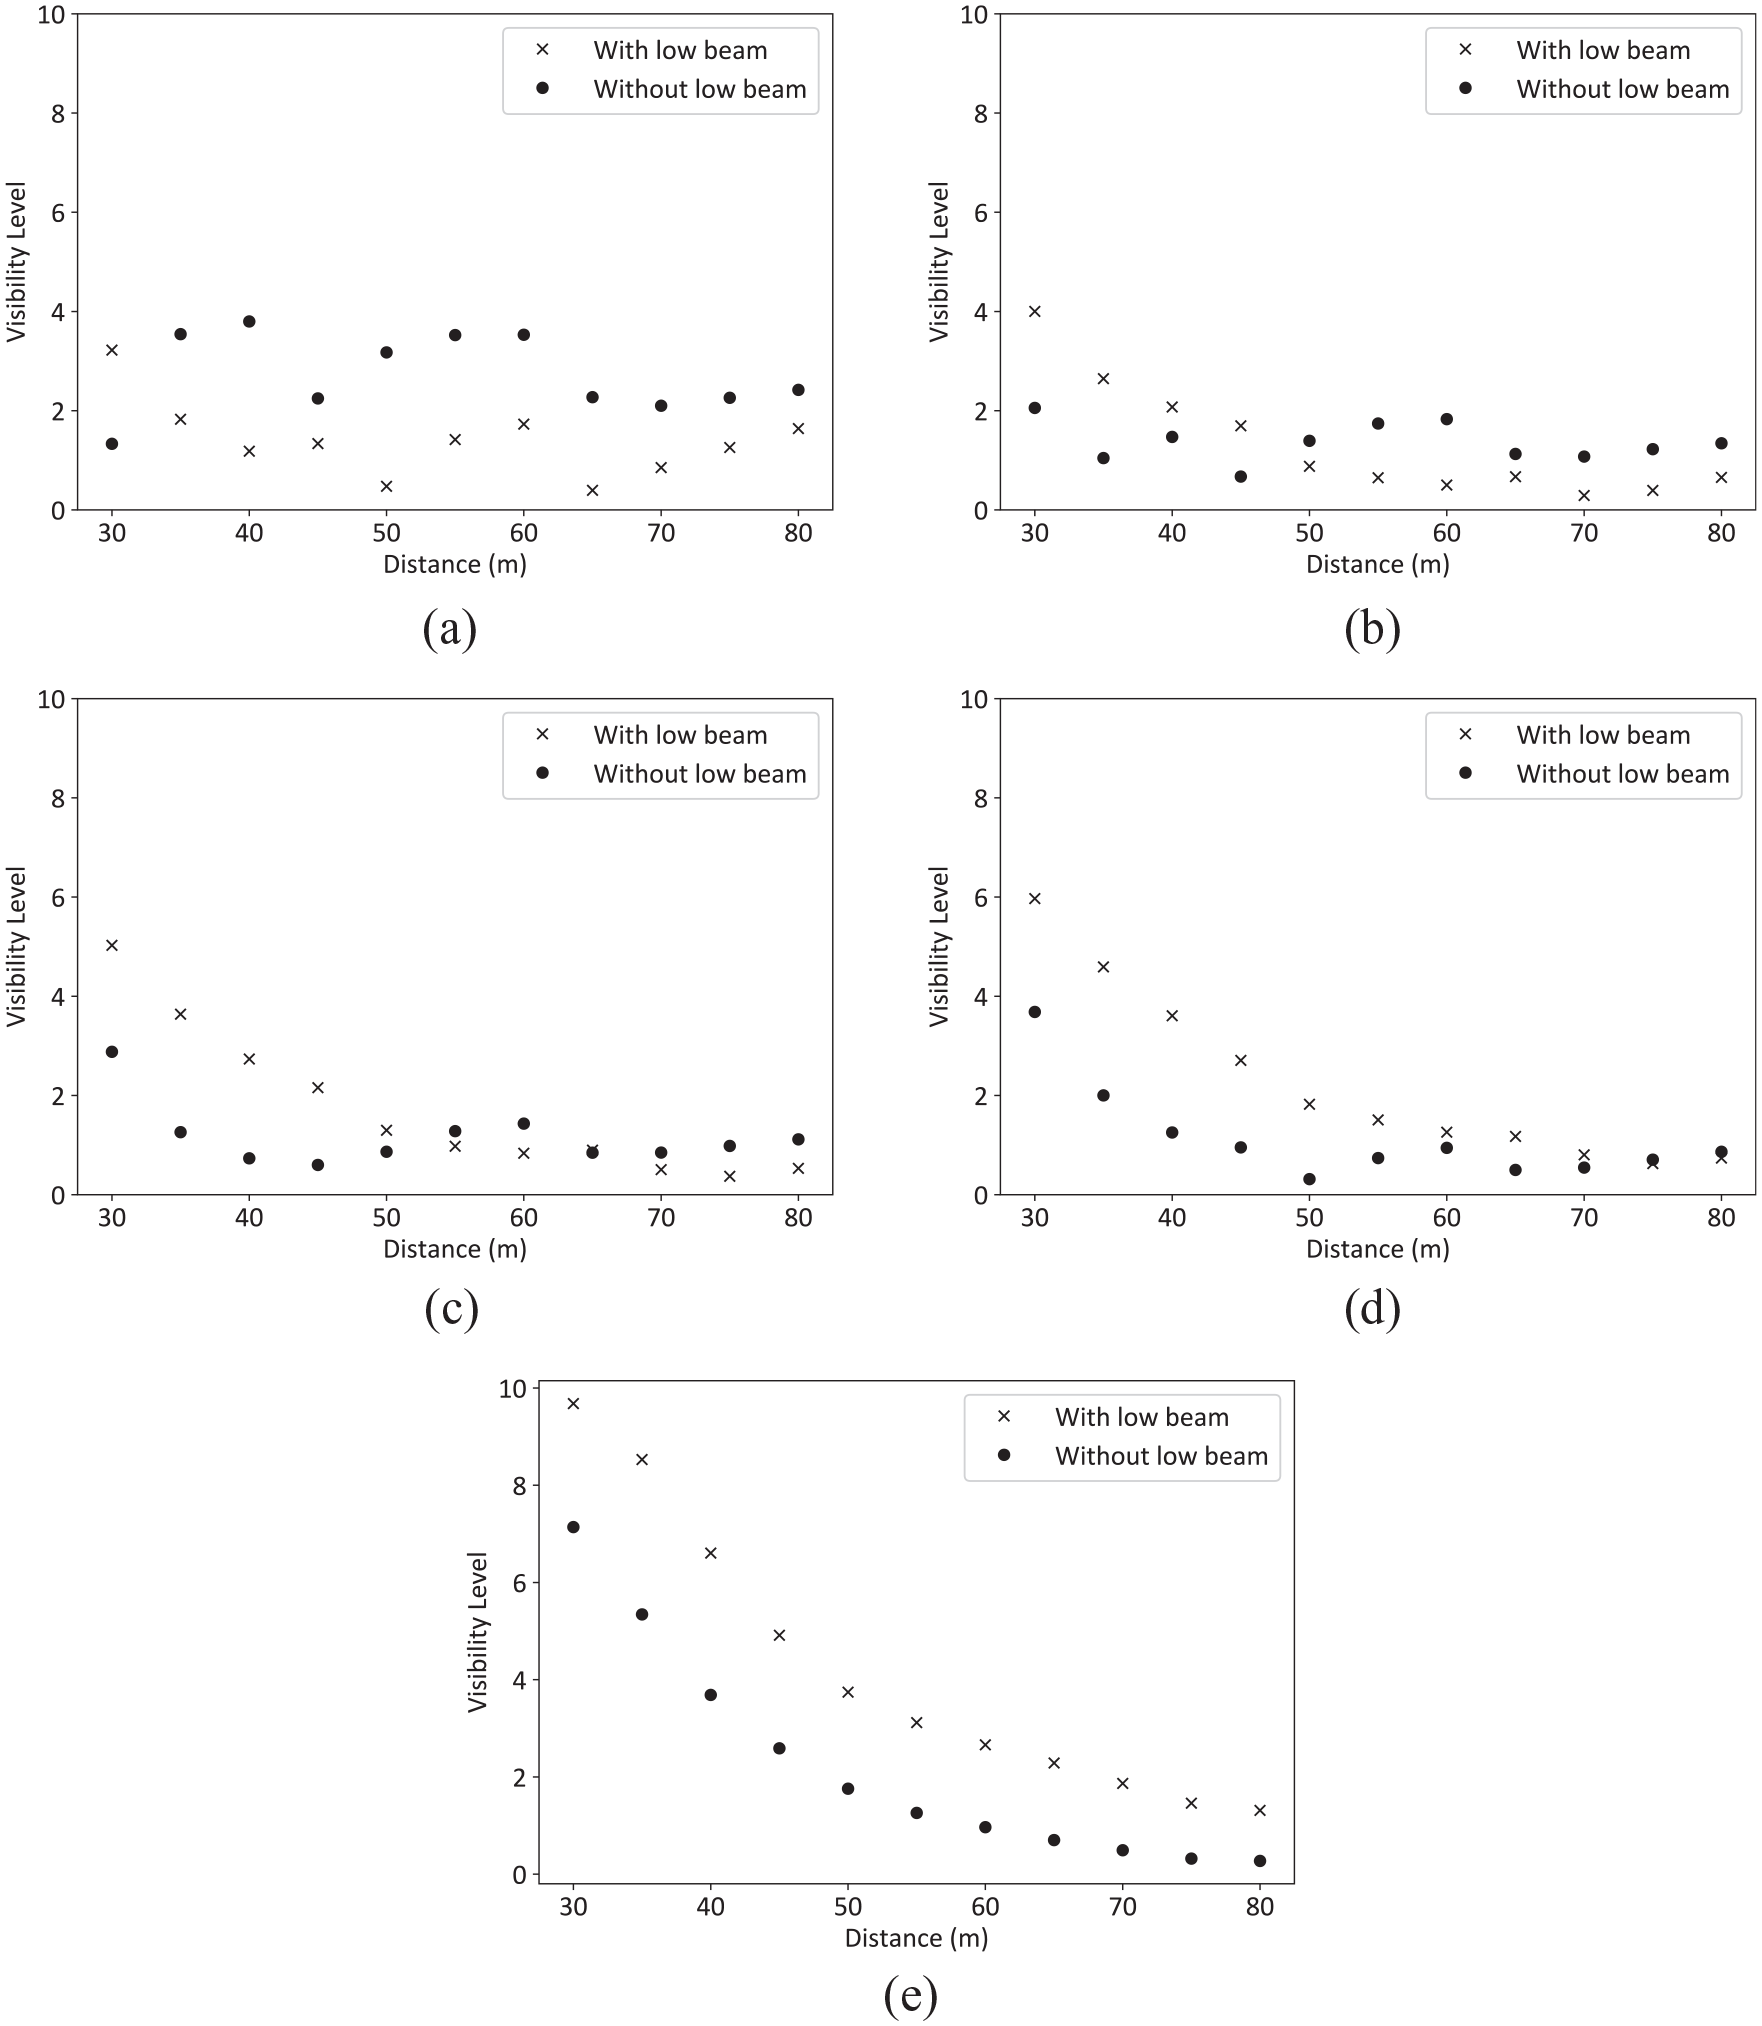
VL calculation for a viewing target with a reflectance ρ of 15% in different distances from the car and under different road lighting conditions, without road lighting as a reference: (a) road lighting class M3, (b) road lighting class M4, (c) road lighting class M5, (d) road lighting class M6 and (e) no road lighting
All road lighting classes had in common that, for closer targets, the VL with low beam is higher than without low beam. However, after a specific distance this relation changes such that the VL without low beam is higher than with low beam. This means objects at this distance and further away are actually less likely to be detected and more difficult to perceive when turning on the low beam. An example is shown in Figure 8. The size of this specific distance depends on the present road lighting class and the target’s reflectance. Both factors are discussed below.
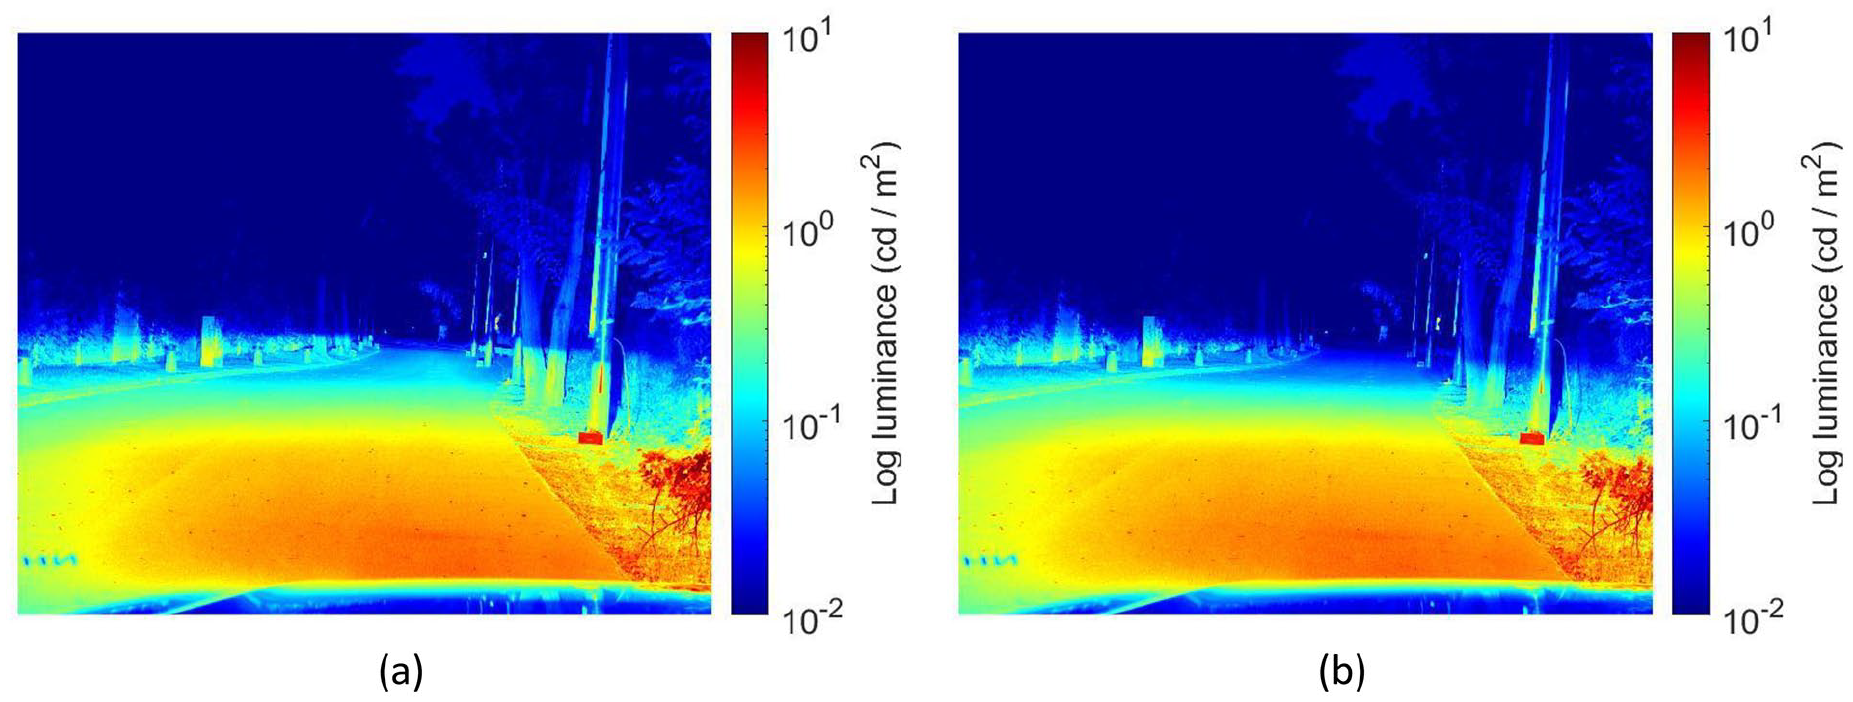
Example of disappearing luminance difference between target and background in 65 m distance under M3 road lighting conditions by adding light (for the right-hand target of reflectance 15%) or removing light (for the middle target of reflectance 30%): (a) low beam turned on and (b) low beam turned off
3.3 Influence of the road lighting class
As shown in Figure 7, the influence of the headlamp on the VL of objects in different distances to the observer varied in its strength for different road lighting scenarios. For the road lighting class with an average luminance on the road of 1 cd/m2 (Figure 7(a)) the target was more likely to be detected without the low beam for all distances other than at 30 m. This means that the high background luminance of the objects resulted in a negative contrast, which was easier to perceive than the positive contrasts created by the headlamp system. For lighting classes with a lower average luminance on the road (compare Figure 7(b–d)) the negative contrast was smaller and the positive contrast started to dominate for distances closer to car, where the headlamps are able to create high object luminances.
This effect was more severe for road lighting classes creating lower luminance levels, which means that the headlamp’s influence was higher the lower the road lighting luminance. This was indicated by the distance at which the VL with low beam surpassed the VL without low beam. This distance increased for decreasing road lighting luminances. While this research focused only on automotive headlamps similar effects were shown for obstacle detection by cyclists, which were decreased by adding cycle lamps. 55
The results for a situation without any road lighting are shown in Figure 7(e). Keep in mind the presence of prefield illumination of the headlamp system in all measurements resulting in a forward reflection on the surface. As a consequence, VL without low beam was not equal to 0. For targets in all distances the headlamp created a higher VL, which was expected. In this investigation the VL values without any road lighting were generally higher than those for any given road lighting class.
This suggests that road lighting decreased the driver’s ability to detect objects. In the worst cases, combined illumination by both systems rendered the targets invisible when background luminance and target luminance met. This camouflage effect has been observed previously by Bacelar, 28 Gibbons et al. 30 and Bhagavathula et al. 31 However, the road lighting plays a significant role in illuminating the road for other traffic participants such as pedestrians or cyclists and is therefore mandatory for urban scenarios.
3.4 Influence of target reflectance
This work used three targets with reflectances of 15%, 30% and 50%. The targets’ horizontally shifted positions resulted in slight deviations from the expected object luminances in reference to the 15% target due to the horizontal variation of the headlamp’s luminous intensity distribution and were therefore not perfectly comparable; however, they served as an example for much more reflective and thus brighter targets. Additionally, VL values for targets with reflectances of 5%, 7.5%, 10%, 12.5%, 17.5% and 20% were calculated by scaling the object luminance of the 15% target. This is a reasonable approach due to the fact how diffuse reflection works. The results for 5%, 10%, 15%, 20%, 30% and 50% in an M5 road lighting scenario are shown in Figure 9.
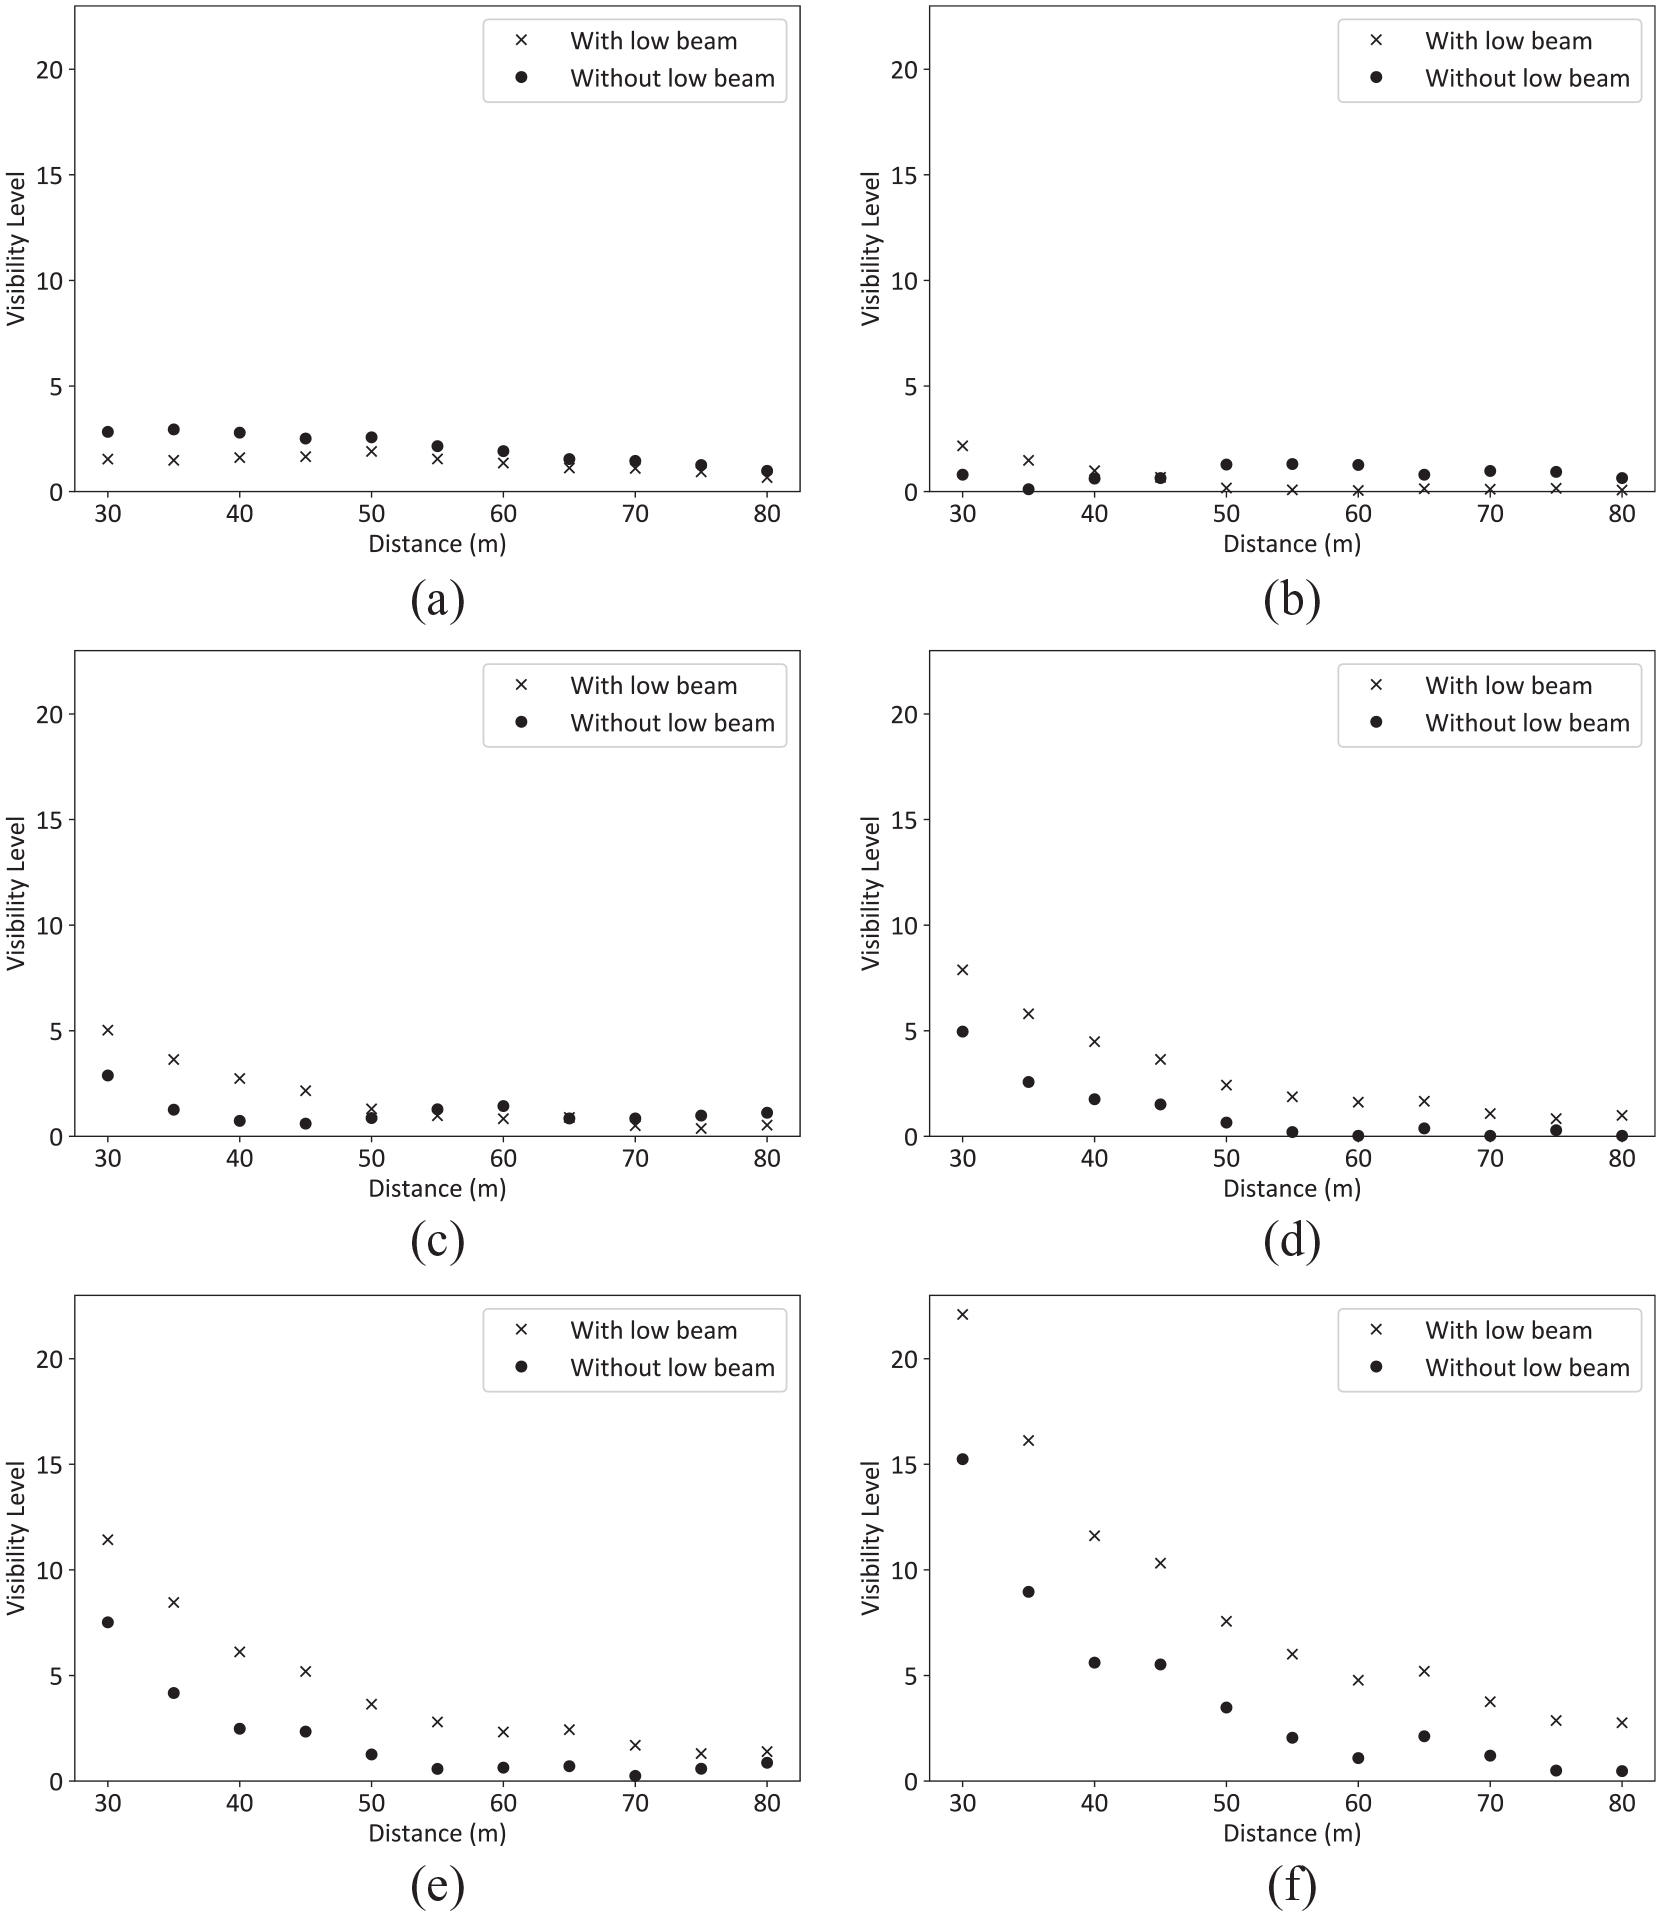
VL calculation for targets with reflectances ρ of (a) 5%, (b) 10%, (c) 15%, (d) 20%, (e) 30% and (f) 50% in different distances from the car under an M5 road lighting class. Object luminances of 5%, 10% and 20% reflectance targets are calculated from the 15% target. The headlamp’s prefield illumination was present in all measurements
All measurements showed that a higher reflectance resulted in a higher VL. This was due to the fact that targets with a higher reflectance had a higher luminance for a given illumination and therefore a much higher positive contrast. Less illumination at the object was needed to generate a high object luminance. Thus, targets much further away from the car still had a high positive contrast despite the photometric law of distance, which describes the decrease in illumination in relation to the distance to a point. As shown in Figure 9(d)–(f) reflectances of 20%, 30% and 50% resulted in higher VL with low beam than without low beam for all distances.
For lower reflectances however, much more illumination from the headlamps would have been required to create high positive contrasts. Thus, VL values without low beam tended to be higher even for targets closer to the driver as shown in Figure 9(b) or even for all distances as it is the case in Figure 9(a) for a target of 5% reflectance.
In addition, there were cases in which the low beam decreased the VL of an object to nearly 0, as for the 10% target in distances between 50 m and 60 m in Figure 9(b). Here, the additional illumination from the headlamp increased the object luminance such that it nearly equalled the background luminance, resulting in a nearly undetectable object. This is the previously discussed camouflage effect.
3.5 Recommendations for adaptive light distributions
These results underline the special photometric requirements of headlamp light distributions when used in conjunction with road lighting. Ideally, the headlamp illuminates only targets in distances where it can create a higher VL. To find these distances different combinations of road lighting classes and reflectances were analysed. The different reflectances were calculated from a target of reflectance 15%. The results are shown in Figure 10. The recommended ranges shown are the distances at which the VL without low beam first exceeds the VL with low beam, as shown above.
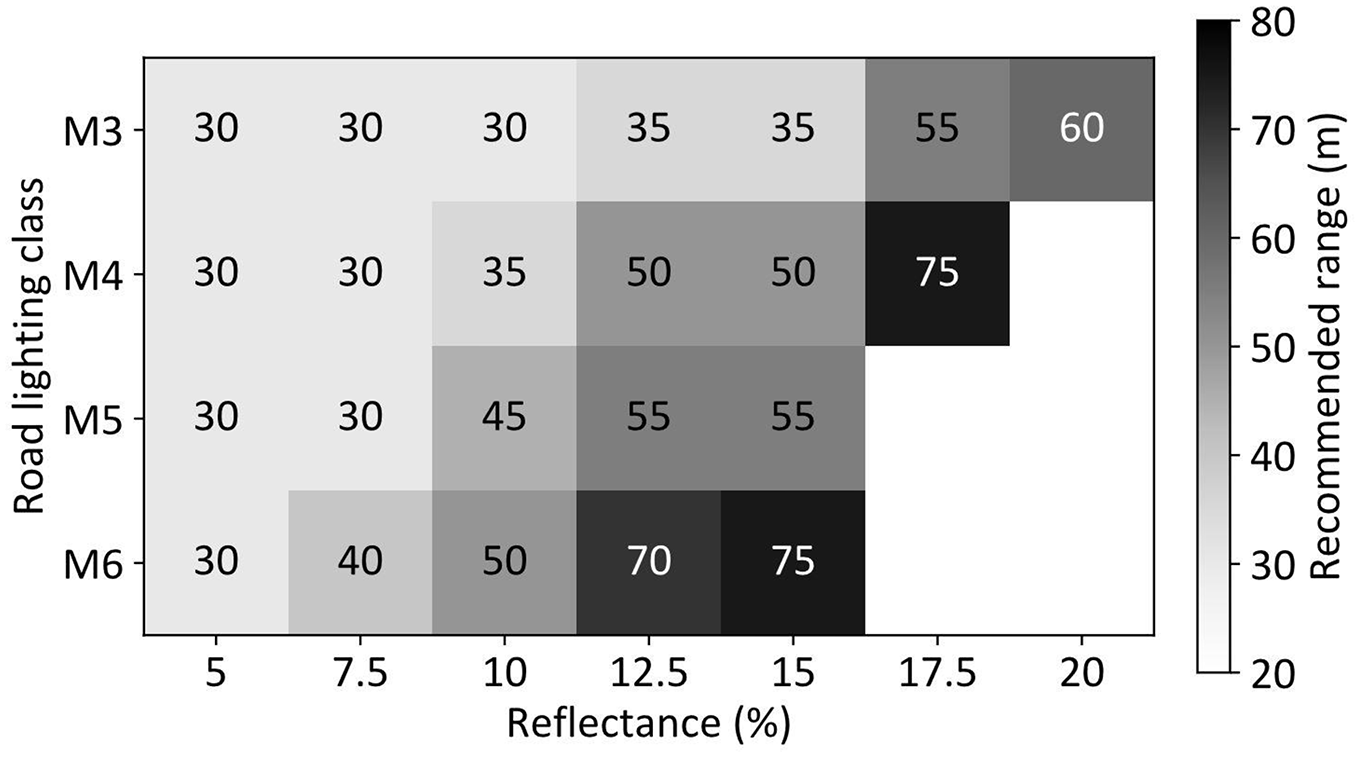
Recommended ranges of headlamp light distributions for driving in a road lighting class M3–M6 and for detecting a target with a given reflectance between 5% and 20%. These ranges indicate that targets at distances further away are more likely to be detected without the headlamp light. Blank fields indicate this does not happen for the investigated distances and the maximally allowed headlamp range is recommended
A blank entry in Figure 10 indicates that the VL with low beam is higher than the VL without low beam for all the investigated distances. For example, for an object with a reflectance of 15% the recommended ranges depending on the road lighting class vary between 35 m (M3) and 75 m (M6). Following this recommendation, the object would be more likely to be detected in all the investigated distances: up to the recommended range revealed by the positive contrast enabled by the headlamp, past this recommended range revealed by the negative contrast enabled by the road lighting.
These results suggest two things: (1) the higher the road luminance of the road lighting class the less beneficial the headlamp and (2) the higher the surface reflectance of the target the more beneficial the headlamp.
While information about the given road lighting class can be collected by sensor systems, direct communication with the road luminaires or via cloud services, the reflectance of the target is unknown in most of the cases. Pedestrians are critical targets. According to Goldmann 38 and Hansen and Larsen 39 the reflectance of clothing lies between 5% and 20%. These data are from 1965 and 1979 and might have changed since then.
Thus, it needs to be discussed in the future which reflectance should be expected, when designing adjusted light distributions, that is which recommended ranges should be used.
3.6 Improvement of the headlamp’s energy efficiency
In order to estimate the potential for improving the energy efficiency of a headlamp, a target reflectance of 15% was assumed. This means, according to Figure 10, the recommended ranges are 35 m for M3, 50 m for M4, 55 m for M5 and 75 m for M6. Based on the current light distribution the luminous flux of different variations was calculated. To realize the recommended ranges all lights going beyond these distances are turned off and only areas up to this distance are illuminated. To provide a reference, the conventional low-beam and town light (range around 75 m) light distributions were compared and the results are shown in Table 3. According to these results, when driving in an M3 road lighting scenario the light output can be reduced to 92% of the low-beam luminous flux. The reason for this high number is the constant prefield illumination, which outputs a greater amount of light than the actual low beam. When this prefield luminous flux is considered as a constant offset, the amount of light the low-beam module alone emits can be estimated to be 40% of its standard output. This result suggests that further research regarding the reduction of prefield illumination is needed. First results by other researchers are promising. 56
Luminous flux calculations for conventional light distributions (low beam, town light) and light distributions with recommended ranges for detecting a 15% target under different road lighting conditions based on Figure 10.
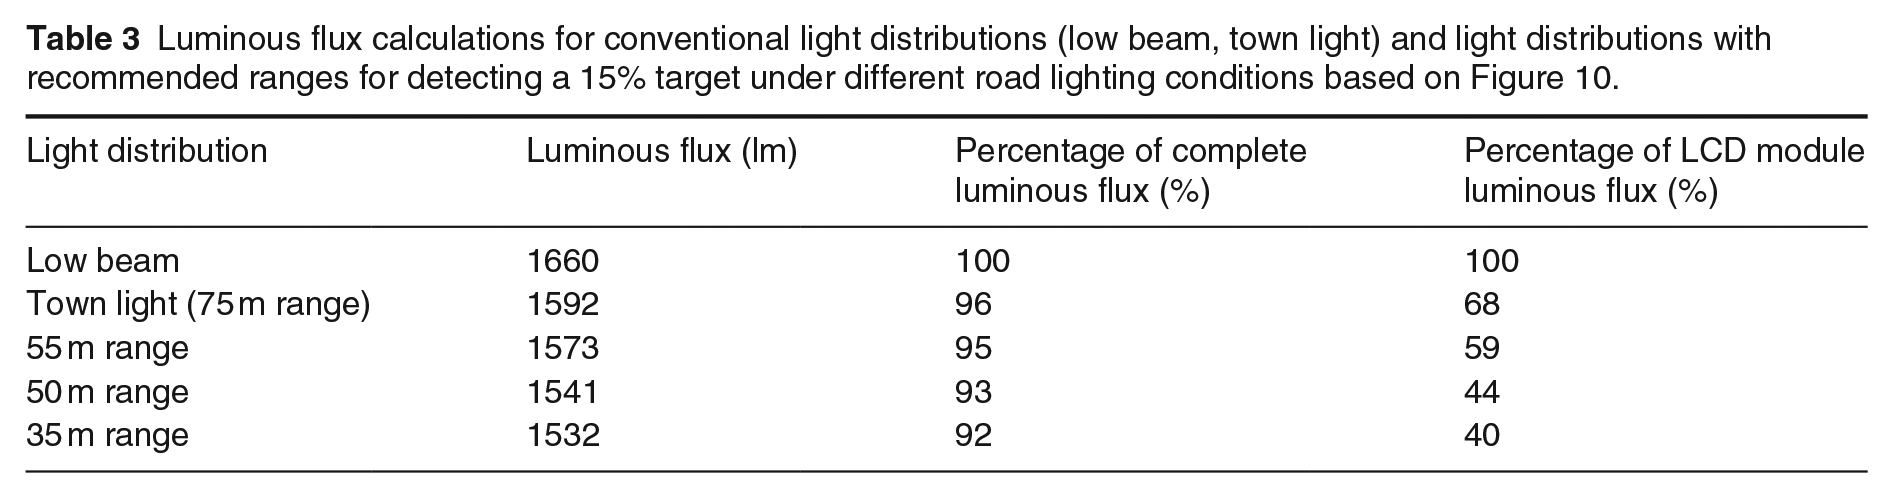
Since the development of more efficient light sources is an ongoing process naming any power consumption is not effective. Instead, the units of luminous flux are much more meaningful and also last for future applications.
4. Conclusion
Several combinations of road lighting classes with a vehicle headlamp system and targets of different reflectances were photometrically measured and analysed. The results show the benefit gained by cooperating between road lighting and vehicle headlamps. Depending on the road lighting class and the expected target reflectance only a fraction of the current light output is needed. This improves three aspects of the lighting system:
A reduction of light output decreases the system’s energy consumption and therefore improves the headlamp’s energy efficiency.
According to the VL measurements, a reduction of the headlamp’s range improves the detectability of objects and consequently leads to a higher safety for all traffic participants.
Although it was not specifically assessed within these measurements, less light typically results in less disability glare and thus further helps the visual performance of other road users.
However, several elements of this analysis require further investigation.
The measurements were done in a specific test track isolated from real traffic, therefore the influence of real road surfaces and real road lighting installations were not taken into account. Especially, the glare by oncoming traffic has a big influence on the detection of targets.
It also needs to be discussed which reflectance of a target can be expected. It is of utter importance to guarantee the detection of targets within the broad spectrum of reflectance. For this, more up-to-date data are required.
In this study the viewing targets were simple square targets and not actual pedestrians. However, real pedestrians are much more complicated viewing targets, which might render in different contrasts. While the upper body might be in negative contrast, the lower body might be in positive contrast or the other way around. Therefore, more research is required to conclude about the visibility of real pedestrians in combined headlamp and road lighting scenarios.
In addition, while the VL is a model to measure visual performance, it might deviate from real person’s perception resulting in undetectable targets, which should be perceptible according to the VL. Thus, it is really important to validate the results in a study with real test persons. It is also the next step of our research to measure the actual detectability of the targets for the recommended ranges and see if they will hold against the evaluation by the study participants.
Addressing these limitations will help not only to improve future automotive headlamp systems to ensure safety but also to make them as efficient as possible.
Footnotes
Acknowledgements
The authors would like to thank HELLA GmbH & Co. KGaA and Volvo Car Corporation for supporting with the test car and the headlamp system and Technical University of Berlin, BIM Berliner Immobilienmanagement GmbH and Stiftung Deutsches Technikmuseum Berlin for providing the LED Laufsteg test track.
Declaration of conflicting interests
The authors declared no potential conflicts of interest with respect to the research, authorship and/or publication of this article.
Funding
The authors disclosed receipt of the following financial support for the research, authorship and/or publication of this article: These results are part of the project Connected Headlamp of the Lighting Laboratory funded by HELLA GmbH & Co. KGaA.