
Abstract
Previous studies have gained data from automated counters to compare the influence of ambient light level on the numbers of people walking and cycling. This paper reports an exploratory study using instead in-person counting, the advantage being that the apparent age and gender of each pedestrian and cyclist can also be recorded. The analysis compares travel counts in case and control periods, with case periods in daylight and darkness, to isolate the effect of change in ambient light level. As expected, the results reveal that there are fewer people walking and cycling after dark. What was unexpected was that for pedestrians, the deterrence of darkness was similar for males and females, which disagrees with previous studies capturing stated preferences suggesting that darkness is a greater deterrent for females than for males.
1. Introduction
Using active modes of travel such as walking and cycling rather than motorised transport is widely promoted, for the health benefits to the individual through physical exercise, and for the reduced traffic pollution, traffic congestion and fuel consumption which is a benefit to all.
A lower level of reassurance is associated with reduced walking, 1 and thus enhancing reassurance would be expected to result in more walking. Reassurance is defined as the confidence a pedestrian might gain from road lighting (and other factors) to walk along a footpath or road, in particular if walking alone after dark. 2 Darkness reduces the likelihood of people leaving their homes, in particular for the elderly, being a result of their perceived vulnerability and concerns about the speed and volume of traffic. 3
Research using subjective methods (e.g. self-report using a questionnaire) has explored the contribution of road lighting to pedestrian reassurance,4–7 concluding that the presence of road lighting, and (to a limit) brighter road lighting, enhances reassurance. Subjective measures of reassurance are, however, prone to stimulus range bias 8 and socially desirable responding, 9 and, as stated preferences, it is unknown whether they are reflected in behaviour (revealed preference).
A more direct approach to investigating whether changes in light influence walking and cycling is to count the number of people using these transport modes in different light conditions. If darkness reduces reassurance, then there will be fewer pedestrians and cyclists. This has been investigated, and confirmed, in studies taking advantage of variation in daylight, either the seasonal variation 10 or the sudden transition imposed by bi-annual daylight saving clock changes.11,12 These investigations compared the numbers of travellers passing specific locations, for the same time of day, but when that time was either daylit or in darkness. To account for seasonal differences between the dark and daylit periods, such as changes in weather or changes in the need to travel (such as school holidays), these changes were compared against changes in parallel control periods using an odds ratio (OR). While the case period changed from daylit to dark (or vice versa) the control period remained daylit (or dark, according to the control hour(s) chosen). From their analyses of data from Arlington, Virginia, USA, Uttley and Fotios 12 reported ORs of 1.38 for cyclists and 1.62 for pedestrians. In both cases, these are significant departures from OR = 1.0 (p < 0.001) and exceed the suggested threshold (1.22) for a small effect size. 13
Those previous studies used data from automated counters. Doing so enabled count data to be collected for a large number of locations and for a wide range of years: it is an efficient approach to data collection. One limitation of that approach is, however, that the count data do not reveal any details about the traveller, such as their age or gender.
Difference between mean females and males in day and night evaluations of fear of crime and perceived risk of crime from Gover et al. 14
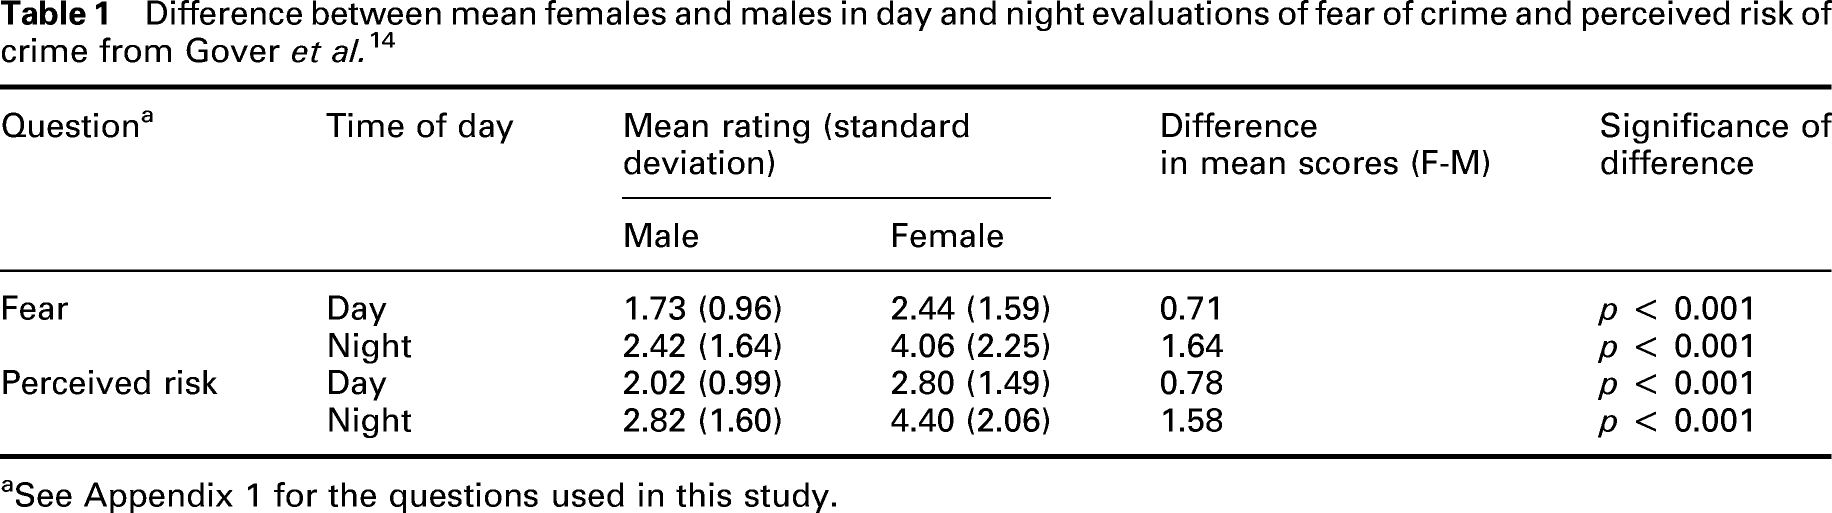
aSee Appendix 1 for the questions used in this study.
However, being an online survey, it is not known whether responses recorded by Gover et al. were given in daytime or at night, and the results from Fotios et al. 6 suggest that evaluations of reassurance at night given in daytime are not the same as evaluations of reassurance at night given at night. This was a study of road lighting where test participants evaluated their feelings of safety whilst at each of ten locations, in daytime and after dark. Amongst the questions, one asked ‘How risky do you think it would be to walk alone here at night?’ (1 = Not at all risky to 6 = Very risky), with identical questions being used in the daytime and after-dark questionnaires. While the after-dark evaluation could be based on direct experience, the daytime evaluation would require an imagination of the likely perception of risk after dark. The results revealed a significant (p = 0.009) difference in day and night responses to this question, with ratings being significantly lower in day evaluations than night evaluations.
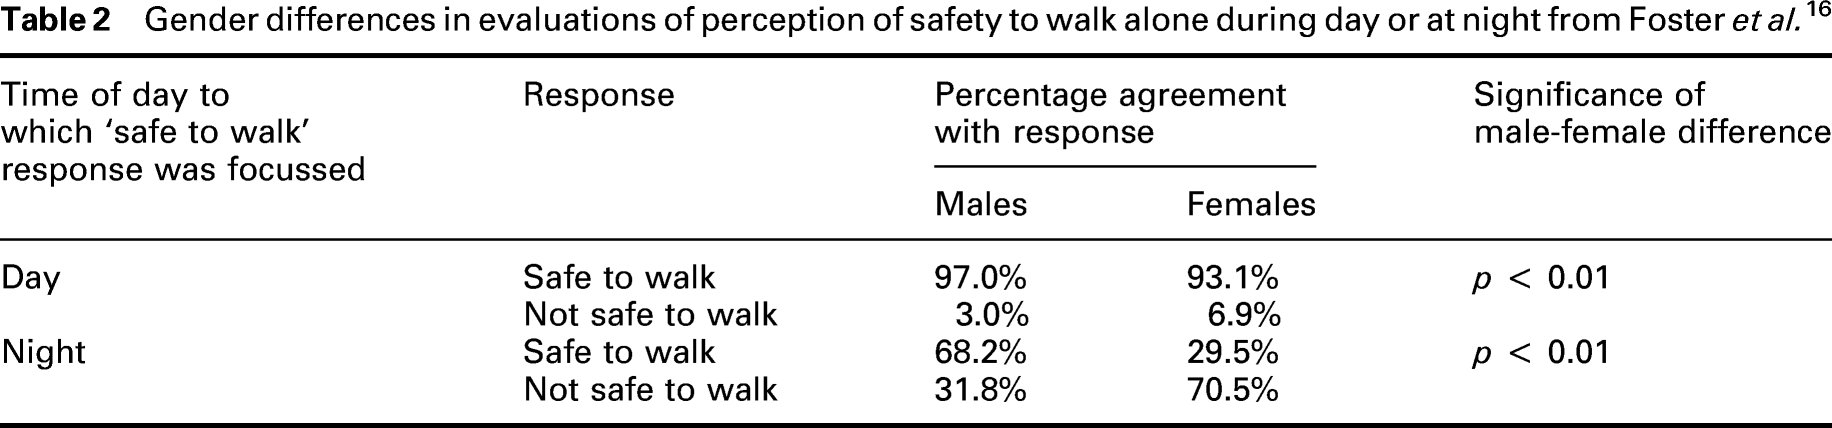
Gender differences in evaluations of perception of safety to walk alone during day or at night from Foster et al. 16
Research about gender differences in the effect of darkness on reassurance to cycle is less extensive than that for walking. Sustrans, a UK national organisation promoting active travel, found that only 23% of females felt safe cycling after dark, compared with 36% of males. 17 A survey about barriers and motivators for cycling found that potential or occasional cyclists rated a route being not well lit after dark as being a bigger deterrent to cycling than regular cyclists. 18 The survey also found that females were less likely to be regular cyclists than men, suggesting that how well lit a route is after dark may be a bigger consideration in where to cycle for females than for men.
While older and younger pedestrians may have different needs when it comes to route choice, 19 there is mixed opinion about whether older people express greater fear about walking than younger people, with inconsistencies suggested to be a function of the measure of fear used.20,21 There is also scant research about whether differences between the elderly and young in their evaluations of reassurance vary between daylight and darkness. For example, while Shigematsu et al. 22 obtained responses from five age groups (from 20–39 to 76+) to their questionnaire on walkability, they did not discriminate between walking in daylight and after dark.
One study which focussed on reassurance after dark is that of Johansson et al. 23 who recorded ‘perceived danger’ from three groups of people following a walk alone, after sunset, along a footpath in a Swedish town. Their three groups included an elderly group of mixed gender (aged 65 to 91 years) and a young female group (aged 20 to 27 years) to test their hypothesis that the young female group would perceive the path as more dangerous than the other two groups (elderly, and visually impaired) due to the risk of sexual assault. This is in contrast to the more widespread, but unproven, assumption that older people would express greater fear than younger people. Perceived danger was evaluated from responses to five questions (including ‘I would walk along this path unaccompanied’ and ‘I feel uneasy at this place’) using a 5-point response scale. The results did not support the proposed hypothesis that the young females would perceive the path as more dangerous than the elderly group, although an effect of gender was revealed with females expressing a greater degree of perceived danger than did males.
Greve et al. 21 measured the behaviour component of reassurance through responses to ten items, including ‘I do not go out’ and ‘I carry something that can be used as a weapon’, with participants giving their agreement using a 5-point scale (ranging from 1 = never to 5 = always). The results revealed a significant increase with age (r = 0.45, p < 0.001), interpreted as evidence that ‘older people behave much more defensively and cautiously than younger ones’. These responses would suggest darkness leads to a greater reduction in the number of elderly people walking than any reduction in younger people.
We report here an exploratory study carried out to investigate how ORs for the effect of ambient light level on pedestrian and cyclist counts are influenced by gender and age. This was done using on-road observation and thus represents only a small sample of locations and for only one period (the spring 2021 clock change). Following previous studies, it was predicted that darkness would have a greater impact on females than on males.
The effect of age was considered only for pedestrians, testing the prediction that darkness would have greater impact on the elderly than on the young. For cyclists, who tend to travel faster than pedestrians, it was not possible to estimate age with sufficient certainty.
It was predicted that overall ORs would be greater than 1.0 for both pedestrians and cyclists, indicating reduced numbers of pedestrians and cyclists in darkness than in daylight. It was also predicted that ORs would be greater for females and the elderly, than for males and the young respectively, indicating a greater reduction for these groups due to darkness.
2. Method
The method used here is similar to that used in previous work11,12 other than the data being captured by on-street observation rather than automated counters.
Descriptions of the locations in Sheffield, UK, where traveller counts were recorded
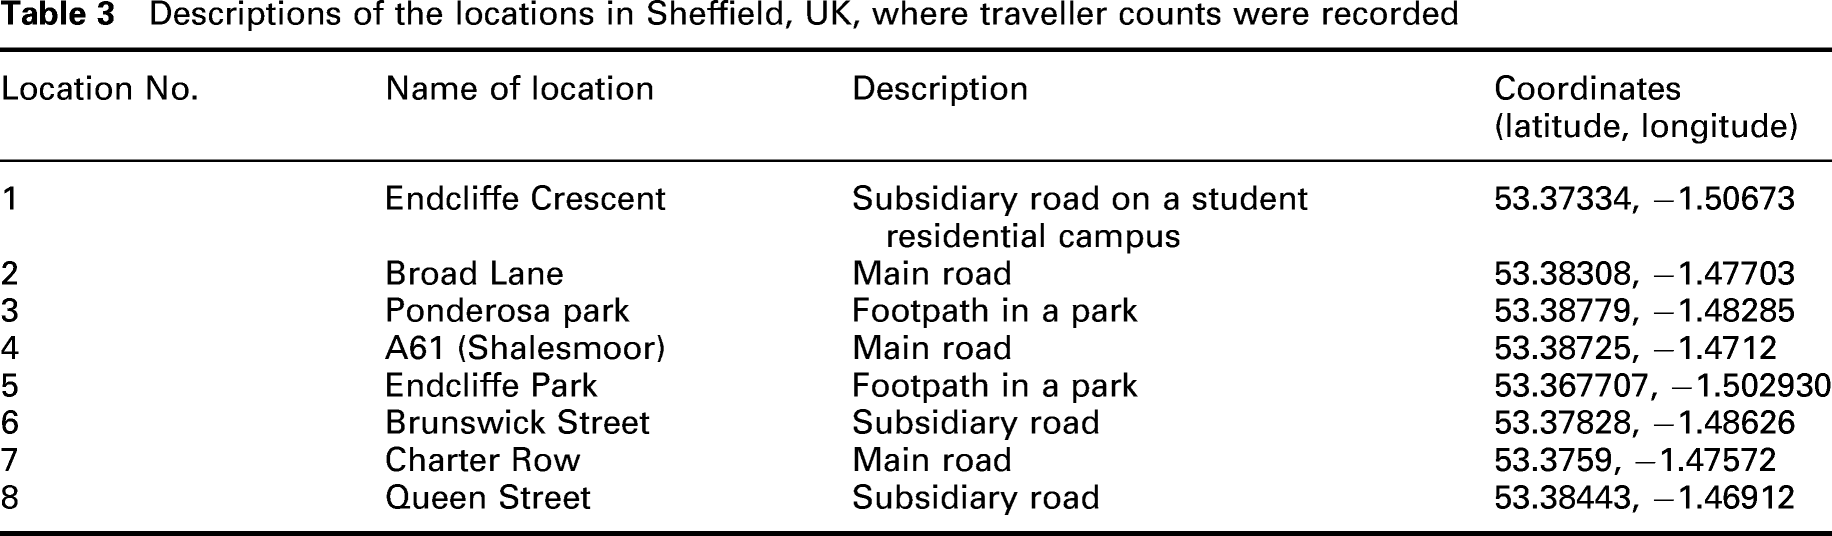
Counts were recorded for 6 days before (Monday 22/3/2021 to Saturday 27/3/2021) and 6 days after (Monday 29/3/2021 to Saturday 3/4/2021) the spring clock change (Sunday 28/3/2021).
The Case hour (an hour that changes ambient light level following the clock change) was chosen as 19:00–19:59. This hour was predominantly in darkness before the clock change (the latest onset of civil twilight during the week before the clock change being 19:07) and in daylight after the clock change (the earliest onset of civil twilight in the week after the clock change being 20:09). The Control hour was chosen as 16:00-16:59, this hour remaining in daylight during the entire data collection period.
Each traveller crossing an imaginary line perpendicular to the direction of the road or path at the location was counted. This imaginary line avoided junctions or corners, to minimise the potential for confusion when counting or the potential for double counting. Pedestrians or cyclists passing the line in either direction, and on either side of the road or path, were counted. For pedestrians and cyclists, their apparent gender was recorded. Pedestrians were additionally allocated into one of three age groups, <30, 30–59, and >59 years. To investigate the effect of age it was intended to compare the younger and older of these groups, with the middle category being used to ensure a distinction by observed age. During their initial briefing observers were trained on classifying people by age using images of celebrities.
Following Johansson et al.
24
ORs and 95% confidence intervals (95%CI) were calculated using equations (1) and (2) • CaseDay is the number of cyclists or pedestrians in the Case hour after the Spring clock change • CaseDark is the number of cyclists or pedestrians in the Case hour before the Spring clock change • ControlDay is the number of cyclists or pedestrians in the Control hour on days when the Case hour would be in daylight • ControlDark is the number of cyclists or pedestrians in the Control hour on days when the Case hour would be in darkness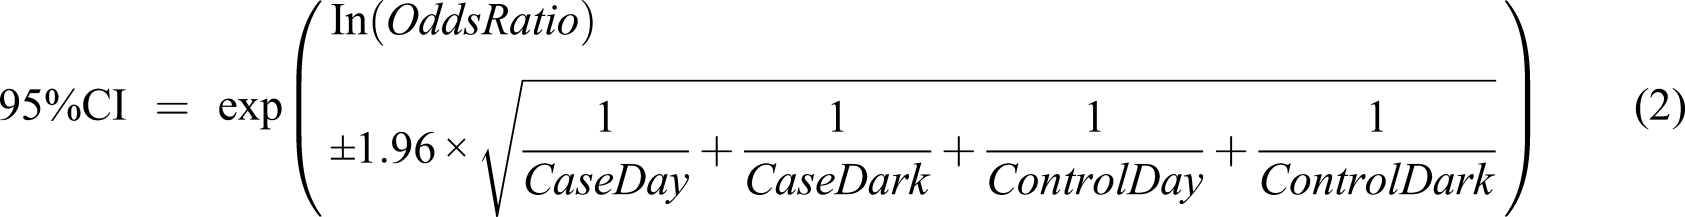

ORs were assessed for significant deviation from 1.0 using the Pearson’s Chi-square test. OR were compared for statistically significant differences between subgroups (for example, males vs females, younger vs older) by calculating a z-score for the comparison and converting to a p-value. The threshold for statistical significance was set at alpha = 0.05. ORs are a measure of effect size in their own right. We compared ORs against the effect size thresholds described by Olivier and Bell 13 to assess their magnitude. All data and analytical code relating to the results reported in this paper are available at https://osf.io/djxq9/
3. Results
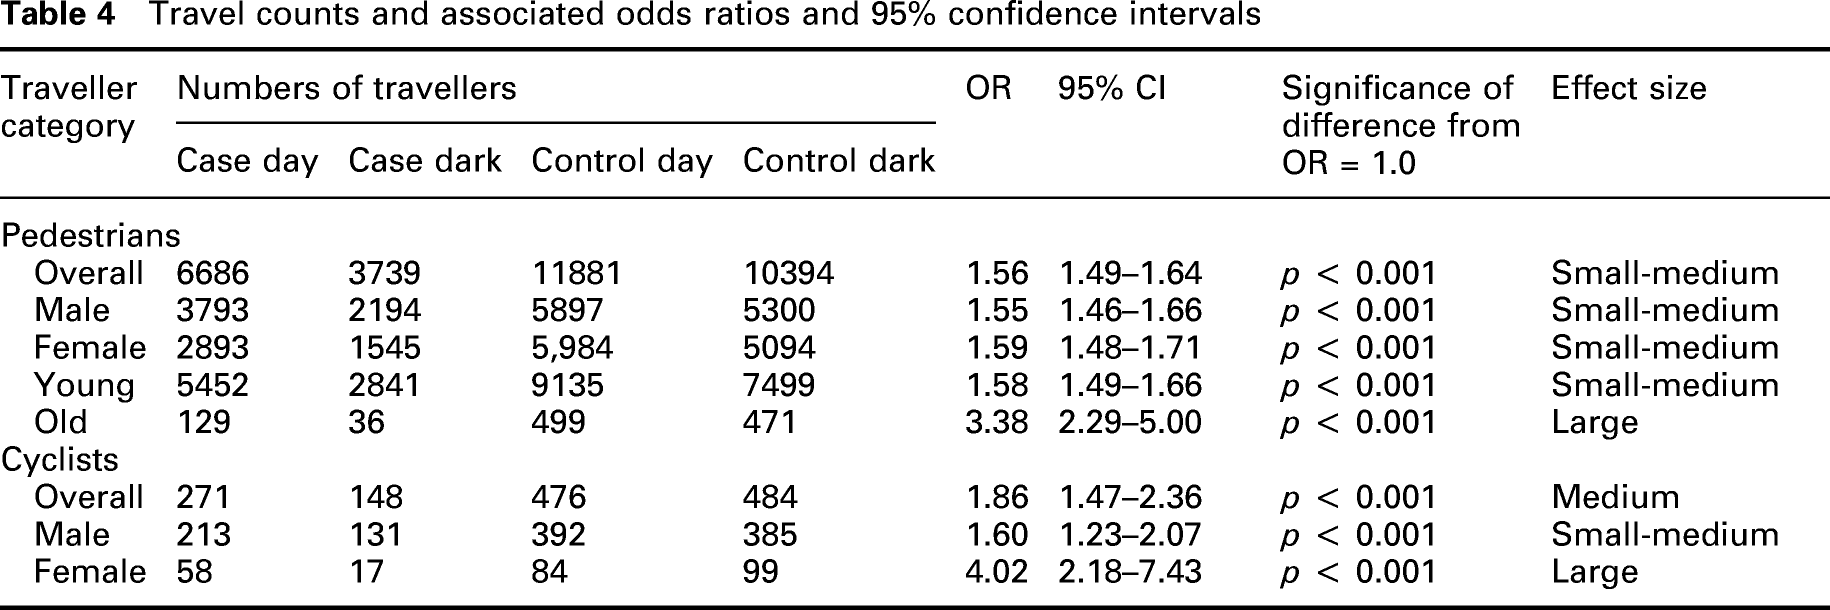
Travel counts and associated odds ratios and 95% confidence intervals
4. Discussion
4.1 Traveller type/ data validity
Comparison of odds ratios comparing numbers of cyclists and pedestrians in daylight and darkness
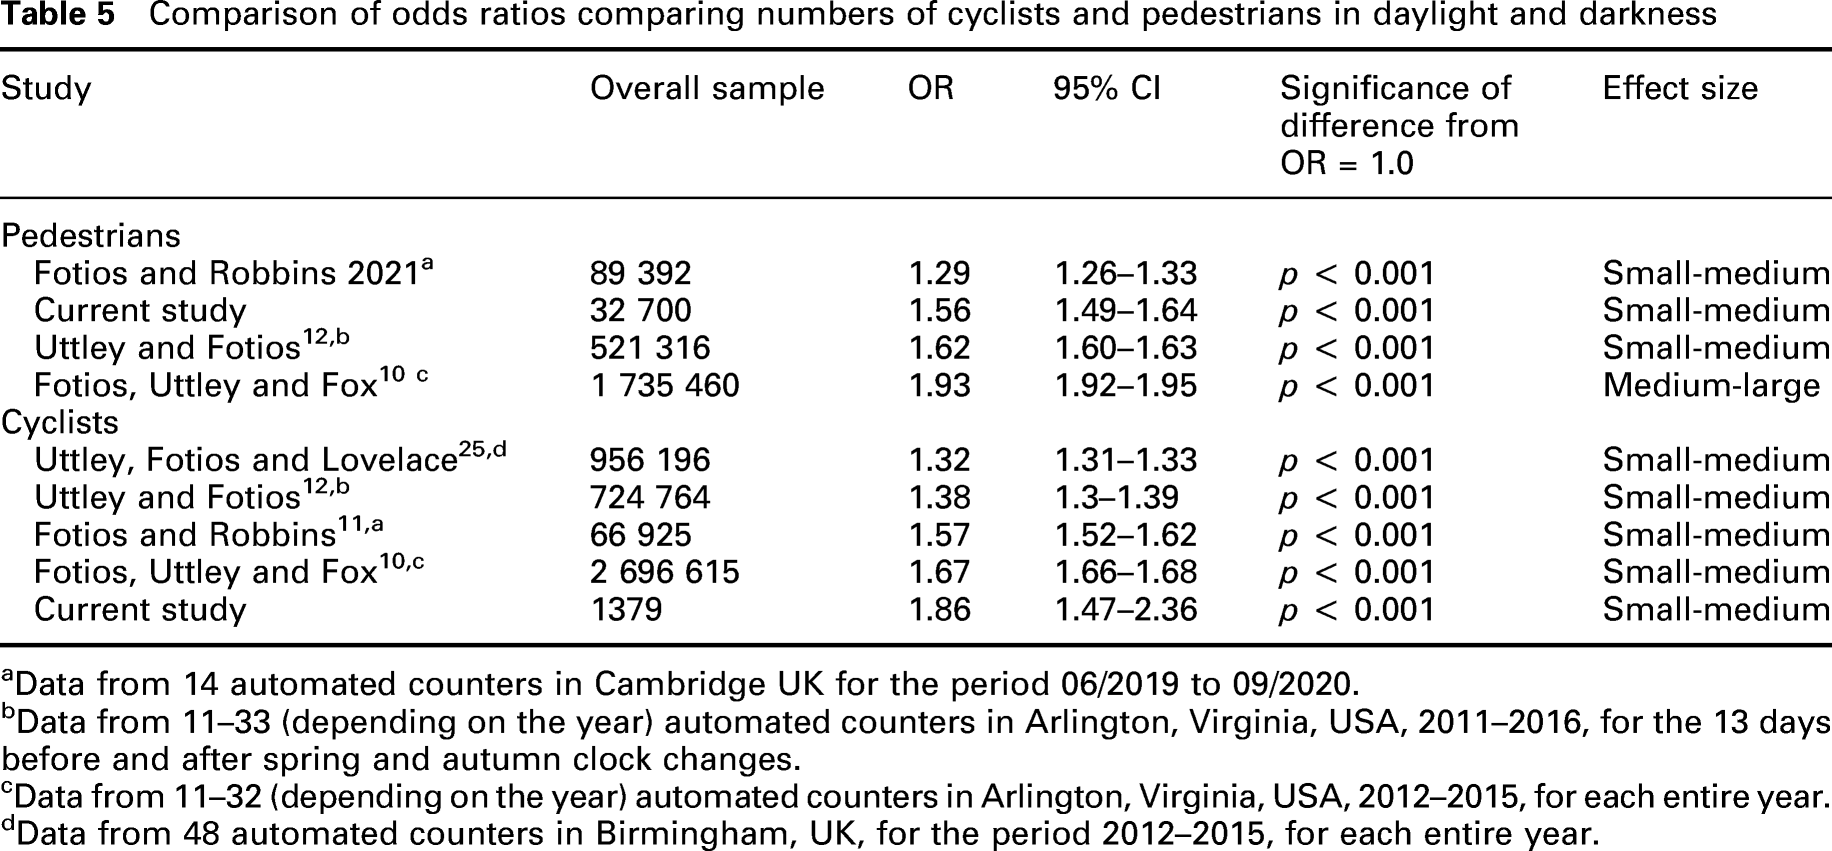
aData from 14 automated counters in Cambridge UK for the period 06/2019 to 09/2020.
bData from 11–33 (depending on the year) automated counters in Arlington, Virginia, USA, 2011–2016, for the 13 days before and after spring and autumn clock changes.
cData from 11–32 (depending on the year) automated counters in Arlington, Virginia, USA, 2012–2015, for each entire year.
dData from 48 automated counters in Birmingham, UK, for the period 2012–2015, for each entire year.
The OR for pedestrians in the current study (1.56) sits within the range of ORs found in previous studies (1.29–1.93). However, the OR found for cyclists in the current study (1.86) is greater than those reported in previous studies (1.32–1.67): the OR is significantly (p < .01) higher than those reported by Uttley et al. 25 and Uttley and Fotios 12 but is not suggested to be significantly different to the ORs reported by Fotios and Robbins 11 or Fotios et al. 10
The ranges of ORs for pedestrians and cyclists across these studies are similar (1.29–1.93 and 1.32–1.86, respectively). This suggests that darkness has a similar degree of deterrence for both cycling and walking.
One observation about the current results is that the confidence intervals are wider than those reported in previous studies. This may be because the overall number of travellers observed was smaller than in past studies (Table 5). With larger samples, and assuming these are proportionally allocated across the case and control periods, the OR is unaffected, but the confidence interval is reduced.
4.2 Gender
For cyclists, the ORs suggest a significant difference between males and females (male OR = 1.60, female OR = 4.02, z = 2.717, p = 0.003), with the OR for female cyclists indicating that darkness has a greater deterrent effect. This finding agrees with previous work.17,18
For pedestrians, however, differences between the ORs for males and females were not suggested to be significant (male OR = 1.55, female OR = 1.59, z = 0.518, p = 0.302). This agrees with the self-reported walking behaviour recorded by Foster et al., 16 this being interviewees’ recollection of the number of occasions of walking for at least 15 minutes in the previous four weeks: their results did not suggest a significant difference between males and females.
The absence of a gender difference for pedestrians in the current data disagrees with conclusions drawn in studies using subjective evaluations of reassurance, which is that darkness leads to a greater reduction in reassurance for females than for males.14–16 One explanation for this is socially desirable responding, whereby males are more likely than females to under-report their concerns about becoming a victim of crime 9 : if this leads males to over-report their level of reassurance it may lead to an apparent gender difference. The current study, however, exposes revealed behaviour, which is not influenced by socially desirable responding, and hence the gender difference is removed.
4.3 Age
Age was considered in the current work only for pedestrians. The ORs for younger and older pedestrians were suggested to be significantly different (young OR = 1.58, old OR = 3.38, z = 3.800, p < 0.001), indicating that darkness is a greater deterrent to old pedestrians than to young pedestrians. This age-related difference agrees with that revealed by the behaviour component of reassurance reported by Greve et al. 21
4.4 Limitations
This study used in-person observation of pedestrians and cyclists for eight locations in only one clock-change period (spring 2021), rather than data from automated counters across a greater number of locations and years. While this led to smaller samples than previous studies, in particular for cyclists, the ORs are not inconsistent with previous studies (Table 5). This was an exploratory study, with the smaller data set accepted at the expense of being able to capture further data such as age and gender.
The observations were conducted during the global SARS Covid pandemic when national and localised restrictions on travel may have influenced the need for travel, the availability of travel options such as public transport, and personal travel decisions. However, the OR analysis means that this would affect the analysis only if these factors asymmetrically affected the case versus control and before versus after clock change periods, which is unlikely.
It is possible that some errors were made by observers in the classification of travellers by age and gender. In an initial briefing session, the observers were trained in classifying people by age to help minimise errors. The middle age group (30–59 years) was ignored in the analysis to also ensure a clear distinction between young and old age groups, even if some pedestrians had been placed in the wrong age category. The overall results would only be affected by misclassifications of age and gender if this occurred asymmetrically between the four observation periods (Case day, Case dark, Control day and Control dark) and we have no reason to expect this.
5. Conclusion
The results of a field observation of pedestrians and cyclists confirmed previous findings that, for the same time of day, fewer people walk or cycle in darkness than in daylight. This investigation extends previous work using automated counters by allowing comparison of traveller age and gender. Age was recorded only for pedestrians, and the results indicated darkness to be a greater deterrent for the elderly than the young. The results also confirmed that darkness would be a greater deterrent to female cyclists than male cyclists. However, for pedestrians, the data do not suggest a significant effect of gender, which disagrees with previous studies where females express greater fear for walking at night than do males. Further work is required to confirm this unexpected finding.
Footnotes
Acknowledgements
The authors wish to thank the following University of Sheffield students for helping collect the travel count data: Monisha Anandan, Samuel Okwemba, Ziming Zhao, Majd Alshimeimri, Manel Lemmouchi, Linan Zang and Peter Tarrant.
Declaration of conflicting interests
The authors declared no potential conflicts of interest with respect to the research, authorship, and/or publication of this article.
Funding
The authors received no financial support for the research, authorship, and/or publication of this article
Appendix 1
Questions and response scales used by Gover et al. 14
Fear of crime
‘During the day, while you were on campus, how afraid were you of being the victim of theft, robbery, assault, and rape?’
‘At night, while you were on campus, how afraid were you about being the victim of theft, robbery, assault, and rape?’
Response options ranged from 1 to 10 (1 = not at all afraid; 5 = neither afraid nor unafraid; 10 = very afraid).
Perceived risk
This was measured using responses to four questions, evaluated separately for daytime and nighttime: ‘How likely do you think it is that you will be the victim of (1) theft, (2) robbery, (3) assault, and (4) rape.’
Response options ranged from (1) not at all likely to; (5) neither likely nor unlikely to; (10) very likely.