
Abstract
Using experimental data from four electric lighting scenarios at King’s College Chapel in Cambridge, we developed an integrated approach to evaluating the overall impression of concert lighting. First, we performed a group analysis based on the aggregated response from the audience, conductor and musician respondents, followed by an overall analysis accounting for all 624 responses. Ordered logistic regression analysis revealed the absence of statistically significant subjective–objective relationships for perceived visual balance, appropriateness, comfort and the overall impression. There were, however, significant results when the variables were correlated with subjective attributes. This suggests that the perceptual process was bi-level. To gain a more complete understanding of the perceived qualities, it is necessary for an approach to consider not only the intercorrelations between the subjective and objective measures, but also the intracorrelations among the subjective attributes. Further analysis of variance showed that increasing the overall lighting intensity was more likely to lead to a lower level of satisfaction. Nevertheless, providing peripheral and directional lights appeared to be the key to improving the overall impression. This paper confirms that combining detailed and generalised approaches to evaluate subjective responses can yield more meaningful interpretations, enabling relations with measures to be established with greater confidence.
1. Introduction
Lighting researchers have been striving for pragmatic and holistic approaches to assessing the effects of lighting conditions on building occupants. Since the first Commission Internationale de l’Éclairage (CIE) symposium on lighting quality two decades ago, 1 much effort has been devoted to developing predictive models linking the visual system with task performance, visual comfort and preferences, 2 – 4 linking the perceptual system with health and safety (e.g. disability glare and fatigue)5,6 and well-being (e.g. mood, motivation and behaviour),7,8 as well as linking the circadian system with colour properties, alertness and health. 9 – 11
Suggested frameworks and protocols given in current standards and guidelines for assessing the visual environments and occupant’s responses
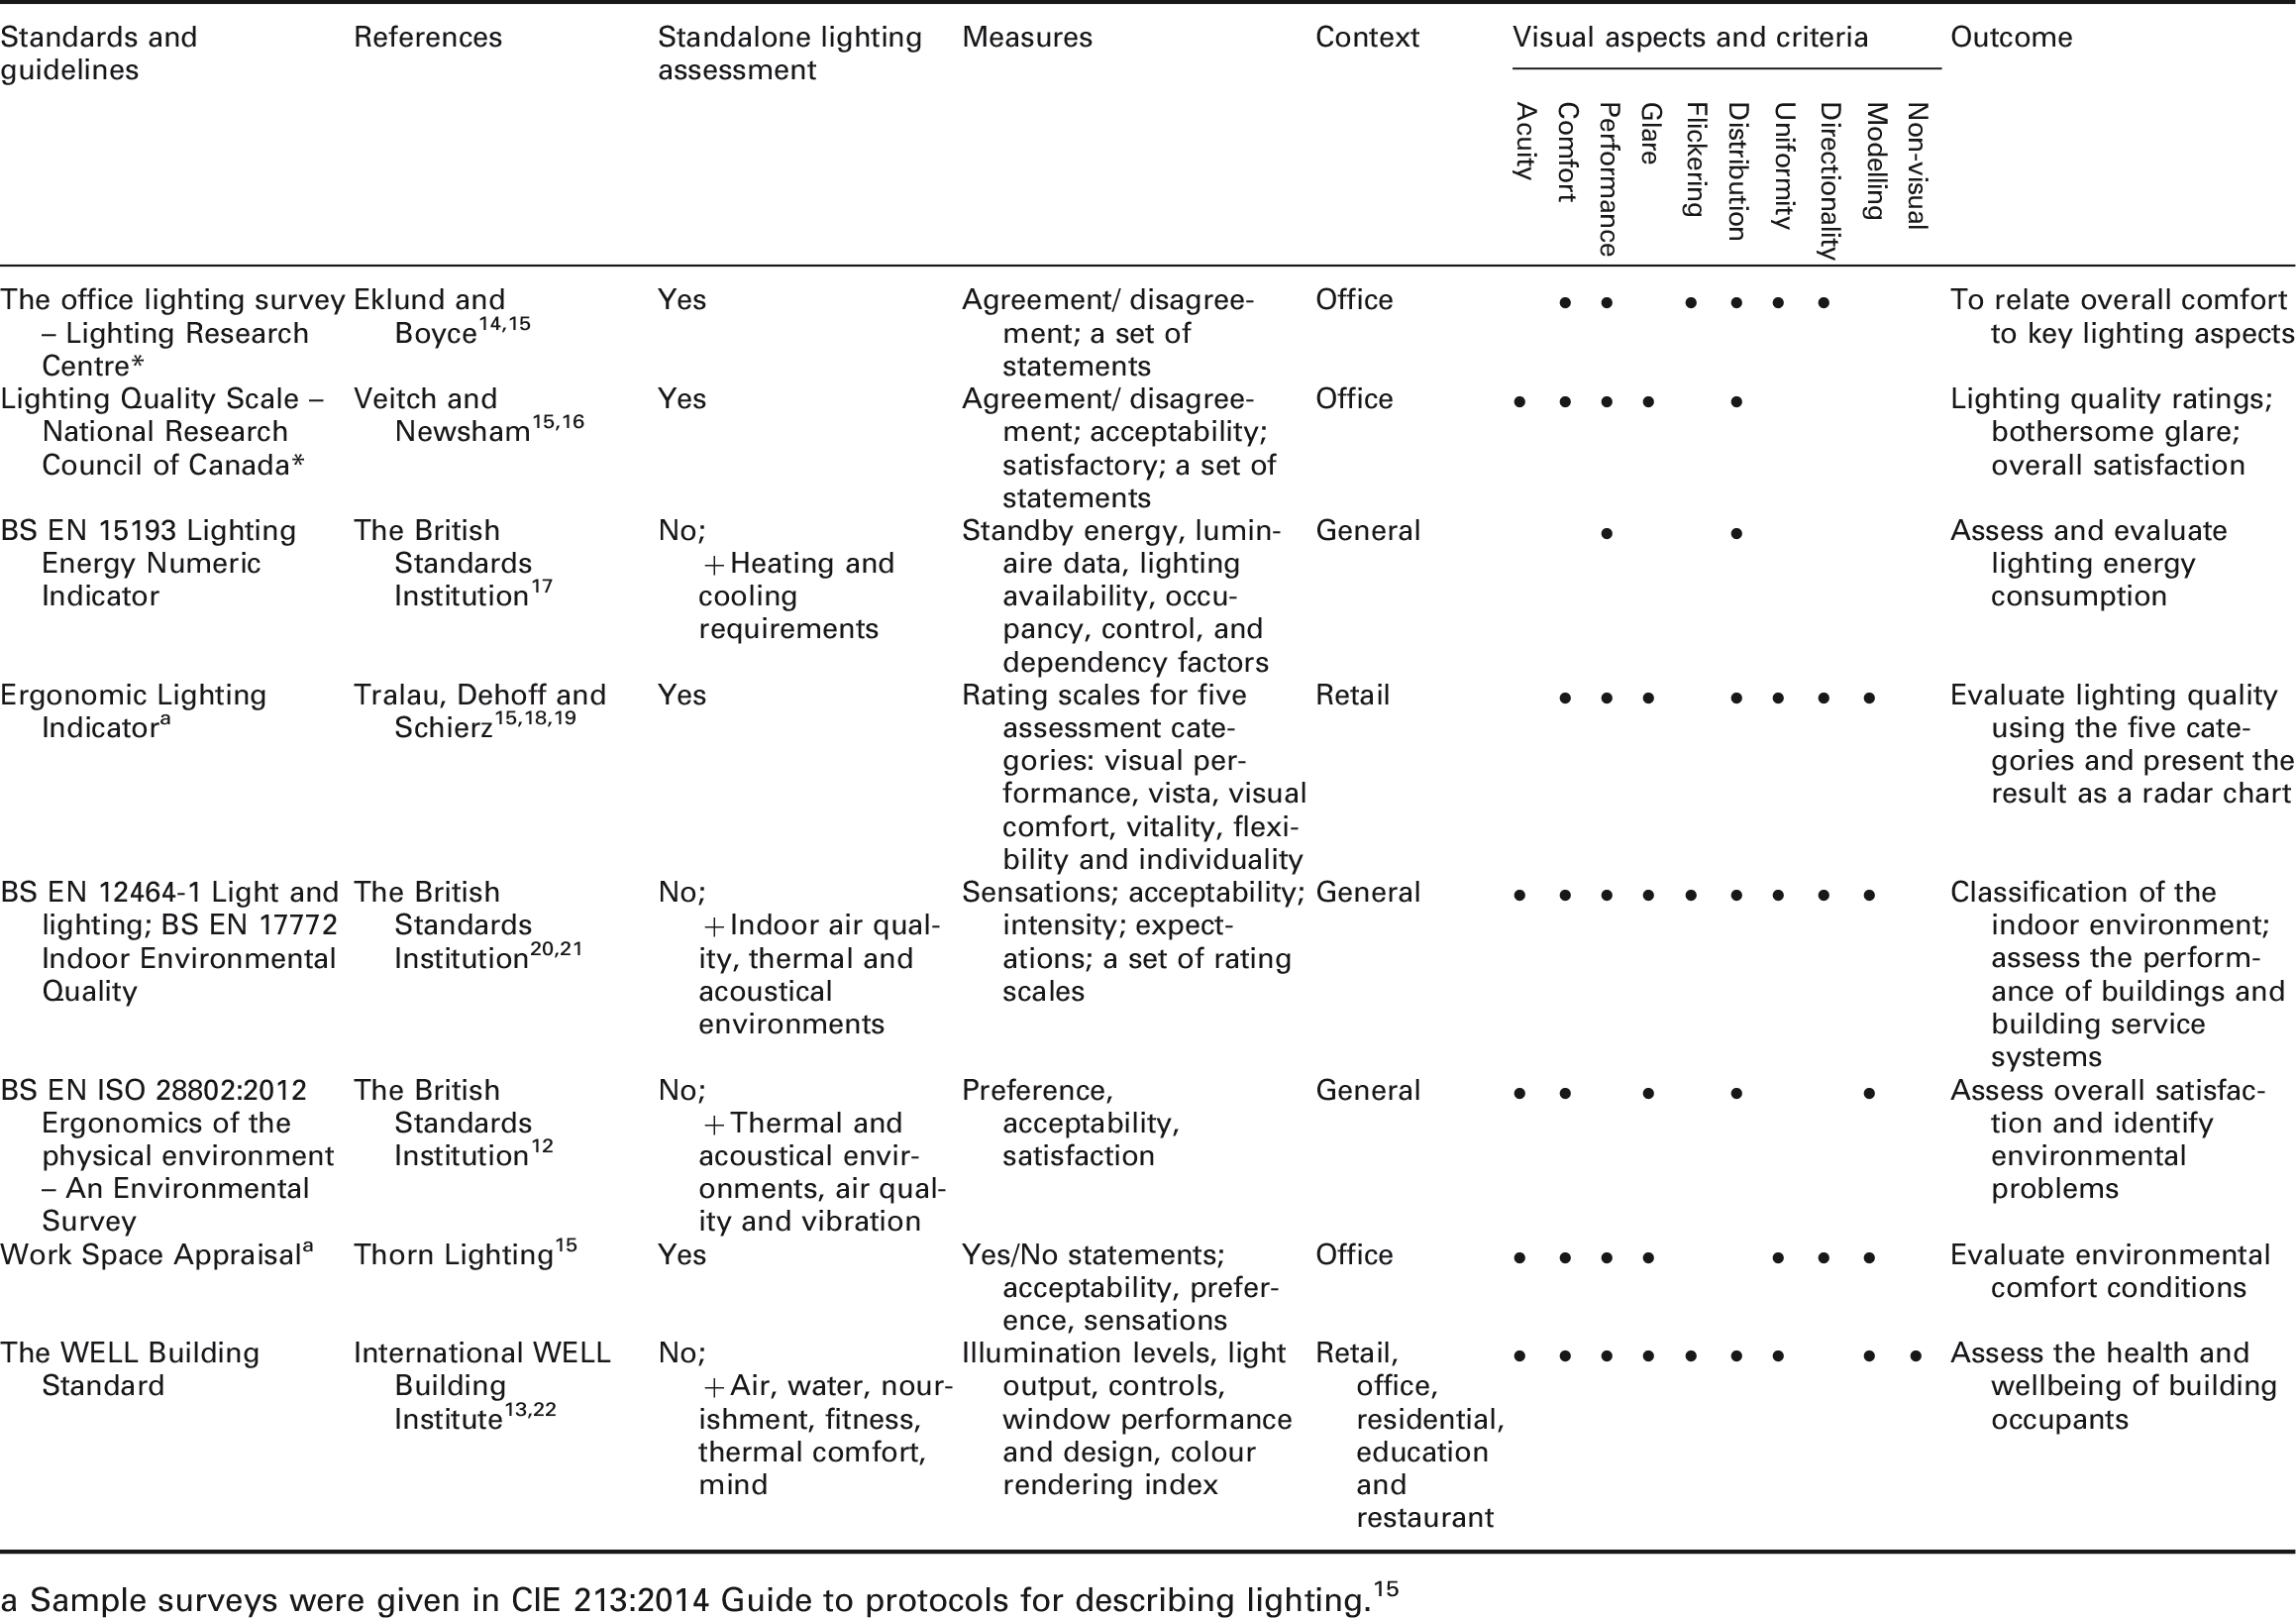
Sample surveys were given in CIE 213:2014 Guide to protocols for describing lighting. 15
The procedures detailed in the standards and guides may mislead practitioners and assessors alike into assuming that the evaluation process is merely a tick-box exercise. The following review of methods and model developments attempts to highlight what might have contributed to the shortcomings of these assessment frameworks. Broadly, (1) previous lighting studies appear to have focused mostly on simple and controlled contexts with limited physical parameters considered; (2) the general nature of the questions and response variables selected seems unable to fully reflect different contexts and the occupants’ luminance requirements; and (3) assessment procedures are often presented in a sequential and orderly manner with relatively little emphasis on their applicability in complex settings.
1.1 Controlled contexts with limited physical parameters
In early developments, empirical models were developed with shared goals to perform assessments and make predictions in a variety of settings and under a variety of lighting conditions. A common approach was to model the effects of light on people’s ability to process visual information, and on their speed and accuracy in performing visual tasks. The psychophysical experiments involved, however, have traditionally been over-controlled, leaving the applicability of the models open to challenge, especially when applying them in complex luminous environments. Among the well-established studies, Blackwell’s visibility-based approach focused on observers’ visual ability to sense minute changes in light levels,23,24 while Rea and Ouellette’s time-based approach centred on observers’ reactions to non-visual tasks under mesopic and photopic conditions. 25 – 27 Based on both observed threshold and suprathreshold responses, Rea and Ouellete’s visual performance model (RVP) indicates that visual performance improves with increased brightness and contrast, though the trend levels off when the brightness and contrast become relatively high. These findings are consistent with those obtained in other studies. 28 – 30 The model was better received because of its explicit attempt to associate visual and task performances with a broader range of threshold values, and because of the relative ease of obtaining the relevant measurements. Despite being highly appealing in the first instance, these approaches seem to have little place in current lighting research, except in road lighting.31,32 A plausible explanation could be that the tightly controlled experimental setting and design might have limited the potential for application in real contexts. The limited number of physical parameters considered, as Rea admitted, might also have contributed to the incompleteness of the model. 33
1.2 General nature of the questions and response variables
Another practical concern with some models is the risk of assuming similar magnitudes of lighting attributes in one context can induce similar impressions in another context. Inspired by the designed appearance method of Waldram34,35 that is based on the concept of apparent brightness, Lynes devised the flux distribution procedure as a design guide to good illumination. 36 To account for task illumination and illumination hierarchies, the five-step procedure involves calculating of surface reflected flux, average indirect illuminance, surface direct illuminance, surface direct flux and zone lamp wattage. Cuttle similarly integrated the concepts of ambient illumination, illumination colour appearance, illumination hierarchy, colour rendering, flow of light, sharpness of lighting and luminous elements into one framework. 37 , 38 He described that a lit appearance would be considered dim at 30 lm/m2, whereas it would be perceived as distinctly bright at 1000 lm/m2. In addition to linking illuminance levels to the generic descriptions of perceived appearances, the underlying theories often require advanced mathematical knowledge which makes the models of Lynes and Cuttle less intuitive for architects and designers alike to comprehend, and thus less readily applicable.
1.3 Assessment procedures
Through mapping the complex pathways among lighting and visual conditions and behavioural effects, several attempts have been made to develop linked-mechanism maps to understand the effects of environmental and behavioural factors on the perceptions of luminous conditions and the feelings of competence, health and wellbeing. Guided by a set of concepts, step-by-step procedures and standardised assessment scales and scoring measures, Boyce et al. and Veitch et al., for example, executed field experiments to examine the multi-dimensional linkages among the perceptual aspects of light.7,8,39 Using Wyon linked mechanisms maps, they observed that spatial attractiveness, mood, health, well-being, satisfaction, work engagement and behaviour could all to some extent be predicted through lighting appraisal. Motivation could be predicated by visual capabilities, and task performance could be predicated by using lighting appraisals combined with visual capabilities.7,39 In a separate study, Borisuit et al. 40 found that there are potential relationships between visual comfort, mood, alertness, well-being and lighting conditions, supporting the findings of Boyce et al. and Veitch et al. The highly robust way of formulating such studies and the thoroughly systematic nature of the relationships might, however, mislead practitioners into thinking lit environments are evaluated by means of behavioural checklists. Any complementary relationships that might exist between multiple subjective aspects of light might get overlooked. Furthermore, the lack of contextual variables might fail to guide researchers and practitioners to examine specific environments – other than real and experimental office conditions.
Clearly, there is no one-size-fits-all framework for lighting evaluation. Likewise, it would be inappropriate to follow recommended light measurements blindly in any application, as they rarely reflect the complex lighting requirements of the built environment. Extending our work that evaluated the perceived qualities of concert lighting at Cambridge King’s College Chapel, 41 this paper presents the development of an integrated approach for evaluating its overall impression. Note that the choice of the context was driven by a need to provide the College with a lighting appraisal for evaluating users’ concert experience in the chapel. This study was designed to address the shortcomings discussed above by examining a real and complex luminous environment, developing analytical methods with emphases on occupants’ roles and their luminance requirements and adopting a bottom-up approach to evaluating lighting impressions to identify any subtle observations.
2. Methods and procedures
2.1 Previously completed lighting experiments
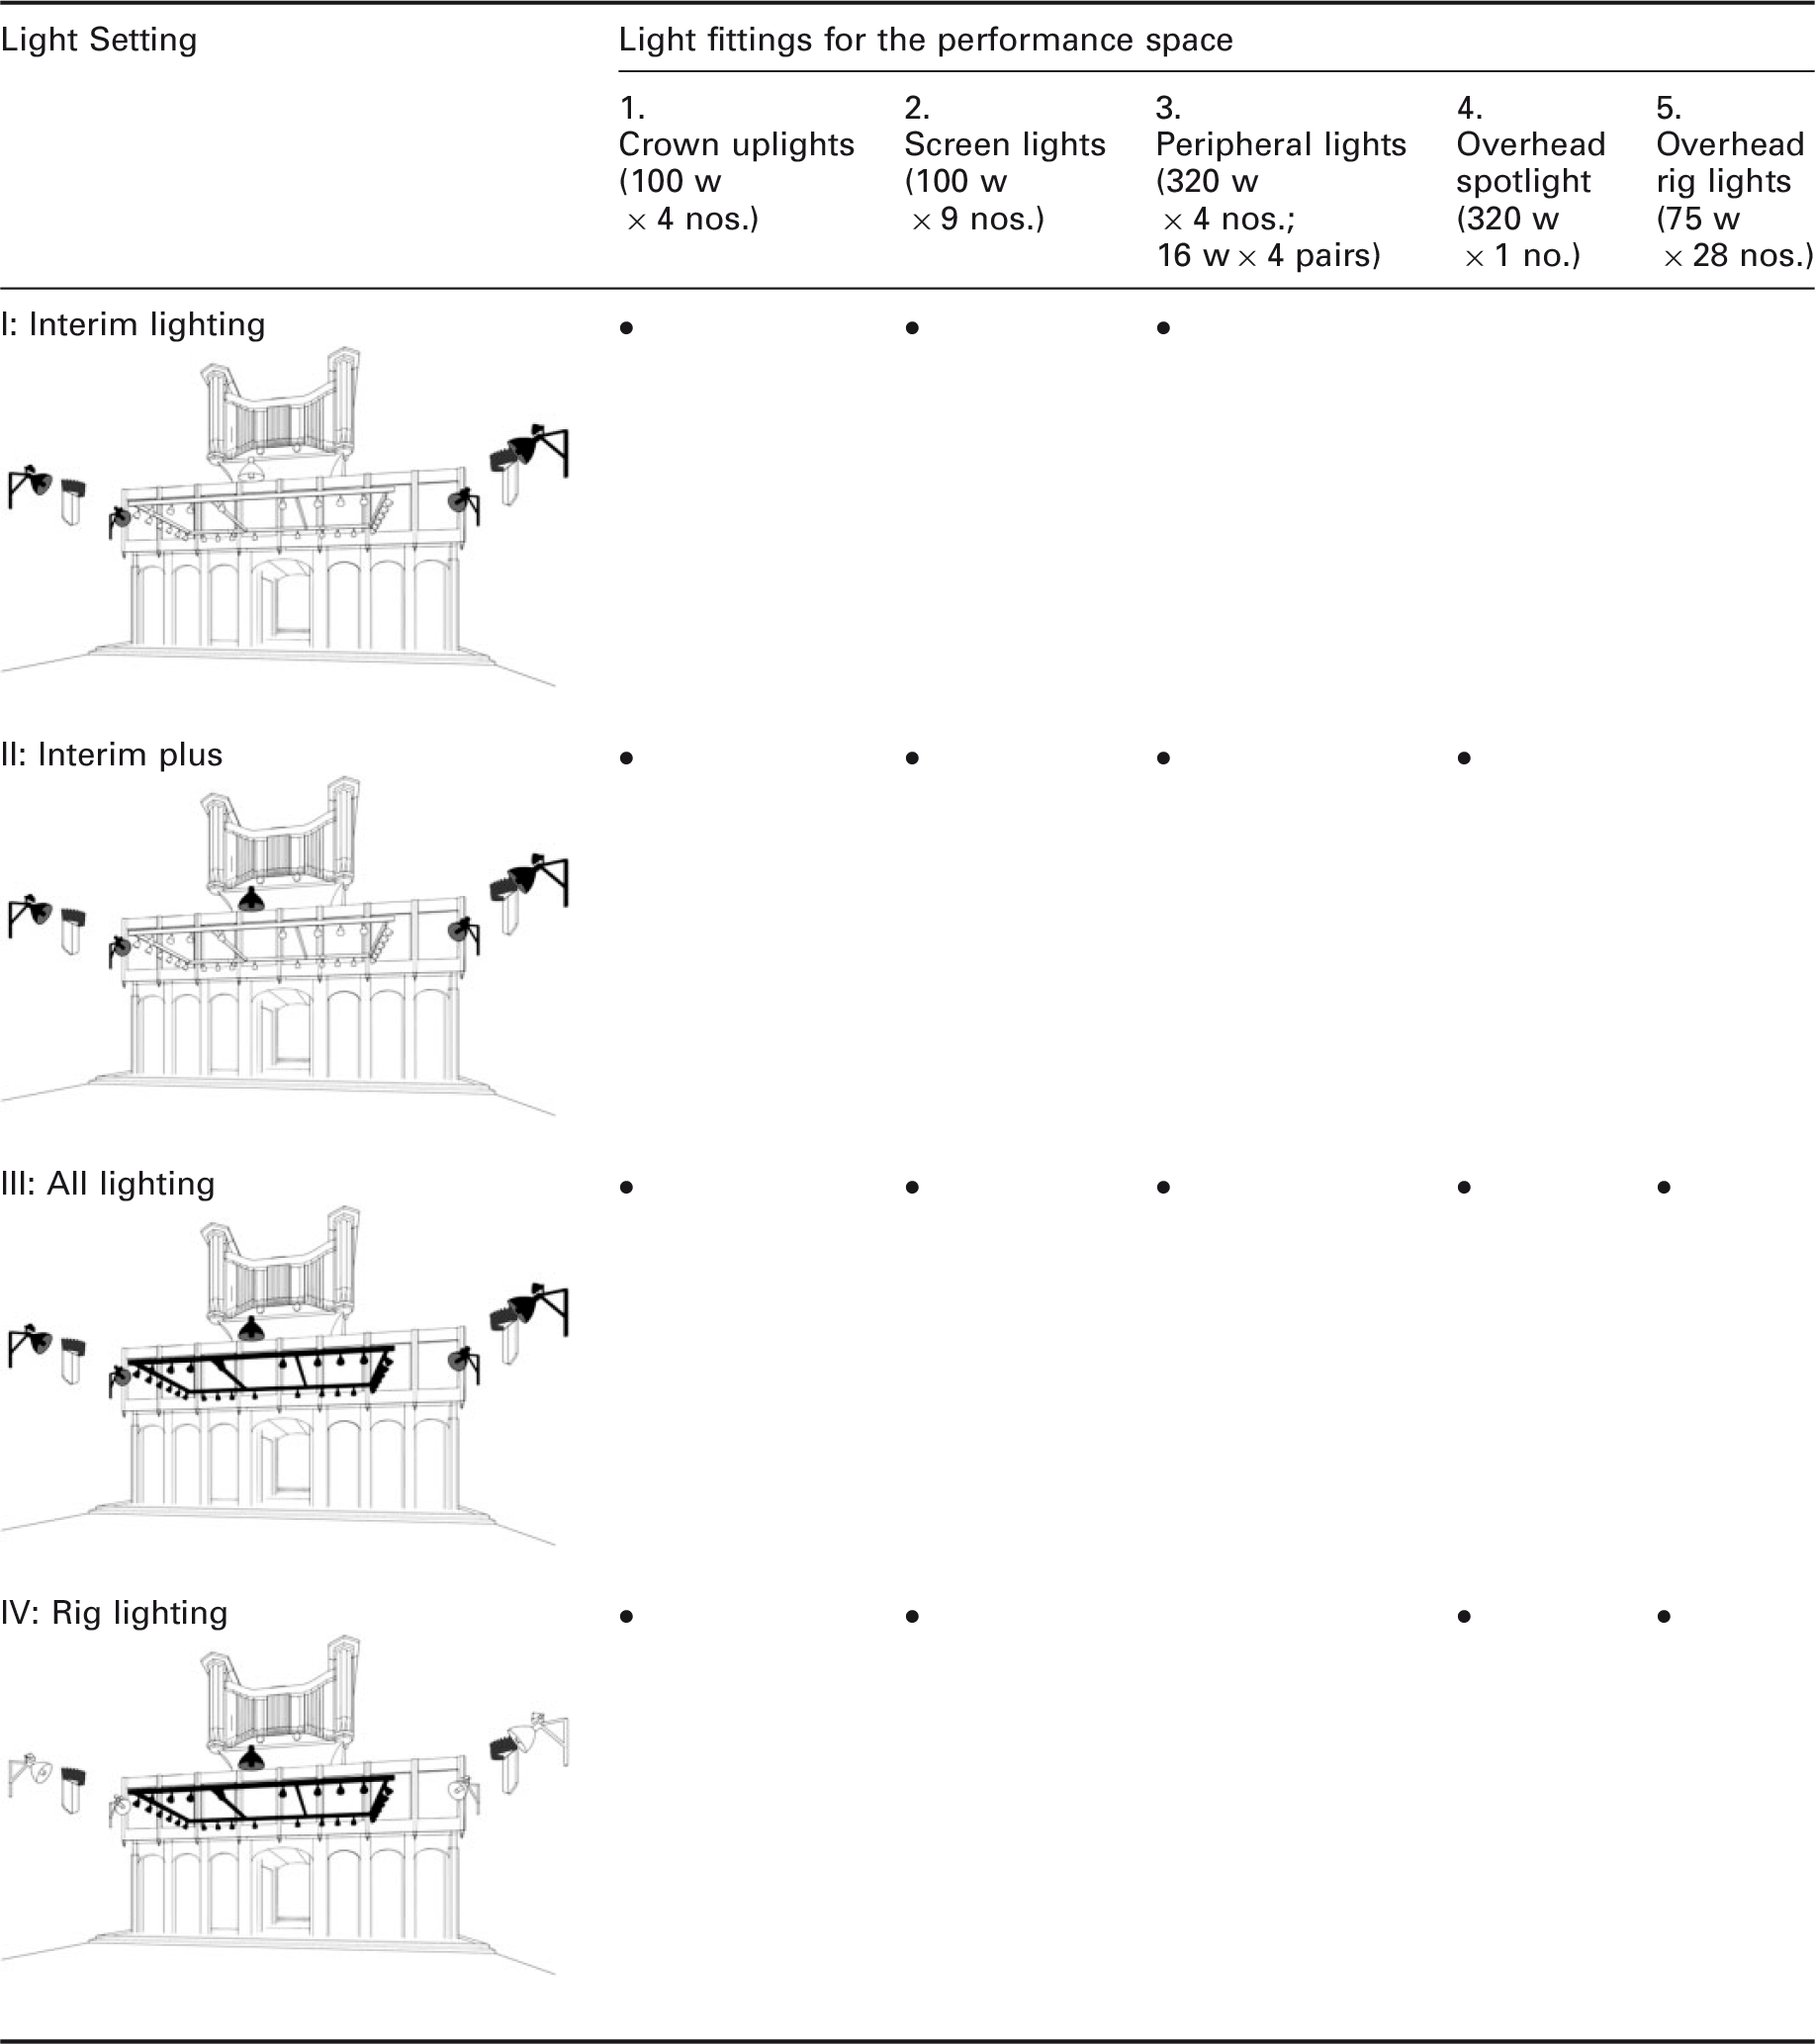
Four light settings: Setting I: Interim Lighting; Setting II: Interim Plus; Setting III: All Lighting; Setting IV: Rig Lighting (control setting) (Refer to the previous paper for full specification details 41 )
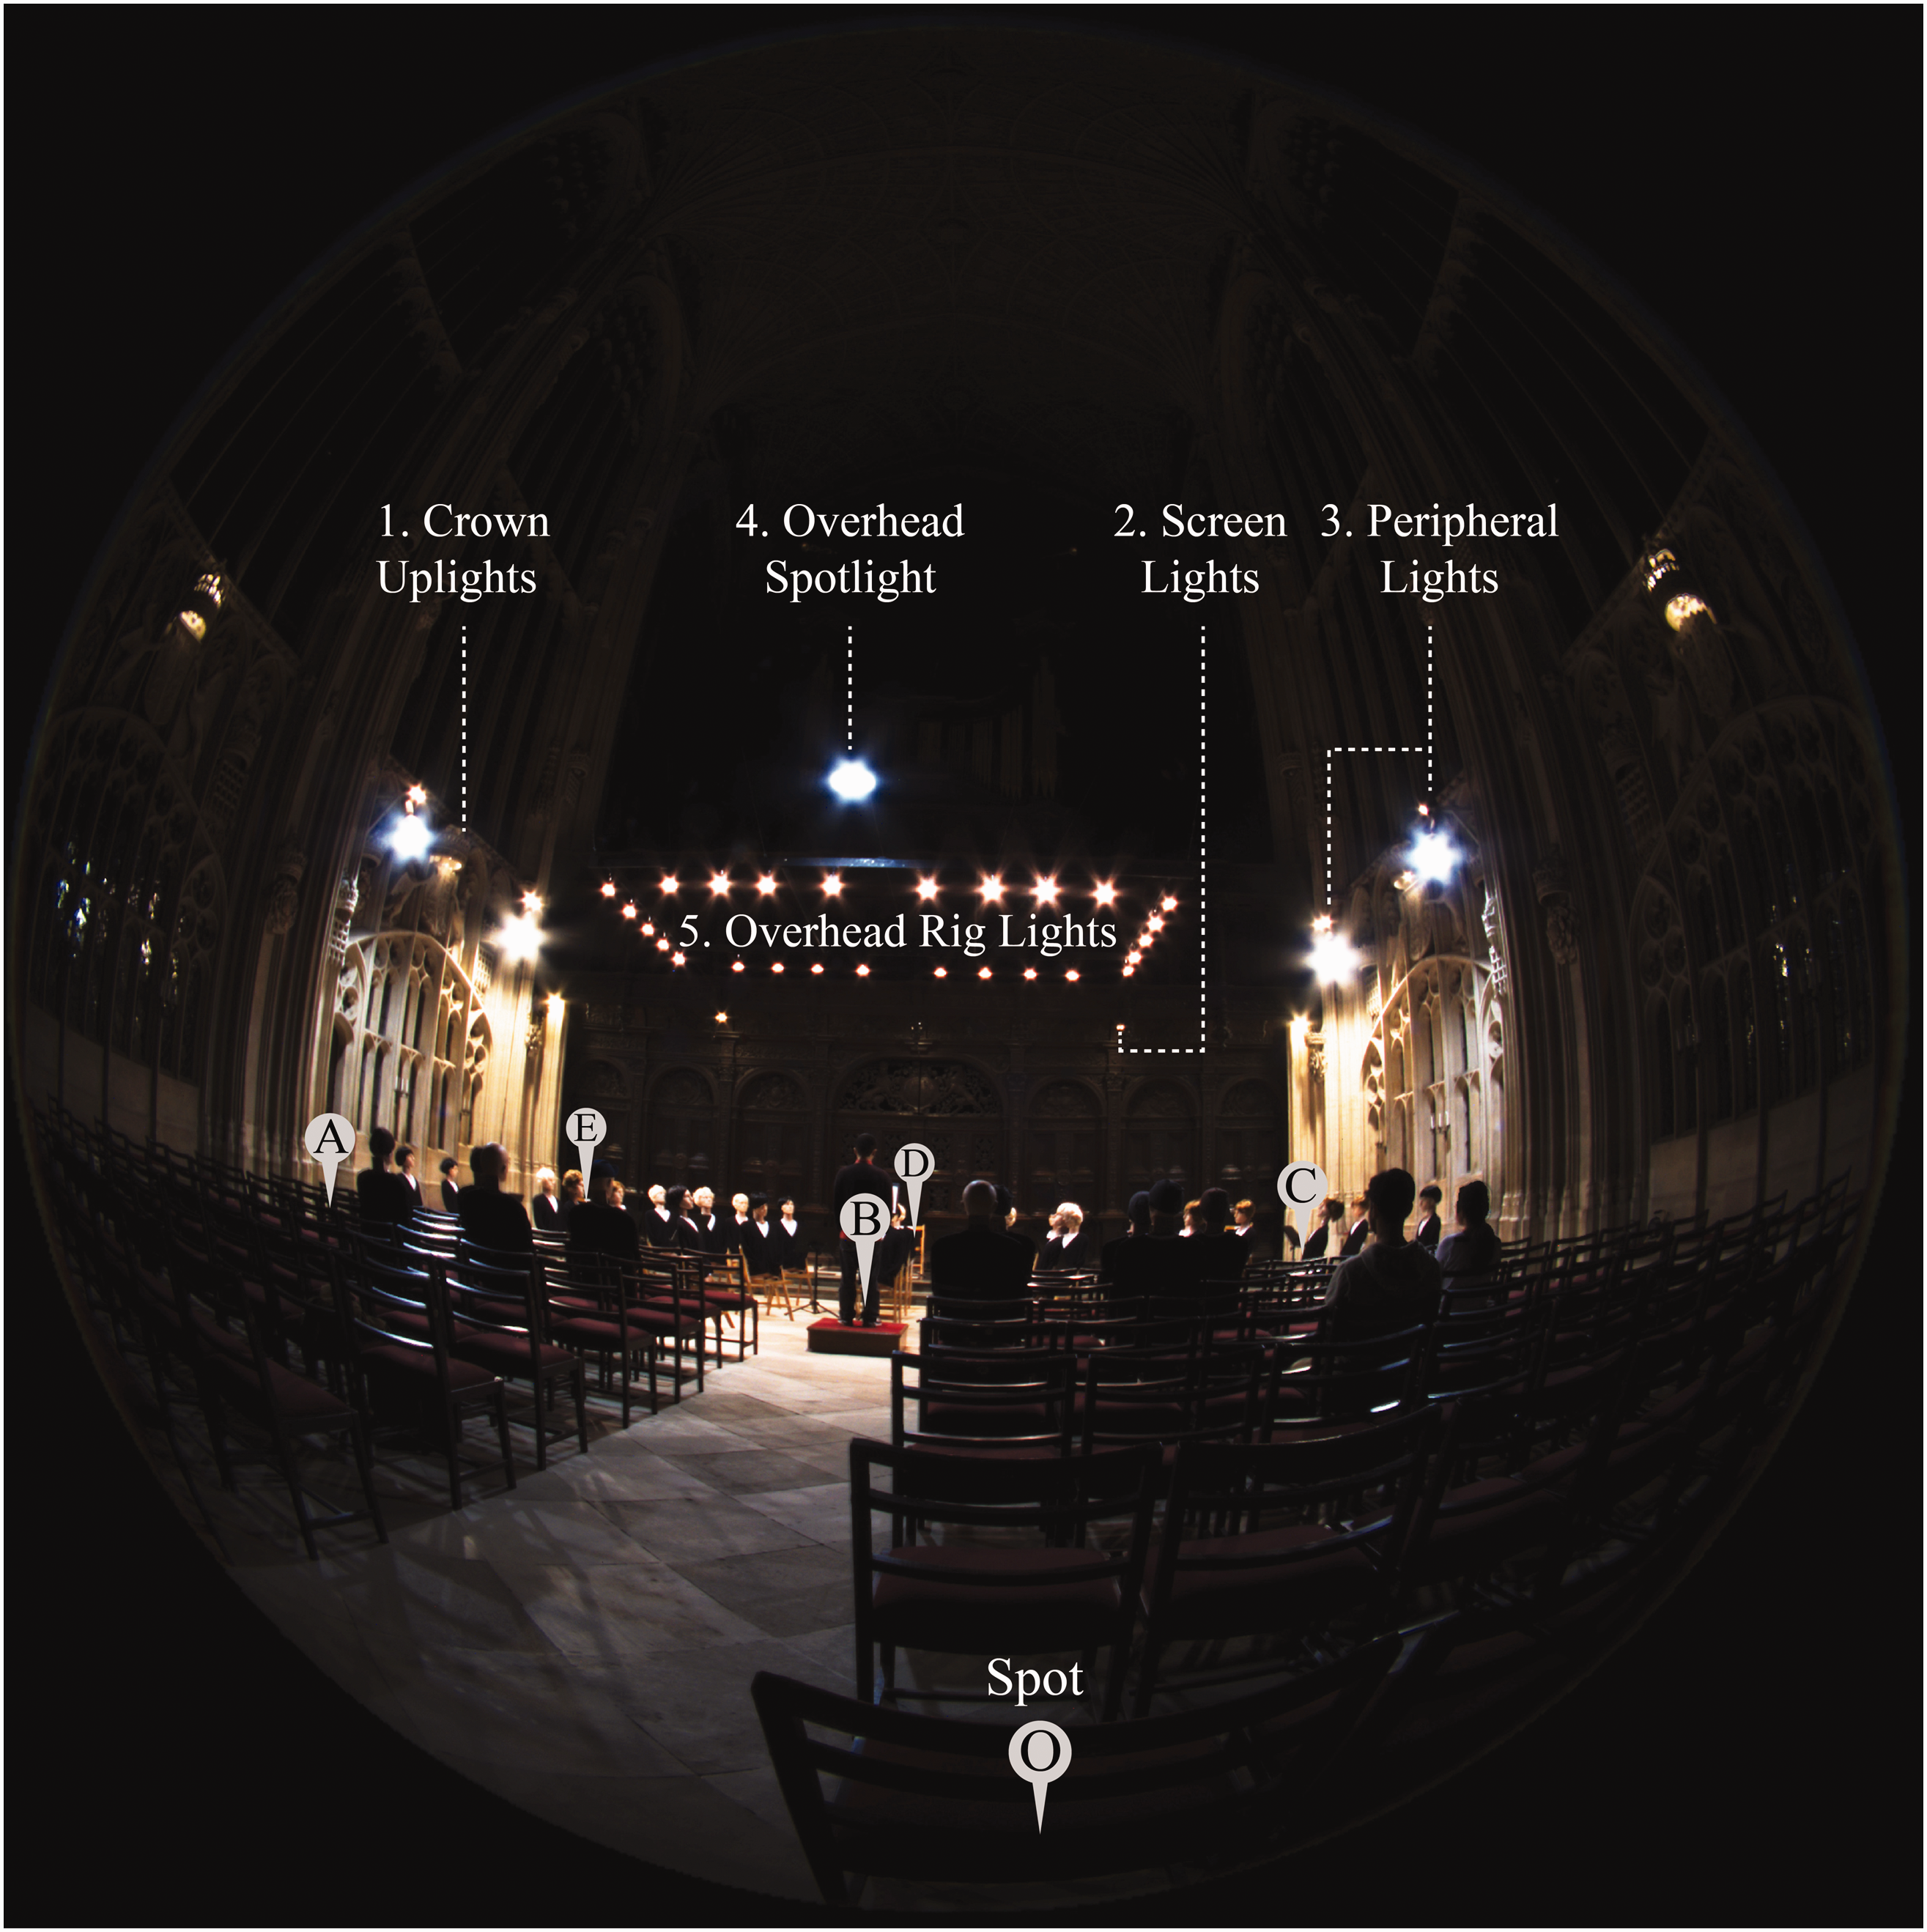
Experimental setting and the six viewing positions: Spot O: Audience member, back row; Spot A: Audience member, front row; Spot B: The conductor, at the centre of the performance space; Spot C: Musician, near to the side of the performance stage; Spot D: Musician, towards the rear of the performance stage; Spot E: Musician, in the far back corner of the performance stage
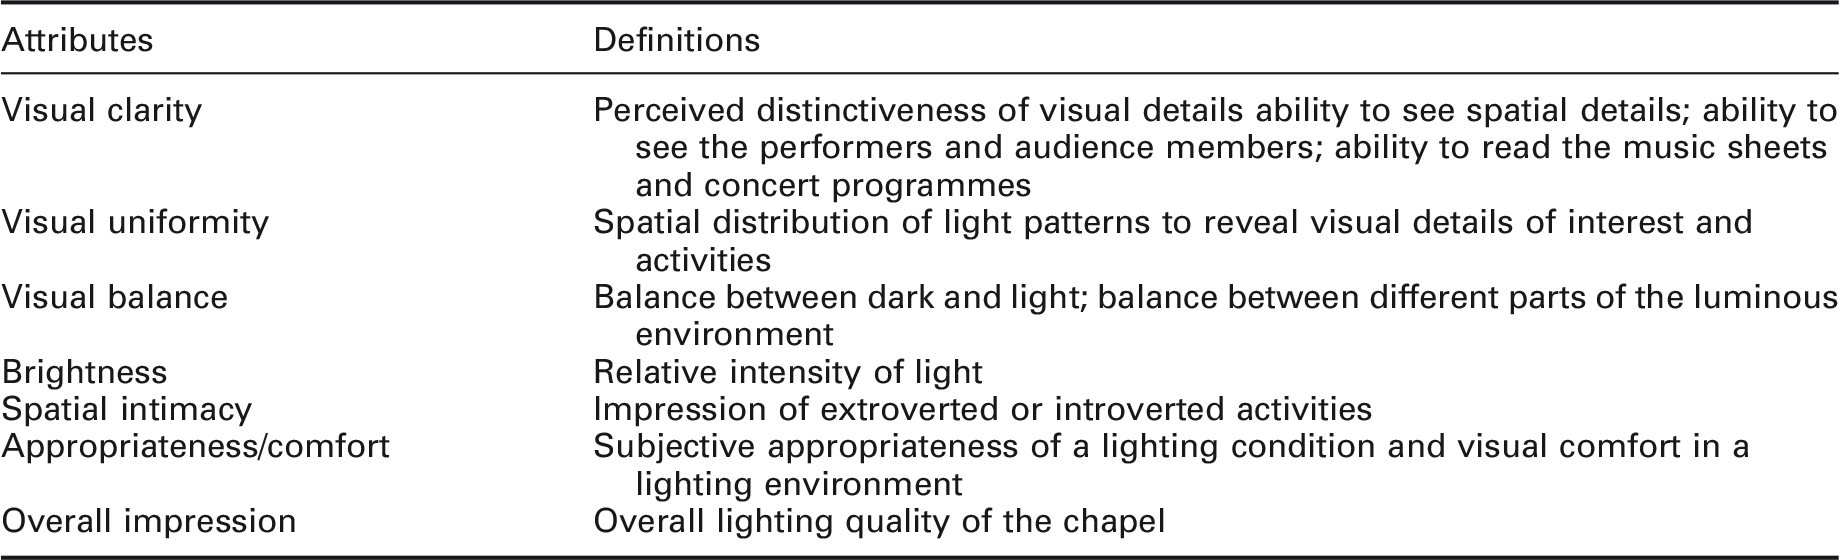
2.1.1 Subjective attributes
Definitions of the six subjective attributes are selected specifically for the study of concert lighting at the King’s College Chapel (partially published in a previous paper 41 )
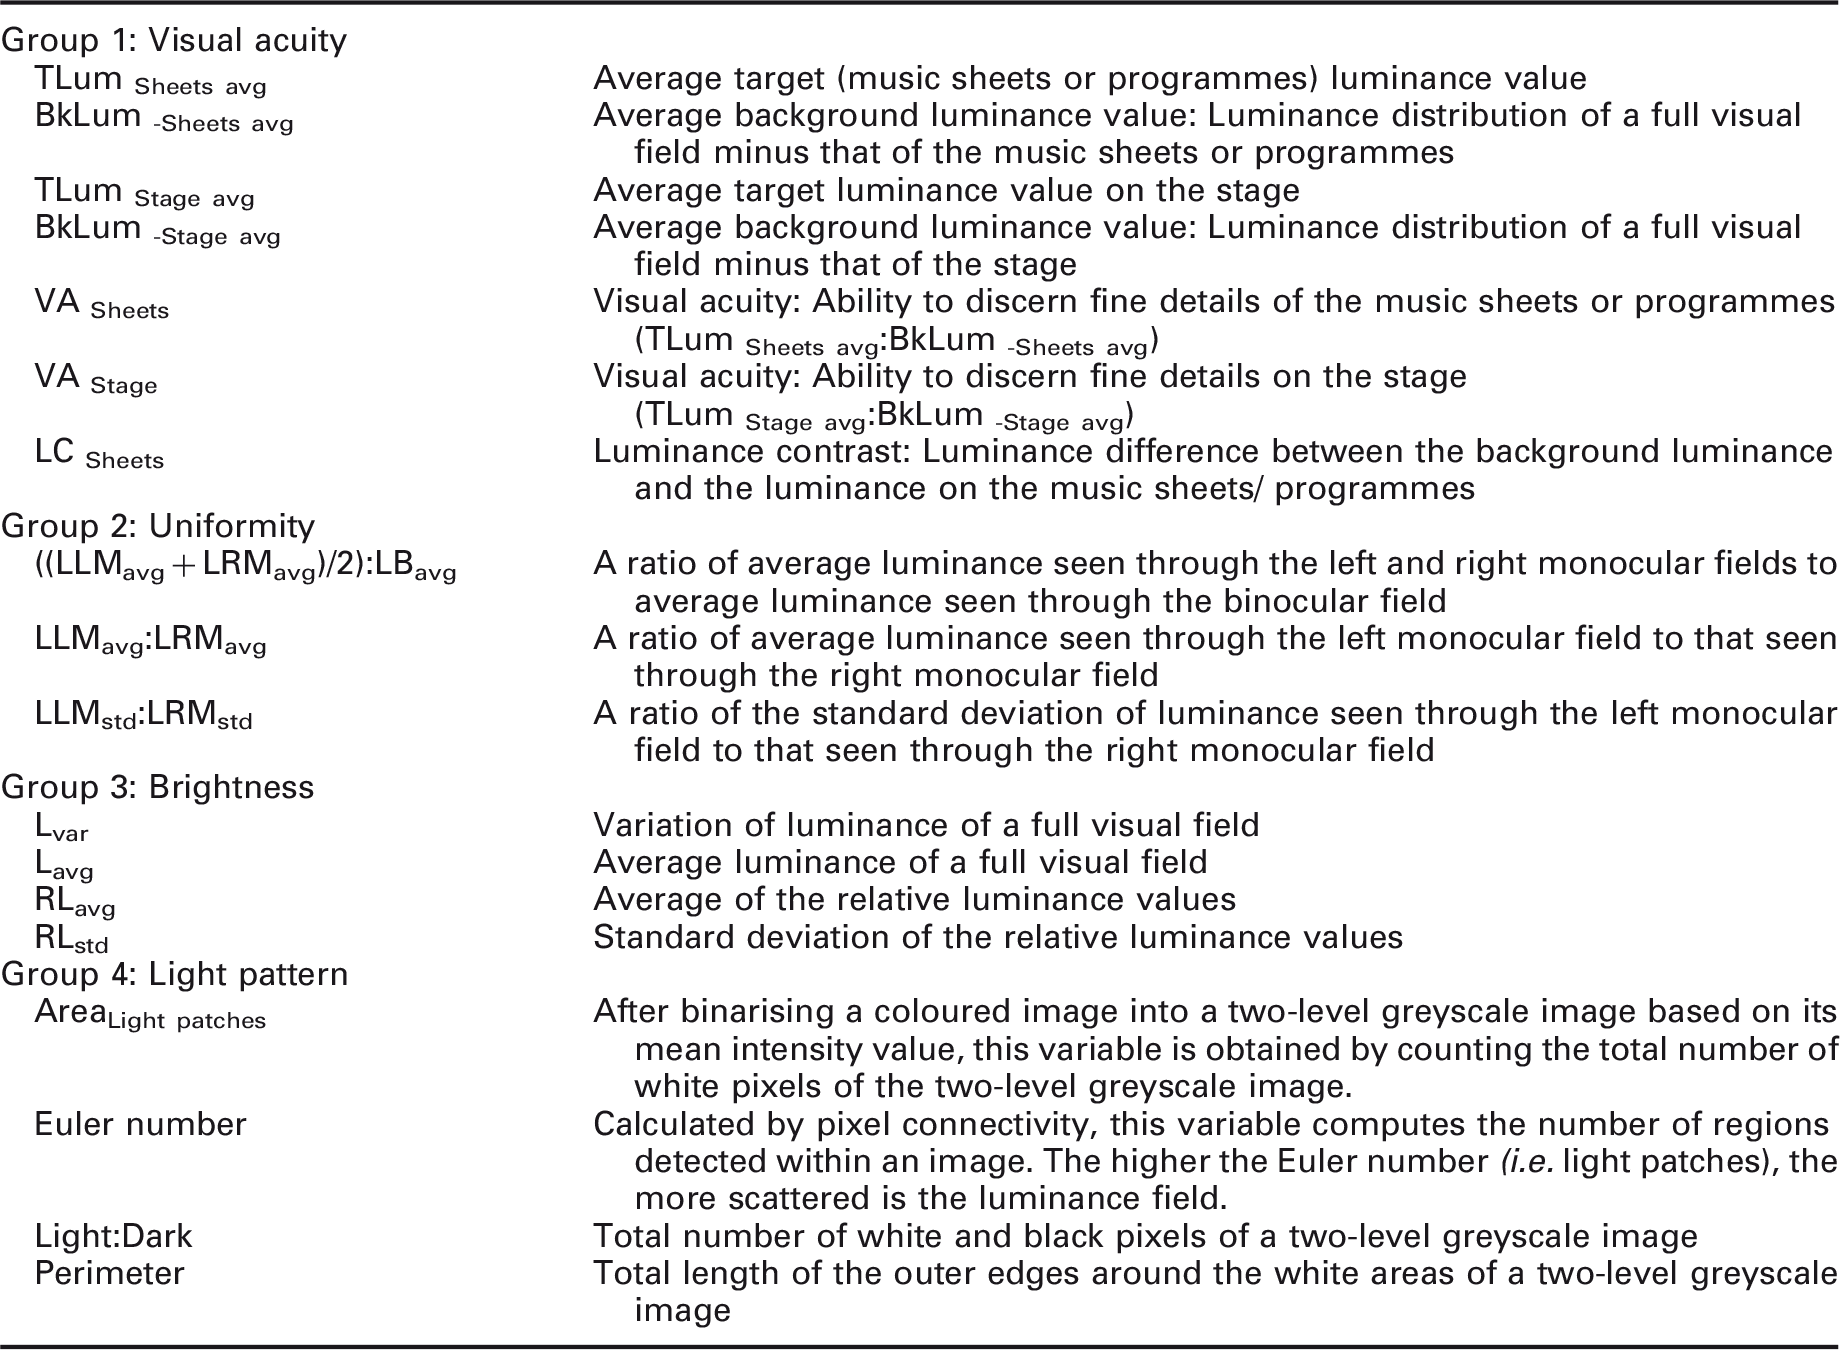
2.1.2 Objective measures
Definitions of the objective measures selected (Originally published in a previous paper 41 )
2.2 Analytical methods
Collinearity thresholds applied in published building studies
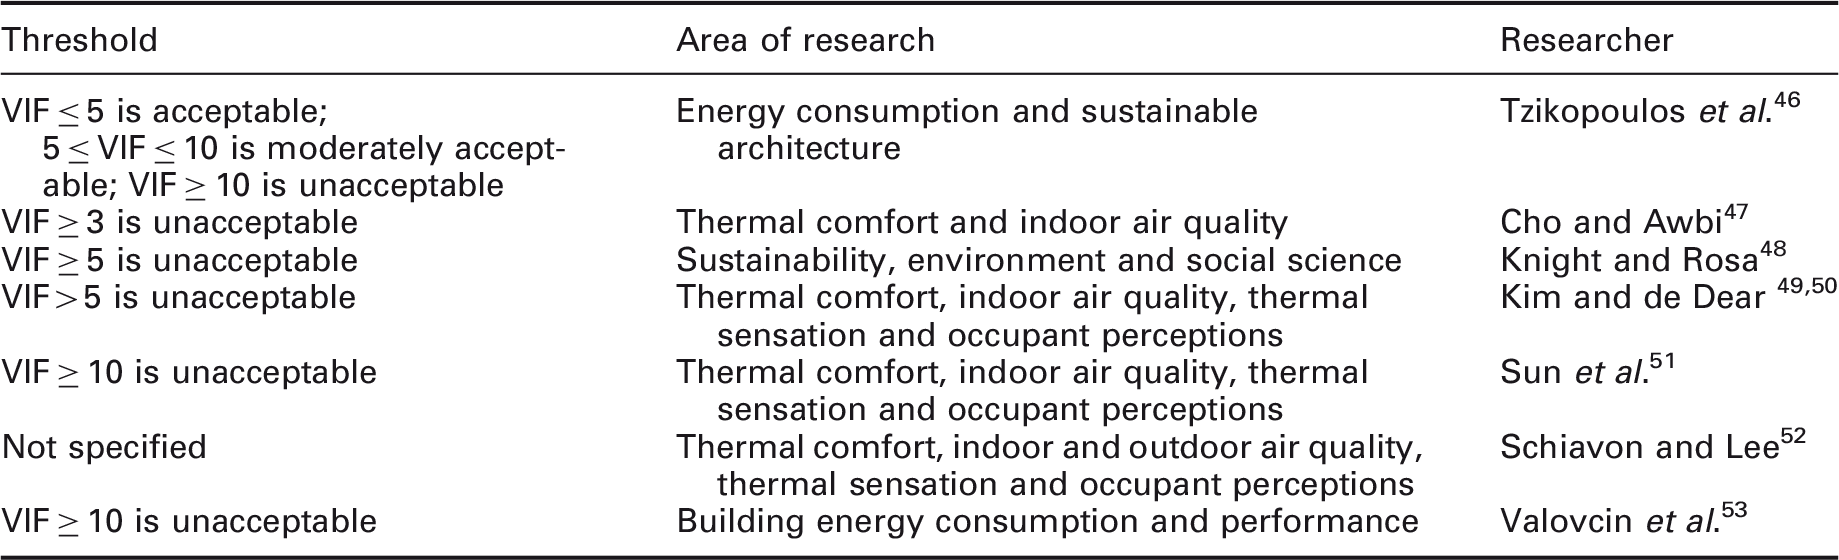
Ranging from 1.00 to infinity, a smaller value of VIF indicates that the variables studied are less prone to collinearity. It was anticipated that there would be strong collinearity between the explanatory variables, especially in the case of the overall analysis where data and responses were pooled regardless of the occupant’s role, as the model fit would become more sensitive due to the greater variability among the data. This would make it difficult to optimise the fit between the measured and predicted responses to produce meaningful results. A more lenient threshold of 10 was therefore set for the collinearity tests, followed by an iterative ordered logistic regression analysis to establish relationships between predictors and outcome variables for the development of an integrated approach. The settings were then compared by organising them into three contrast groups based on their similarities, aiming to pinpoint which group exhibited the largest difference in mean responses.
3. Results and discussions
3.1 The presence of collinearity
Objective measures selected by role for subjective attributes
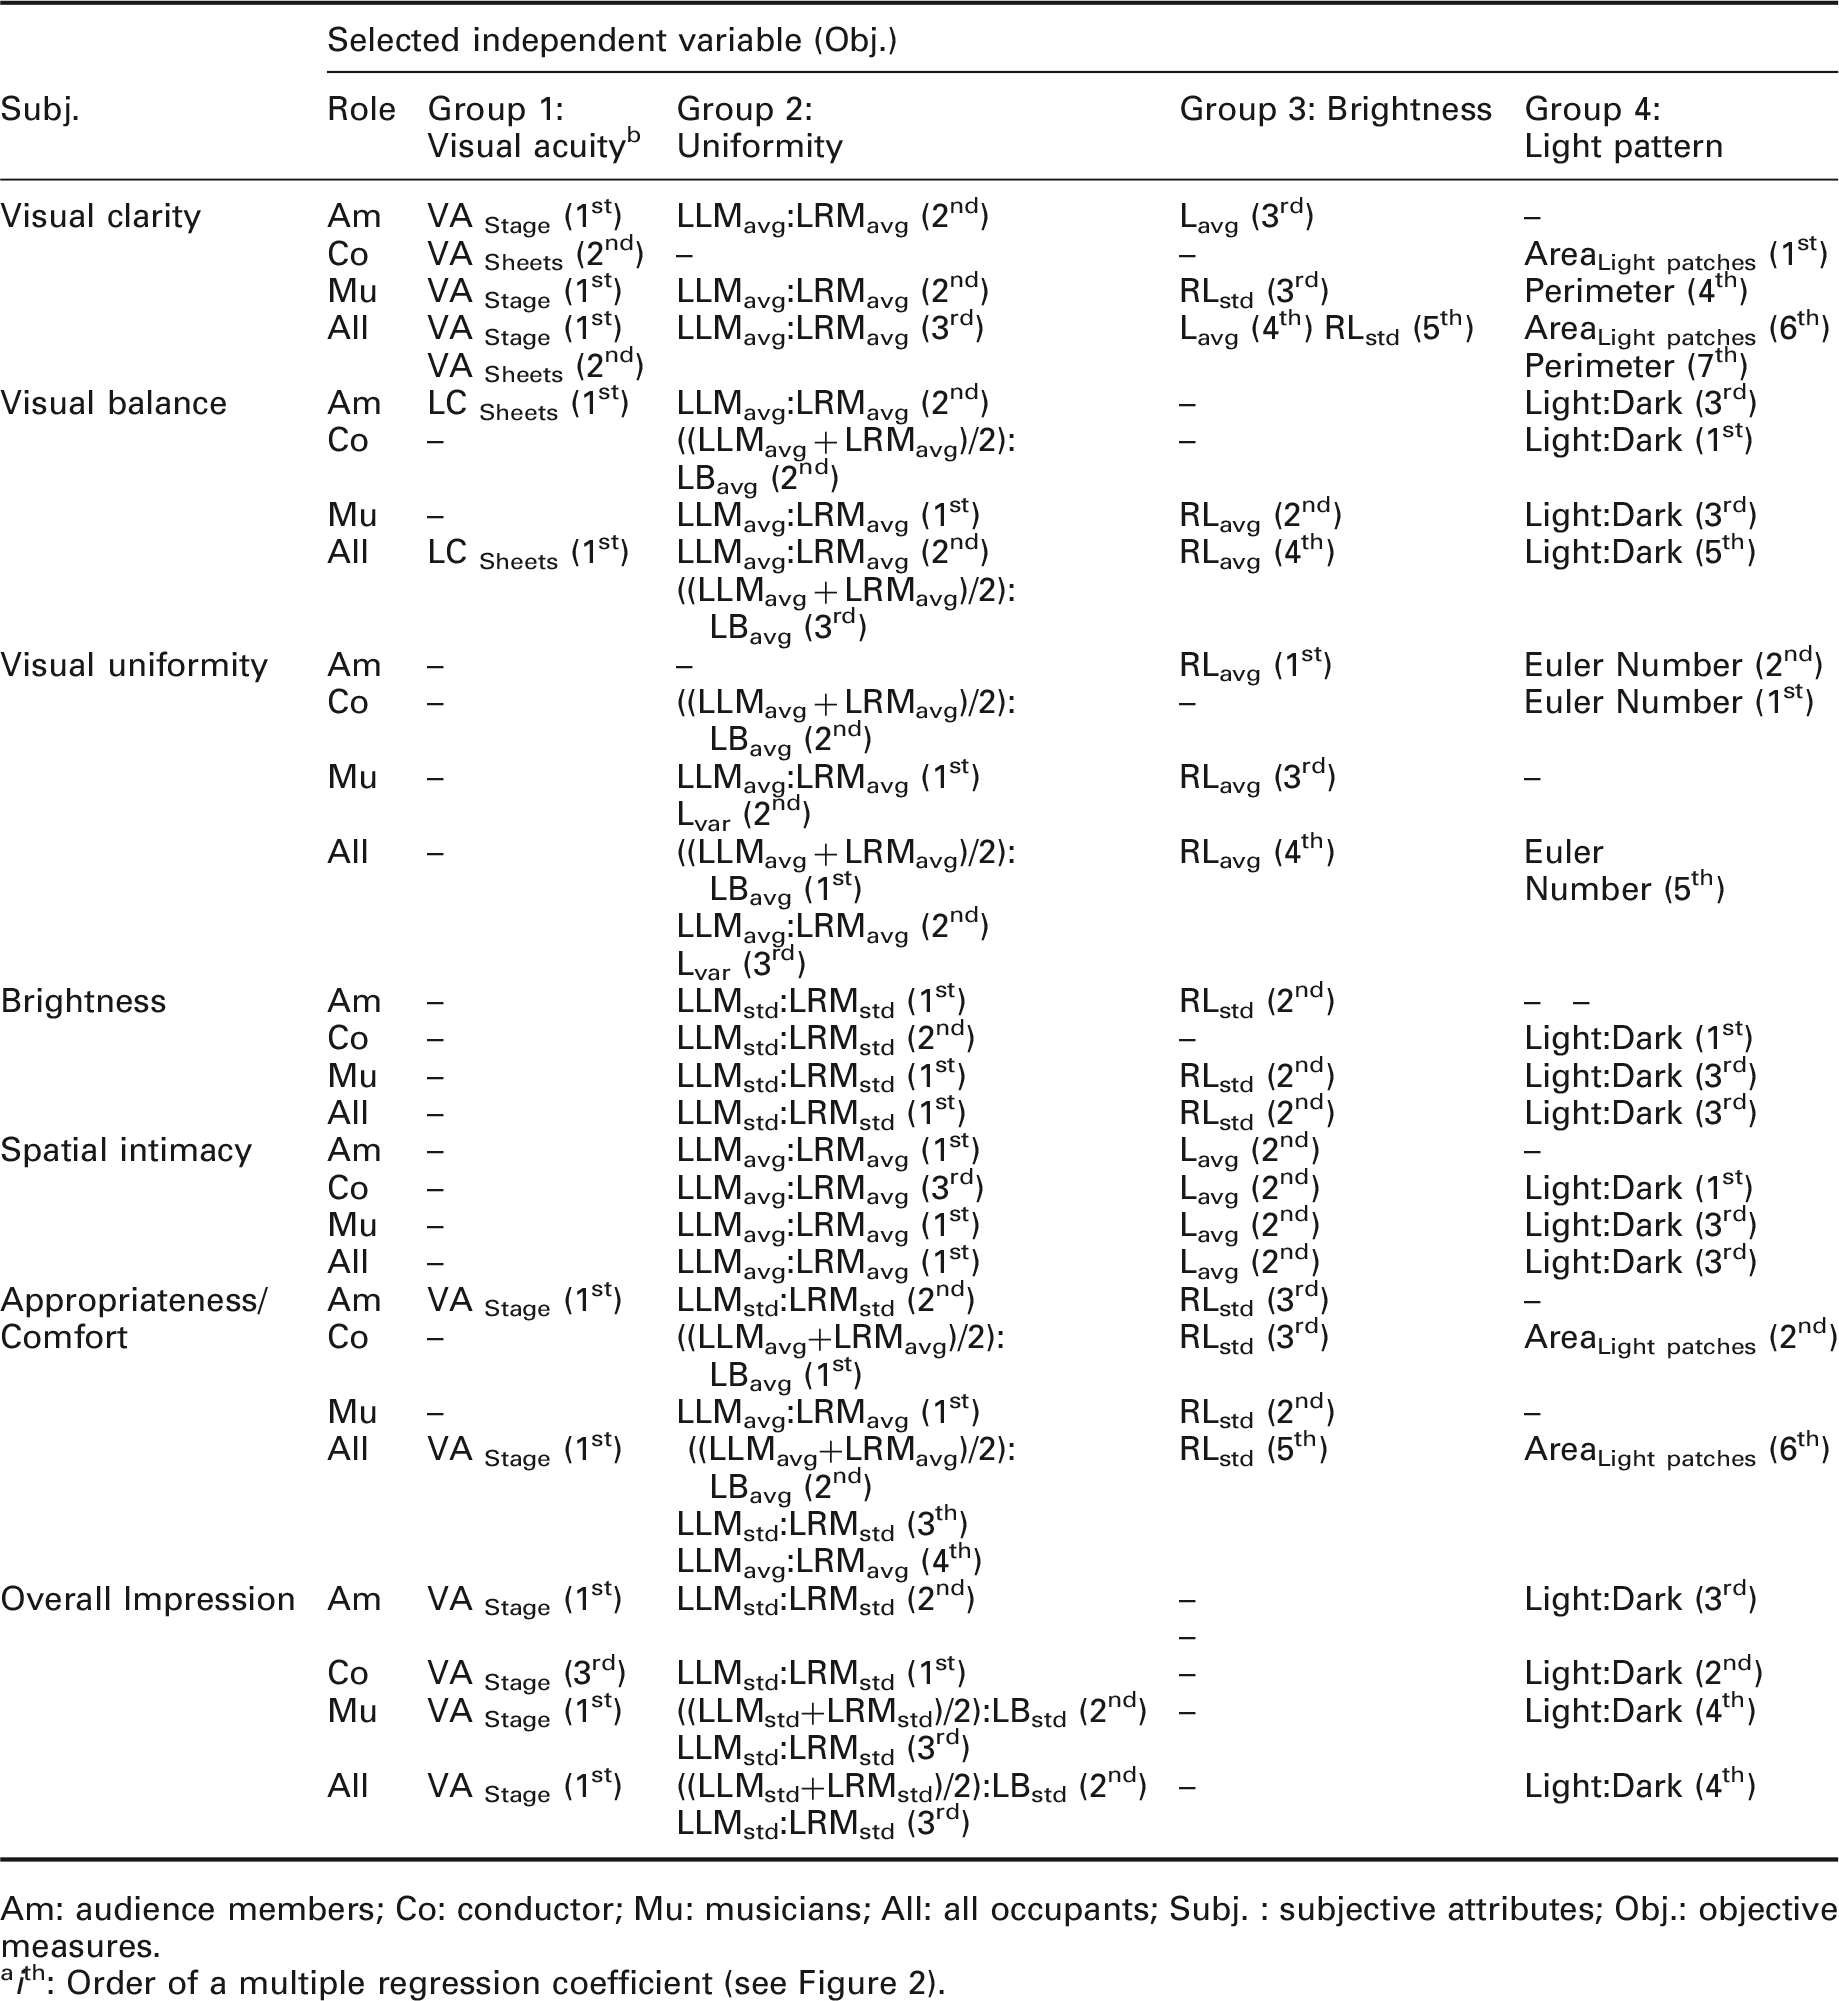
Am: audience members; Co: conductor; Mu: musicians; All: all occupants; Subj. : subjective attributes; Obj.: objective measures.
aith: Order of a multiple regression coefficient (see Figure 2).
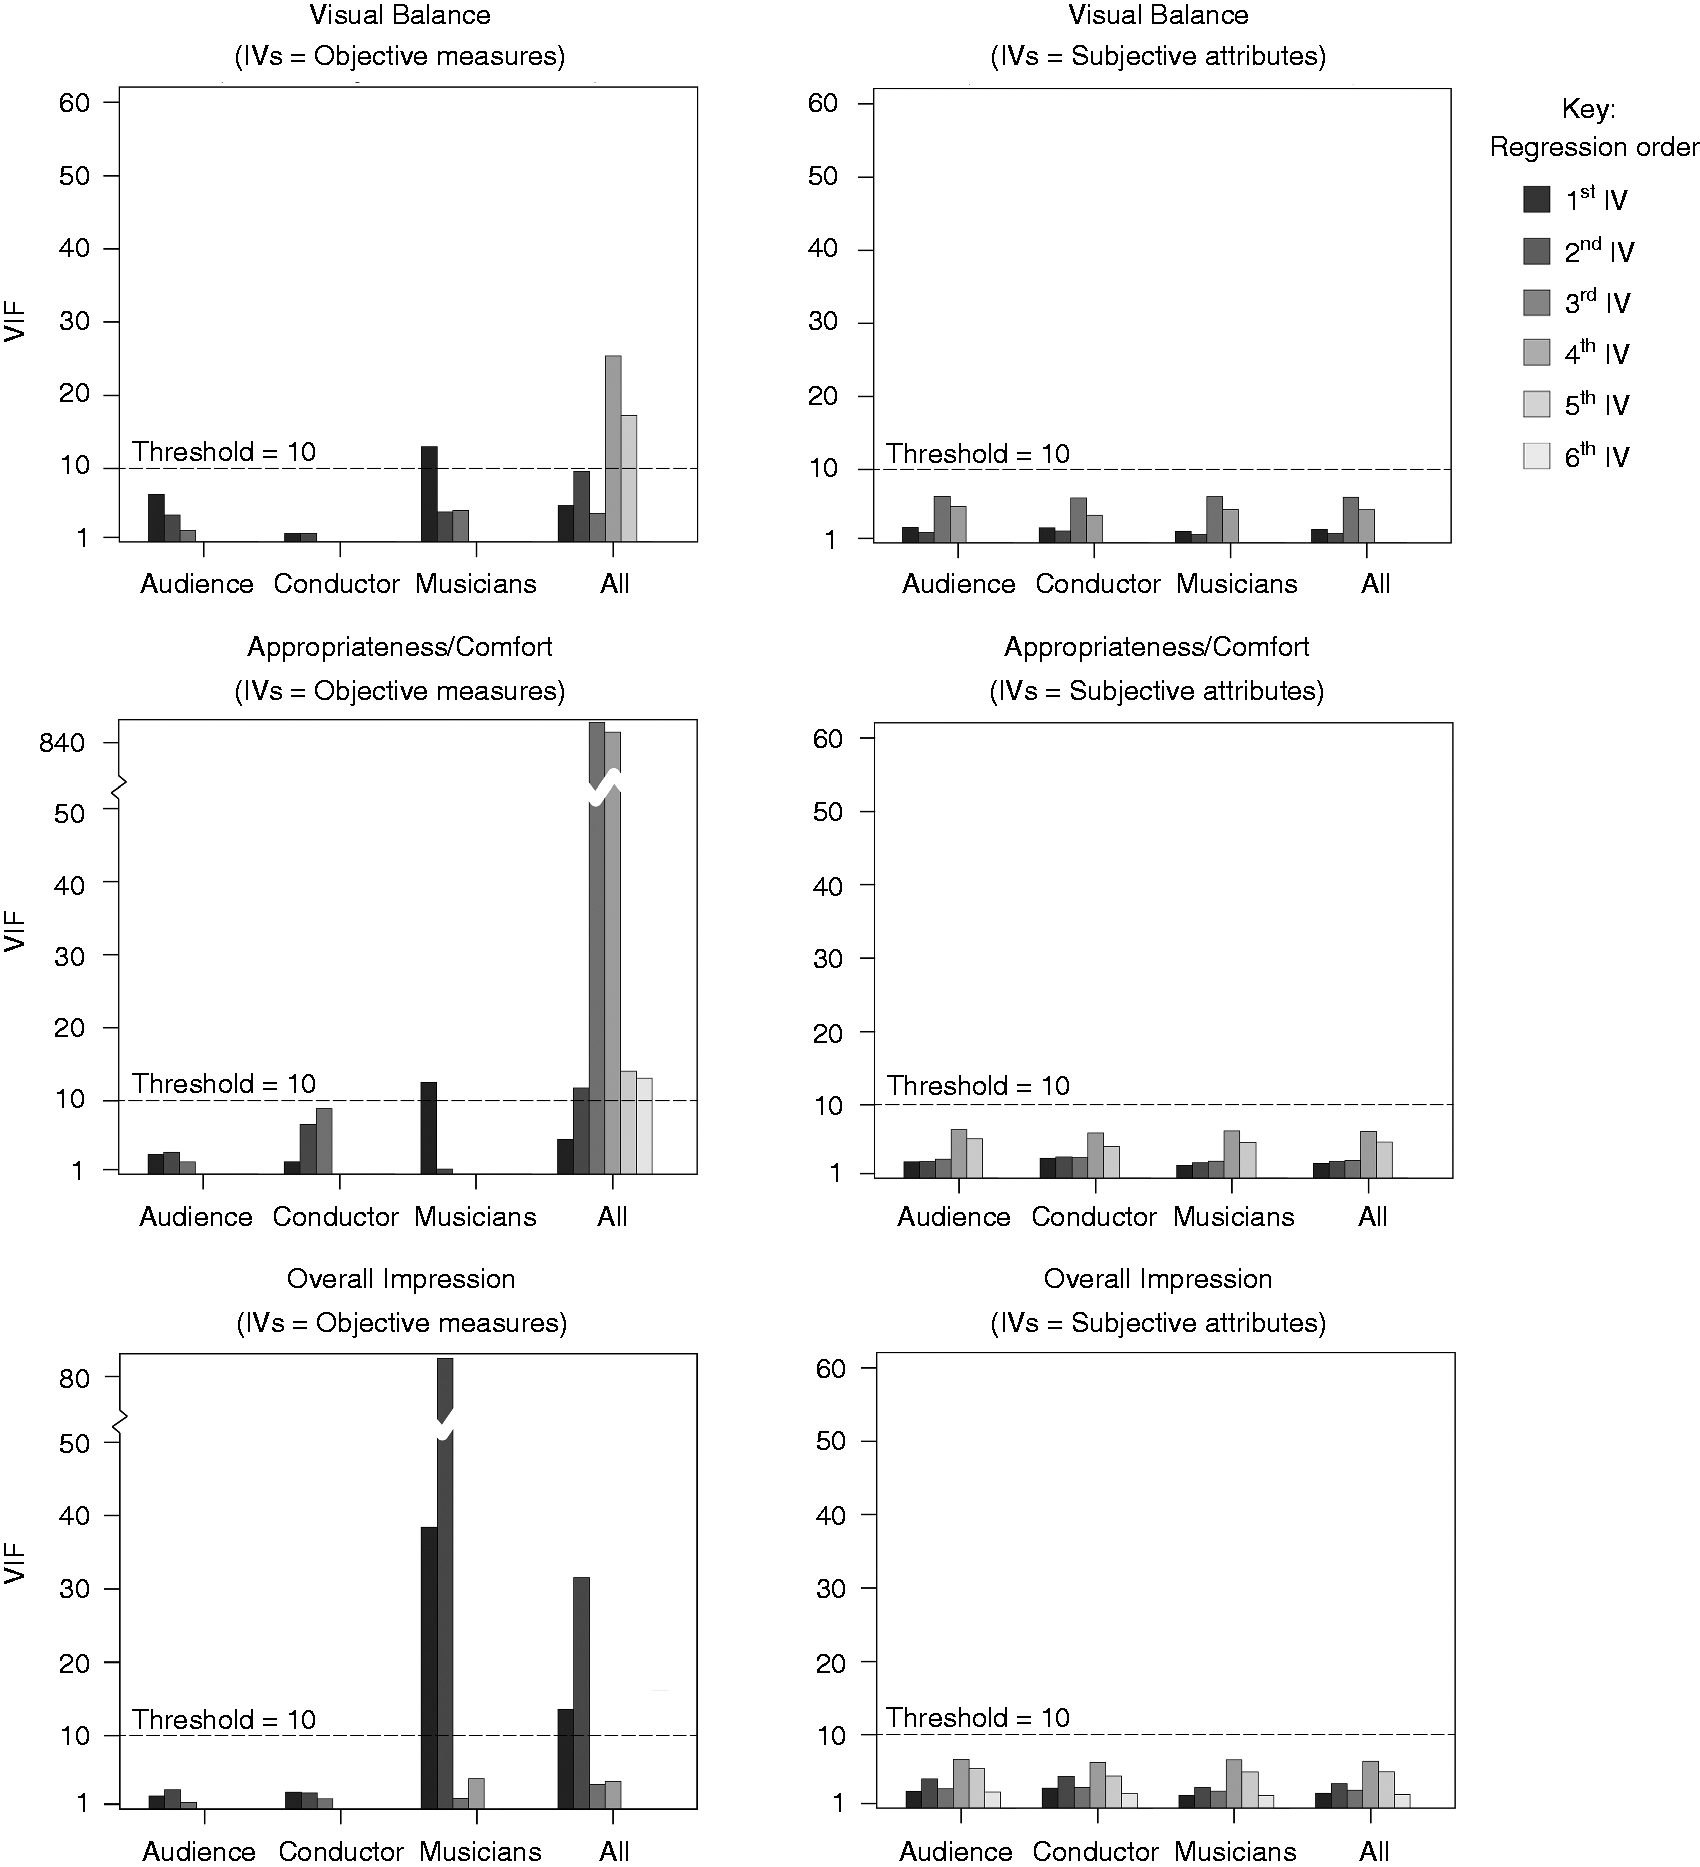
The cases involving more than one variable from the same group were visual uniformity and overall impression for the musicians, and visual clarity, visual balance, visual uniformity, appropriateness/comfort and overall impression for the overall analysis (i.e. all occupants model). As might be expected, increasing the number of explanatory variables increased the likelihood of collinearity as a result of the overlapping nature of the variables (Figure 2). The audience members (VIFavg = 2.52) and the conductor (VIFavg = 2.47) models all had VIFs well below the threshold value; meanwhile, the musicians models had VIFs just below the threshold (VIFavg = 9.29). The issue of collinearity was the most severe in the overall analysis (i.e. all occupants) (VIFavg = 49.90). The largest VIF was found for appropriateness/comfort, where the VIFs for the third (LLMstd:LRMstd) and fourth variables (LLMavg:LRMavg) were 845.42 and 826.91, respectively, which is unsurprising given those variables belong to the same group and have similar constructs. The former was calculated from the standard deviation of the luminance levels; the latter was from the average luminance levels. Because lighting requirements vary from role to role, it was determined that none of these variables could be excluded in order to minimise the risk of omitting important explanatory terms.
Variance inflation factors of the objective measures by occupant’s role. The regression order of an independent variable is indicated by the greyscale bar. (Refer to Table 6 for the corresponding measures; IV: independent variable)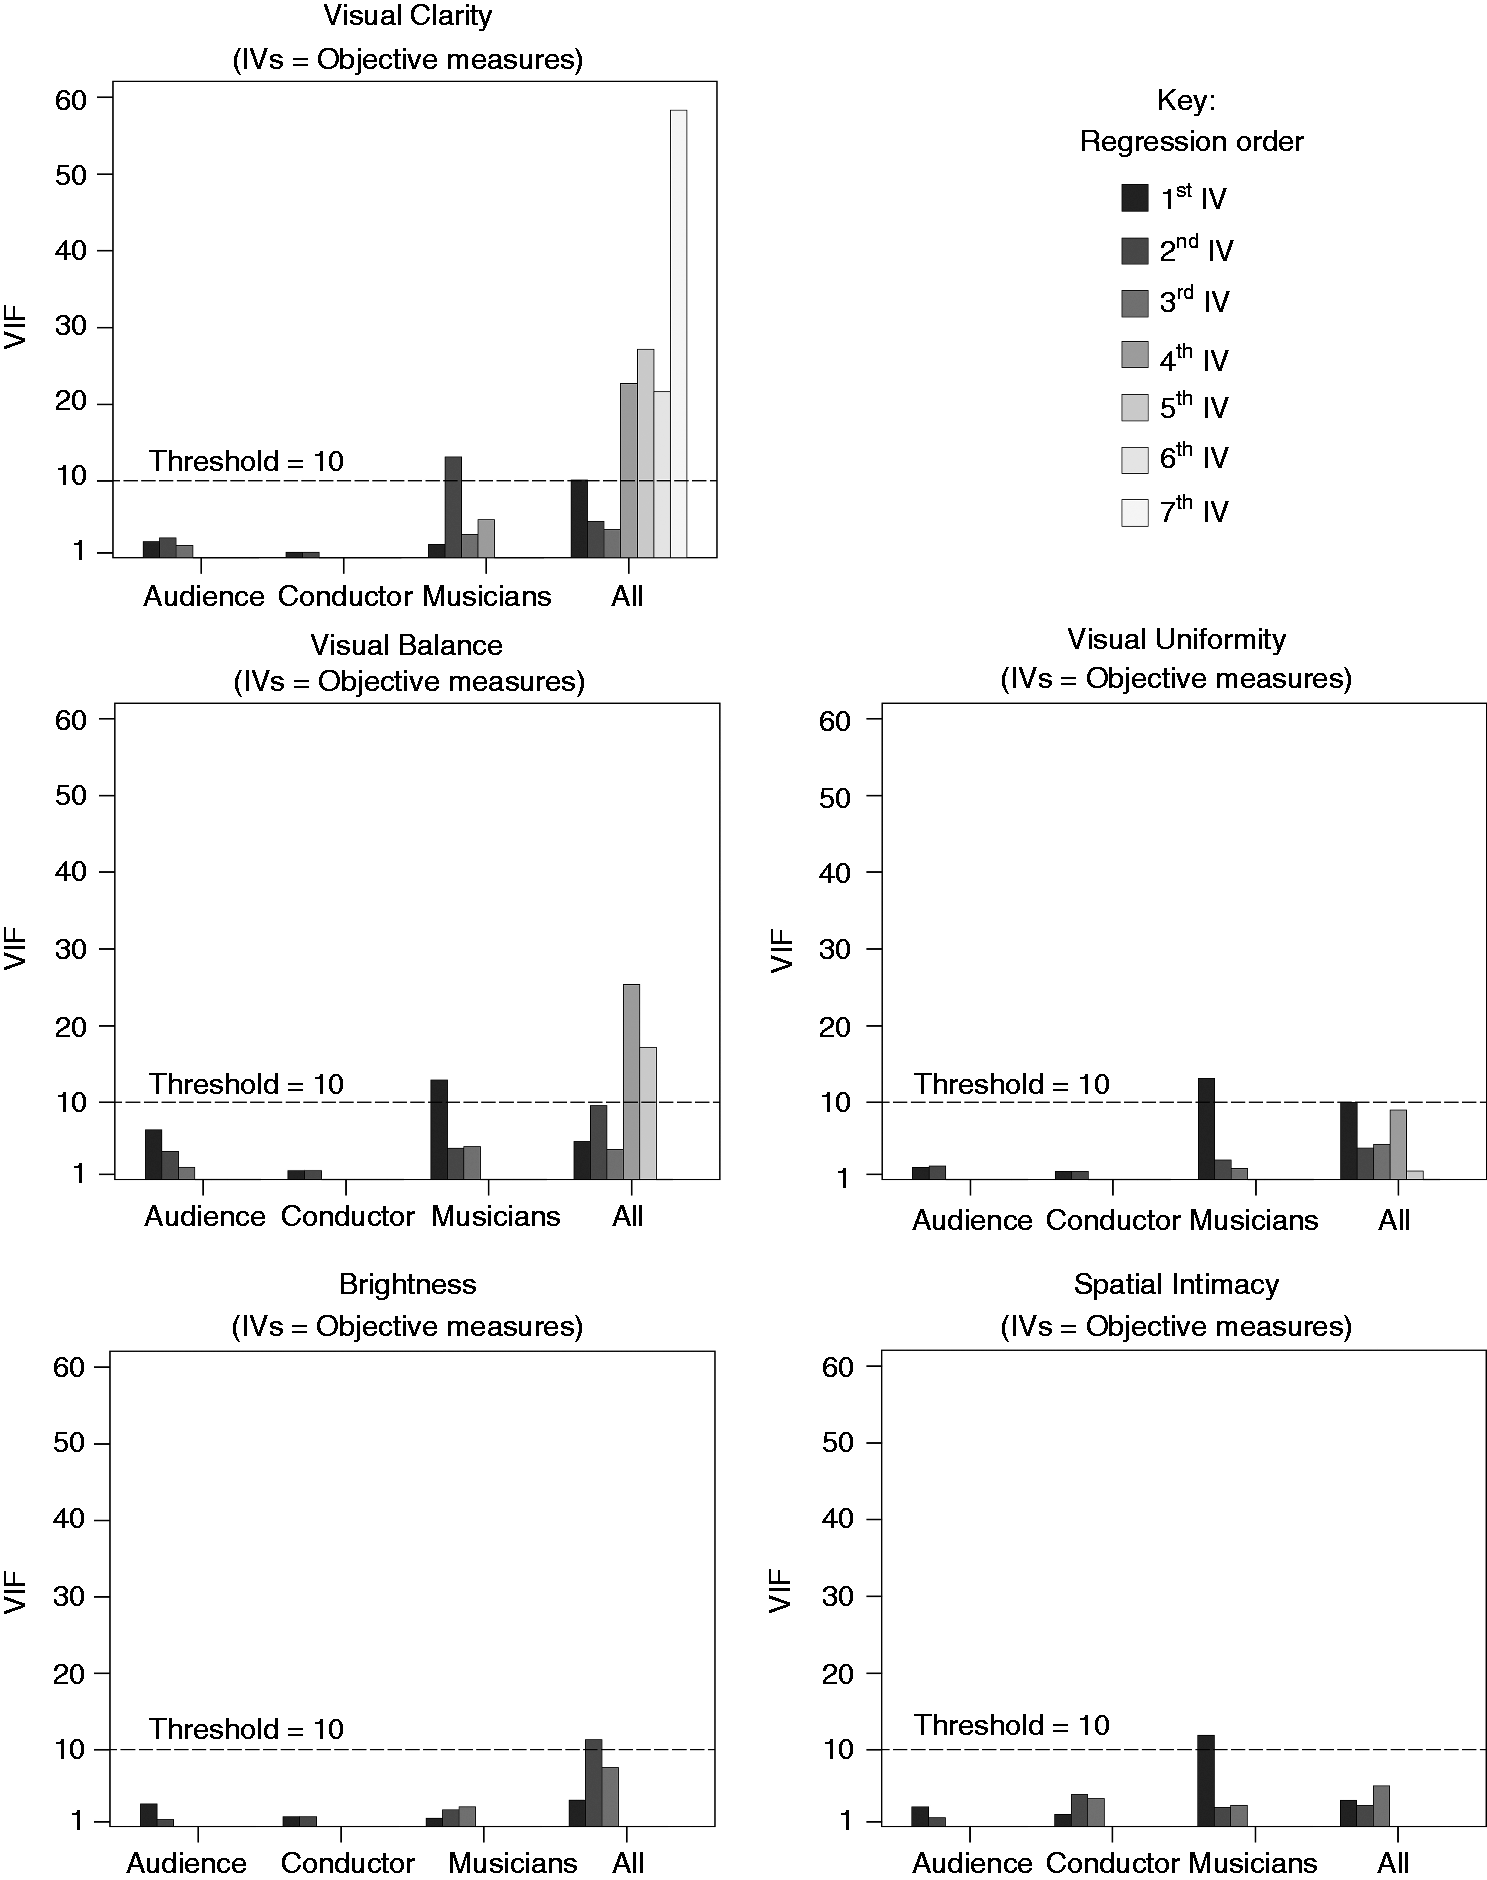
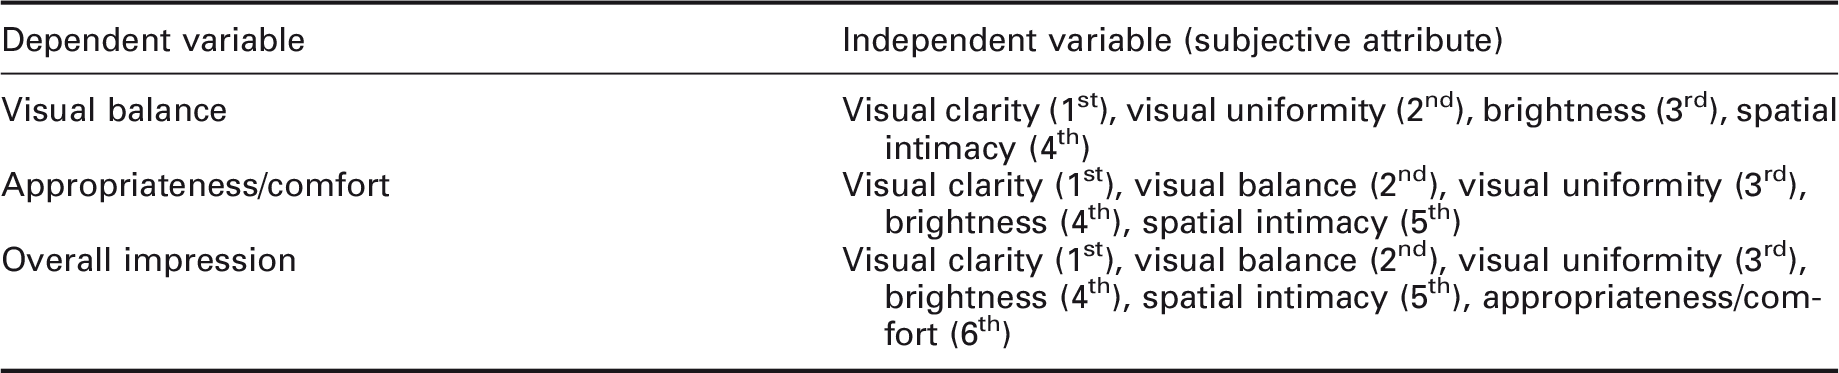
Subjective attributes used as the independent variables predicting visual balance, appropriateness/comfort and overall impression in the supplementary analyses
3.2 Model validation
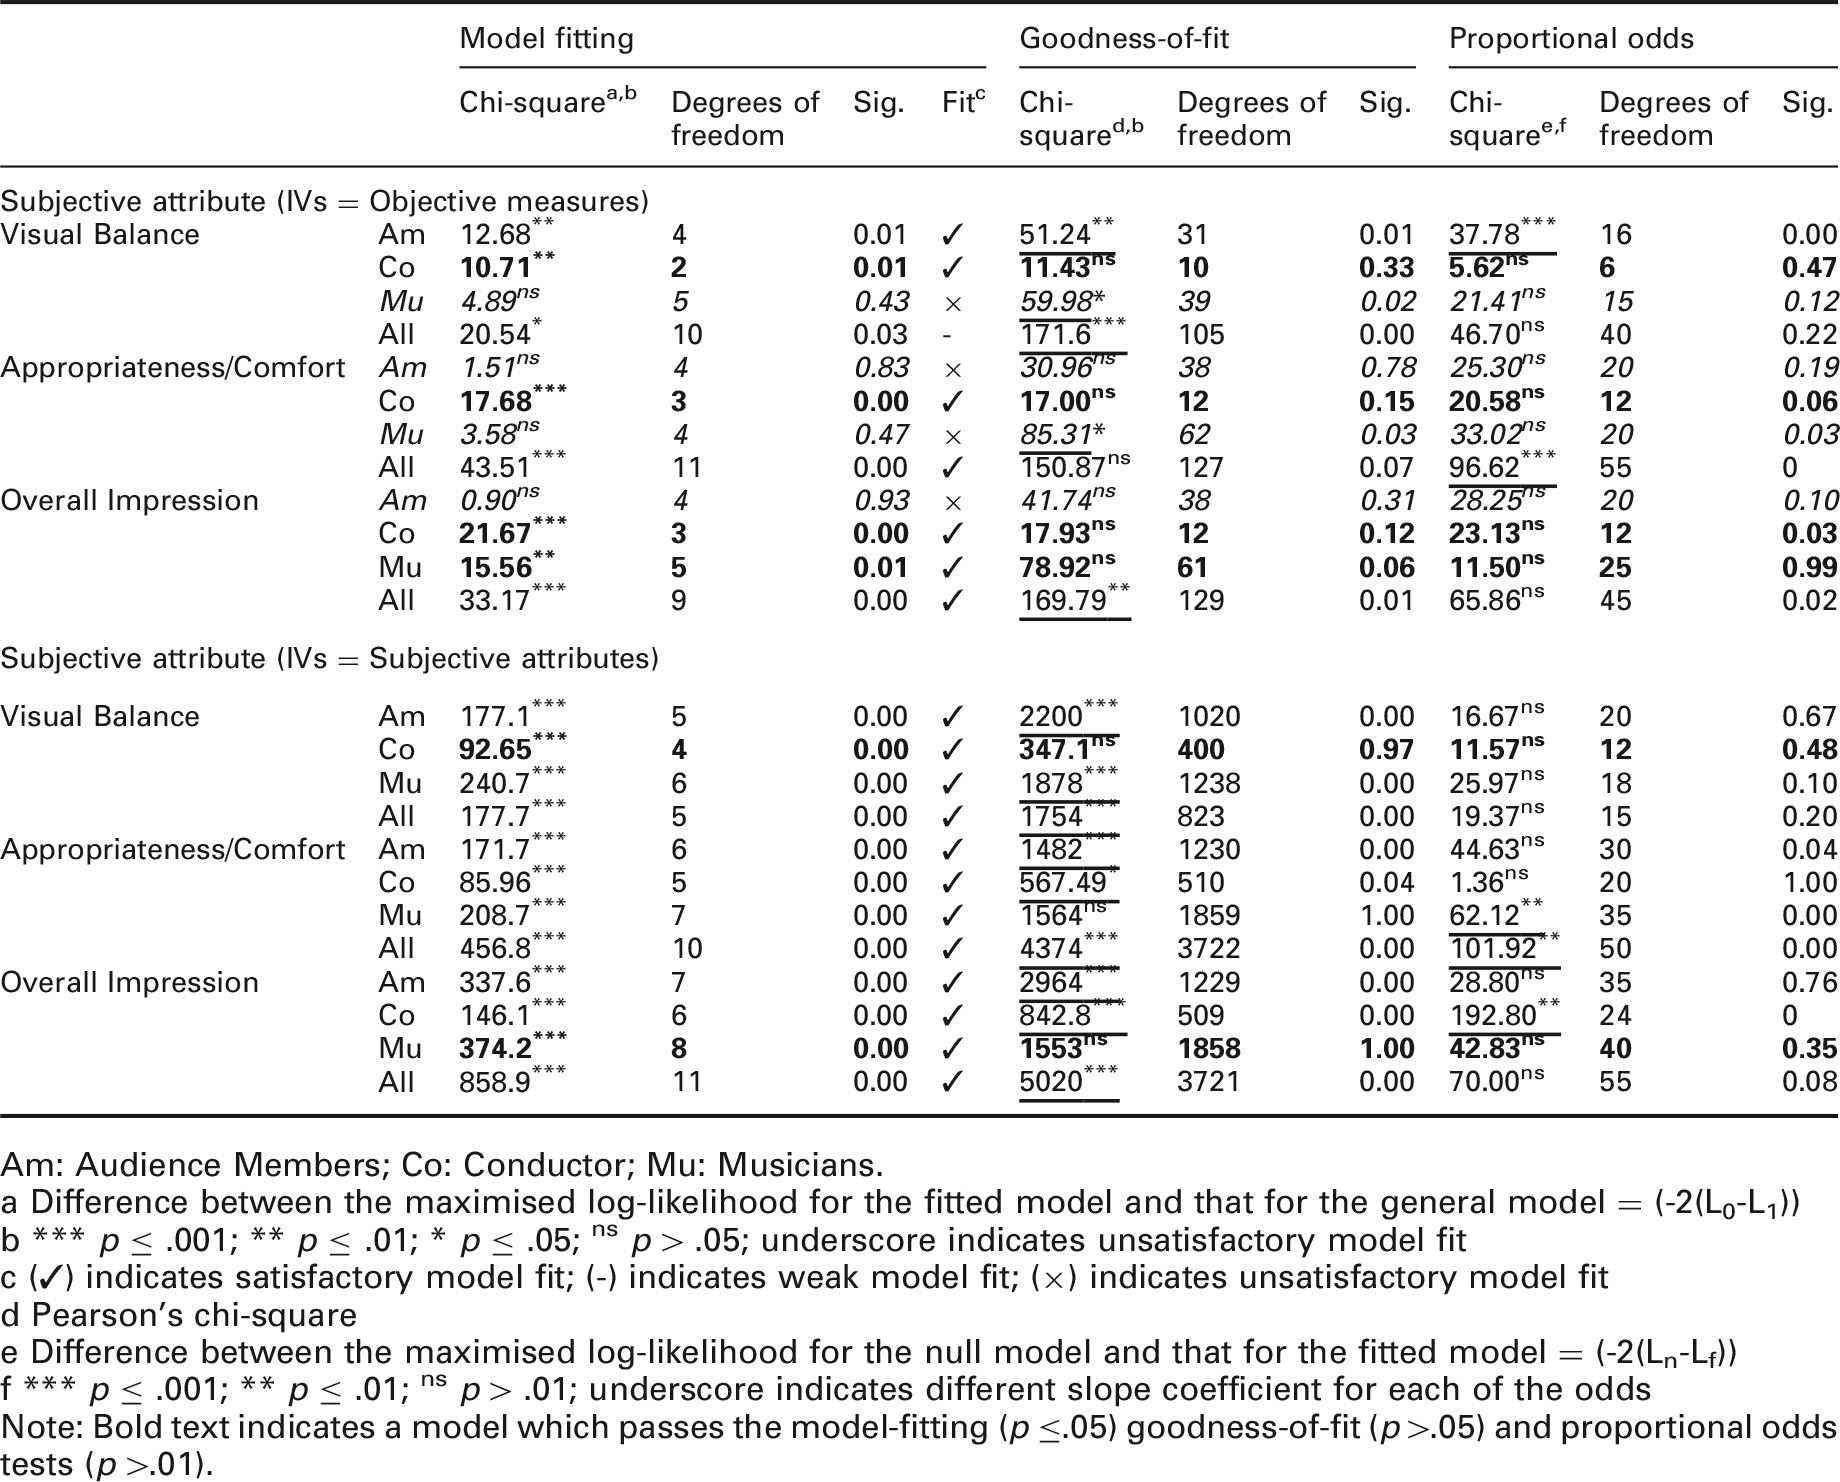
Comparison of fit statistics for the ordered logistic regressions by role using objective measures (top) (published in a previous paper 41 ) and using subjective attributes (bottom) as independent variables (IVs)
Am: Audience Members; Co: Conductor; Mu: Musicians.
Difference between the maximised log-likelihood for the fitted model and that for the general model = (-2(L0-L1))
*** p ≤ .001; ** p ≤ .01; * p ≤ .05; ns p > .05; underscore indicates unsatisfactory model fit
(✓) indicates satisfactory model fit; (-) indicates weak model fit; (×) indicates unsatisfactory model fit
Pearson’s chi-square
Difference between the maximised log-likelihood for the null model and that for the fitted model = (-2(Ln-Lf))
*** p ≤ .001; ** p ≤ .01; ns p > .01; underscore indicates different slope coefficient for each of the odds
Note: Bold text indicates a model which passes the model-fitting (p ≤.05) goodness-of-fit (p >.05) and proportional odds tests (p >.01).
Taken together, when considering the responses of the audience members, the conductor and the musicians separately, more models yielded more satisfactory results, highlighting the importance of evaluating lighting impressions by role. By contrast, when considering all the subjective attributes, as in the case of all occupants (i.e. overall analyses), the models appeared to be rather vulnerable to the goodness-of-fit and proportional odds tests. Nevertheless, the overall analyses were considered useful as they provided high-level insight into the relationship between the subjective attributes and the explanatory variables.
3.3 Lighting condition effects
Our previous work has shown that perceptions of visual clarity, visual uniformity, brightness and spatial intimacy are significantly intercorrelated with physical measures.
41
This paper focuses on the findings obtained from the ordered models for visual balance, appropriateness/comfort and overall impression. The separate odds ratios for these three attributes are presented as cumulative proportion plots in Figure 4.
Cumulative proportion plots for visual balance, appropriateness/comfort and overall impression. ‘Obj.’ denotes independent variables are objective measures; ‘Subj.’ denotes independent variables are subjective attributes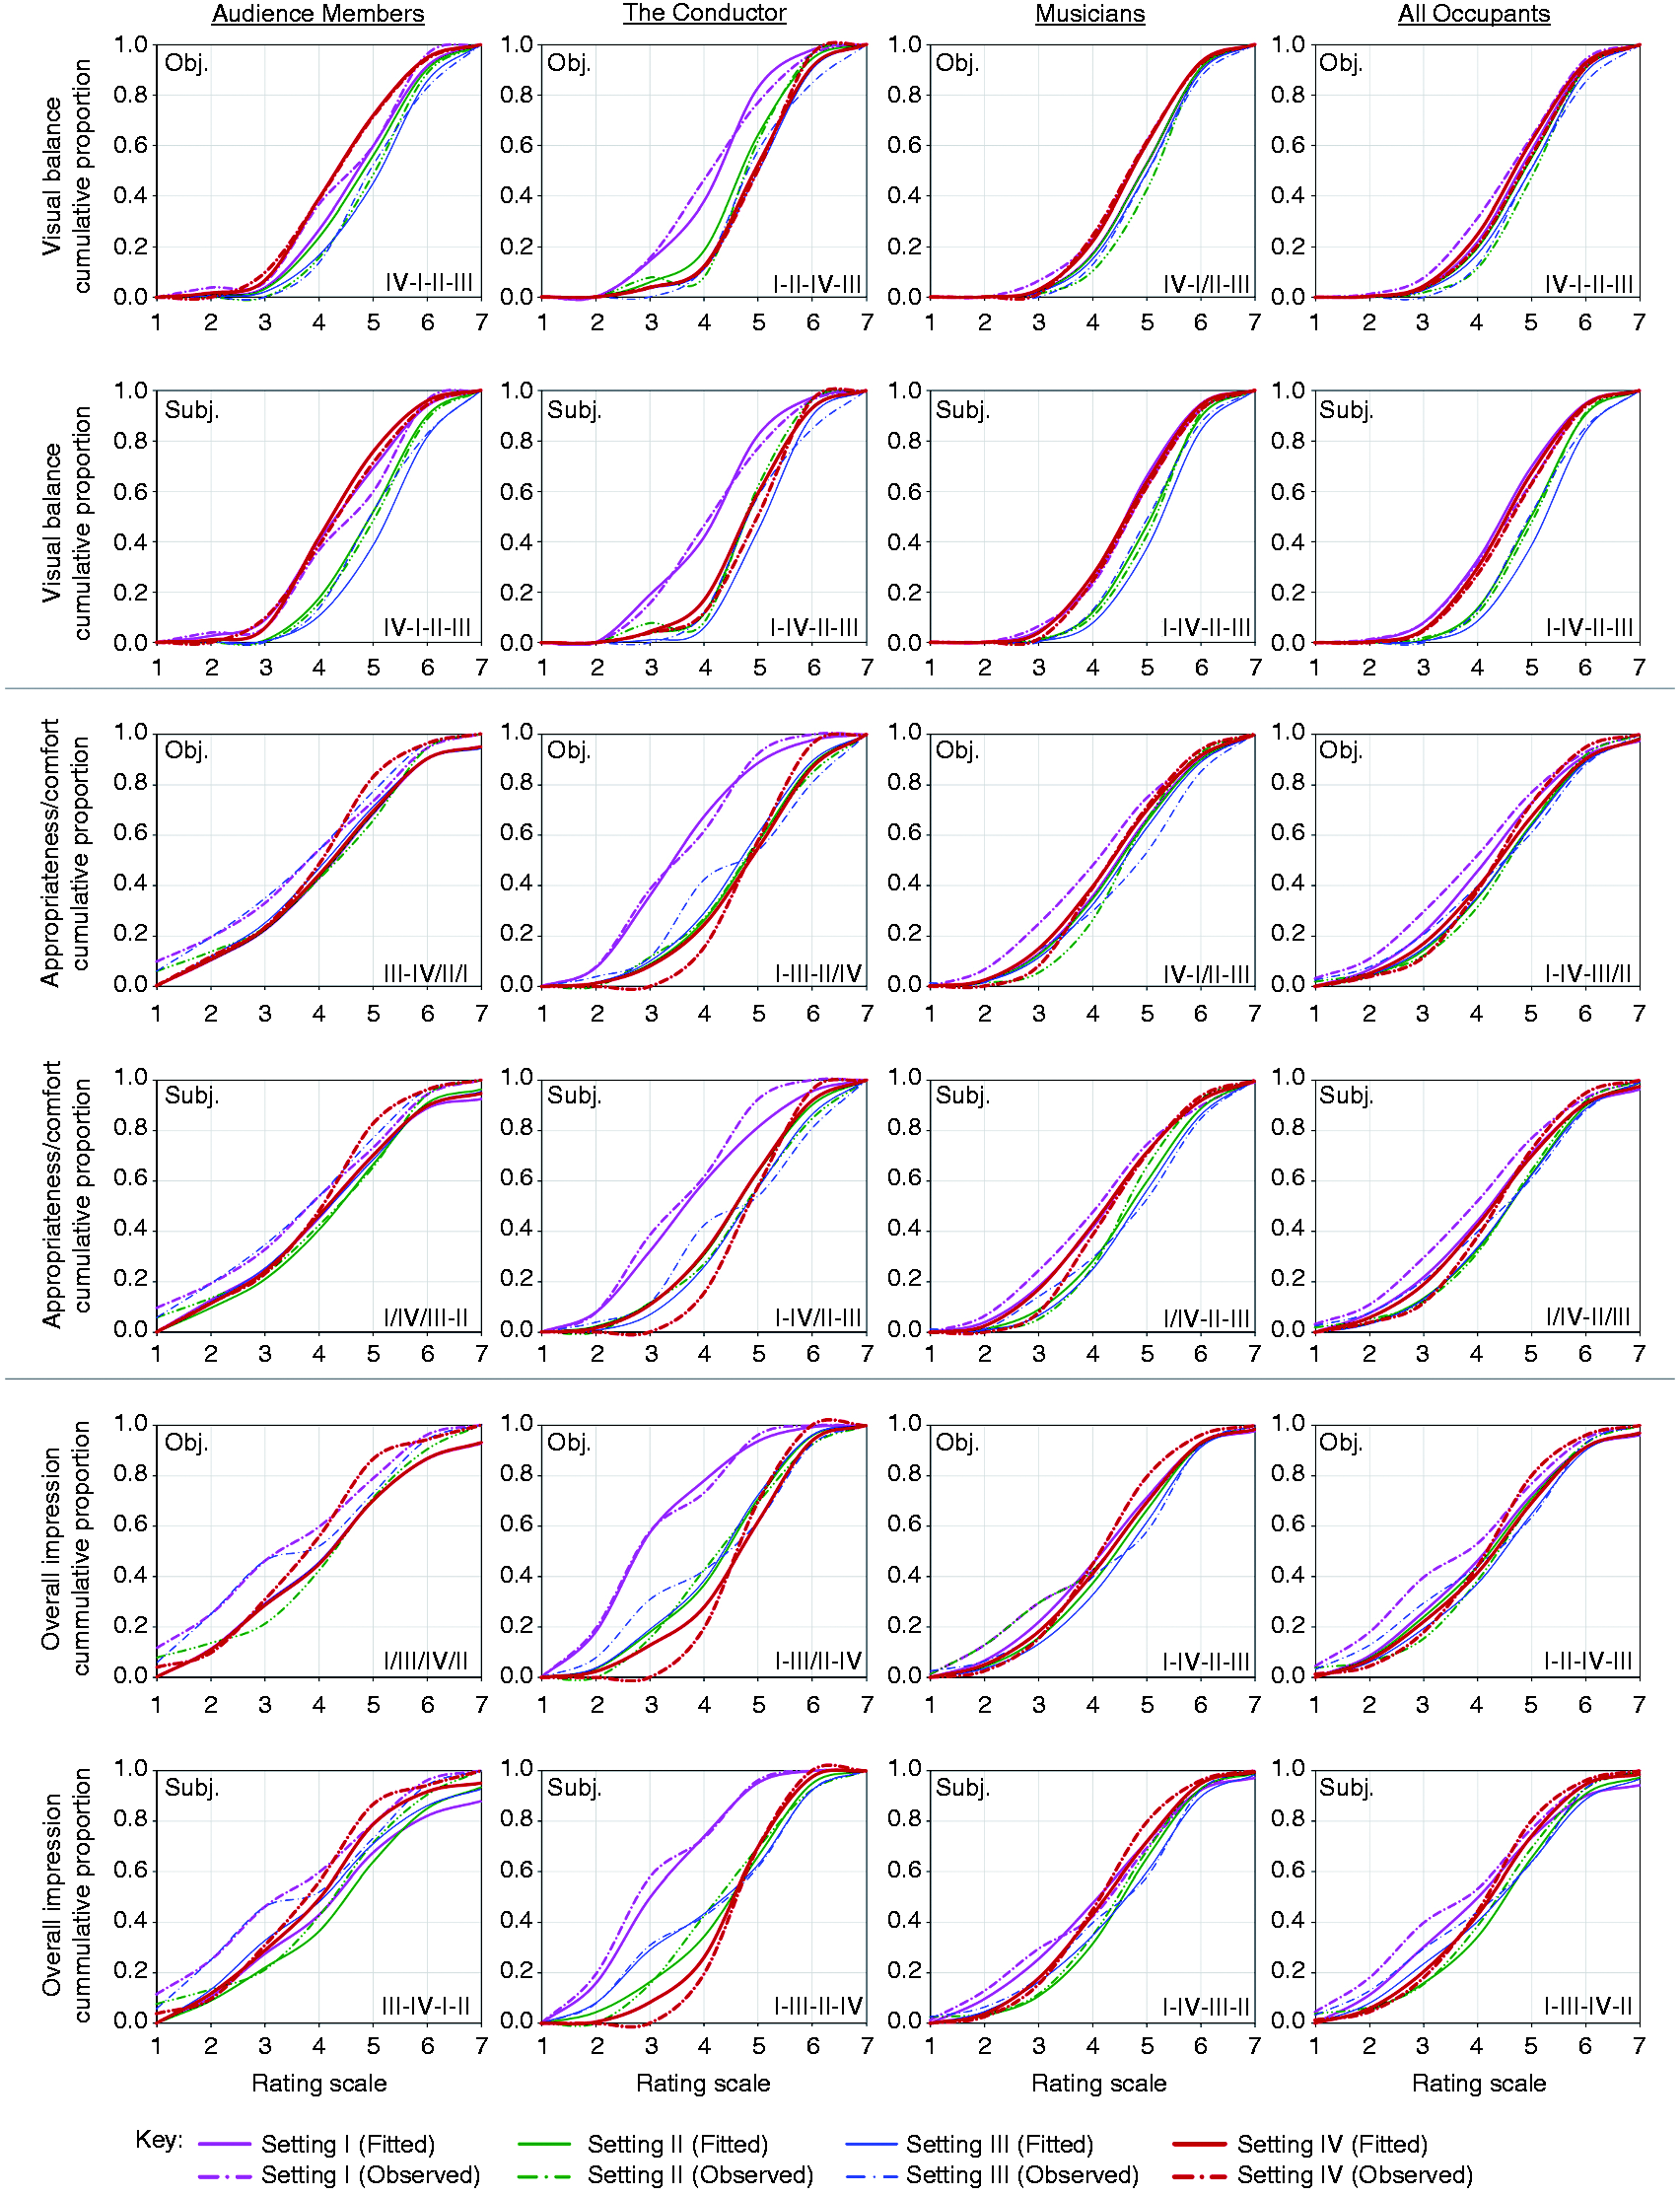
3.3.1 Visual balance
Knowing that the conductor is the only case that satisfies all the assumptions, it should come as no surprise that the plots for audience members, musicians and all occupants fail to exhibit consistent patterns. Rather, the cumulative curves lie close together with some overlapping, especially in the case of the settings without the rig lights (settings I and II) and the overhead spotlight (setting I) for musicians. The close proximity of the curves indicates that the perceived effects of the light settings were all strikingly similar. Changes in the magnitude of the measures did not appear to have any obvious relationship. This was evident in the responses of musicians and all occupants. Still, higher values of RLavg and Light:Dark were more likely to attract lower ratings. For the conductor, however, the highest probabilities of lower ratings in the setting with the peripheral lights only (setting I is 4.39 times the odds of setting IV [control]) are clearly attributable to the highest level of ((LLMavg + LRMavg)/2):LBavg and the lowest level of Light:Dark in that setting.
The lack of distinctiveness among the curves shows that the change of light settings has little influence on the perception of appropriateness/comfort. Since the differences among the four light settings were not extreme, it is plausible the subjects might have found it difficult to determine the degree of appropriateness and comfort of the settings. For the conductor, however, the curve for setting I deviates significantly from the others. The odds of this setting with the peripheral lights only are approximately 6.43 times those of the one with the overhead rig lights and overhead spotlight (setting IV [control]). A slight increase in ((LLMavg + LRMavg)/2):LBavg and a moderate increase in AreaLight patches and RLstd appear to attract lower ratings at the conductor’s position. No meaningful relationships were found for audience members, musicians or all occupants.
3.3.3 Overall impression
The curves based on the observed data appear to be peculiar in shape, reflecting the disparity among the responses. Notwithstanding the inconsistency, the models for the conductor and musicians pass all the assumption tests. For the conductor, the setting with the peripheral lights only (setting I) appears to have the highest probabilities of attracting lower ratings. The odds of such setting are 9.23 times those of setting IV (control). It follows that the setting with the overhead rig lights and overhead spotlight (setting IV [control]) was more likely to attract higher ratings for the overall impression. Yet for musicians and all occupants, the setting with the peripheral lights only (setting I) is more likely to be linked with the lower response categories.
To understand the strength of the relationship between the subjective attributes and the variables,
Comparison of the
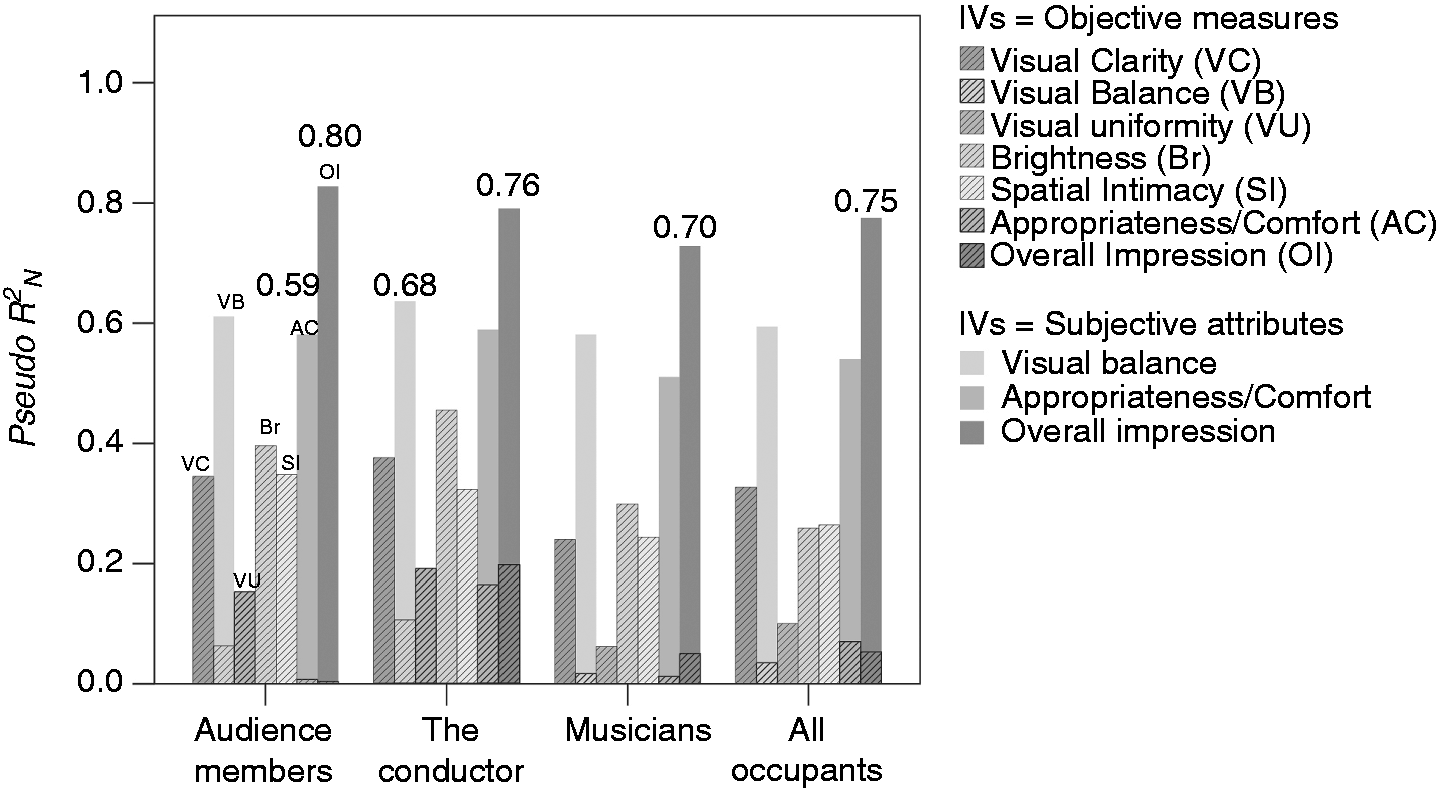
When the strength of the relationship is measured using the subjective attributes, as opposed to using the objective measures, an increase in strength can be observed with respect to visual balance (11.2 times greater), appropriateness/comfort (9 times) and overall impression (10 times). Similarly, there is a reduction in the variance in all cases, with the most for the conductor (13%) and audience members (48%) the least.
3.4. Higher and lower levels of perception
Together with our significant findings for the subjective attributes of visual clarity, visual uniformity, brightness and spatial intimacy,
41
Figure 6 summarises the overall relationship between the attributes and the explanatory variables found for the chapel.
Overall connections between the subjective attributes and the explanatory variables specific to the King’s College Chapel’s performance space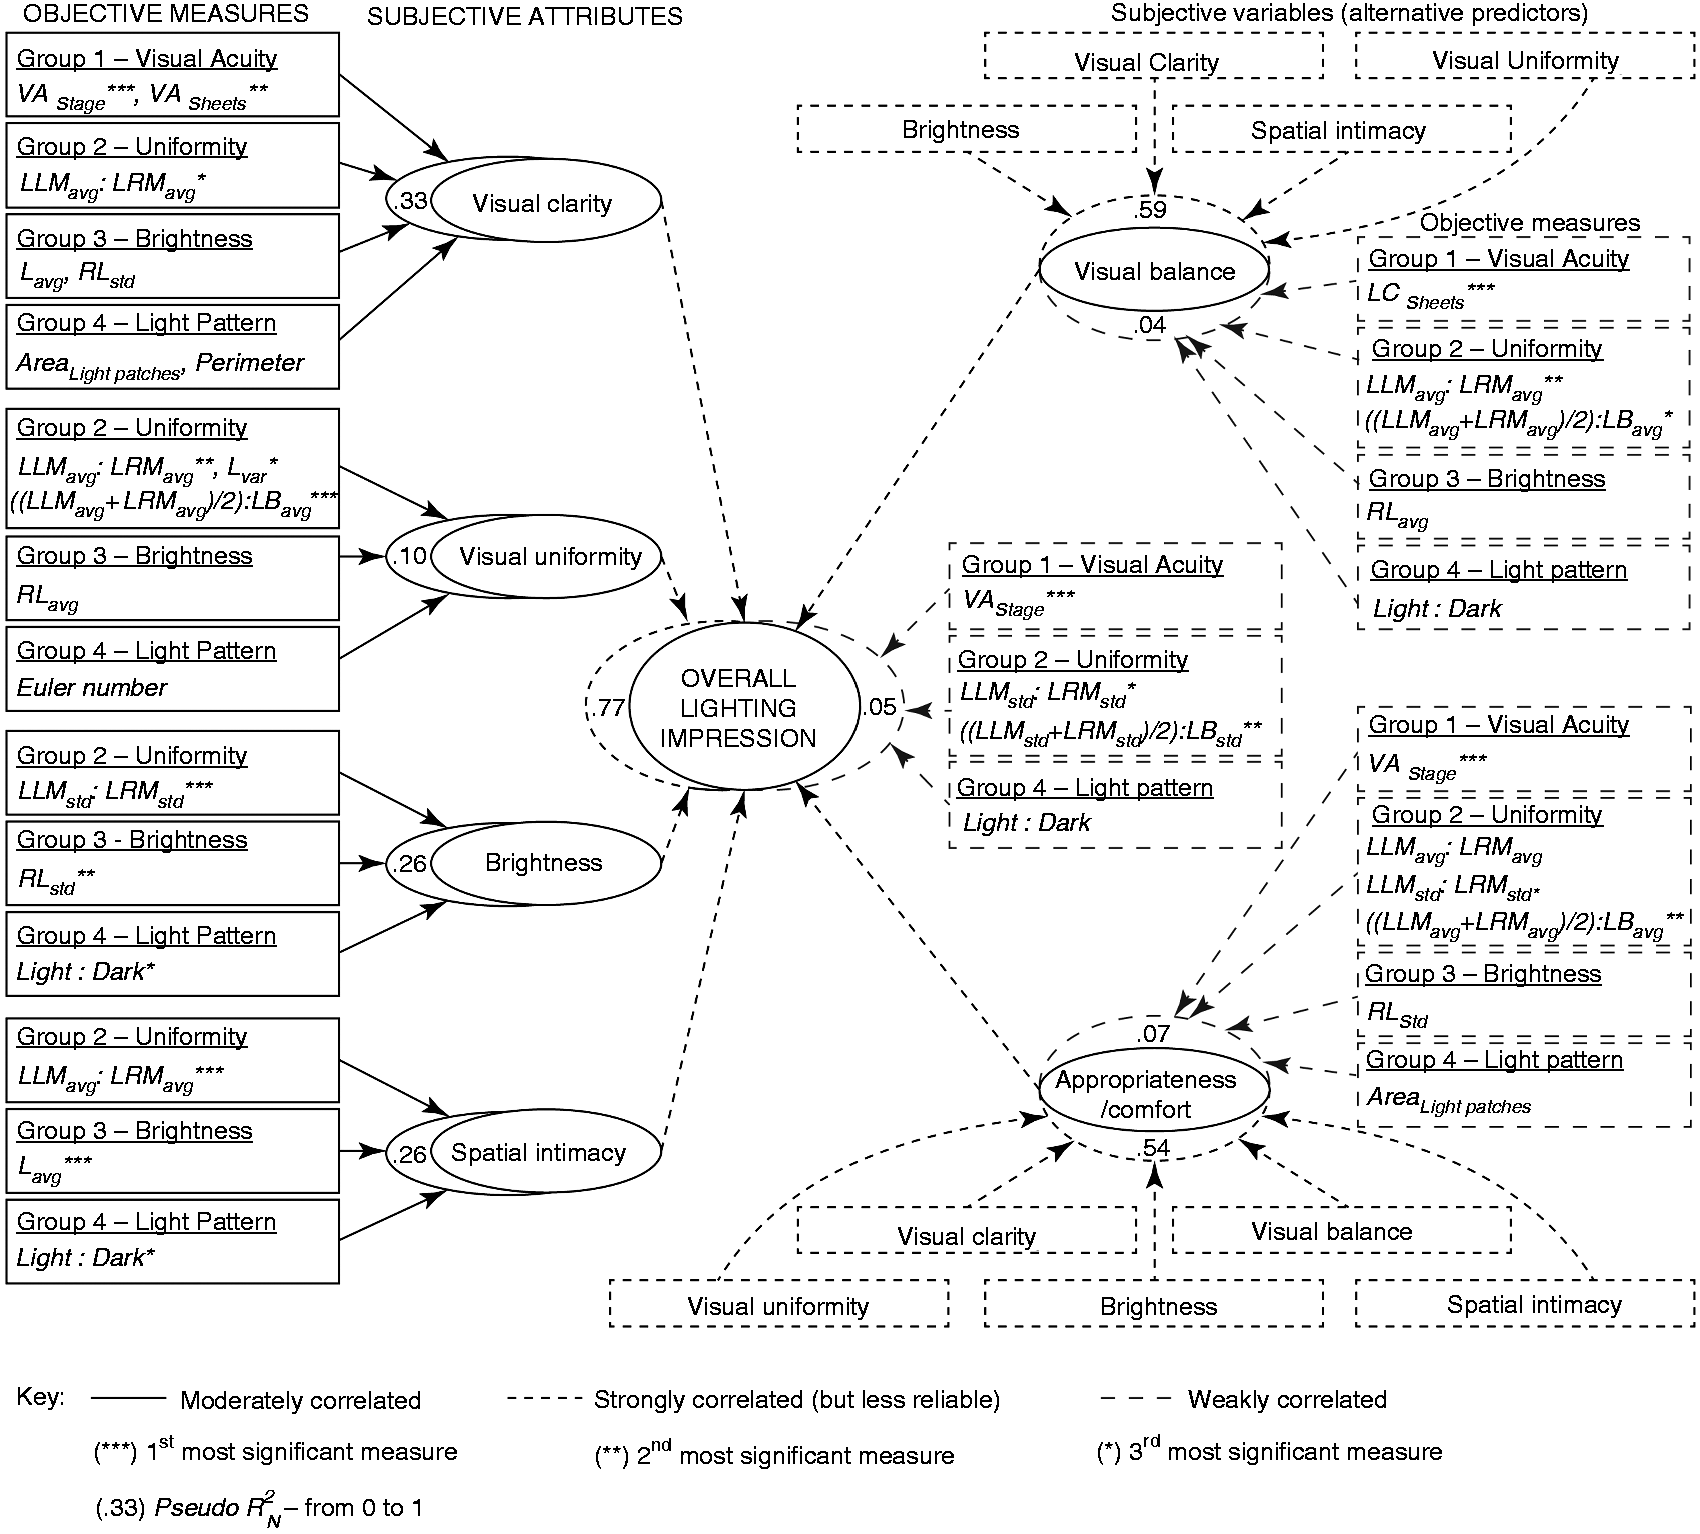
Two informative observations emerge from the interrelationship diagram. First, some perceived qualities were directly recognised by one’s visual senses depending on the presence and type of visual stimuli, while others were indirectly associated with the visual stimuli. This seems to corroborate Zeki’s theory that vision is an active and creative process through which the brain tries to interpret a visual attribute without accounting fully for any actual differences in luminance. 54 Second, the process of lighting perception appears to be bi-level. At the first level of perception, as highlighted by the significant subjective-objective connections, the perceived qualities (visual clarity, brightness, visual uniformity and spatial intimacy) seem to have a more apparent relation between visual sensations and physical measures, focusing on identifying and responding to brightness patterns, facial characteristics, objects and the wider spatial context. At the second level of perception, as suggested by the non-significant subjective-objective connections but significant subjective-subjective connections, the perceived qualities (visual balance, appropriateness/comfort and overall impression) are associated more with the intricacies of the physical stimuli that are often complicated by the occupants’ knowledge and experiences – these are higher order variables as described by Flynn et al. 55 Such higher level qualities are apprehended by attaching meaning to the physical stimuli and context. This observation appears to be well substantiated by Gregory’s ‘ins-and-outs’ theoretical model, which emphasises that top-down knowledge (i.e. conceptual and perceptual) and sideways rules play a more integral part than bottom-up signals do in the process of visual perception. 56 It is also plausible that the occupants’ state of mind plays a part in the process whereby, as Zeki and Bartels hypothesised, a conscious dimension is involved in perceiving and understanding a visual scene, and that different visual stimuli are perceived consciously at different times using different processing systems that are spatially distributed, functionally specialised and temporally asynchronous, leading to various visual experiences. 57
3.5 Overall impression
The results of the statistical analyses confirm the potential of the integrated approach, providing useful insight into the subjective–objective connections. How much variation in the overall perceptions was created by the test settings as compared with the control setting? Considering all the responses, the result of the Levene test indicates that the data set violates the assumption of homogeneity of variance (Levene statistic = 11.267, p ≤ 0.005), which means that the variances of the four settings are significantly different. The results of a Dunnett test show that setting I (peripheral lights only) elicited a significantly lower mean overall impression rating than the control setting (with the rig lights and overhead spotlight) (p ≤ 0.05). In fact, these findings are consistent with those reported by Loe et al. in that combining various types of light fitting is more likely to create a more pleasant luminous environment. 58
Having identified the pairs of settings with significant differences, their magnitude was gauged by computing Cohen’s d.
45
The mean overall impression rating for setting II was 0.407 standard deviations better than for setting I. That accounts for 17% of the total variance and is considered to be a moderate to strong effect on the rating. The mean overall impression rating for setting IV was 0.304 standard deviations greater than for setting I. That accounts for 9% of the total variance and is considered a small to moderate effect. As shown in Figure 7, while the difference between settings II (with peripheral lights and an overhead light) and IV (with the rig lights and an overhead spotlight) is not significant, the former appears to have the highest mean rating among all the test settings. This can be attributed to the greater sense of diversity in the lit environment induced by the combination of direct and diffuse light. It is also worth noting that some of the individual mean ratings – for example, at the conductor’s viewing position under setting I and at the musician’s positions (side and rear) under setting III – appear to be slightly higher than the overall highest mean rating, indicating that the overall mean rating needs to be interpreted with caution.
Average overall impression ratings by viewing position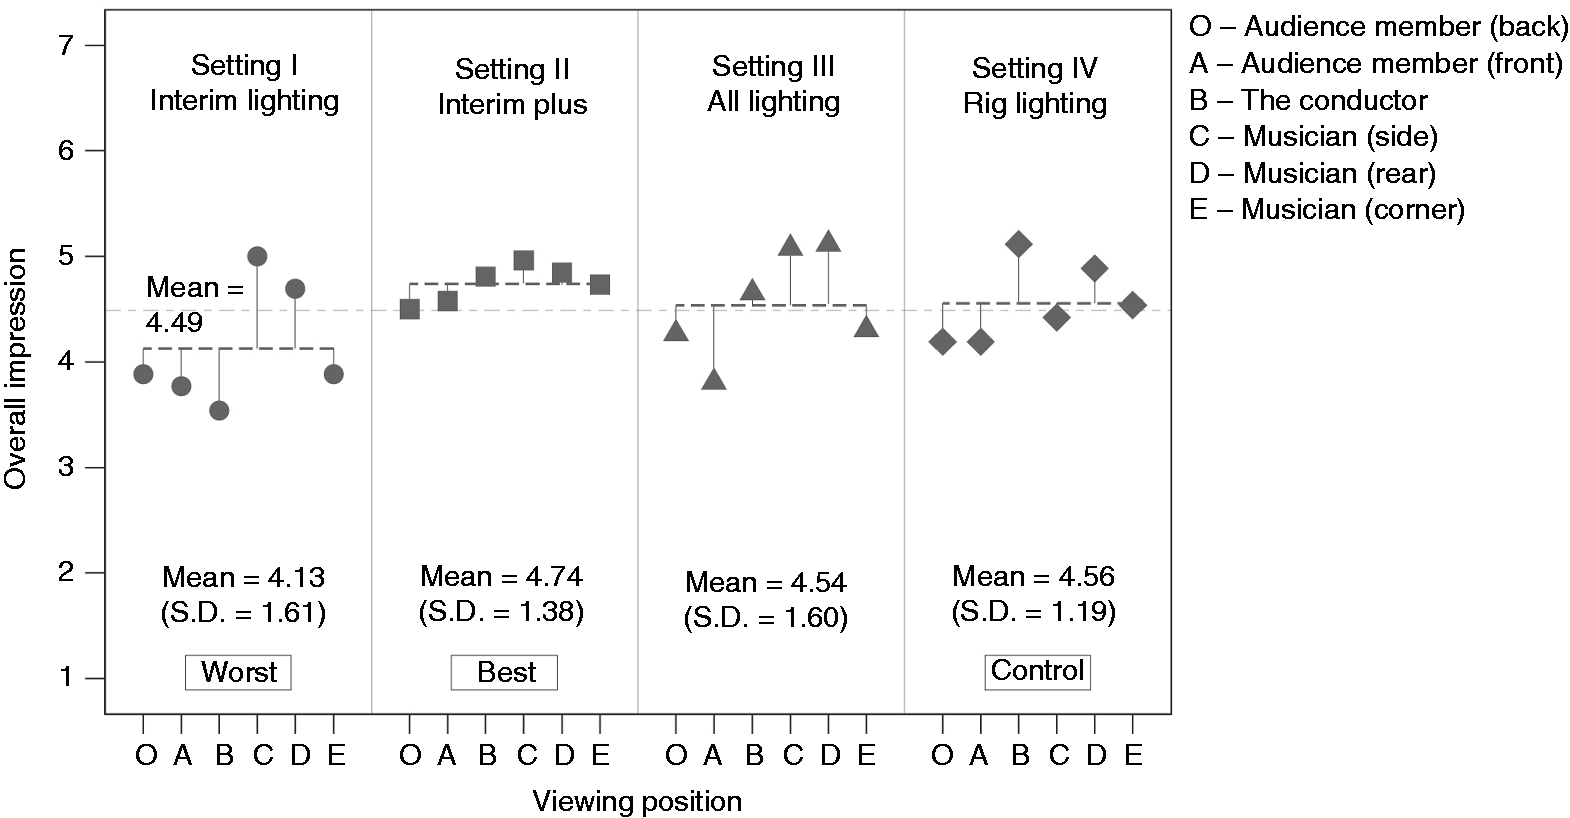
To obtain a more general understanding of what changes in the lighting arrangements constitute a significant difference, three contrast groups were formulated to compare: (1) the control setting to the test settings; (2) the settings with and without the rig lights; and (3) the settings with and without the overhead lamp above the conductor’s podium (Figure 8). One-way analysis of variance was performed to test the significance of the observed differences in the means without assuming equal variances.
Comparison of the light settings by contrast group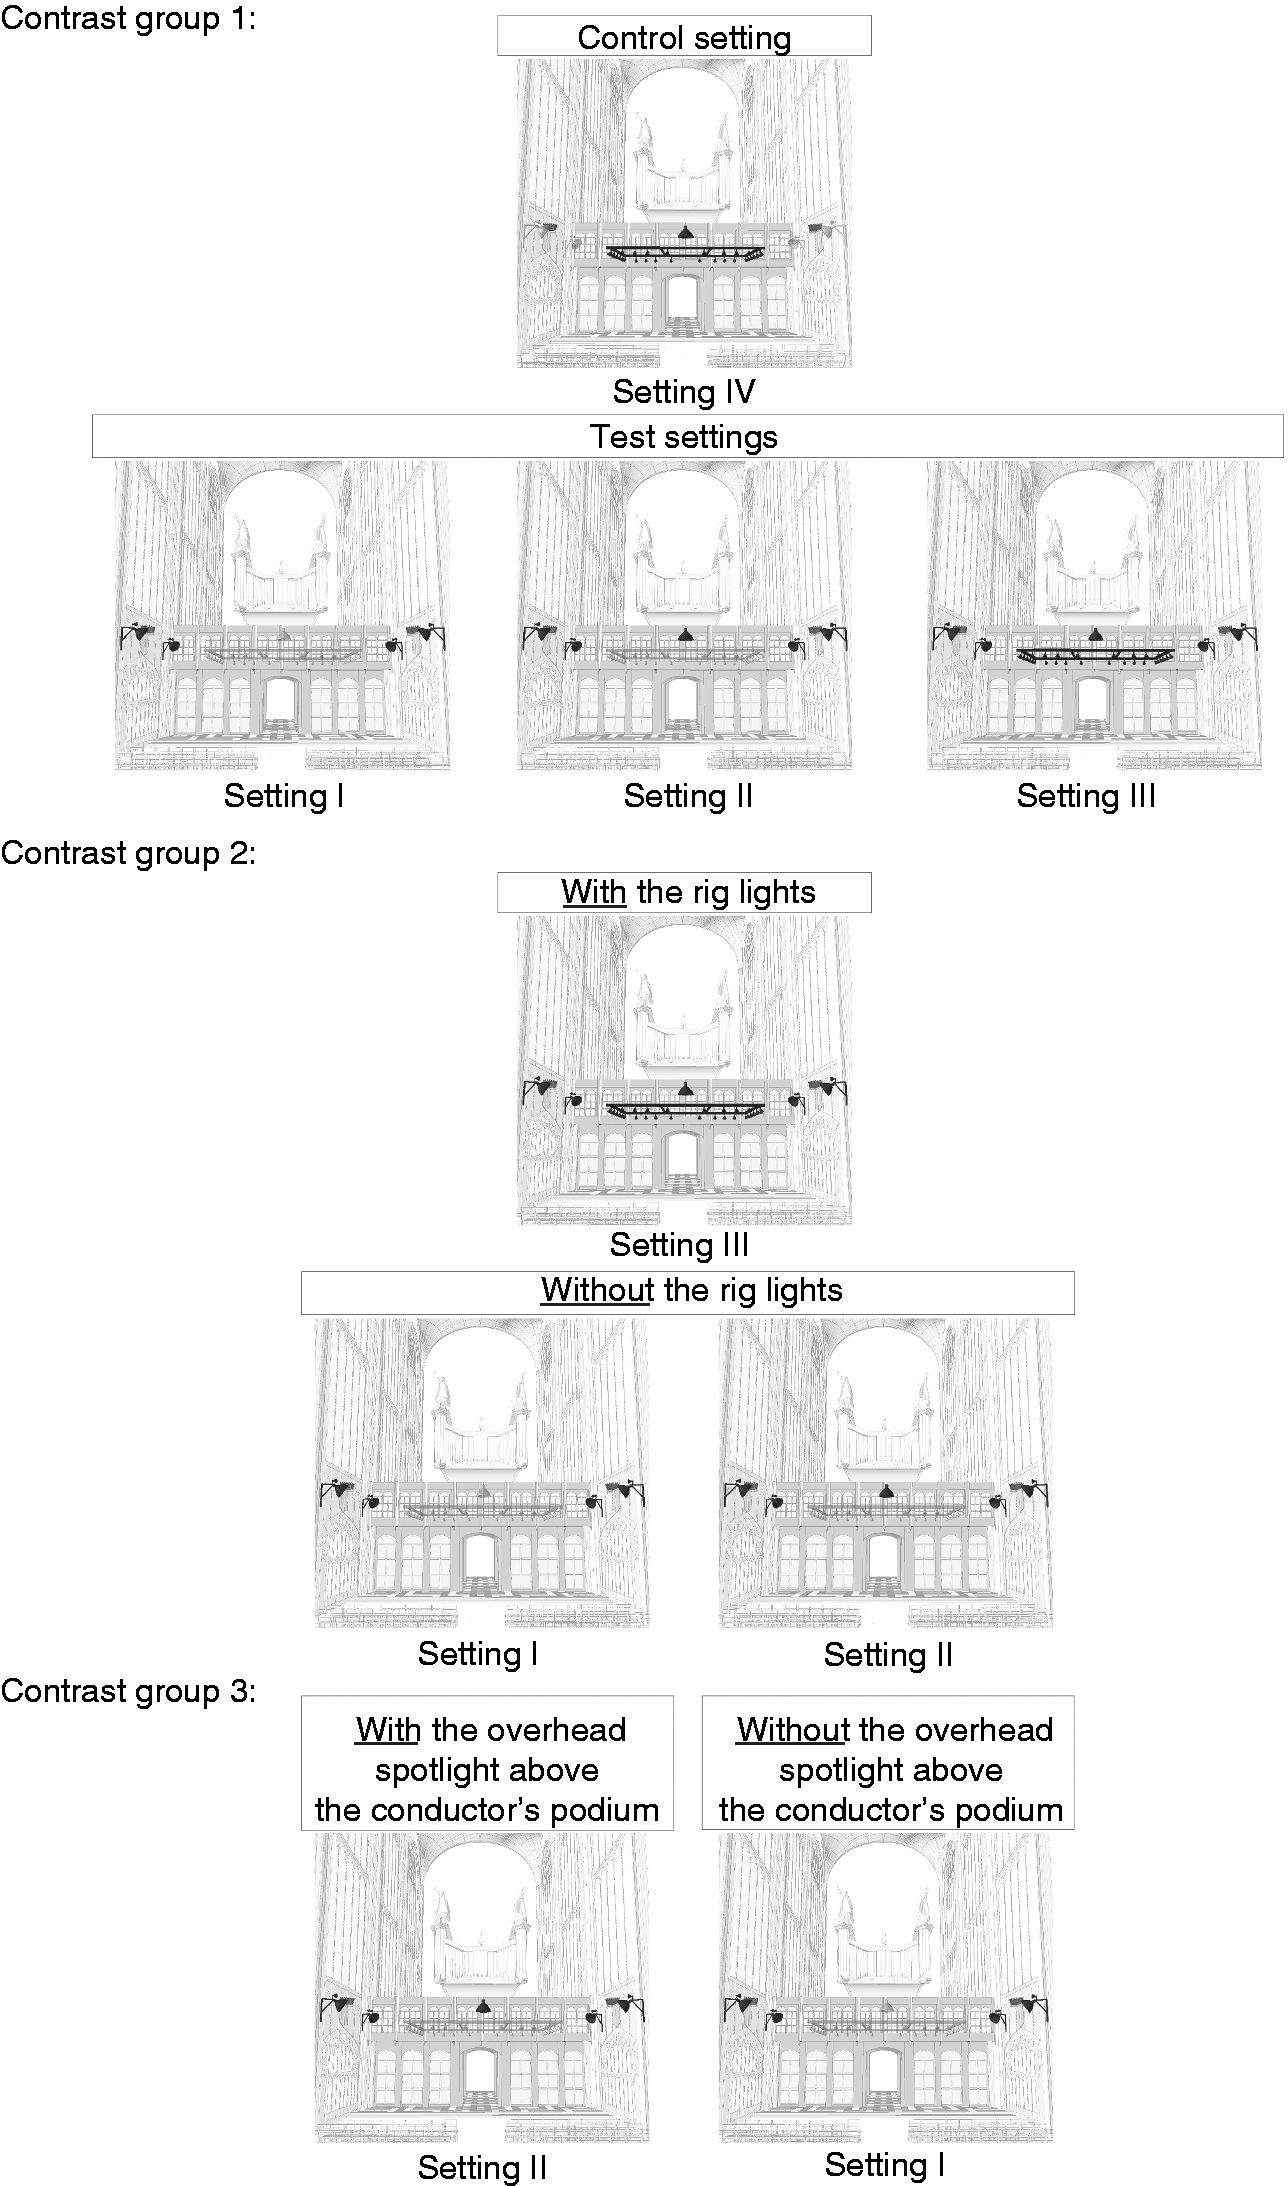
For the first contrast group, the mean overall impression rating for the control setting proved not significantly different from that of the test settings (t [337.878] = 0.755, p = 0.451). For the second contrast group, the mean overall impression rating for the settings without the rig lights (i.e. settings I and II) was again not significantly different from that for setting III with them (t [290.977] = 0.688, p = 0.492). For the third contrast group, however, the mean overall impression rating for the setting without the overhead lamp (setting I) was significantly different from that for setting II with it (t [303.029] = 3.595, p ≤ 0.001).
Taken together, the findings seem to suggest that removing the rig lights completely had a noticeable effect on overall satisfaction with the luminous environment. Contrary to what one might expect, installing additional peripheral lights (spotlights) on the walls did not yield any significant improvement. In fact, their mean ratings were almost equal. Yet, the variation in responses for all lighting was somewhat larger. In particular, the ratings for the audience member (spot A) in the front and the conductor (spot B) appear to be much lower for the setting with all the lights on (Figure 7). Increasing the overall lighting intensity in the chapel did not prove to be an effective way to improve the overall satisfaction. Indeed, considering the lighting effect created by the additional lamps alone (i.e. setting I – interim lighting), there is a much higher likelihood of generating a lower level of satisfaction. Adding the overhead lamp to setting I (i.e. setting II) appears to be an effective way to improve user satisfaction generally, as evidenced by its highest mean rating but small variation. In any case, the subjects were able to detect the differences in overall impression between the settings despite their subtleness.
4. Conclusions
This paper presented the development and applicability of an integrated bottom-up approach for the evaluation of the overall impression of concert lighting for the King’s College Chapel. The approach sought to establish relationships between the subjective attributes and objective measures of light, producing an overall rating for complex settings. The subjective attributes were first scrutinised in detail by occupant’s role and then generalised through data aggregation. In this way, unreliable data and variables that might lead to unsatisfactory or simply weak results were identified with greater confidence. The connections were best explained for the conductor and weakest for musicians. The overall analysis is more prone to ill-defined models because it essentially disregards the differences among the roles, leading to much greater variation and uncertainty. The predictive power for the models of visual balance, appropriateness/comfort and overall impression was relatively weak. Choosing the subjective attributes as the predictors, however, led to a substantial increase in strength.
Providing an acceptable level of light is largely an issue of functionality. What can one measure that is useful enough to understand lighting quality? Can that be quantified? The answers to these questions are positive, but there are only a few answers to the first. The intercorrelations among the subjective and objective variables examined here suggest that the perceptual process is bi-level. Higher level perceived qualities (visual balance, appropriateness/comfort and overall impression) are accounted for not by objective measures but by lower level subjective attributes (visual clarity, brightness, visual uniformity and spatial intimacy) which could be satisfactorily explained by the measures.
Given that the selection of attributes and measures plays a part in determining the extent of the correlations, the next question to consider is how the process of selection can be optimised in order to identify the most relevant variables. The measures chosen for this study underwent a rigorous and iterative selection process, from grouping based on the unit and construct of the measures, identifying possible intercorrelations, to finalising the selection based on lighting requirements as a means of justification. Above all, the consideration of the classic theorems and functions, including the seminal work of Blackwell and Flynn, guided the process.23,55 It is recommended that future studies should consider setting out selection criteria based on users’ lighting requirements in accordance with the type of lit environment examined as the first step, as well as making references to the measures and attributes used in previous studies of a similar setting, followed by a series of correlation analyses to confirm the selection. These steps are necessary to ensure that the choice of measures is commensurate with specific settings, occupant types and applications. Moreover, the null results found for the subjective–objective relations and the statistically significant results found for the subjective–subjective relations suggest that future studies may identify relevant attributes through a three-way examination starting with the intercorrelations between potential high-level and low-level subjective attributes, and then between low-level attributes and measures, followed by the intercorrelations between high-level attributes and measures. Not only could this better facilitate the selection of predictors, but it could also provide some useful insights into both inter- and intra- relations between the attributes and measures; the latter would likely be neglected otherwise.
Comparing the overall lighting impressions has offered an informative account of the changes brought about by various lighting configurations. Setting I (peripheral lights only) was the worst rated, whereas setting II (peripheral lights with an overhead spotlight) was the best rated. Another key finding is that maximising the luminous intensity in the chapel did not seem to improve the overall impression. However, removing the rig lights and providing directional light at the conductor’s spot appear to be a viable way of achieving a higher level of satisfaction.
Field studies offer a much higher level of realism than laboratory studies that use mock-up rooms, unoccupied spaces, static photographs or rendered images. However, the process of testing methods and developing approaches in a real setting is costly and time consuming, not to mention the various feasibility, technical and logistical issues arising from constructing an experimental scene. As with all research, the integrated approach developed is not without limitations. Using the chapel as a real setting for the methodological developments raises questions about the pragmatism of integrating the approach at early design stages.
The approach, as demonstrated in this study, can be readily applied to evaluate existing and complex lit environments, but may pose a technical challenge on informing lighting design decisions especially for buildings prior to construction. Ideally, if we evaluate every building typology and establish a repository of precedents and data, we can compile a database of recommended measures and magnitudes to serve as benchmarks for design. Not only would this be a mammoth and tedious task, but it would also be burdensome to keep up with the evolving lighting needs and requirements in response to the rapidly changing world. However, the emergence of immersive virtual, augmented and mixed realities brought about by technological innovations presents opportunities to make the assessment of physical measures possible at the concept design stage, facilitating the prediction of perceived impressions and expectations. Several attempts have been made to validate the application of immersive virtual environments to evaluate visual perceptions, although they have been limited to simple settings. 59 – 61 The sense of realism and presence in an immersive virtual environment was reported to be closest to a real environment when compared with using photographic media to simulate it. 62 Nevertheless, caution must be exercised when interpreting objective data collected from a virtual space. No doubt the evolution of digital technologies and the emergence of virtual worlds will continue to shift the way light measurements are acquired just as the invention of charge-coupled devices did in the 70 s.
Every building is unique with its own character. Although it is reassuring that virtual reality would lend itself well to the evaluation of lighting quality, we need to be mindful of the fundamental meaning of space and the emotive qualities of architecture. It is vital to try to combine research methods into a comprehensive protocol through which, as this study has revealed, conclusive results are more likely to be obtained. Tiller argued that such combination is the key to ‘bridging the gap between the subjective data and physical measures’. 63 He also stressed that predictions of subjective effects should only be made when subjective–objective relationships have been established. Yet more effort needs to be devoted to make lighting assessments more meaningful and widely applicable. The insights and findings of this work may thus make a valuable contribution to lighting research.
Footnotes
Declaration of conflicting interests
The authors declared no potential conflicts of interest with respect to the research, authorship, and/or publication of this article.
Funding
The authors disclosed receipt of the following financial support for the research, authorship, and/or publication of this article: This study was supported by the Cambridge Trust, Emmanuel College and the Cambridge Department of Architecture.
Acknowledgements
The authors would like to thank Cambridge King’s College and Dr Tom White for their logistical support and technical assistance throughout this study. The authors would also like to thank all the research participants for their valuable contributions.