
Abstract
We report for the first time the effect of ageing due to adaptive control of lighting on the lifecycle costs of luminaire installations. Two types of LED street luminaire were aged (1) as the luminaire lit for 9 hours and then switched off for 3 hours and (2) under intensive ageing using adaptive control conditions mimicking presence of vehicles, where the luminaires were switched with 30-second interval between 100% and 20% power within the cycle of (1). The test continued for 32,000 hours. Luminaire lifetime was found to decrease by 10% due to the intensive adaptive control, which exaggerates the ageing as compared to real traffic conditions. We estimate that a realistic rate of dimming cycles would decrease the luminaire lifetime by 0–2%, increasing the lifecycle costs of a lighting installation by 0–0.7%. With a traffic-aware control system, capable of 50% energy saving in lighting, the lifecycle costs are estimated to reduce by 25% as compared to a similar LED luminaire installation without traffic-aware control, outweighing the costs due to the reduced lifetime. The smart controlling of lighting is considered as a useful way to meet future energy saving targets.
1. Introduction
The energy efficiency of LED lamps and luminaires has been a major driver in the lighting industry during recent years. Approximately 20% of the global electricity consumption is used for electric lighting, and thus the energy saving potential in the area is remarkable. There is a significant energy saving potential in exterior lighting when replacing conventional street lighting units with LED technologies utilizing advanced controlling.1,2 In Germany, the potential annual savings when switching to energy efficient street lighting are estimated to be 400 million euros. 3 The number of luminaires in street lighting is expected to increase by a factor of three globally from 2015 to 2025. 4 One significant driver for this is the uptake of LED streetlights in the market, and at the same time, the decreased price of the luminaires has brought economically the LED based systems at least on par with conventional streetlights.5–7 The LED luminaire price has also been predicted to decrease by 50% of the price in 2017 by the year 2025. 8 The move to LED street lighting also opens new possibilities in many areas, e.g., luminaire controlling and safety improvements.2,9–11
Based on estimations, the share of the LEDs in outdoor lighting should increase to over 90% by 2025 from the 10% in 2013. 12 As the energy saving targets set by governments and communities will probably become more demanding in the future, they cannot be solely met by replacing the conventional street luminaires with the ones utilizing LEDs. More advanced methods are needed. Many studies suggest adaptive or smart controlling of the luminaires based on occupancy or ambient illuminance levels as a solution to reach the energy saving targets.13–16 To realize the transformation to smart lighting, important contributions and support are still needed from standardization organizations, municipalities, and utilities in the form of guidance and local regulations that allow the implementation of energy saving strategies enabled by the technology.17–20
The start-up times of LEDs are very short when compared to the traditional street lighting technologies, and therefore the LED modules can be dimmed by modulation. This enables advanced controlling of lights resulting in energy saving. With traffic-aware controlling, lights can be dimmed down when there are no pedestrians or vehicles on the street, and the lighting level can be increased when needed, introducing energy savings up to 60% compared to installations with similar LED luminaires but with traditional controlling.1,21–23
Studies of traffic-aware controlling have been conducted for showing the energy saving potential and to present examples of algorithms and devices needed for controlling in real traffic situations.5,22,24 A study by Lau et al. 4 used simulated data based on real traffic volume to estimate the potential dimming periods.
It can be expected that dimming or switching off LED lighting extends the lifetime of the luminaires and improves the energy efficiency. Operating an LED with lower driving current decreases the junction temperature of the LED and thus, ideally, improves the lifetime of the luminaire. However, the advanced controlling may also accelerate the ageing of the electronics and the LED module itself. Similar hammer testing methods of oscillating the temperature up and down are used for accelerating the ageing of electronic components. 25 Effectively, the continuous dimming of luminaires produces similar thermal stress to the LED modules and the luminaire electronics as the thermal hammer testing of electronics. In this study, the concepts of intensive ageing under adaptive control conditions, or intensive adaptive control, are used to describe the laboratory ageing of luminaires with continuous dimming, in contrast to realistic traffic-aware control conditions of lighting where the rate of dimming cycles applied to the luminaires is considerably lower.
We have studied the effect of intensive adaptive control on the LED street luminaire lifetimes and failure rates. Extensive ageing of more than 30,000 hours was performed during a five-year time period. Typically, the ageing of luminaires is performed in higher temperatures and shorter time periods, and the results are converted to operating temperatures with specific conversion factors. 26 According to standard IES TM-28-14 on LED lamp and luminaire long-term luminous flux maintenance projection, 27 a minimum ageing time of 6000 hours is needed for estimating the lifetime of a luminaire. Therefore, the specified lifetimes extrapolated from the converted data have high uncertainties. Our results are one of the first reported measurement results for luminaires aged in normal operating temperatures over a period of approximately one third of the lifetime specified by the manufacturer.
This study demonstrates a novel result that intensive adaptive control of street luminaires degrades their luminous output faster than they degrade when operated with full power, as expected based on the hammer testing considerations above. Nevertheless, the energy savings due to the smart controlling outweigh the decrease in luminaire lifetime, and thus the traffic-aware control of lighting is a useful way to meet energy saving targets. Based on our results, new LED street luminaire installations on streets and highways with non-continuous traffic should be implemented with an option for traffic-aware control.
2. Ageing procedure and measurements
Specifications of the luminaires as provided by the manufacturers
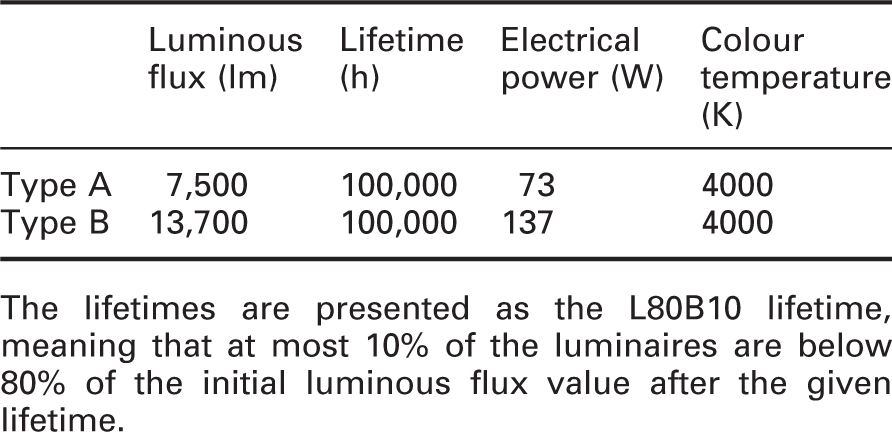
The lifetimes are presented as the L80B10 lifetime, meaning that at most 10% of the luminaires are below 80% of the initial luminous flux value after the given lifetime.
Luminaire type A consisted of an outer shell, acting also as a heat sink, 12 LED strips, and driving and controlling electronics. The luminaire had in total 36 LED chips, and the light was focused with separate detachable reflectors. Type B had two separate modular LED systems, each system consisting of driving and controlling electronics, a LED panel of 48 LED chips, a heat sink, and detachable lens arrays.
2.1. Ageing cycles
The ageing procedure of the luminaires was carried out under stable environmental conditions in a dedicated laboratory space. The temperature in the ageing space was (25 ± 2) ℃. Luminaires were mounted on the wall and operated in their intended orientation, light facing down. The luminaires were connected to electrical mains. Switching the luminaires on and off was carried out automatically through DALI connection and standalone controlling electronics.
For all lamp groups, a cycle of 9 hours of operation and 3 hours of switched-off time was used to simulate the normal daily operation of streetlights. Three hours was considered long enough for the LEDs to totally cool down to ambient temperature. It is assumed that during the missing 12 hours of the day, the luminaires would not age. In addition to this daily cycle, the ageing group under intensive adaptive control was cycled during the 9 hours of operation with a cycle of 30 seconds of full power and 30 seconds of 20% power. The dimming cycles are presented in Figure 1. The two different control cycles used in the ageing of the luminaires. In the natural control cycle (a), the luminaires were switched on for 9 hours and off for 3 hours, simulating the daily cycle in normal use. For the intensive adaptive control cycle (b), the luminaires were switched between a 100% power level for 30 seconds and 20% power level for the next 30 seconds, in addition to the natural cycling. In reality, the switching in (b) is much faster than schematically drawn in the figure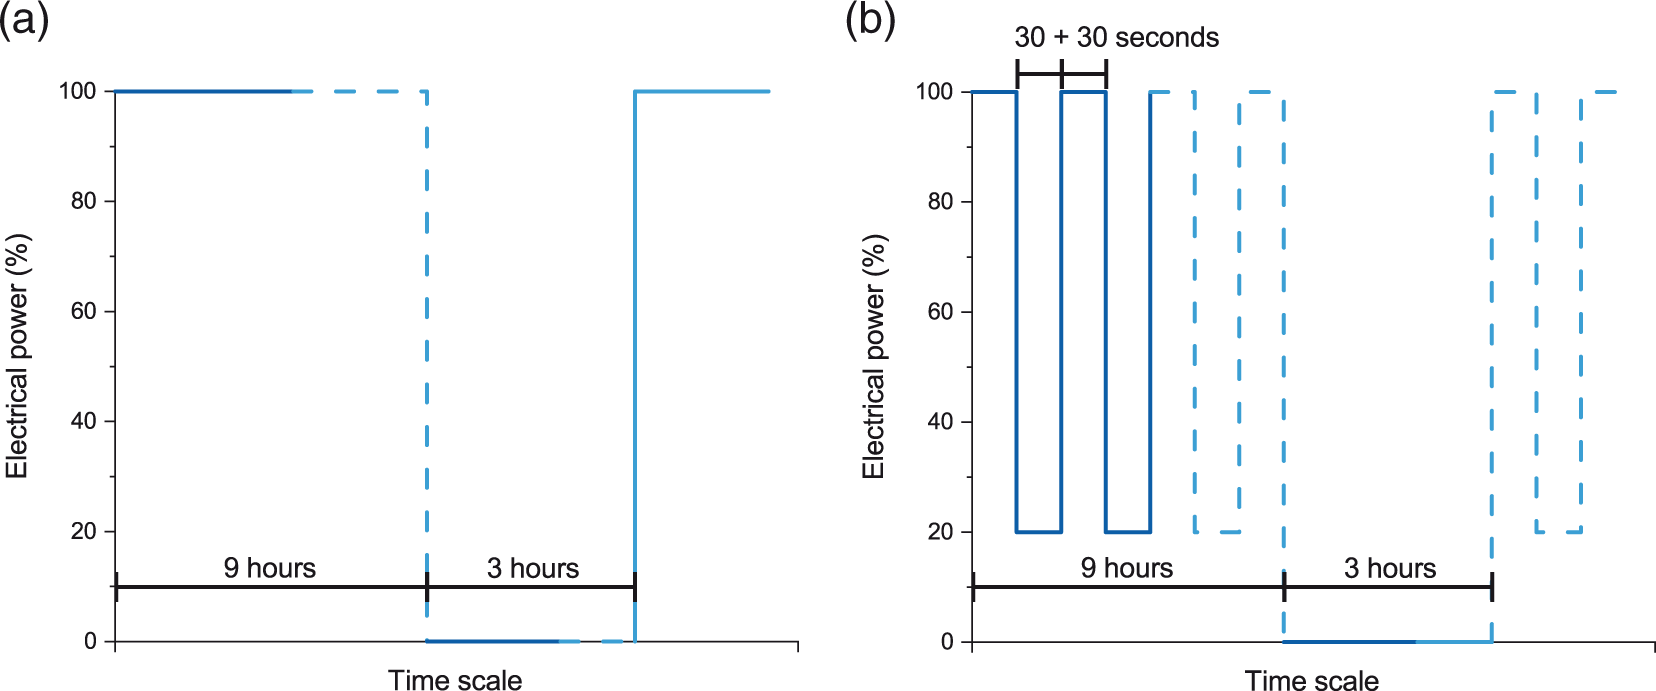
The 30 seconds + 30 seconds dimming interval is deliberately made fast compared to real life dimming cycles. It is assumed that 30 seconds is the minimum amount of time that the light should be set to full power. In this time, a vehicle with a speed of 50 km/hour travels 420 meters. The time with reduced electrical power was set to the same 30 seconds to maximize the number of dimming cycles during the ageing. The described 30 seconds + 30 seconds dimming interval totals 60 dimming cycles per hour and the calculated energy saving obtained with it is 40% of the total energy consumed by the similar luminaires under full power or natural ageing.
2.2. Temperature variation of the luminaire during ageing
The temperature variation of the luminaires was measured over the 30-second cycling periods. A temperature measurement probe was placed as close as possible to the LED chip, as shown in Figure 2. In the type A luminaire, the measurement probe was pushed next to the LED chip, as can be seen in Figure 2(a). With luminaire type B, the probe was placed under the lens array. Position of the measurement probe during the measurements of the temperature variation of luminaire (a) type A and (b) type B. In both luminaire types, the probe was positioned as close to the LED chip as possible. The blue probe is marked with red circle in both figures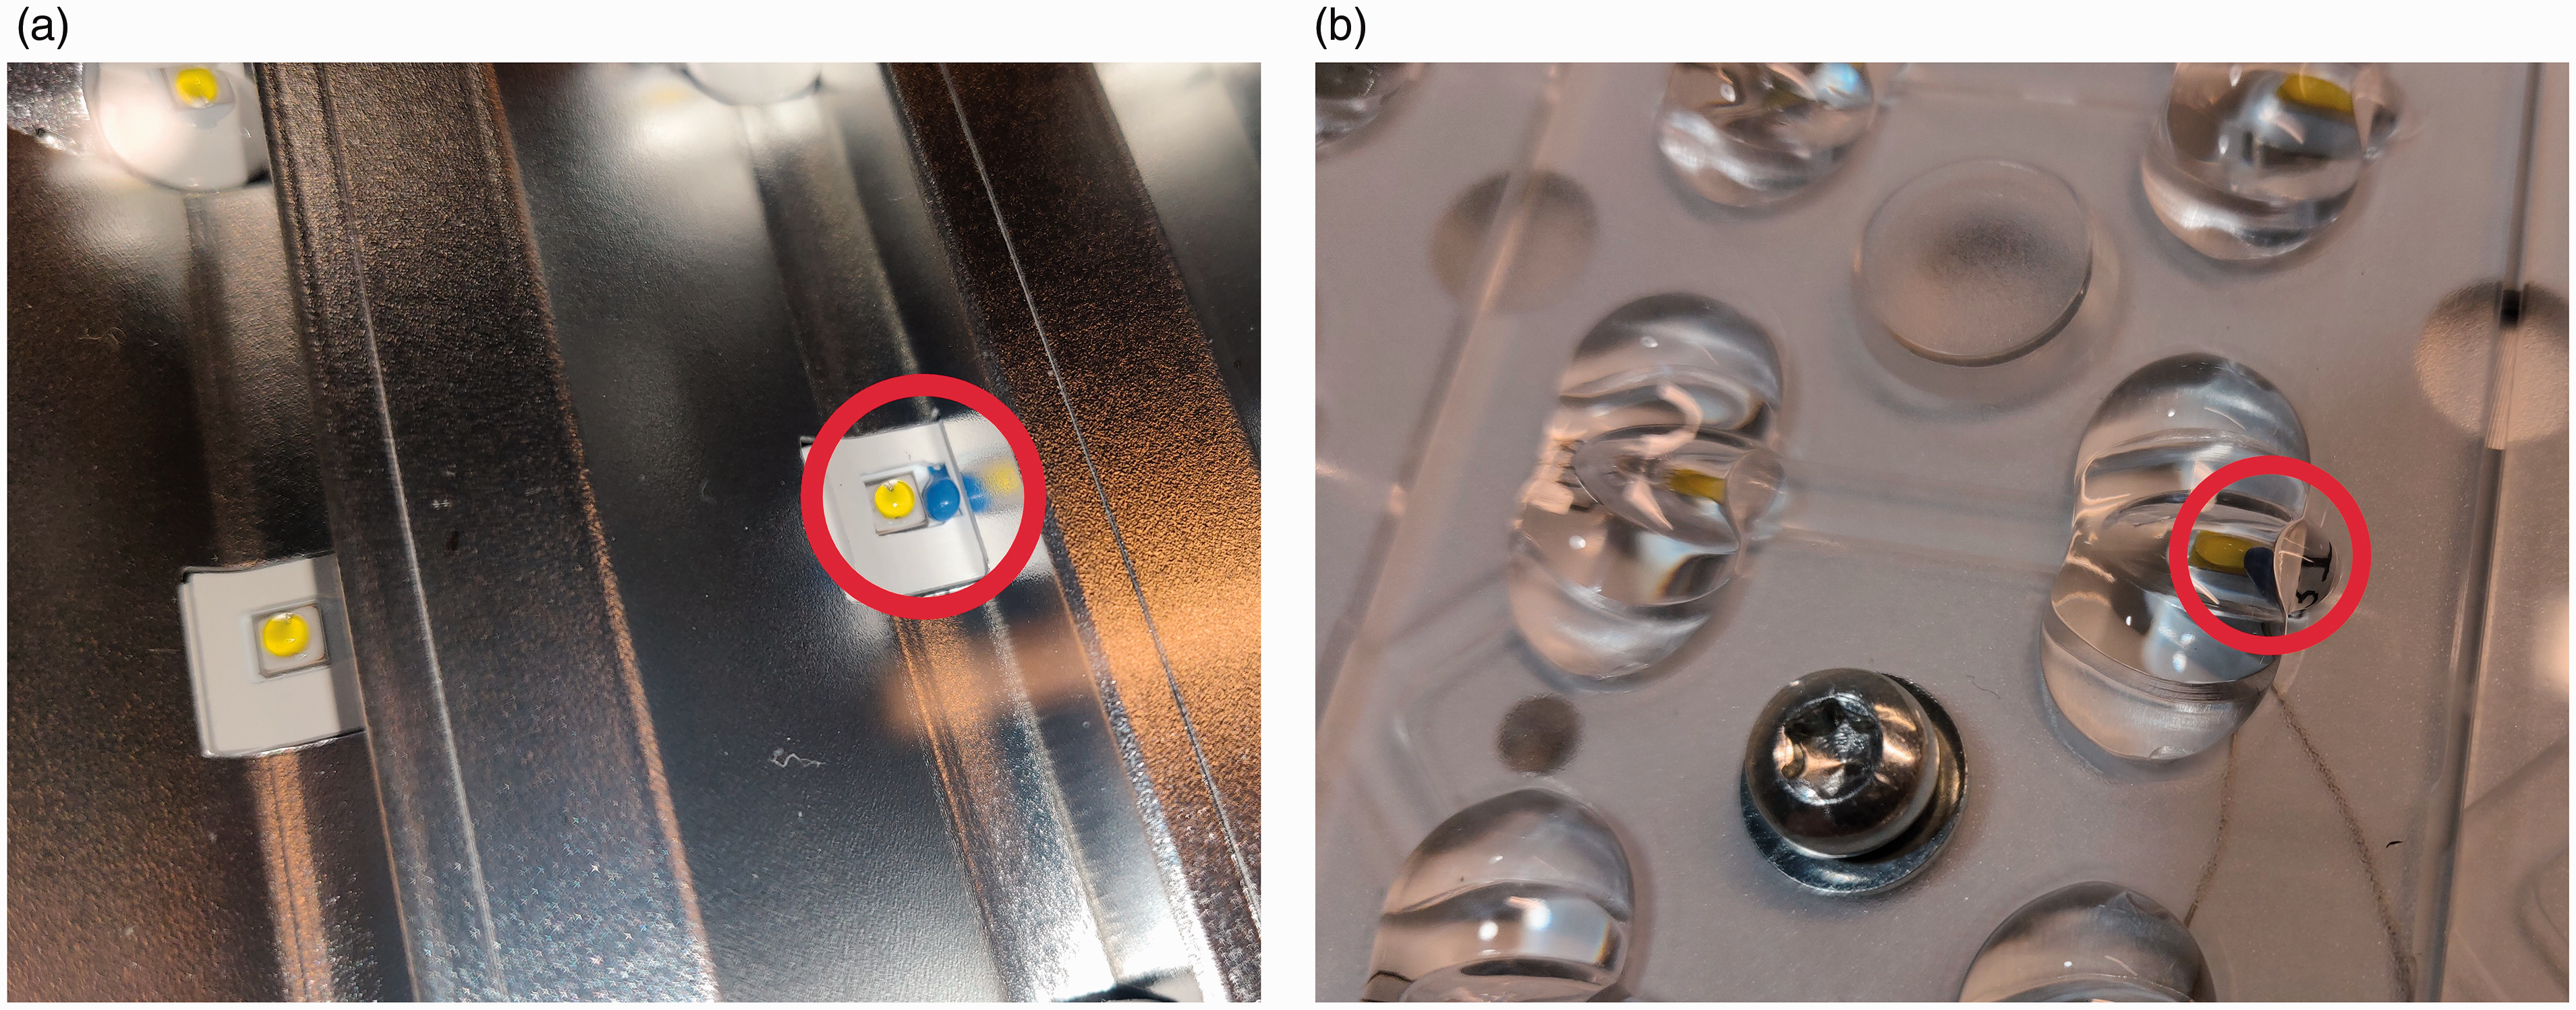
The temperature variations for the two lamp types were expected to be different, as the heat sink cooling the LED modules was located inside the outer shell of the luminaire type A, whereas for the type B luminaire, the outer shell acted as the heat sink.
The ageing cycle of 30 seconds + 30 seconds was chosen to maximize the thermal stress in the luminaire and especially in the LED module. Figure 3 presents the temperature variation next to the LED chip during the ageing cycle for both luminaire types. For the luminaire type A (brown dashed curve), the temperatures next to the LED chip were between 28.3 K and 31.6 K above the ambient temperature during the 30 seconds + 30 seconds intensive adaptive control cycle. For the type B luminaire (green solid curve), the temperature next to the LED chip cycles between 37.9 K and 59.1 K above the ambient. When leaving the power level to 20% for a longer period after the 30-second cycle, the temperature decreases by 0.9 K and 6.3 K for the type A and B luminaires, respectively. Temperature variations of the two luminaire types next to the LED chip during the 30 second control cycle and after decreasing the driving power to 20% for 1000 seconds. The temperature of the luminaire type A is presented with brown line and the type B with green line. Temperatures are given as differences from the ambient temperature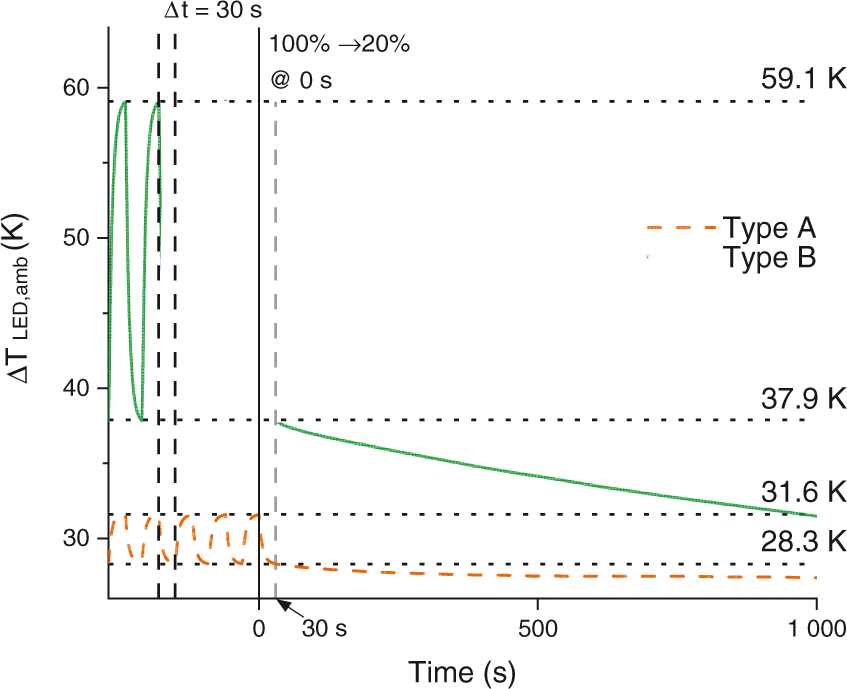
It can also be seen in Figure 3 that the slope of the temperature curve decreases significantly after the first 30 s. Thus, a high thermal stress within a given ageing time is achieved with the intensive 30 seconds + 30 seconds ageing cycle. If the luminaire would be a longer time either at 20% or at 100% power, the temperature changes would not increase significantly.
2.3. Measurements
The aged luminaires were measured periodically in an absolute integrating sphere setup28,29 for luminous flux, electrical power, and relative spectral radiant flux. The luminous flux response of the integrating sphere was calibrated before each measurement round. This procedure provides low uncertainty in the measurements, and thus accurate comparison of the results between different measurement rounds is possible over the period of five years. The uncertainty of the relative luminous flux measurements of the street luminaires is 1.4% at 95% confidence level with the given setup.
The spectral radiant flux of the luminaires was measured to take into account the spectral mismatch correction factor arising from the difference of the used calibration spectrum (Illuminant A) and the changing luminaire spectrum. The spectroradiometers used were calibrated against the national standard of the spectral irradiance. 30 The uncertainty of the relative spectral measurements is 3.5% at 95% confidence level within the photometric range between the wavelengths of 380 nm and 780 nm.
The luminaires were driven in the measurements with a stabilized AC power source with an output of 230 V. A dedicated power meter was used to measure the electrical current and voltage supplied to the luminaires. The uncertainty of the electrical measurements is 0.57% at 95% confidence level.
3. Results
3.1. Luminous flux and spectral radiant flux
The normalized luminous flux values of the luminaires are presented in Figure 4. For the first 15,000 operating hours, the luminous flux values increased. For both luminaire types, the luminous flux values of the group under intensive adaptive control increased by 1%–2% less than those of the groups aged using the full power mode. After approximately 15,000 hours, the luminous flux values started to decrease. The exact time when the increase turned into decrease was different for all lamp groups, but the maximum value of the luminous flux was obtained between the ageing times of 12,000 and 18,000 hours. Normalized luminous flux values of (a) type A and (b) type B luminaires. The luminaires aged using the full power mode are marked with circles and the luminaires under intensive adaptive control with crosses. The fitted exponential decay is marked with solid and dashed lines. A reference time of 15,000 hours was used for (a) and 23,000 hours for (b) in fitting. No fitting is presented for the type B power-cycled luminaires due to abrupt luminous flux decreases of four out of five luminaires. The measurement results of these type B luminaires are marked with arrows for the first occurrence and plotted in the inset figure between the time interval of 20,000 and 35,000 hours. Figures can be seen in colour in the electronic version of the article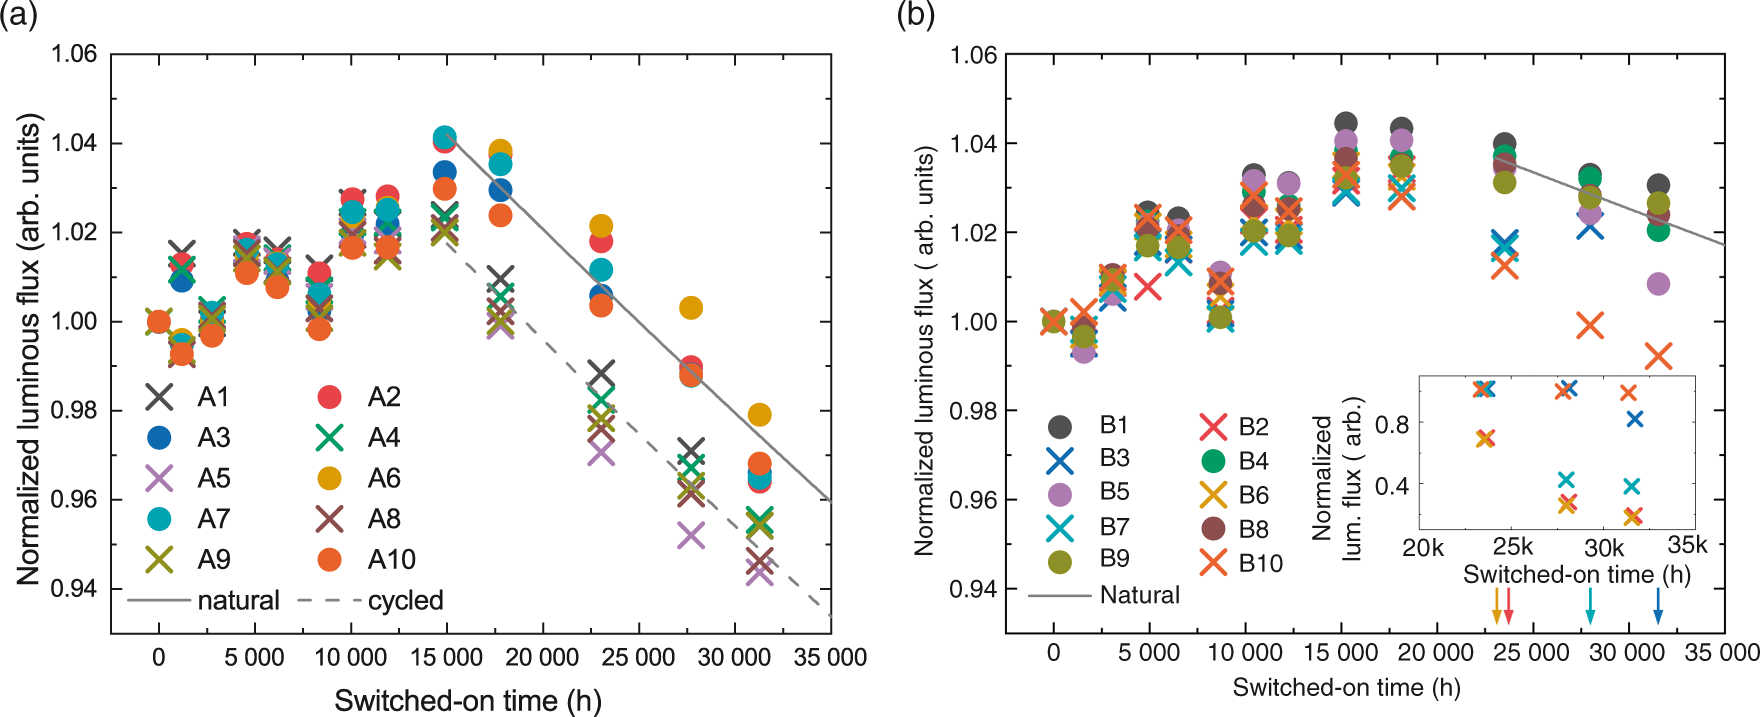
For type A luminaires, the slope of the decrease was similar for both ageing groups. For type B luminaires, the difference of the groups is remarkable. Luminaires under intensive adaptive control age faster. In the measurements at 23,000 hours, the luminous flux values of two of the five luminaires of type B under intensive adaptive control had dropped below 70% of their initial values. In the next measurement round, at 28,000 hours, these two luminaires had their luminous flux values dropped below 30% of their initial values and the third luminaire from the group had its luminous flux dropped to 42% of the initial flux. The luminous flux of the fourth lamp in this group reduced to 80% at 32,000 hours. Thus, only one of the lamps survived at high luminous flux level until the end of the experiment. After the abrupt luminous flux decrease of some luminaires, those specific luminaires were considered as broken down. In streetlight use, they should be replaced, even though for laboratory experiments, the luminaires still emitted light in the range of 10%–80% of the initial flux. Appendix 1 describes in more detail the failure mechanisms of the luminaires.
The normalized electrical power values of both luminaire types are presented in Figure 5. The electrical power consumed by the type B luminaires increased several percent at the measurement rounds before the breakdowns. This can also be seen clearly in the luminous efficacy values of the luminaires that broke down. The higher power levels were first measured for the luminaires under intensive adaptive control after 15,000 hours. After the slight increase of the electrical power, the luminaires still had about 10,000 hours of lifetime before the total failure. In type A luminaires, the power levels had declined by less than 1% during the operating time of 32,000 hours. Normalized electrical power values of (a) type A and (b) type B luminaires. The electrical power of type B luminaires increased up to 10% before the breaking of the LED panels. The luminaires aged under the full power mode are marked with circles and the luminaires under intensive adaptive control with crosses. Figures can be seen in colour in the electronic version of the article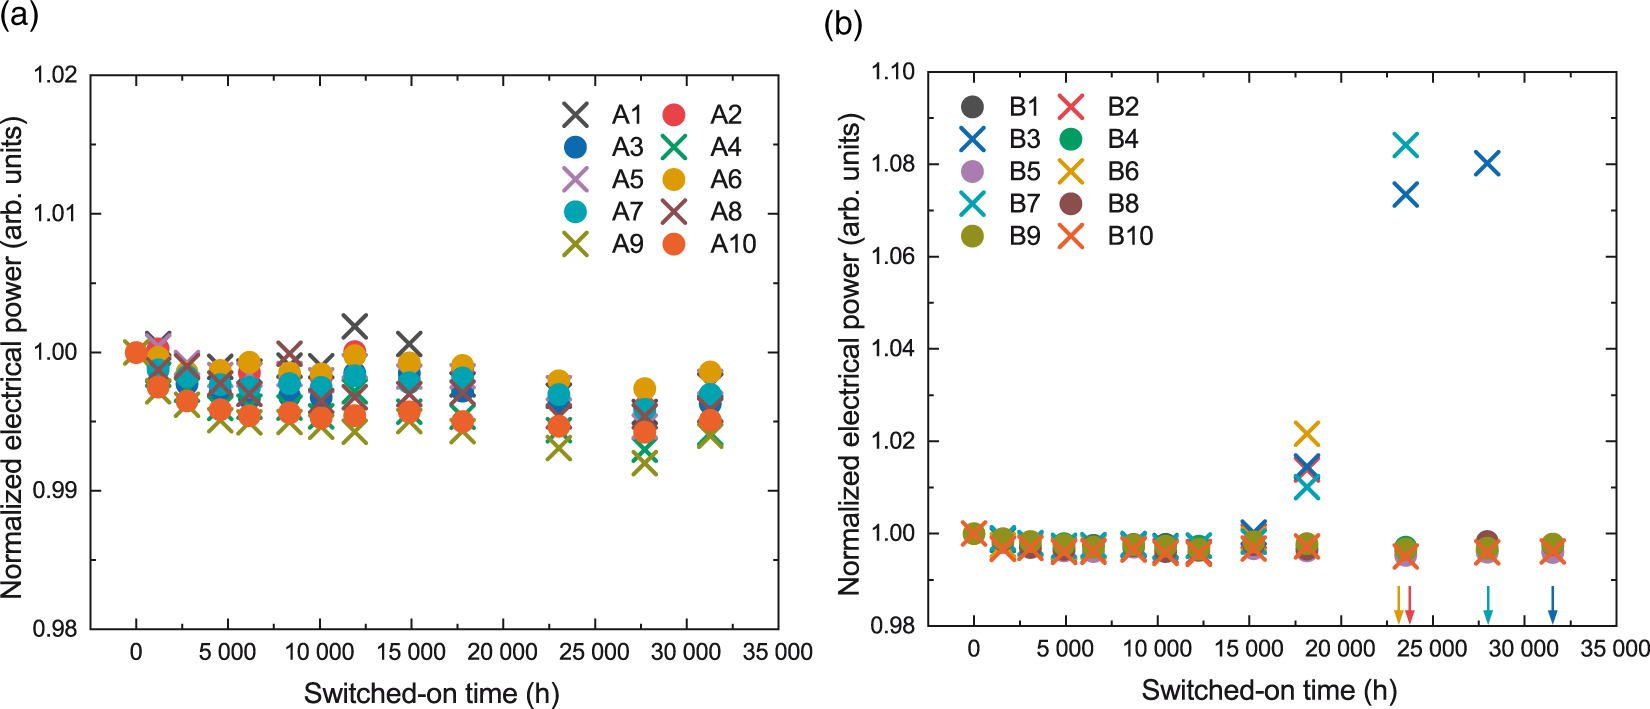
Figure 6 shows the spectral power distributions of both luminaire types normalized to one at the maximum of the blue peak. Due to the ageing, the relative height of the phosphor peak increases from the value of 0.79–0.89 for the type A luminaire during 32 000 hours of ageing. For the type B luminaire, the change is from 0.98 to 1.11. This change in the spectral distribution is the reason for a correlated colour temperature (CCT) change in the range of −100 K to −200 K for both luminaire types. After the abrupt reduction of luminous flux of some of the type B luminaires, the CCT values dropped by approximately 100 K. Initially the measured mean CCT values were 4040 K and 3970 K for the type A and B luminaires, respectively. Relative spectral distributions of one luminaire of (a) type A and (b) type B aged under the full power mode during the ageing period of 32,000 hours. The blue peaks of the spectra have not shifted on the wavelength scale during the ageing. The spectra are normalized at the maximum of the blue peak. In both figures, the spectrum with the lowest values close to 600 nm is for the first measurement round and with the largest values for the last round. The arrow in the figures presents the increasing ageing time. Figures can be seen in colour in the electronic version of the article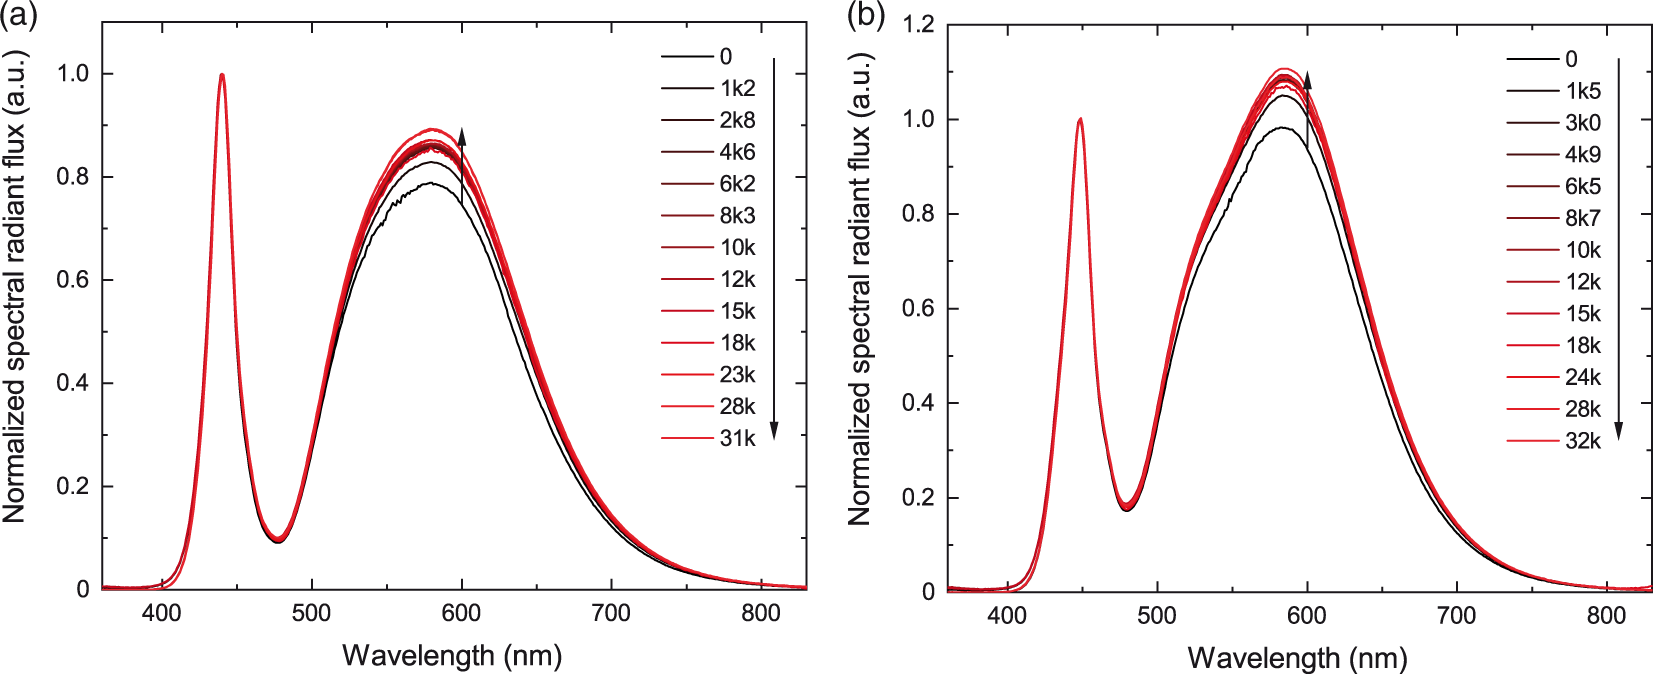
For type A luminaires under intensive adaptive control the relative height of the phosphor peak changed more than for the control group. For type B luminaires the changes in the peak height varied more than for the type A luminaires. After the abrupt reduction of luminous flux of the luminaires, the relative phosphor peak height decreased. Also, for the luminaire B10, that worked properly in the ageing under adaptive control, the peak height did not increase during the first 10,000 hours as much as that of the others in the same group.
3.2. Lifetime estimation of the luminaires
The lifetimes of the aged luminaires were estimated using an exponential decay function of type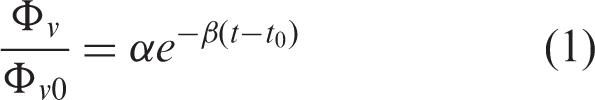
The average normalized luminous flux of Figure 4 of the properly working luminaires was used to obtain the fraction
The projected lifetimes at 80% of the initial flux (L80) of the type A luminaires under intensive adaptive control and under full power mode operation were 71,000 hours and 79,000 hours, respectively (see the solid and dashed lines in Figure 4(a)). It should be noted that the estimated lifetimes for the type A luminaires are more than 20% shorter than the lifetime (L80B10) specified by the manufacturer for both ageing groups. The average time shift between the ageing groups is approximately 6300 hours.
The average lifetime (L80) of the type B luminaires under full power ageing is 185,000 hours, as indicated by the solid line in Figure 4(b). Under intensive adaptive control, only one of the lamps survived until the end of the experiment. The projected lifetime of this lamp specimen would be 120,000 hours. As there is only one lamp specimen left, this value is considered too uncertain to make conclusions. The failed lamps have not been considered in this estimate, because it is likely that the intensive adaptive control has triggered a fault mechanism that would not take place otherwise. Due to the abrupt luminous flux decrease of the luminaires, the L80B10 lifetime of the type B luminaires under intensive adaptive control would at best be 23,000 hours, because at that time more than 10% of the luminaires had flux values below 80% of the initial values. In private discussions with the type B luminaire manufacturer, it was discovered that there have been problems with the LED panel type used in the luminaires aged in our research, and that the manufacturer has removed that LED panel type from use already in 2015.
4. Discussion
4.1. Number of dimming cycles and luminaire lifetime
For the first time, quantitative data on the effect of intensive adaptive control on ageing of luminaires is reported. Based on our ageing results, the possibilities in energy savings can be considered with respect to the lifetime estimations of the two different ageing methods used. Real traffic conditions on the adaptive control have been simulated by Lau et al. 4 for a typical pedestrian road in the UK with a speed limit of 30 meter/hour (approximately 50 km/hour). For 438 vehicles per winter day, the total number of dimming cycles per 16 hours of light-on time was approximately 120, corresponding to 7.5 dimming cycles per hour. It can be estimated that with higher density of vehicles the number of dimming cycles increases maximally by a factor of two, because the more frequent switch-on events in the night-time are compensated by increased clustering of vehicles during the rush hours. On the other hand, the 8-hour dark time of a summer day excludes the heaviest traffic and contains only 14% of the dark-time traffic on a winter day. 4 Thus, 7.5 dimming cycles per hour can be considered as a representative value over the year. The intensive adaptive control in our experiment has 60 dimming cycles per hour, a value eight times larger than expected to be induced by real traffic conditions.
Because the largest temperature change of the LED takes place within the first 30 seconds after changing the electrical power (see Figure 3), it is assumed that the number of the dimming cycles determines the additional ageing of the luminaire due to intensive adaptive control. The 30 seconds + 30 seconds dimming cycle between the power levels of 100% and 20% introduces maximal stress to the luminaires. The decrease of the lifetime of type A luminaires by the maximum stress is 10%. With the factor of eight lower rate of dimming cycles corresponding to the real traffic conditions as presented by Lau et al., 4 observation of the difference between luminaires aged under the adaptive control and under the full power mode would have required over 100,000 hours (15 years) of switched-on time for the type A luminaires.
The additional ageing introduced by the 30 seconds + 30 seconds cycling, calculated as the ratio of average luminous flux values of luminaires under the intensive adaptive control and under full power mode ageing, is presented in Figure 7. For the first 750,000 dimming cycles, the difference between the two different ageing groups of type A luminaires is below 0.6%. The largest effect of the intensive adaptive control is at 1,400,000 dimming cycles. For type B luminaires, the difference between the two ageing groups is seen at 300,000 dimming cycles that corresponds to 5000 hours with 60 cycles per hour and to 40,000 hours with 7.5 cycles per hour. Based on results of both luminaire types, it can be concluded that between one million and two million dimming cycles the adaptive control introduces an additional reduction of luminous flux from 1% to 3%. Ratio of average luminous flux values of luminaires under intensive adaptive control and under full power mode ageing for both luminaire types as a function of the number of dimming cycles. The last three points of type B luminaires are marked with plus signs due to smaller number of specimens used in the calculation after some of the luminaires experienced an abrupt decrease in luminous flux. N is the number of luminaires in the ageing group under intensive adaptive control used for the calculation of the ratio. Error bars denote the standard deviation of the ratios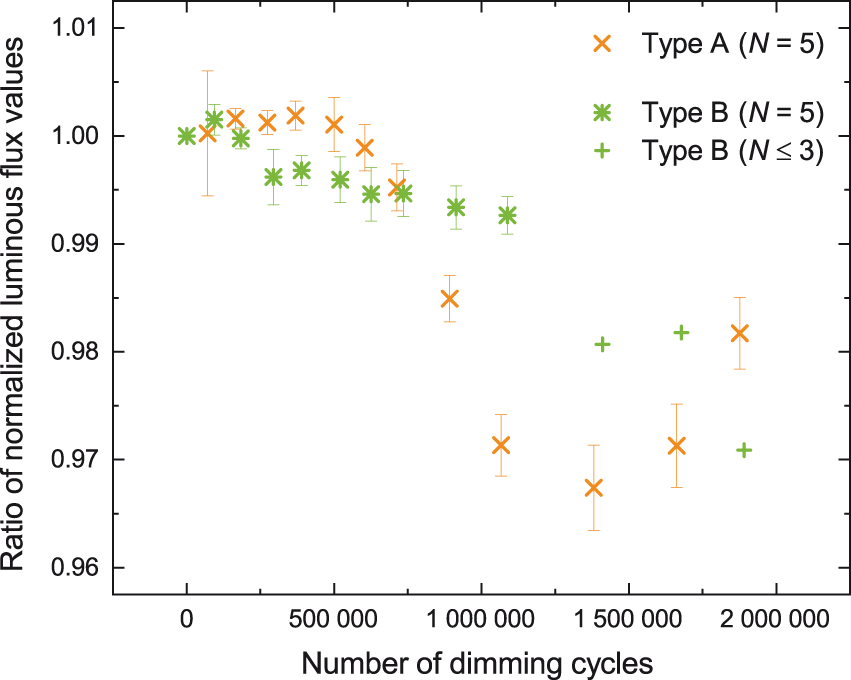
Figure 8 presents the normalized luminous flux values of luminaires under full power mode ageing and under adaptive control in representative traffic conditions corresponding to those presented by Lau et al.
4
By assuming that the number of dimming cycles is the main cause of additional ageing of the luminaires under the traffic-aware control, the fitted curve of the full power mode ageing presented in Figure 4 is multiplied by an ageing factor. The ageing factor is calculated at each switched-on time from the ratios of Figure 7 using real traffic conditions where the average number of dimming cycles per hour is 7.5. It is estimated that the predicted L80 lifetime is below 0.6% for type A luminaires, if they are operated under the traffic-aware control conditions with less than 750,000 dimming cycles. For type B luminaires, the difference between the two lifetime estimations is approximately 3500 hours. The operating time of the type B luminaires would be 135,000 hours before reaching the critical amount of dimming cycles that started to introduce abrupt flux reductions of the luminaires. It can be concluded that the realistic amount of dimming cycles has at the largest a 2% effect on the lifetime when compared to the full power mode ageing. Predicted normalized luminous flux values of both luminaire types: (a) type A and (b) type B, under full power mode ageing (solid line) and the ageing with 7.5 dimming cycles per hour. The last three points for luminaire type B are marked with plus signs to show that a smaller number of specimens was used when calculating the effect of dimming cycles. The dotted line in (b) is extrapolated without using the last three points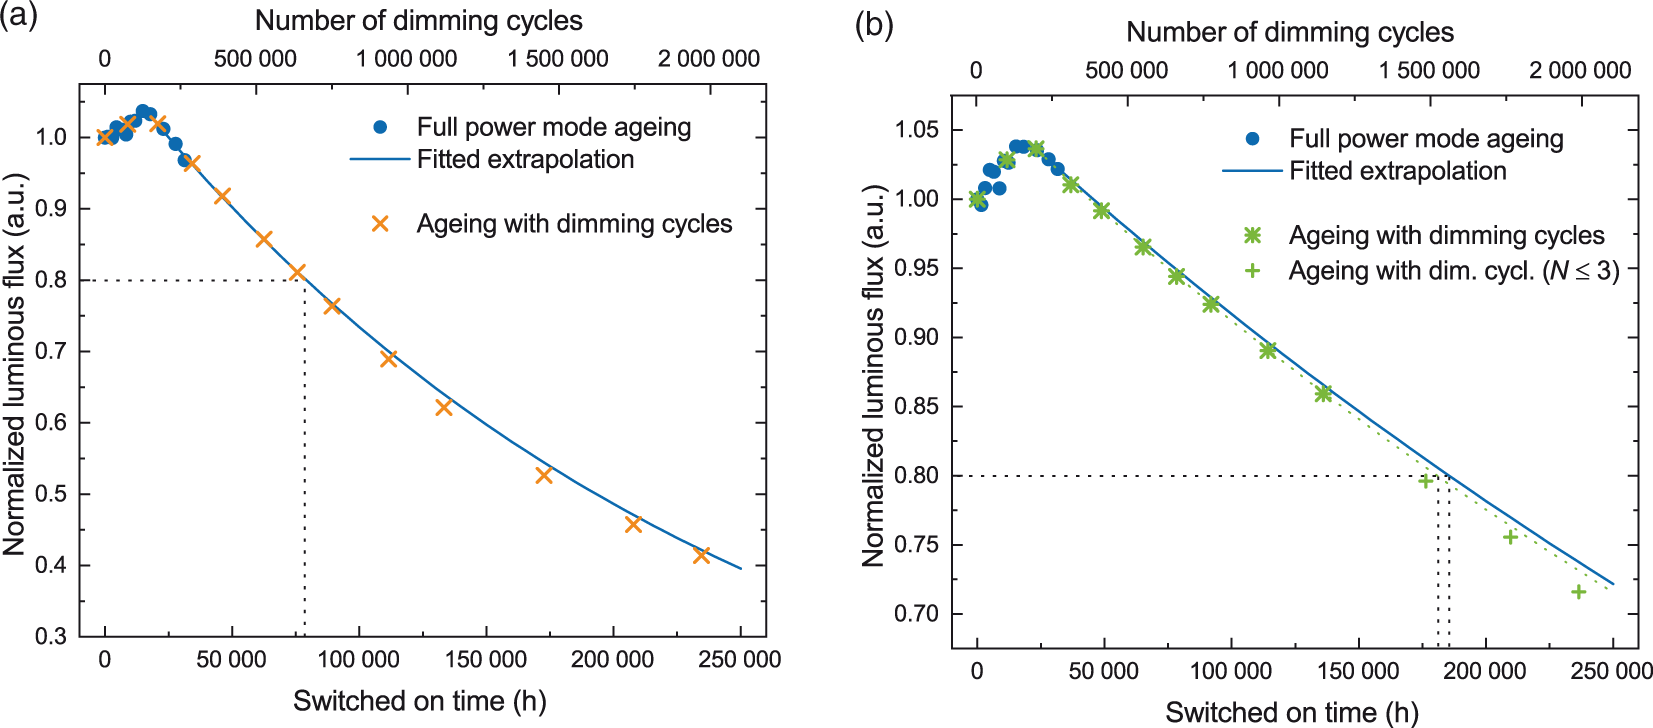
4.2. Energy savings and lighting costs
The net effect of traffic-aware lighting control on the total costs is determined by the decreased energy costs and the increased maintenance costs due to potentially reduced luminaire lifetime. In 2016, Tähkämö et al. 5 estimated the lifecycle costs of LED based streetlights. By varying the electricity prices, need for spot replacements, LED luminaire price evolvement, LED luminaire lifetime and the LED luminaire modularity, the energy costs over a 30-year period were estimated to be from 29% to 45% of the total lifecycle costs of the street luminaire installations established in 2013. The United States Department of Energy has predicted that the price of the LED luminaires for lighting for area and roadway purposes will decrease by 50% of the price in 2017 by the year 2025. 8 It has also been estimated that the energy savings with traffic-aware lighting can be from 35% up to 60% when compared to the situation with conventional time based controlling,4,31 similar to what was used as the full power mode ageing in our experiment.
We assessed the impact of the traffic-aware lighting control on investment and operational costs by taking into account net present value (NPV) estimation with discount rates of 0% and 3%. The values utilized by Tähkämö et al. 5 in their life-cycle analysis for the base scenario of LED luminaires were used as the starting point for the NPV calculation. The 16-year forecast 8 of LED price reduction from 2019 was used to estimate the lifecycle costs for an installation established in 2025. It was assumed that approximately 30% of the initial investment costs were fixed costs including, e.g., the cost of installation work. As the luminaire prices decrease, the relative share of the fixed costs increases, and thus for the installations carried out in 2025, the fixed costs are close to 45%. For yearly spot replacements, the fixed costs were estimated to be twice as large for each replaced luminaire, bringing the share of the fixed costs in the spot replacements to 62% in 2025. The fraction of yearly spot replacements is estimated to be 1% of the installed luminaires. It is further assumed that the luminaire replacement costs are inversely proportional to the luminaire lifetime. For an average switched-on time of 11 hours per night, the yearly switched-on time is 4000 hours, and the lifetime of the conventionally controlled luminaire is assumed to be 50,000 hours (12.5 years of calendar time). The calculations were done for a case where the energy prices remain unchanged during the 30-year estimation period. Extra costs caused by the implementation of the traffic-aware lighting control were not considered.
Having the assumptions presented above, an average energy saving of 50% and a luminaire lifetime decrease of 2%, both introduced by the traffic-aware control, decrease the total lifecycle costs by 25% and reduce the share of the energy costs from an initial 52% to 34% of the total lifecycle costs for a street luminaire installation established in 2025, if a discount rate of 0% is used. With a discount rate of 3%, the total lifecycle costs of the traffic-aware lighting control are 24% smaller than those of the conventional time-based controlling.
Based on our results on the impact of the adaptive controlling on the luminaire lifetime, traffic-aware control shortens the luminaire lifetime at most 2% in a realistic traffic scenario. Taking into account all lifetime costs of the installation, the effect of the lifetime decrease on total costs is 0.7% or 0.6% with discount rates of 0% or 3%, respectively. Thus the advantages of the energy savings due to the traffic-aware control outweigh the lifetime decrease. The energy and cost savings of traffic-aware control are highest with a moderate amount of traffic, because safety reasons may not require street lighting at roads with very low number of vehicles whereas roads with continuous night-time traffic should be all the time illuminated in any case.
5. Conclusions
Energy efficient LED technology facilitates active control of luminaires, where lights are dimmed when there are no vehicles or pedestrians in the vicinity, enhancing further the energy saving. Our measurements indicate that the traffic-aware control of luminaires causes additional stress to the LEDs they are composed of and, in the worst-case, results in premature malfunction of the luminaires. However, with properly constructed LED luminaires, the costs of the reduced lifetimes due to traffic-aware operation are exceeded by the cost savings in energy.
We studied ageing of two luminaire types for 5 years, half of the lamps under intensive adaptive control, and half as a reference group mimicking simple time-based control with full power during the operational period. The luminaires under intensive adaptive control were noticed to decrease in luminous flux faster than the reference group. The estimated lifetimes of the luminaires of type A were observed to decrease by 10% as compared with the reference group. These results were projected to a more realistic traffic control situation. In this simulated case, the decrease of the expected lifetime of the installation would be 2% for type B luminaires. For type A luminaires, the reduction would be smaller, ≤0.6%.
The estimated lifetimes of the type A luminaires were 20%–30% shorter than the lifetimes specified by the manufacturer. For type B luminaires, the estimated lifetimes would be larger than those presented by the manufacturer, but this luminaire type had problems with premature malfunction under intensive adaptive control. The lifetimes of the latter luminaires were only 23,000 to 32,000 hours. Measurements revealed that before the abrupt decrease of the luminous flux of type B luminaires, the electrical power consumed by them increased by 10% during the preceding operation period of 10,000 hours.
Although the type B luminaires experienced abrupt reductions of luminous flux early in the experiment, they still provided useful information on the ageing as a function of the number of dimming cycles. The obtained data allowed estimation of their performance in a realistic traffic-aware control situation. The temperature variation in the LED luminaires due to the cycled power was found to decrease the lifetime of both studied luminaire types. The luminaire manufacturers should consider the effects of temperature variations due to the cycled power when designing luminaires for smart lighting applications.
The net effect of the decreased lifetimes and the energy savings due to the traffic-aware lighting control were estimated by using a net present value estimation for a lighting installation with 12.5-year interval for luminaire changes. The potential of the energy saving due to the traffic-aware controlling is 25% of the total costs, as compared to the situation with time-based control only. Changing the discount rate from 0% to 3% reduces the energy saving potential from 25% to 24%. The lifetime reduction of 0%–2% was found to increase the total costs by 0%–0.7% which is outweighed by the energy saving potential.
We conclude that the effect of adaptive or smart control in energy savings exceeds the cost of the decreased lifetime and it is helpful for meeting future energy saving targets. The possibility for traffic-aware control should be implemented especially in new LED streetlight installations at roads with non-continuous traffic.
Footnotes
Acknowledgements
We thank Johannes Oksanen, Minna Santaholma, Benjamin Oksanen, and Olli Kantamaa for the measurements of the luminaires during the five-year ageing period and Eino Tetri for the discussions on suitable dimming cycles.
Declaration of conflicting interests
The authors declared no potential conflicts of interest with respect to the research, authorship, and/or publicatiSnoron of this article.
Funding
The authors disclosed receipt of the following financial support for the research, authorship, and/or publication of this article: Aalto University Energy Efficiency Research Program (AEF) and by the Academy of Finland Flagship Programme, Photonics Research and Innovation (PREIN), decision number: 320167.