
Abstract
Obstacle detection and facial emotion recognition are two critical visual tasks for pedestrians. In previous studies, the effect of changes in lighting was tested for these as individual tasks, where the task to be performed next in a sequence was known. In natural situations, a pedestrian is required to attend to multiple tasks, perhaps simultaneously, or at least does not know which of several possible tasks would next require their attention. This multi-tasking might impair performance on any one task and affect evaluation of optimal lighting conditions. In two experiments, obstacle detection and facial emotion recognition tasks were performed in parallel under different illuminances. Comparison of these results with previous studies, where these same tasks were performed individually, suggests that multi-tasking impaired performance on the peripheral detection task but not the on-axis facial emotion recognition task.
1. Introduction
Lighting for subsidiary roads is designed to meet the safety and perceived safety requirements of pedestrians. 1 Caminada and van Bommel 2 suggested that obstacle detection and evaluation of other people are critical tasks for pedestrians, and this is supported by a study using eye tracking to record pedestrians’ gaze behaviour.3,4 Experimental research has therefore been carried out to investigate how the performances of these tasks are affected by changes in road lighting characteristics.
Past studies investigating the effects of illuminance and SPD on the detection of peripheral obstacles
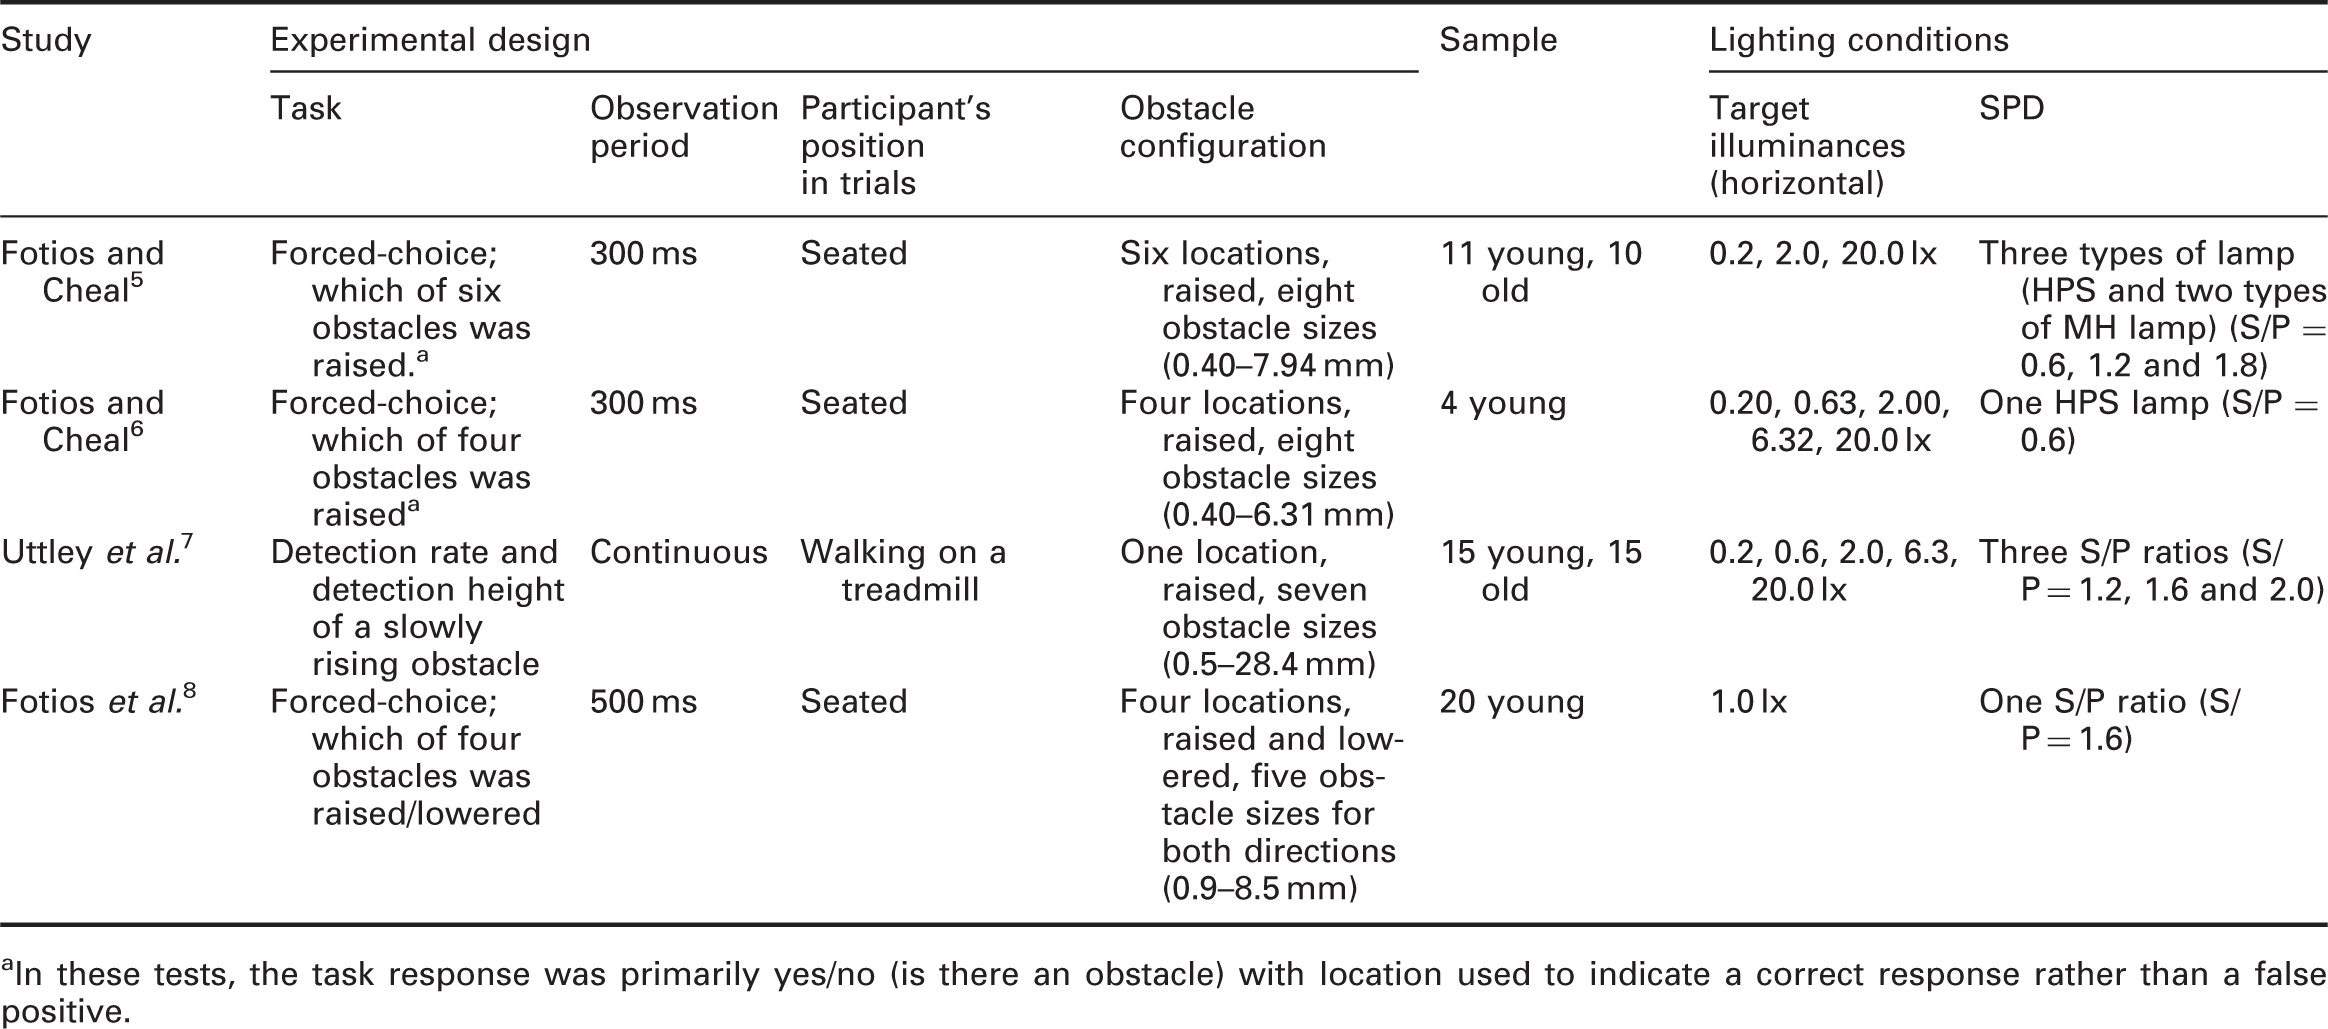
In these tests, the task response was primarily yes/no (is there an obstacle) with location used to indicate a correct response rather than a false positive.
Past studies investigating the effects of luminance and SPD on facial emotion recognition (FER)
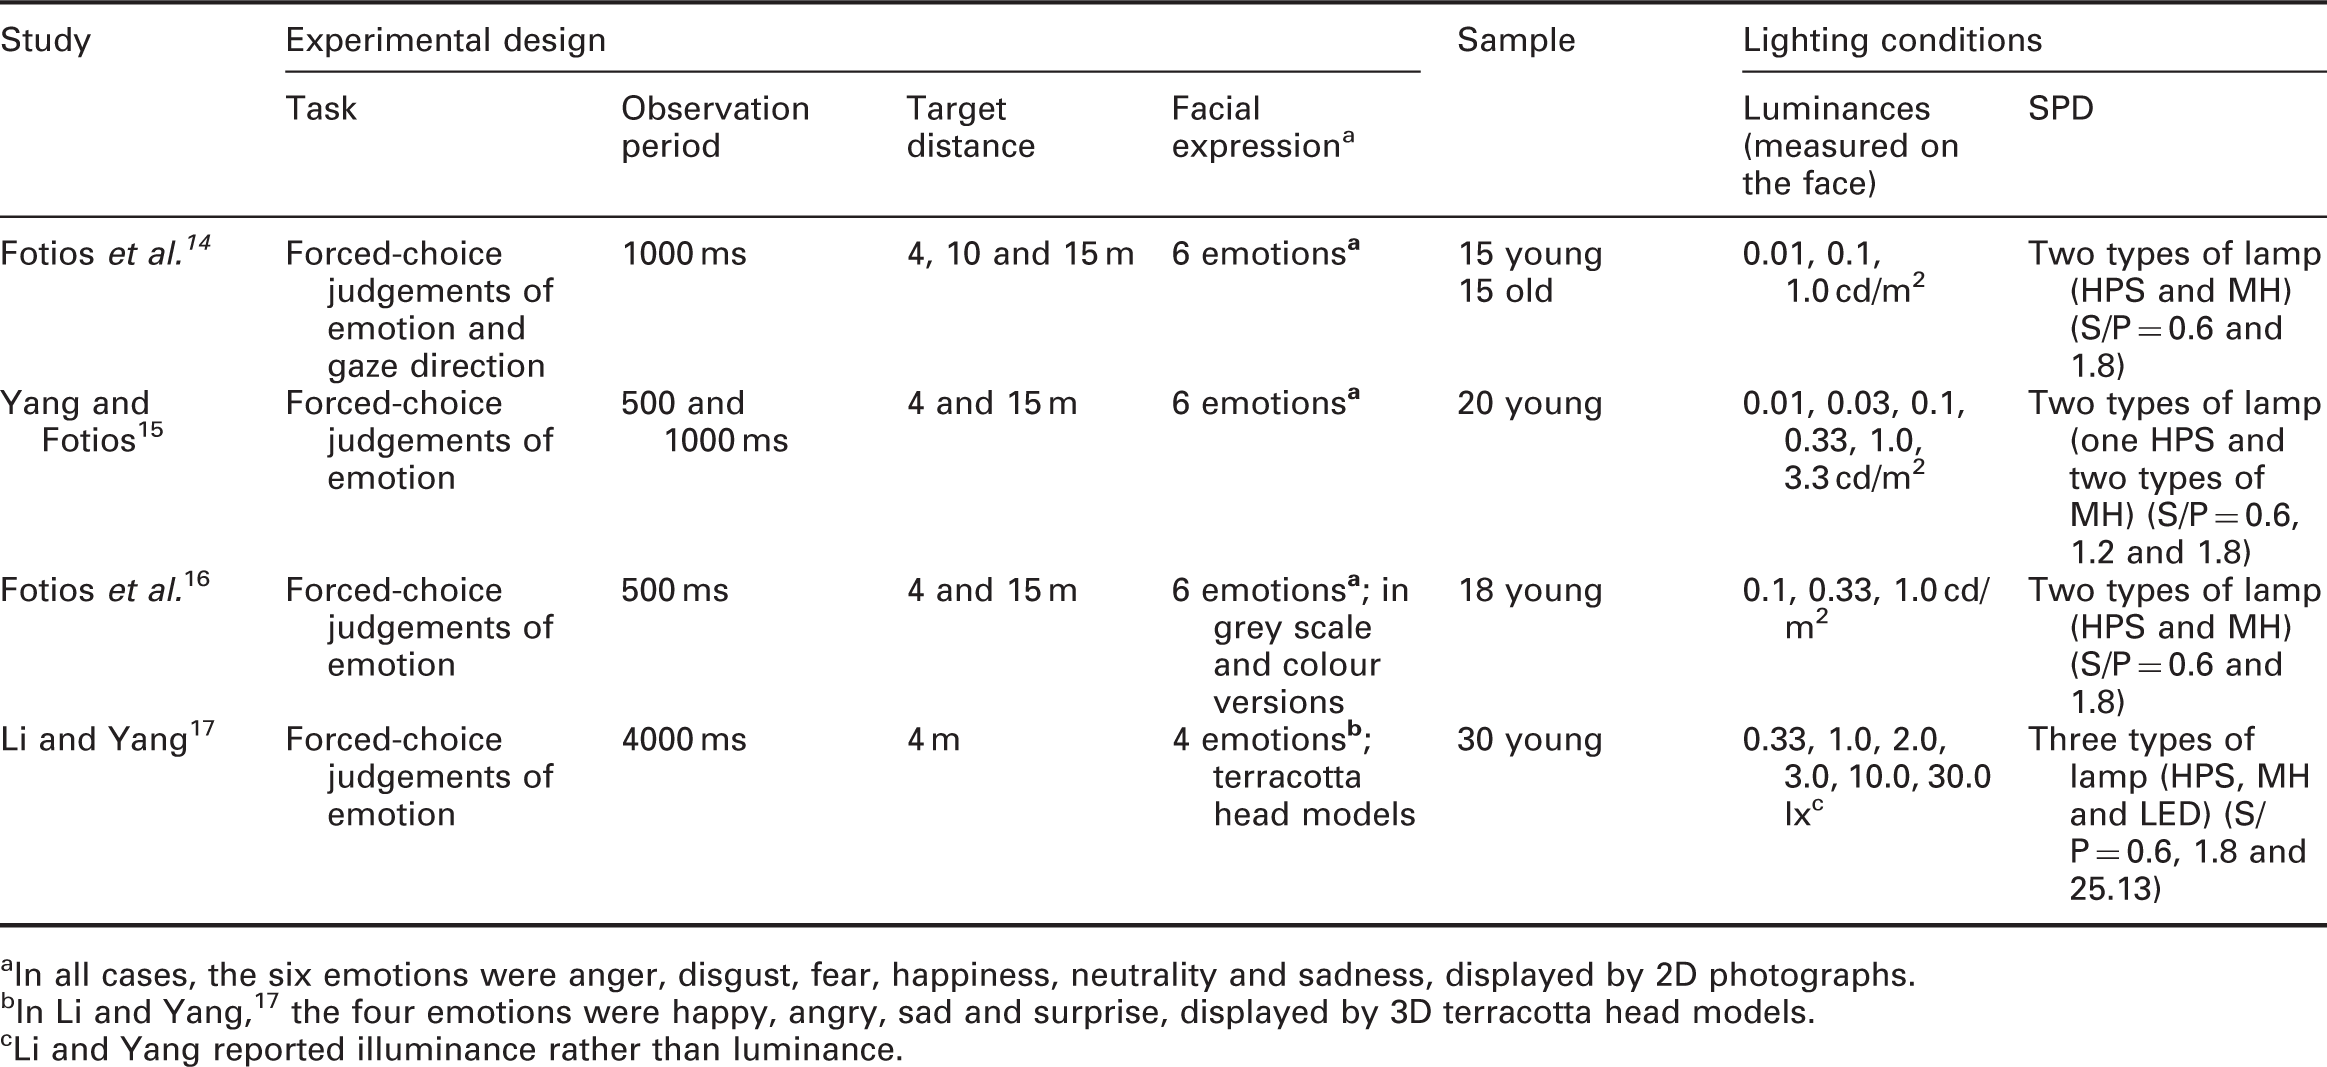
In all cases, the six emotions were anger, disgust, fear, happiness, neutrality and sadness, displayed by 2D photographs.
In Li and Yang, 17 the four emotions were happy, angry, sad and surprise, displayed by 3D terracotta head models.
Li and Yang reported illuminance rather than luminance.
While the results of FER studies tend to follow an escarpment–plateau relationship, for the typical interpersonal evaluation distance of 15 m performance at 3.33 cd/m2, the highest luminance used in these trials, 15 did not suggest the plateau had been reached. Whilst this, or higher luminance on the face might improve FER performance, it also raises the likelihood of glare, and thus optimal FER performance may be an unrealistic expectation. Therefore, an optimum luminance of 1.0 cd/m2 was proposed for 50% correct identification rate when observing at 15 m distance. 13 For FER at 10 m distance, a luminance of 1.0 cd/m2 was suggested to be optimal, 14 and at 4 m distance this was 0.33 cd/m2. 15
There are at least two limitations in these past studies. One limitation, associated with the FER studies, is that the targets being evaluated were 2D images of faces, these being photographs of actors displayed on a screen. Recognition accuracy is expected to increase when 3D information is available. 18 However, merely exchanging a 2D image for a 3D model is unlikely to be of benefit as a static 3D face observed from a fixed viewpoint presents the same visual target as a 2D image of that same scene with the same lighting.
The second limitation is that past studies measured performance whilst instructing test participants to focus on one specific task. In natural situations, pedestrians are involved in multiple parallel tasks which reduces their attention toward any one task. Attention is the information processing capacity of an individual: attention capacity is limited and each task being performed requires a proportion of that capacity 19 which means that when two tasks are performed concurrently, the performance on one or both tasks is therefore expected to be reduced if the available attention is insufficient. 20 Multi-tasking has been used in two studies related to driving. Bullough and Rea 21 considered peripheral target detection in parallel with performance on a video driving game: they comment on the effect of changes in lighting but not the effect of multi-tasking on individual task performance. Fotios et al. 22 considered detection of peripheral targets with simultaneous distraction tasks: they found a significant increase in reaction time to detection and a significant increase in missed targets in trials with distraction compared with a distraction-free control trial, but did not consider the effect of changes in lighting. The effect of multi-tasking on those tasks pertinent to pedestrians is unknown.
This paper reports two experiments carried out to investigate the implications of multi-tasking for two typical visual tasks of pedestrians, FER and obstacle detection. 3D face models were used to promote ecological validity but their static position and the absence of variation in light source position means that their use is not expected to be of significant advantage over 2D targets. The two experiments followed a similar procedure but with variations in levels of the independent variables.
2. Method
2.1 Apparatus
The test booth (Figure 1) was that used in previous work investigating obstacle detection.
8
The floor contained a series of cylinders, normally flush with the floor surface, which could be raised or lowered to represent a pavement obstacle. Faces were presented above the rear wall at eye level. Side section through the apparatus. Note, LED1 not used in the current work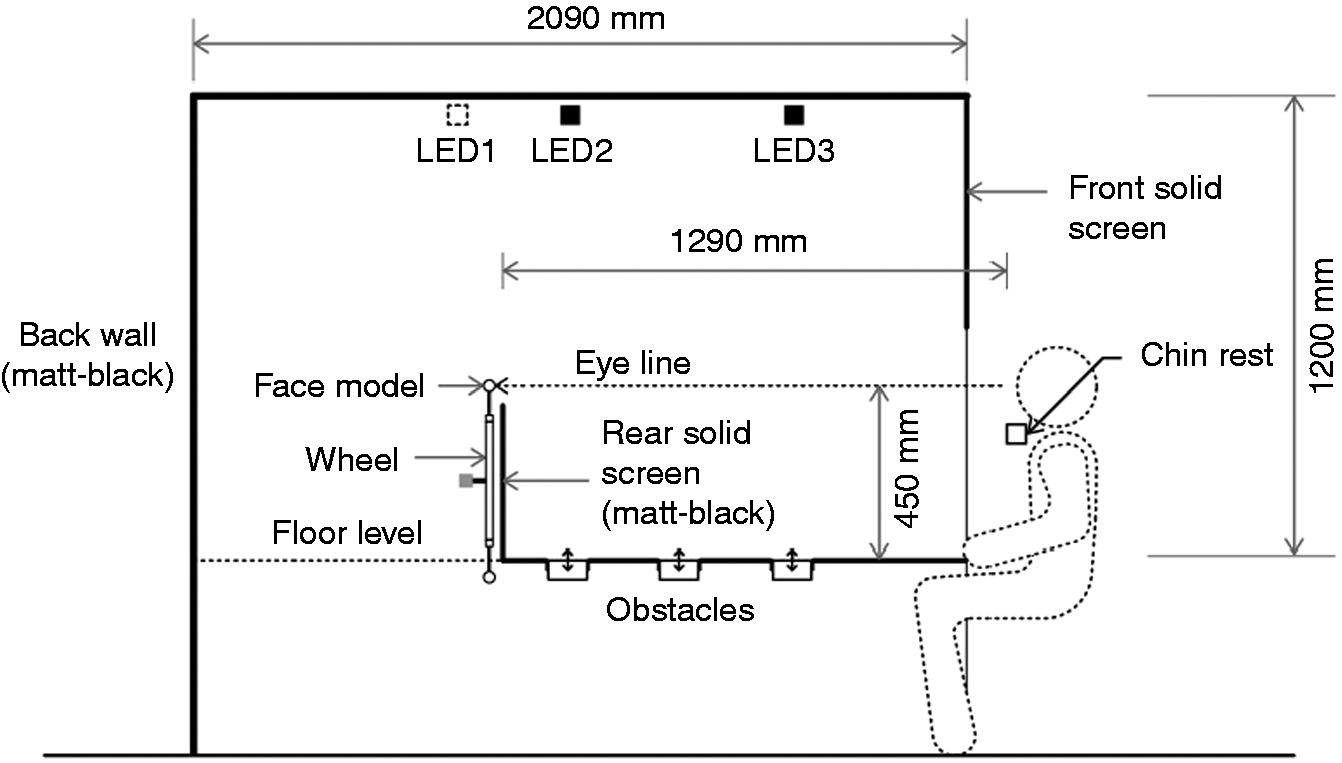
The visible space inside the booth was of dimensions 1200 mm deep, 1200 mm wide, and 1200 mm in height, constructed from medium-density fibreboard (MDF). Visible vertical surfaces (side and rear walls) were matt black. The floor surface, upper and sides of the obstacles and inner surfaces of the tubular housing of each obstacle (which became visible when an obstacle lowered) were matt grey (Munsell N5, reflectance 0.2).
The faces were cast models of human faces. 23 These were fixed to a wheel (diameter = 800 mm) with 16 posts, installed behind the rear wall of the booth. The wheel was rotated by a servo motor, with rotation controlled to present a specific (or no) face for a given trial. The rear wall ensured that the observer could see only one target face, with the remainder hidden. The horizontal distance from the observation point to the face was 1290 mm.
The light sources were tuneable arrays of RGBW LEDs, identical to those used in previous work
8
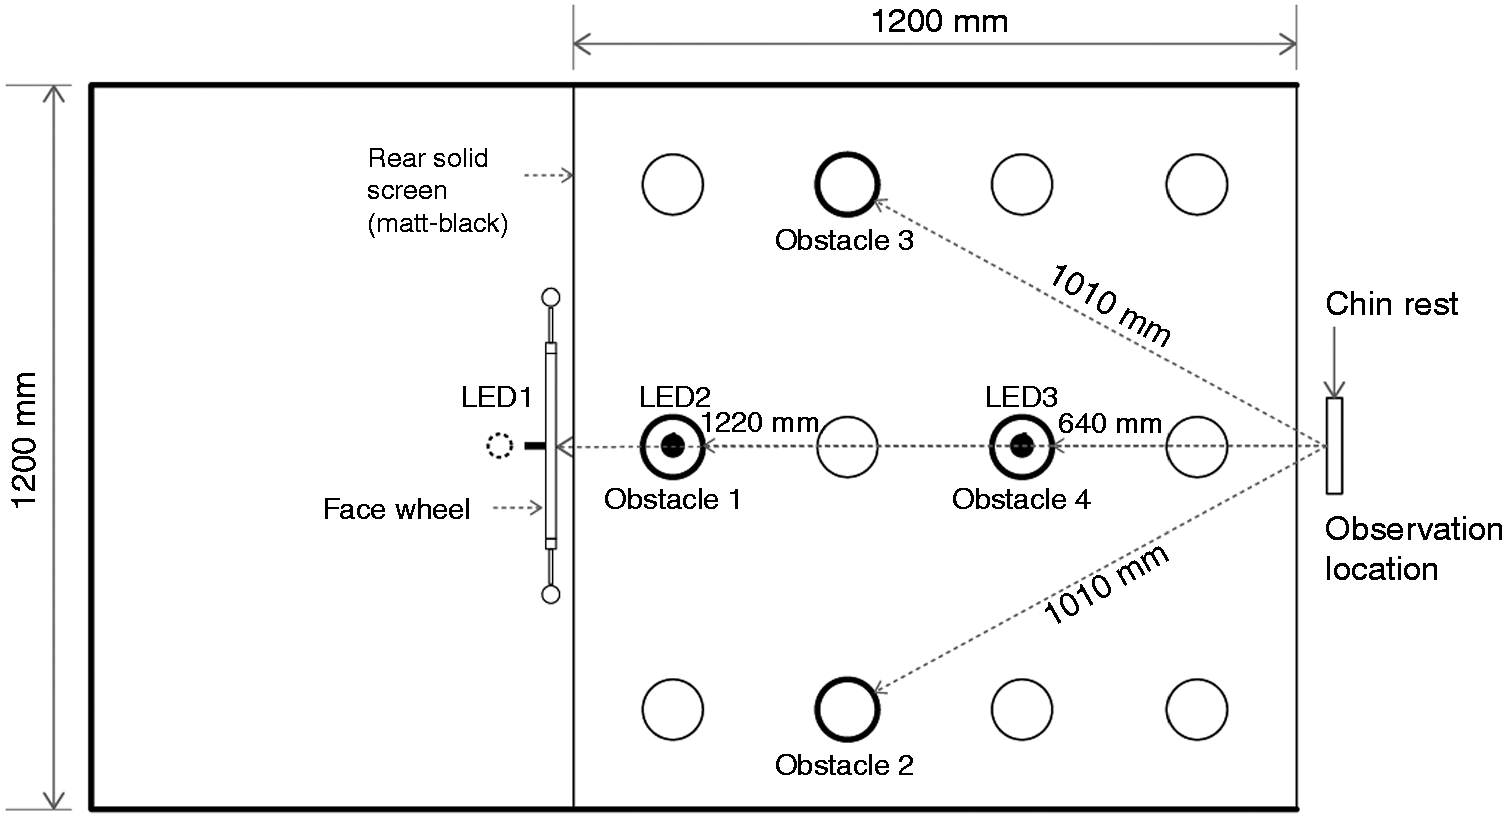
installed along the central line at three positions (Figure 2). In the current experiments, only LED2 and LED3 were used, and were used simultaneously in all trials. A vertical black screen above the participants’ eyes blocked direct view of these light sources from the observation position. Plan view of apparatus. Note: (i) In experiment 1 all four obstacles were used; in experiment 2, obstacle 4 was not used. (ii) LED1 was not used in the current work but labelled here for consistency with previous work.
8
Light source SPD was not varied in the current work. According to previous studies, it was expected that variation in S/P ratio would influence obstacle detection at horizontal illuminances ≤0.2 lx,5–7 but variation in SPD would not affect recognition of facial expression at any light level.14–16 The SPD used in this work had an S/P ratio of 1.6 (correlated colour temperature (CCT) = 2750 K, chromaticity x = 0.47, y = 0.41), chosen as the middle of the three levels used in previous research on obstacle detection. 7
In trials the scene was observed for 500 ms, this being controlled using a pair of visual occlusion spectacles. 500 ms is the typical duration of fixation on other people.11–13 Rather than investigate the effect of changes in observation duration, this single period was chosen to provide a degree of ecological validity. It was also the duration used in some previous studies of FER (see Table 2) and obstacle detection (Table 1) which aids comparison with those studies. In the open state, the spectacles allowed participants to look into the interior of the booth as if wearing normal clear glasses. In the closed state, details of observed scene could not be resolved but the lenses still transmit light as frosted glass.
The faces were 1:6 scale models of human heads, cast in light flesh-coloured resin. The face models have a luminance reflectance of 0.78 (see below for discussion of variation in skin tone). The visibility of facial features, facial contrast, is typically characterised using Michelson contrast for the mouth, brow and/or eye regions.24,25 The current models exhibited a mouth contrast against the chin of 0.10; this is similar to the mean Michelson contrast of 0.12 calculated for the 151 Caucasian faces used by Russell. 25 However, note that luminance contrast for these models was a function of illumination geometry rather than variation in the reflectances of facial features. The vertical height of the face models from chin to the top of the head was approximately 36 mm and was viewed from a distance of 1290 mm. This configuration resembled a viewing distance of 10 m for a real-size head of height 216 mm, shorter than the suggested distance of 15 m due to apparatus constraints, 13 which was also one of the distances used in previous work. 14 When a face was rotated to the exposed position, 12 o’clock on the wheel, it was at the same height as the observer’s eyes. A chin rest was used to maintain a constant viewing position.
There were 11 different face models, varying by the emotion portrayed by facial expression (4 neutral, 4 happy, 1 sad and 2 angry) as shown in Figure 3. The models were fixed on radial posts of the wheel, positioned to face directly towards the observer during trials. Five posts of the wheel were left empty and were used for null condition trials. Photographs of the 11 face models. These photographs were taken with the models in the apparatus in the position where they were exposed to observation during trials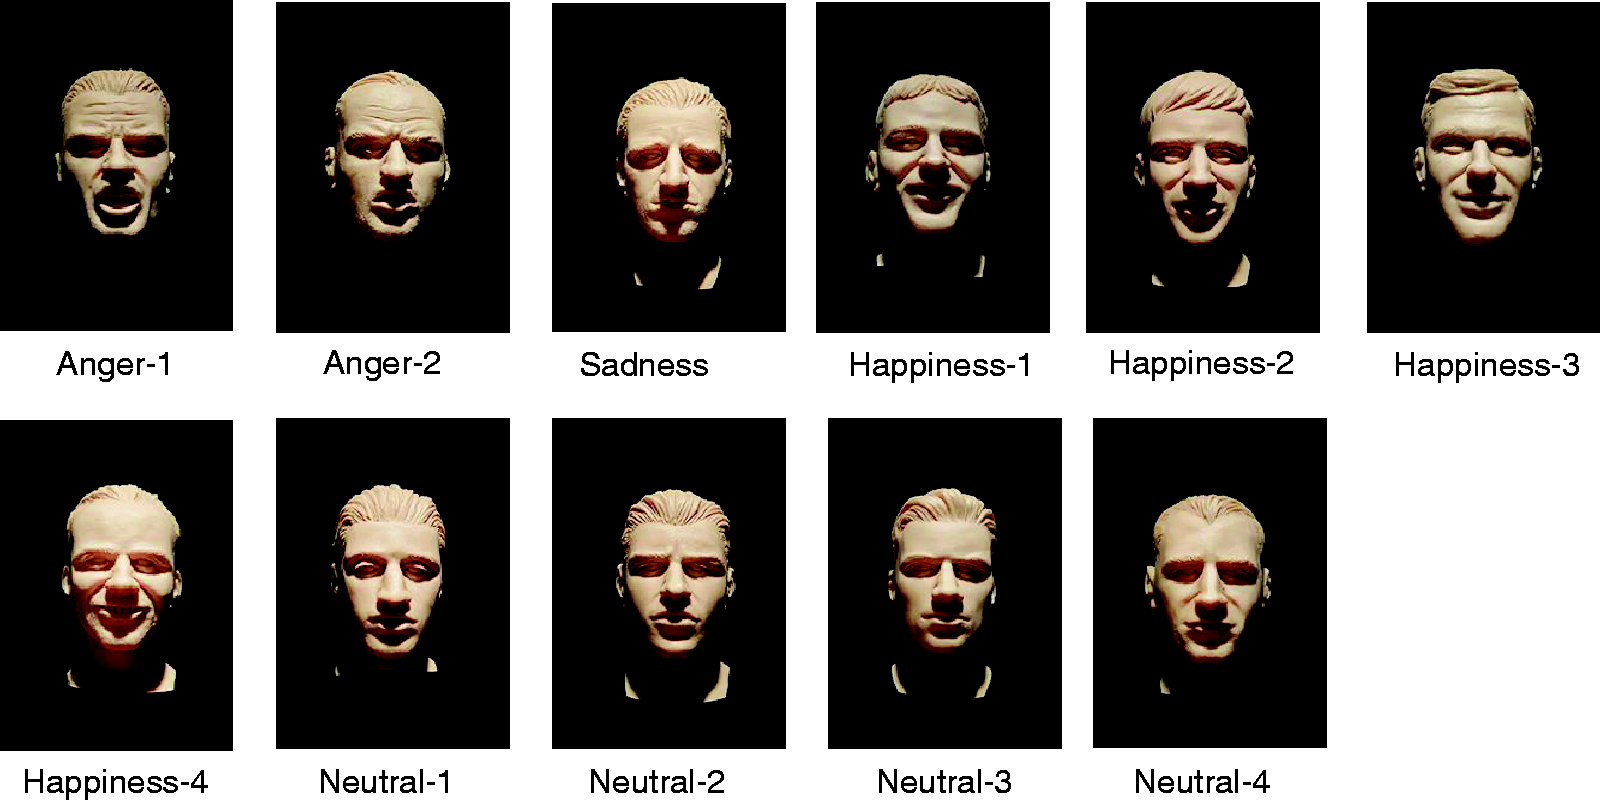
The floor of the test booth simulated a pavement surface. The floor includes an array of 12 vertical cylinders (100 mm diameter) which were normally flush with the floor (Figure 2). Four of these (obstacles 1–4) were used in the current experiment. Using a servo-motor, it was possible to raise or lower individual cylinders by up to 25 mm in either direction. For the current experiment, the obstacles were only lowered, representing potholes; previous work demonstrated similar detection rates for raised and lowered objects of the same size. 8
For the two experiments, obstacle 1 was the main target while obstacles 2–4 were used as distractors. The obstacles were intended to be detected in peripheral vision, with foveal fixation maintained towards the face targets. The distractor targets were used to avoid promoting a focus of attention to just one obstacle location.
Obstacle locations relative to fixation point
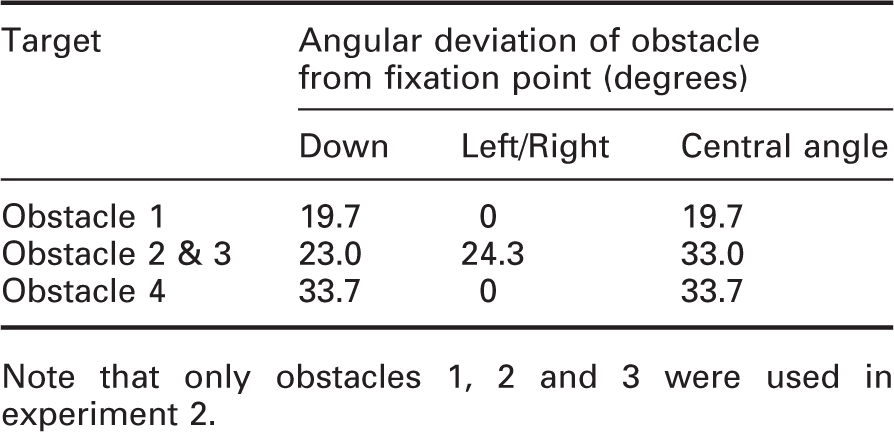
Note that only obstacles 1, 2 and 3 were used in experiment 2.
Between each trial, a masking noise was added to eliminate audible cues which might help participants to judge whether an obstacle appears or not. This masking noise was generated by an electric motor hidden beneath the obstacle field that switched on for two seconds coinciding with the resetting of the obstacle conditions (whether or not this actually involved a moving obstacle).
2.2 Test variables: Experiment 1
Four independent variables were involved in experiment 1: the location of the obstacle; depth of a pothole; light level; and emotion portrayed by facial expression.
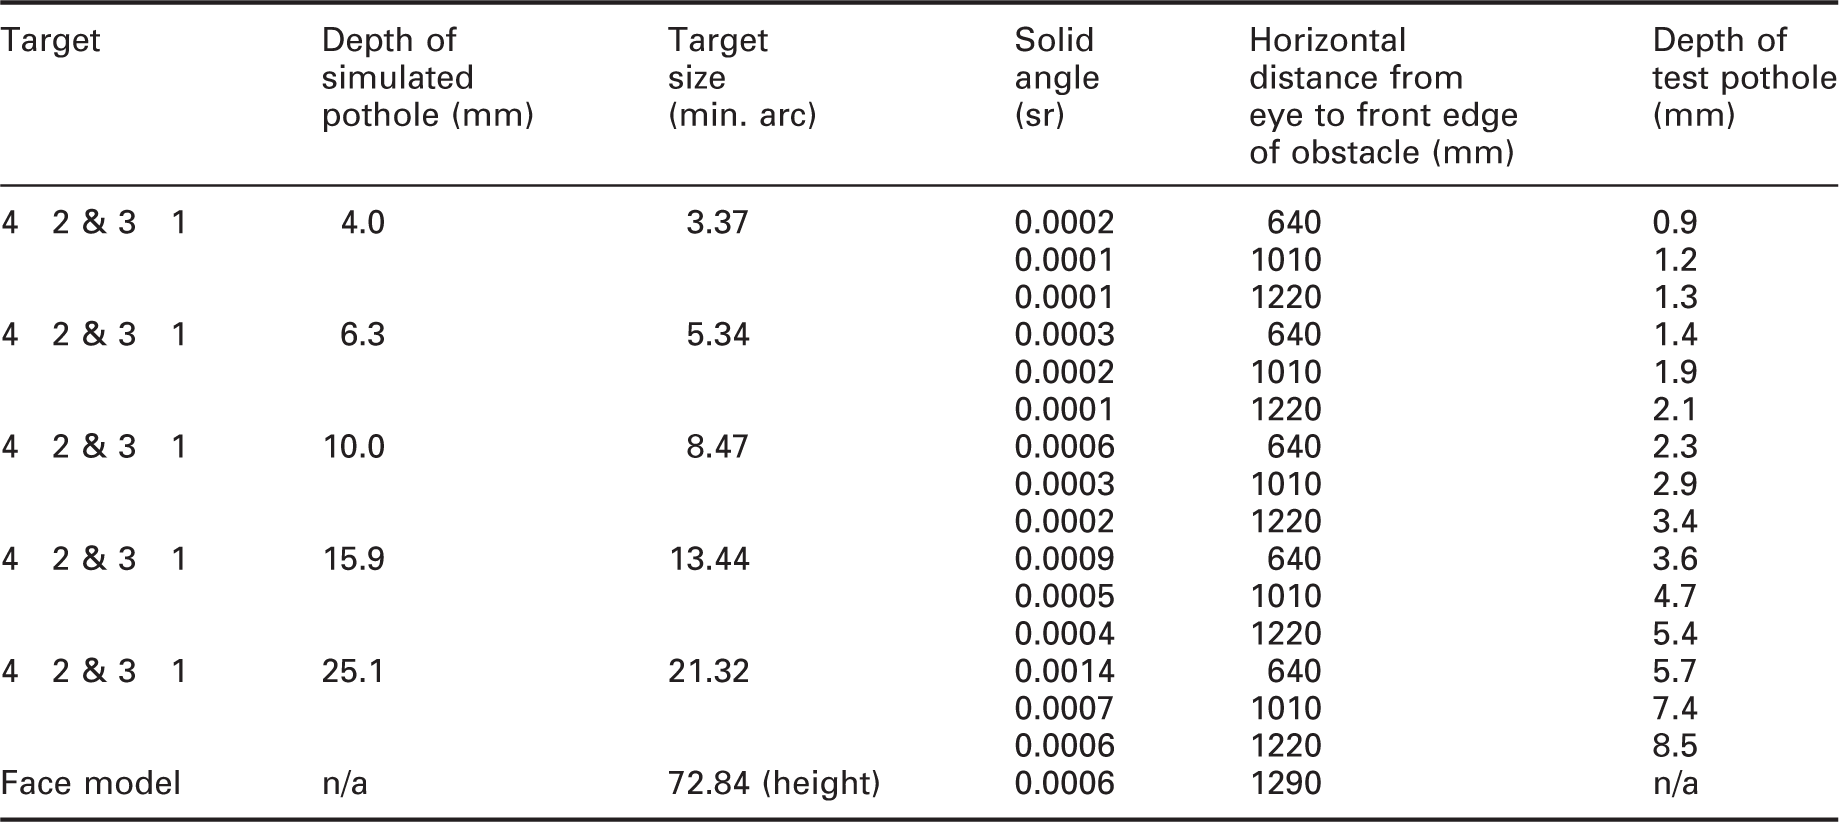
Size (height and depth) of the obstacles used in the experiment
In experiment 1, all 11 face models were available, of which nine were used in a test session, three positive (happy), three neutral and three negative (angry or sad). The three faces displaying positive and neutral emotion were randomly picked from the available four.
The test booth was lit from above by both LED2 and LED3. Two illuminances were used, 1.0 lx and 10.0 lx as measured on the top horizontal surface of obstacle 1 when flush with the surrounding pavement (Appendix 1). The average horizontal illuminances currently recommended for pedestrians and minor roads range from 2.0 to 15 lx.1,27 For trials at 10 lx, vertical illuminance measured at the eye was 0.23 lx. An illuminance of 1.0 lx was suggested to be optimal for detection of pavement obstacles,10,28 with negligible increase in detection with higher illuminances. 7 The higher illuminance, being one log unit greater, was used to prompt an increase in performance if it were the case that previous work had underestimated the optimal illuminance.
At these illuminances, the luminances of the front of the face models were 0.16 and 1.65 cd/m2, respectively, which brackets the suggested luminance (1.0 cd/m2) for optimal FER performance at 10 m.
14
The effect of change in light level on task performance can be predicted using Relative Visual Performance (RVP).
29
Consider a young, female, Caucasian face,
24
with facial contrast averaged across the mouth, eye and brow regions of 0.314 (Weber contrast), subtending a target of 0.0006 steradians (in this apparatus, that simulated a distance of 9.2 m) to an observer age of 25 years. Adaptation luminance was estimated as the road surface luminance as recommended.
30
Figure 4 shows the change in RVP for road surface illuminances of 0.33, 1.0, 3.3, 10.0 and 33.3 lx, the extended range of illuminances used in experiment 2, the assumed diffuse reflectance of 0.2 giving adaptation luminances of 0.02, 0.06, 0.21, 0.64 and 2.12 cd/m2, respectively. Figure 4 shows that for an adaptation luminance of about 0.21 cd/m2 (3.3 lx) or above, further increase in adaptation luminance brings negligible increase in performance, whilst for lower luminances there is a rapid decline in performance. For experiment 1, it was therefore expected that performance on the FER task would be greater at 10 lx than at 1 lx. Relative Visual Performance plotted against adaptation luminance for a facial contrast of 0.314, subtending a solid angle of 0.0006 steradians and an observer of age 25 years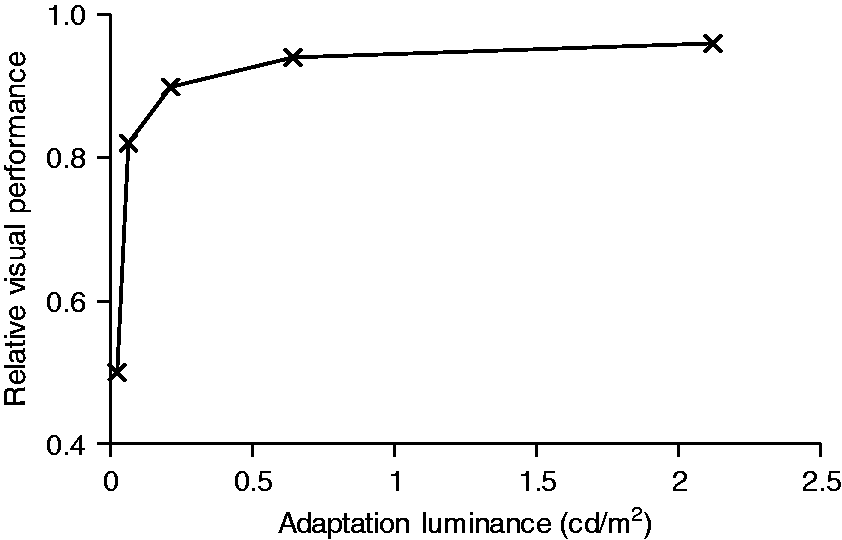
These conditions are described using photopic measures, this being the manner in which lighting recommendations are given.1,27 The FER task, being the fixation point, is a foveal task for which the photopic luminous efficiency function is appropriate. Given the low light levels and its peripheral location, it is more appropriate to define the obstacle task using the mesopic luminous efficiency function. 31 Appendix 1 therefore also shows mesopic luminances for the obstacle, as calculated from the photopic luminances. 32 Appendix 1 shows scalar and vector illuminances measured at the location where face models were presented, determined according to Cuttle 33 : the vector/scalar ratio was about 3.3 in each case. The average luminance contrast of the target obstacle against its surround area was approximately 0.82.
2.3 Test variables: Experiment 2
Experiment 2 followed the same procedure as experiment 1 but with an extended range of light levels. The two light levels of experiment 1 were increased to five to better characterise the relationship between performance and light level. Specifically, 0.5 log unit steps were introduced below, in-between and above the two levels used in experiment 1 (Appendix 1).
Three further changes were made. Two changes were made to balance the trials and maintain a reasonable test session duration: obstacle 4 was excluded from the detection task and the number of face trials was reduced from nine to six. Three categories of facial expression were still presented to participants, reduced to two positive (happiness), two negative (one each, anger and sadness) and two neutral. The specific face models chosen were those achieving the highest rates of correct detection in experiment 1. The third change was that an additional small sample of faces were shown rotated on the vertical axis by 45° to either the left or right in addition to the straightforward position. The results of these rotated faces are not analysed in the current paper.
2.4 Test procedure
For each experiment, 30 participants were recruited from the students in the School of Architecture of the University of Sheffield. For experiment 1, they were aged 18–32 years, and in experiment 2 they were aged 17–31 years. An equal balance of male and female was used in both experiments. They received a small payment for taking part. Before starting the test, each participant was given an information sheet describing the experiment: if willing to proceed, a consent form was signed. Normal acuity (wearing corrective lenses if normally worn) and colour vision were confirmed using a Landolt-ring acuity test and the Ishihara colour test plates under a simulated daylight source (Verivide D65).
Digital photographs of each face were shown to the participant on a computer screen, one by one, with these photographs stating also the emotion conveyed by expression. Recognition of the emotion was then checked by showing the same images again, in a random order, but without the emotion being stated. The participant was then instructed to sit facing into the test booth and placed their head upon the chin rest. They put on the occlusion spectacles, which could be worn over their normal lenses.
The laboratory lighting was then switched off so that only the apparatus lighting was in use. A period of 20 min was allowed for adaptation to low light level. In this period, the experimenter first described the test procedure and then demonstrated the locations of the obstacles (four in experiment 1, three in experiment 2) and the corresponding response button to use when that specific obstacle was detected.
The participant then completed a practice session to confirm familiarity with the face expressions, conducted with the illuminance set to 10 lx. For experiment 1 there were 22 trials, this being each of the 11 faces presented twice, and for experiment 2 there were 12 trials, each of the six faces being presented twice. The faces were observed in random order. For these practise trials, the occlusion glasses were retained in the open state, i.e. the practice trials were not time limited. In test trials, the glasses opened for only 500 ms. Therefore, the final two practise trials allowed only a 500 ms exposure.
For a given trial, there were four steps. (1) With the occlusion spectacles in the closed state, the obstacle and/or chosen face was moved to the test position. (2) After a beep sound was played, the occlusion spectacles opened for 500 ms. During or immediately after this 500 ms period, the participant responded according to which target they had seen. To indicate the presence of an obstacle, a button was pressed (the button box had one button for each obstacle). To indicate a face had been seen, the participant stated aloud which expression it was. If neither a face nor obstacle was seen, the participant did not respond. (3) The spectacles then closed for 4 seconds, during which time the obstacle and/or face wheel moved back to the default position (no target displayed) and the light level was changed to that of the next trial. (4) The spectacles opened for 4 seconds, to help participants relocate the fixation point (face model position) and adapt to the new light setting. The spectacles then closed to initiate the next trial.
Summary of target presentations
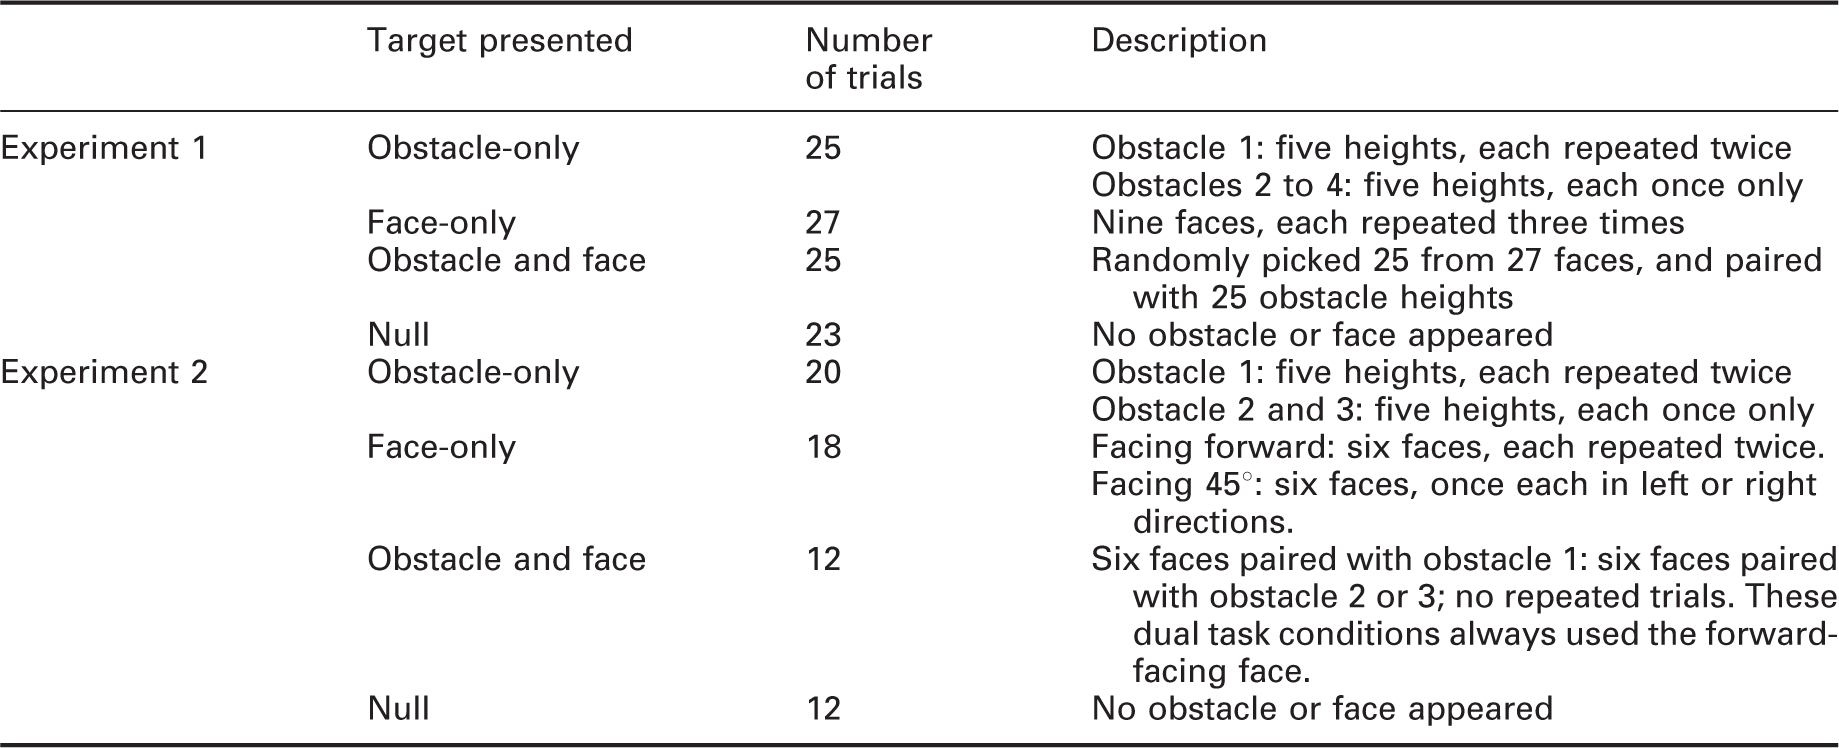
In experiment 1 there were 200 trials, which included the four obstacle locations, each at the five pothole depths, and nine face models. The 100 trials shown in Table 5 were each repeated at two light levels. In experiment 2, the 310 trials included combinations of three obstacle locations, five pothole depths, six face models and null conditions. The 62 trials shown in Table 5 were each repeated at all five light levels. The sequential order of these trials (200 for experiment 1, 310 for experiment 2) was randomised. To reduce participants’ fatigue, a 5-minute break was offered after 100 trials (which took approximately 20 minutes to complete). Overall, the experiment took approximately 60 minutes (experiment 1) and 150 minutes (experiment 2) to complete for each participant, including the introduction, adaptation, practice trials and testing.
2.5 Data analysis
In these two experiments, the participants were asked to respond to two tasks, obstacle detection and FER. For the obstacle detection task, there were four within-subjects factors – obstacle position, obstacle depth, illuminance and task condition (single task or dual task). For the FER task, there were three within-subjects factors – facial emotion, illuminance and task condition (single task or dual task). The dependent variables are rates of correct identification of facial emotion and correct detection of obstacle position. For an obstacle detection to be correct, participants had to respond with the correct position: responses of the wrong position or a false alarm in null trials were both counted as incorrect responses.
The data analysed were the proportion of correct responses for each test participant. The normality of data distributions was checked by visual inspection of the distribution (histogram and box plot), checking skewness and kurtosis, and using the Shapiro-Wilk test. This suggested the data tended to be normally distributed and hence statistical analyses were carried out using parametric tests. An alpha level of 0.05 was chosen for all statistical tests.
3. Results: Experiment 1
3.1 Null condition
Null trials were those where there was neither a lowered obstacle nor face model when the occlusion spectacles opened. They were used to assess response bias, the tendency to say yes or no when unsure about stimulus detection (face and obstacle in this experiment), or random responding. False alarms within null condition trials could include obstacle response, a face response, or both (but this possibility did not happen in any trial).
Responses in null condition trials in experiments 1 and 2
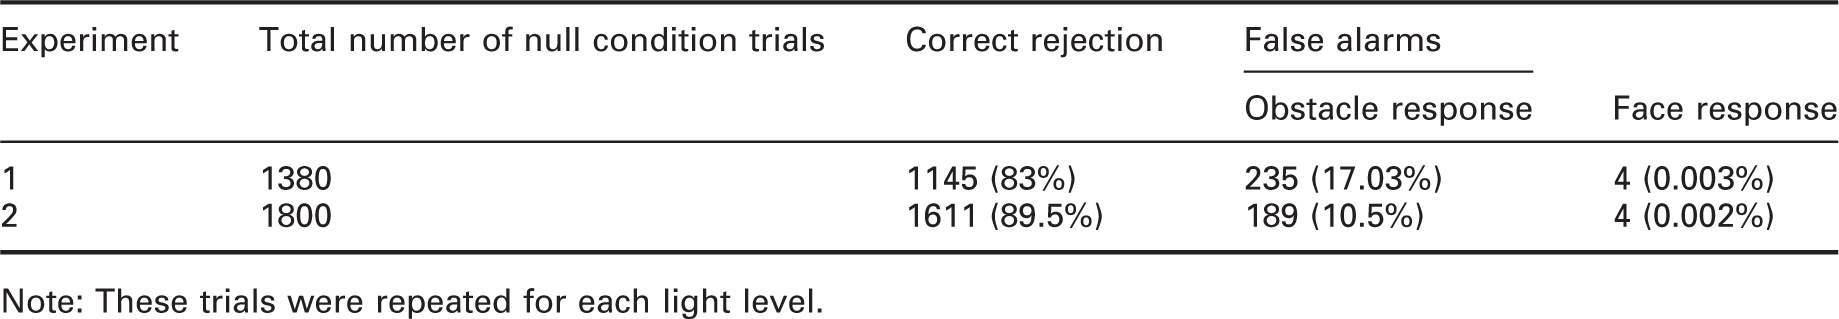
Note: These trials were repeated for each light level.
The sensitivity index (d′) is used to analyse how well the signal can be distinguished. 34 A higher d′ value indicates that the signal can be more readily detected while near zero suggests the performance was in a chance level, which might indicate that the participants did not concentrate on the task or the experimental design was not appropriate. Only the results of obstacle detection trials were used to calculate the d′ because the false alarm rate of facial emotion recognition task was extremely small. In experiment 1, a lowered pothole was correctly identified in 1998 (66.6%) of the 3000 trials in which it was presented. The average d′ score for all test participants was 1.44, which is within the range of previous work (1.06–3.28).6,8 These data suggest that participants tended to report detection only when an obstacle was present and not respond when obstacles were absent.
3.2 Obstacle detection
A four-way repeat measures ANOVA was carried out with four independent variables being illuminance (two levels), task condition (two levels: single and dual), obstacle location (4 levels: back, left, right and front) and obstacle depth (5 levels: simulating 4.0, 6.3, 10.0, 15.9 and 25.1 mm) with obstacle detection rate as the dependent variable. The p-values produced from the ANOVA were corrected by Holm-Bonferroni adjustment to counteract the error of multiple comparisons. 35 The ANOVA results are shown in Appendix 2. If the ANOVA test revealed a statistically significant main effect or interaction, post hoc paired comparisons t-tests with Holm-Bonferroni correction were applied to assess the differences between levels on each variable.
The results suggested that task condition (p < 0.001), obstacle location (p = 0.004) and obstacle size (p < 0.001) have significant effects. The results do not suggest a significant effect of illuminance (Figure 5): the detection rates for 1 lx and 10 lx were similar (1 lx: mean = 65%, SD = 2.2%; 10 lx: mean = 66%, SD = 2.6%; p = 0.264). The effects of illuminance and obstacle size on detection rate in experiment 1. Error bars show 95% confidence interval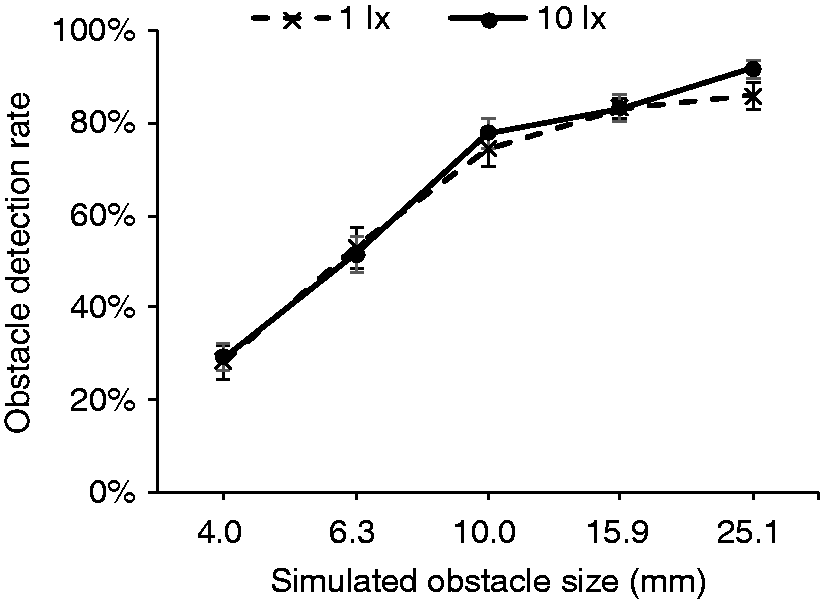
Detection performance in single-task trials (74% correct, SD = 2.2%) was significantly better (p < 0.001) than performance in dual-task trials (58% correct, SD = 3.2%).
Four different obstacle locations were presented to participants. Obstacle 1 had the highest detection rate (70%, SD = 2.3%) while the obstacle 4 was the worst (60%, SD = 3.1%): the difference in detection rates between obstacles 1 and 4 was significant (p < 0.001). Obstacle 2 and 3 did not show a significant difference in performance (Obstacle 2: mean = 67%, SD = 3.1%; obstacle 3: mean = 67%, SD = 2.9%; p = 0.77) which validated the findings of previous work. 8 After combining the results of obstacles 2 and 3, the difference between mid-distance obstacles (obstacle 2 and 3) and obstacle 4 was suggested to be significant (p = 0.016) but the difference with obstacle 1 was not significant (p = 0.23).
Five different obstacle depths were used in this experiment. Obstacle detection rate increased as the obstacle depth became larger, ranging from 28% (SD = 3.1%) for the smallest obstacle depth, which is about chance level (25%) to over 80% for the largest obstacle depth (Figure 5). Paired t-tests with Holm-Bonferroni correction suggested the differences in detection performance between successive increases in obstacle depth were significant (p < 0.002 in all cases).
One significant interaction was between illuminance and obstacle location (p = 0.001) (Appendix 2). For obstacle 2, the difference between two illuminances was suggested to be significant (p = 0.001), but the effect of illuminance was not significant for the other three obstacle locations.
Another significant interaction suggested in Appendix 2 was between task condition and obstacle size (depth) (p = 0.001). Figure 6 shows the detection rates increase as the obstacle depth became larger, from chance level to around 80% for both task conditions. The difference between obstacle depth and task condition was not suggested to be significant at the smallest obstacle depth (p = 0.493) but was significant for the larger four depths (p ≤ 0.001) with higher detection rates for the single task than the dual task. Mean obstacle detection rates plotted against obstacle size for single-task and dual-task conditions in experiment 1. Error bar: 95% confidence interval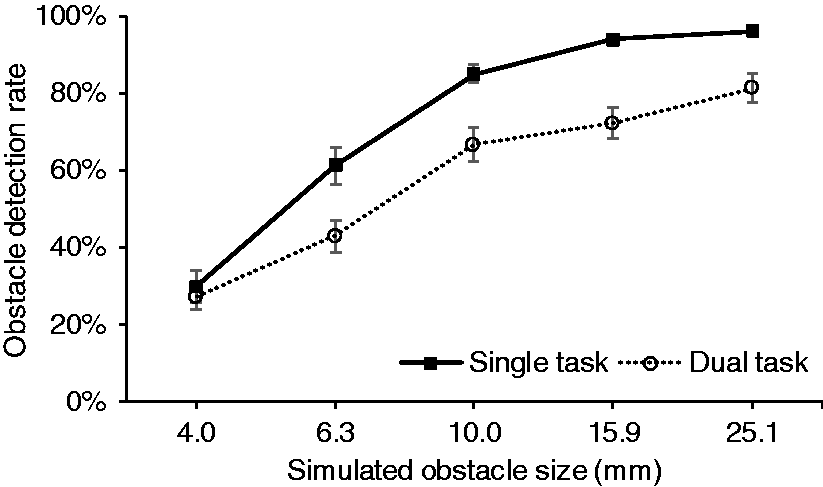
3.3 Facial emotion recognition task
Three variables were examined: face luminance (two levels: 0.16 cd/m2 and 1.65 cd/m2), task condition (two levels: single and dual) and facial emotion (four levels: happiness, sadness, anger and neutral). The ANOVA results are shown in Appendix 3. The higher luminance had a significantly (p < 0.001) higher rate of correct facial emotion recognition (1.65 cd/m2: mean = 74.3%, SD = 2.46%, 0.16 cd/m2: mean = 61.2%, SD = 1.71%) as was predicted for a typical situation (Section 2.2). The statistical analysis did not suggest a significant effect of task condition nor facial emotion type.
All 11 face models (Figure 3) were used (four happiness, one sadness, two anger and four neutral) in experiment 1. Appendix 4 shows the recognition rates for each individual face model. The ANOVA test suggests a significant difference among the four happiness faces (p = 0.008) and among the two angry faces (p = 0.004) but did not suggest a significant difference among the four neutral faces (p = 0.709). Paired t-tests with Holm-Bonferroni correction suggested significant differences in recognition rates between happiness-1 and happiness-2 (p = 0.027), happiness-2 and happiness-4 (p = 0.021), anger-1 and anger-2 (p = 0.043).
3.4 Discussion
Experiment 1 investigated the effect of changes in illuminance (1 lx and 10 lx) on the performance of obstacle detection and FER tasks, and the impact of making both assessments simultaneously. For the obstacle detection task, there was no effect of light level. This suggests that performance reached a plateau before 1.0 lx, which agrees with previous work.8,10 For the FER task, there was a significant effect of light level with better performance at the higher light level, which agrees with past work.14,15 Regarding task condition, the effect was significant for obstacle detection but was not suggested to be significant for FER.
For obstacle detection, the results suggest performance is already at the plateau level and the data do not reveal the optimal illuminance: trials conducted at lower illuminance would explore this. The FER data do not suggest the optimal luminance has been reached – trials conducted at a higher level would explore this. Therefore, a second experiment was conducted using an expanded range of light levels (see Appendix 1).
4. Results: Experiment 2
4.1 Null condition
In experiment 2, each test participant observed 12 null condition trials per illuminance, giving 1800 null condition trials in total (12 × 5 illuminances × 30 participants).
False alarms where participants incorrectly reported an emotion were recorded in only four trials (false alarm rate = 0.002%). Correct rejection to null condition trials were 1611 (89.5%) in total (Table 6). False alarms where participants incorrectly responded detection of an obstacle occurred in 10.50% of these trials. This is lower than experiment 1 (17%) and also lower than previous studies (13.7–24.8%).5,6,8
As with experiment 1, d′ can only be calculated for obstacle detection task as the false alarm rate of the FER task was near zero. Among the 4650 obstacle detection trials, the hit rate was 73.94% and the average d′ score was 1.82. This is similar to experiment 1 (1.44) and previous work (1.06–3.28).5,6,8
4.2 Obstacle detection
Results of three-way repeated-measures ANOVA in experiment 2, with illuminance, obstacle location and obstacle size as independent variables and detection rate as the dependent variable
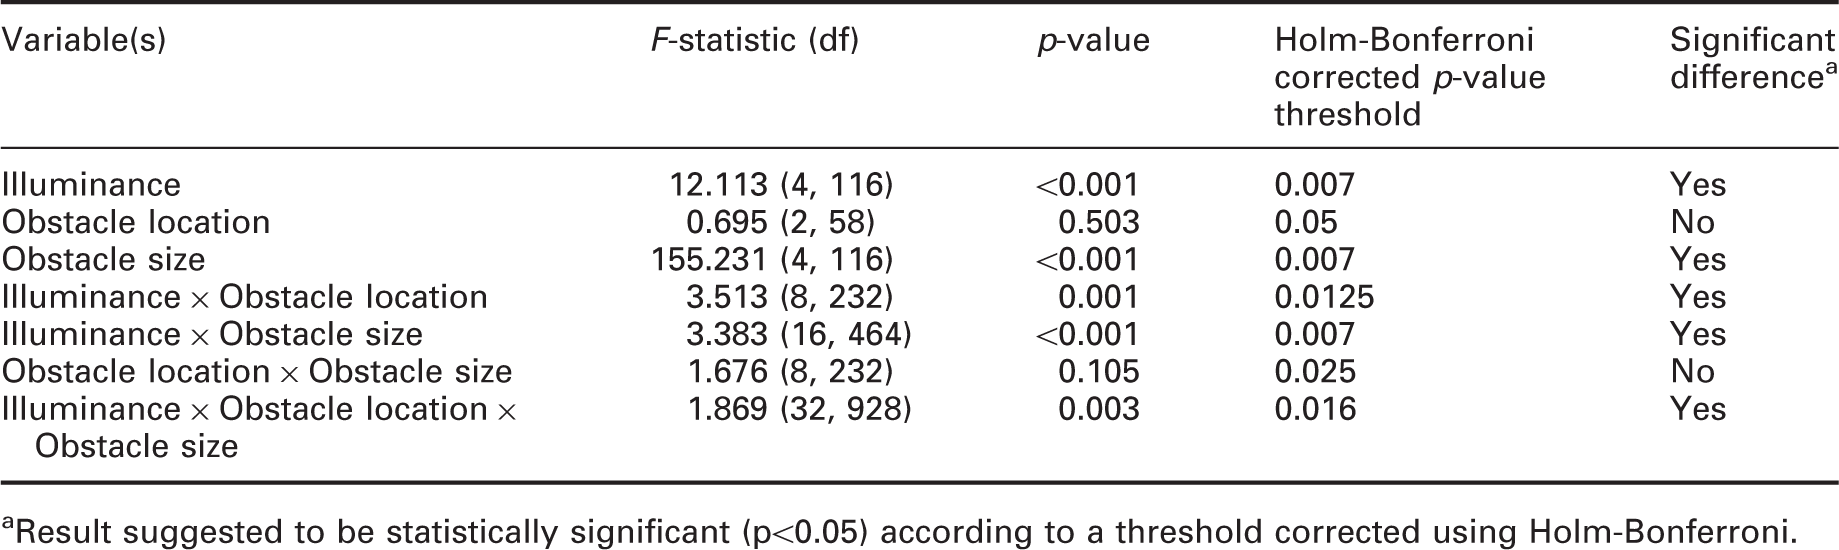
aResult suggested to be statistically significant (p<0.05) according to a threshold corrected using Holm-Bonferroni.
Results of three-way repeated-measures ANOVA in experiment 2, with illuminance, task condition and obstacle size as independent variables and detection rate as the dependent variable
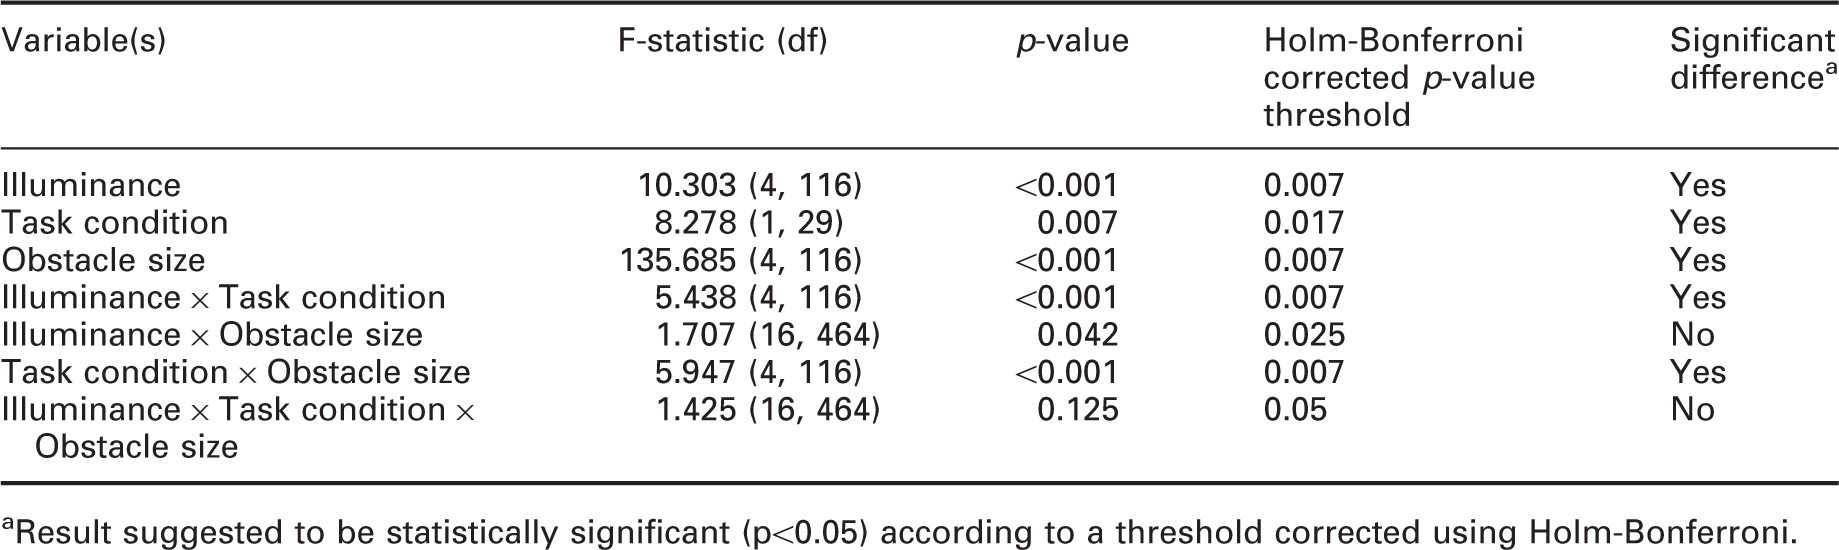
aResult suggested to be statistically significant (p<0.05) according to a threshold corrected using Holm-Bonferroni.
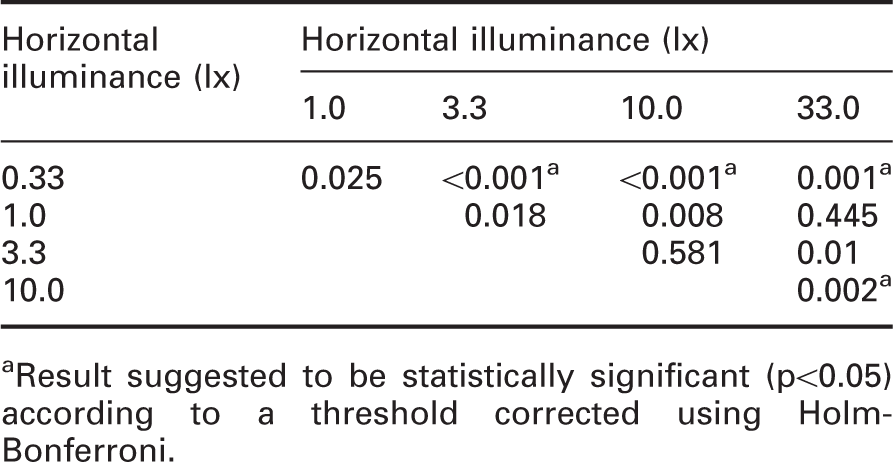
Detection rates for five illuminances used in experiment 2 increased from 68.1% (SD = 2.45%) at 0.33 lx to 79.8% (SD = 2.23%) at 10.0 lx (Figure 7). However, at the highest illuminance (33.3 lx) performance dropped slightly to 75.3% (SD = 2.17%). ANOVA suggested that illuminance has significant effect on detection rate (p < 0.001). Thus, post hoc t-tests were carried out. Table 9 suggested that the performance at 0.33 lx differed significantly from 3.3 lx, 10.0 lx and 33.3 lx (p ≤ 0.001) but is not different to performance at 1.0 lx. For illuminances of 1.0 lx and above, the data do not suggest a significant difference, which suggests that the optimal illuminance is in the region of 1.0 lx. The effects of illuminance and obstacle size on detection rate in experiment 2. Error bars show 95% confidence interval Post hoc paired sample t-test with Holm–Bonferroni correction for obstacle detection task under all illuminances in experiment 2 aResult suggested to be statistically significant (p<0.05) according to a threshold corrected using Holm-Bonferroni.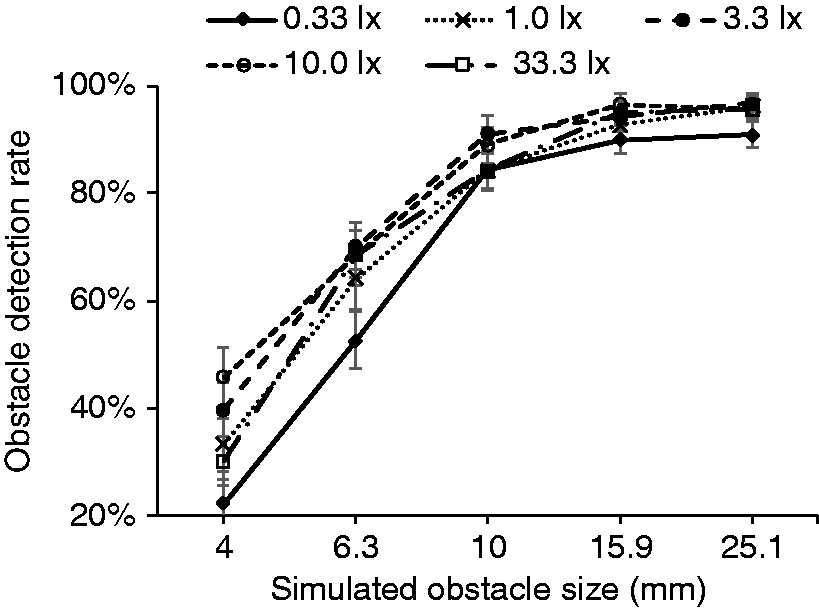
Detection rate according to obstacle height ranged from 33.6% (SD = 4.01%) to 95.7% (SD = 0.84%) (Figure 7), similar to experiment 1. A series of paired t-tests with Holm–Bonferroni correction suggests that the differences between each obstacle size were significant (p < 0.001) except between 15.85 mm and 25.12 mm (p = 0.377).
As with experiment 1, the results of experiment 2 also suggest a significant difference between performance in the single task and dual task trials (p = 0.007). The detection rate in single task trials was higher (mean = 77.1%, SD = 1.98%) than in dual task trials (mean = 70.5%, SD = 2.99%).
There is one apparent anomaly in these data: performance at 33.3 lx is significantly lower (p = 0.002) than at 10.0 lx. The decline in performance was consistent for all three obstacle locations. Figure 8 shows performance on the single-task and dual-task conditions separately and shows that the decline in performance at 33.3 lx occurred with single-task trials but not with dual task trials. Mean obstacle detection rates plotted against illuminance for single task and dual task conditions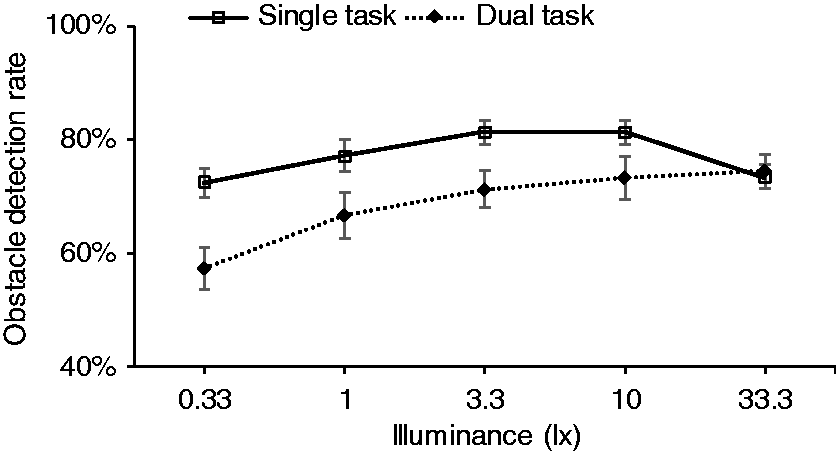
4.3 Facial emotion recognition task
Results of three-way repeated-measures ANOVA, with luminance, task condition and facial emotion type as independent variables and identification rate as the dependent variable
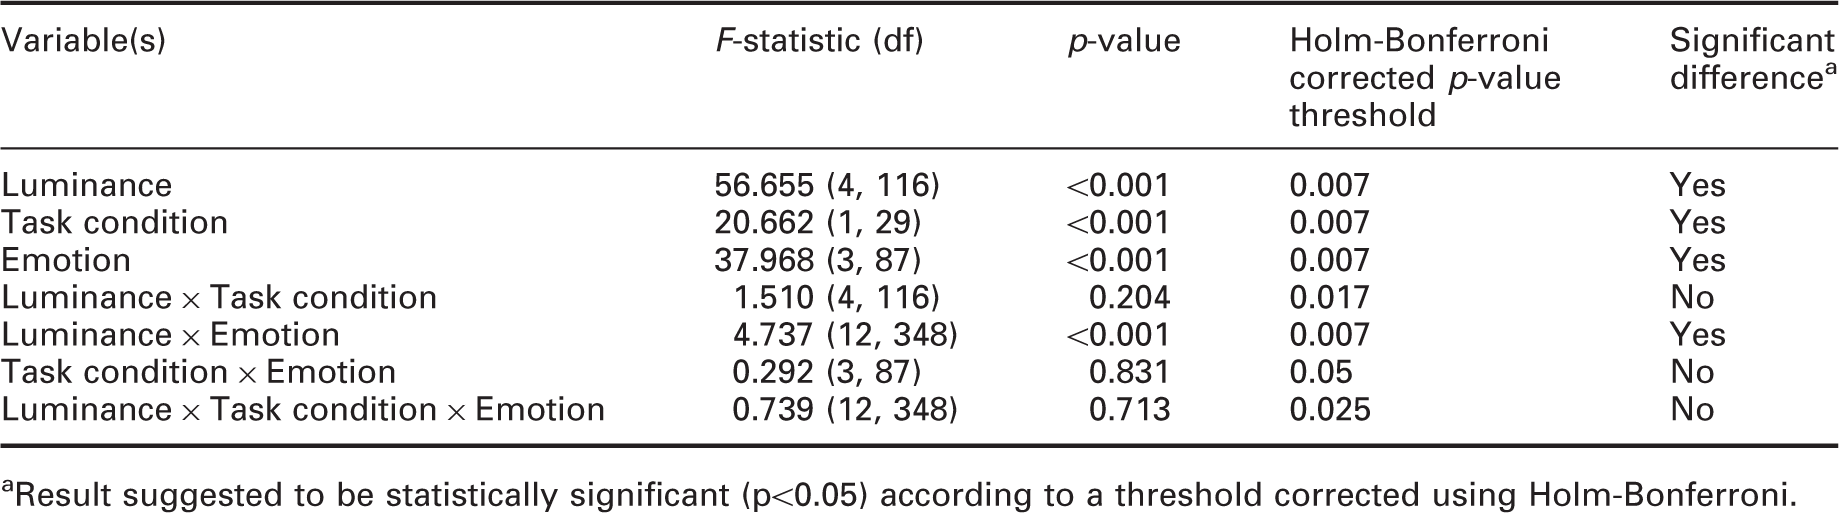
aResult suggested to be statistically significant (p<0.05) according to a threshold corrected using Holm-Bonferroni.
As shown in Figure 9, luminance, task condition and facial emotion type all revealed a significant difference. The rate of correct expression identification increased with increasing luminance, from 55.4% (SD = 2.15%) at 0.33 lx to 85.4% (SD = 1.93%) at 33.3 lx (p < 0.001) (Table 10). The effects of luminance on identification rate in the second experiment. Error bars show 95% confidence interval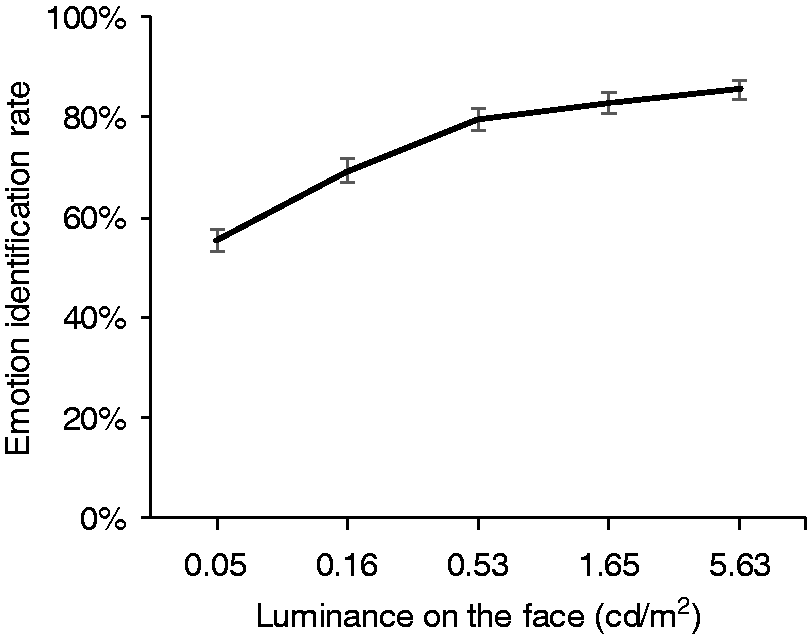
Post hoc paired sample t-test with Holm–Bonferroni correction for FER under all luminance in experiment 2
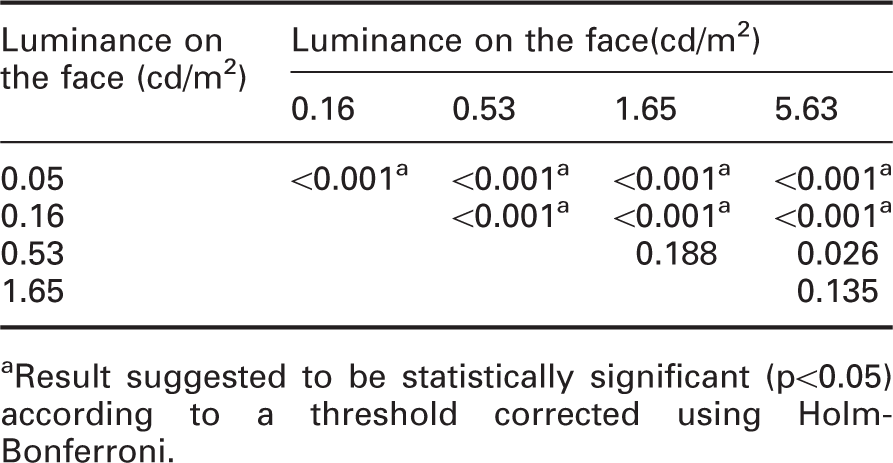
aResult suggested to be statistically significant (p<0.05) according to a threshold corrected using Holm-Bonferroni.
There was a significant effect of task condition on facial emotion recognition with a significantly higher (p < 0.001) percentage of correct identification of facial expression in the dual task (mean = 77.3%, SD = 1.64%) than in the single task (mean = 72.6%, SD = 1.67%). This suggests that during dual task trials, test participants tended to focus more attention onto the FER task at the expense of performance on the detection task.
Identification rates of all types of facial expression were above chance level, although the sad expression (mean = 56.0%, SD = 1.85%) was slightly lower than for the other expressions (happy: mean = 74.0%, SD = 1.79%; angry: mean = 77.3%, SD = 3.36%; neutral: mean = 82.7%, SD = 1.67%). Paired-sample t-tests suggested a significant difference between each type of emotion (p ≤ 0.01) except that the difference between happiness and anger was not suggested to be significant (p = 0.153).
5. Discussion
5.1 Summary of results
Two experiments were conducted to measure the detection of pavement obstacles and identification of emotion conveyed by facial expression under changes in light level. This extended previous work by conducting both tasks in parallel trials rather than as separate experiments: the next trial in a sequence could be obstacle detection, FER, both or neither. This was done to investigate the proposal that multi-tasking would reduce task performance and thus the extent to which this would affect the optimal light level determined from the data.
Experiment 1 used two light levels, photopic illuminances of 1.0 lx and 10 lx as measured at obstacle 1 (see Appendix 1). This did not lead to a significant difference in obstacle detection but, as predicted above using RVP, led to higher FER performance at the higher light level. The effect of task condition was significant for the obstacle detection task with lower detection rate in those trials when both tasks required a response than in those trials where only an obstacle was presented. For FER, there was no effect of task condition. This may be because the FER task was the fixation point.
Experiment 2 used five light levels (0.33 to 33.3 lx at obstacle 1, see Appendix 1). The change in illuminance led to a significant effect on obstacle detection, with a lower rate of detection at 0.33 lx than at higher illuminances. Note that the difference in performance between 1.0 lx and 10.0 lx was not suggested to be significant, which confirms the finding of experiment 1. Alongside with Fotios and Uttley 10 and Boyce, 28 these results suggest that 1.0 lx is sufficient for pedestrians to detect trip hazards.
For FER, the effect of change in light level was also significant, with a progressive increase in identification rate at higher light levels. The results of experiment 2 suggested differences in FER performance for luminances in the range of 0.05–0.53 cd/m2 were suggested to be significant, but not for luminances of 0.53 cd/m2 or more. This is as expected according to RVP (see Figure 4). This optimal luminance of 0.53 cd/m2 is slightly lower than that reported previously 14 of 1.0 cd/m2 for faces at a distance of 10 m. This may be a result of stimulus selection: in experiment 2 the five levels of face luminance did not include 1.0 cd/m2 but stepped from 0.53 to 1.65 cd/m2, while the previous study 14 used only three levels of face luminance (0.01, 0.1 and 1.0 cd/m2) and thus offers a less precise estimate of the optimum.
The effect of task condition was significant for both the obstacle detection and FER tasks. For obstacle detection, performance was better when only an obstacle was presented, but FER performance was better in those trials where a face and an obstacle were presented simultaneously.
5.2 Multi-tasking and task performance
In typical laboratory trials (including those studies in Tables 1 and 2), the observer is required to focus on only one task, such as obstacle detection or FER, but not both. In natural situations, a pedestrian is required to multi-task to attend to multiple tasks, perhaps simultaneously, or at least does not know which of several possible tasks would next require their attention. The current work was designed to better resemble the natural situation, with responses required to one, both or neither of two tasks in a randomised order. The effect of multi-tasking on the performance of the individual tasks was determined by comparing results from the current work (single task trials) with those of previous studies (which were single task by default).
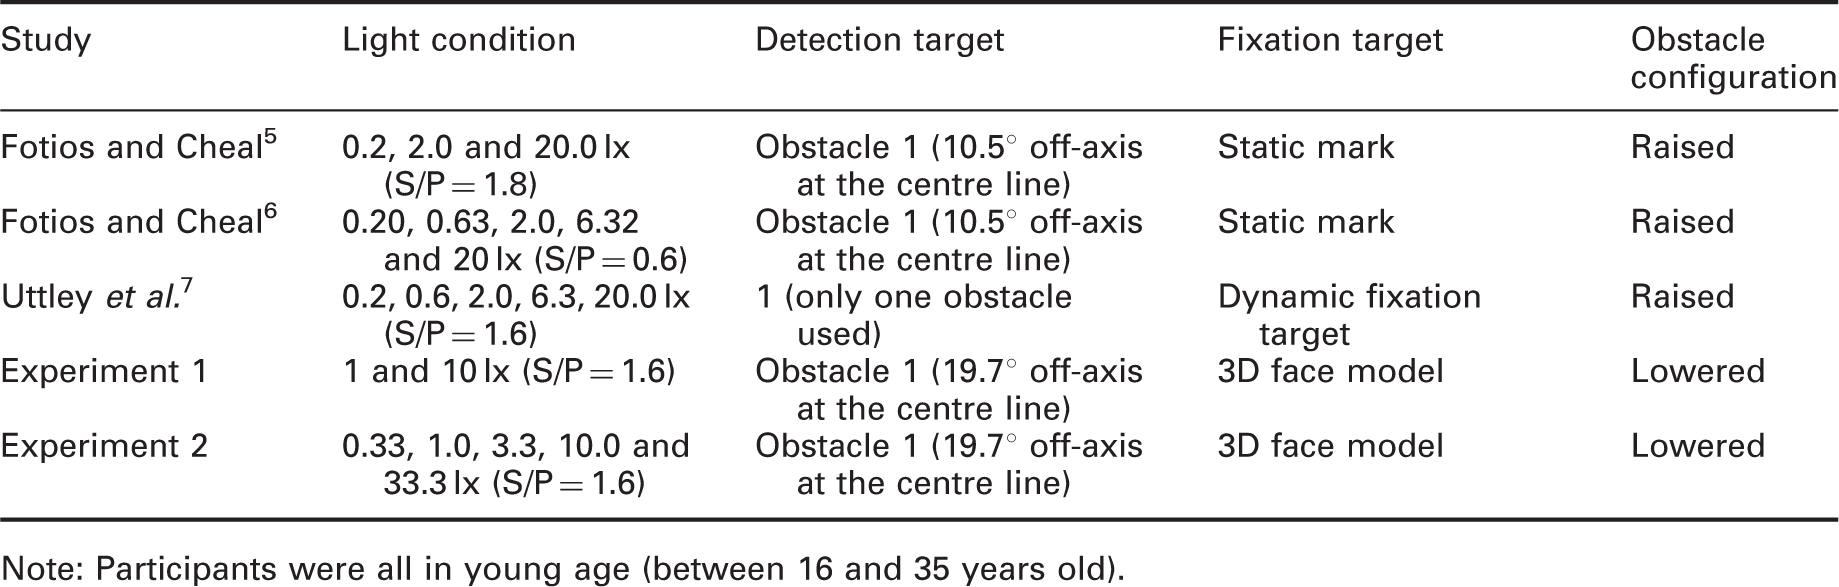
For obstacle detection, Figure 10 shows the results of experiments 1 and 2 along with three previous studies.5–7 The results have been converted into visual angle (min arc) subtended at the observation point as these experiments used different apparatus and settings. Data used in this comparison (Table 12) were for obstacles in a similar location to obstacle 1 in the current work. For this comparison, only results from single-task trials in the current work are used (i.e. obstacle-only trials). Obstacle height for 50% detection rate (in visual angle subtended at the eye) plotted against illuminance for three previous studies and the two current experiments (single task condition only). The conditions used for this comparison are shown in Table 12 Conditions compared for five experiments of obstacle detection Note: Participants were all in young age (between 16 and 35 years old).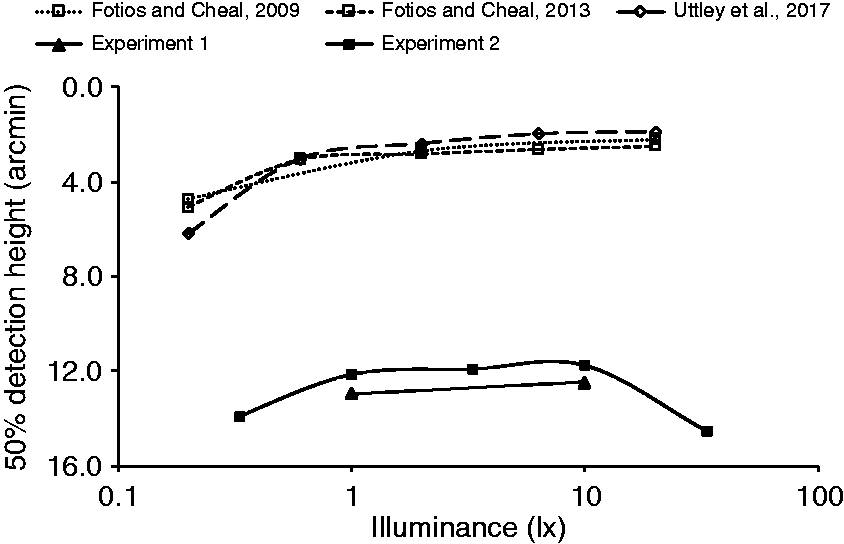
For the single task trials in the current study, test participants did not know, until the moment the occlusion spectacles opened, which of the two tasks they would be expected to undertake. As expected due to reduced attention, this led to impaired performance compared with previous studies where the task was known.
In the three previous studies,5–7 detection performance increased as illuminance became higher and reached a performance plateau at around 0.63 lx. While performance in the two current experiments was impaired at all illuminances, requiring a larger obstacle size for 50% detection rate than the previous studies, it still suggests a performance plateau is reached at about 1.0 lx.
Figure 11 compares the current FER results with those of similar conditions (target distance and S/P ratio) in a previous study.
14
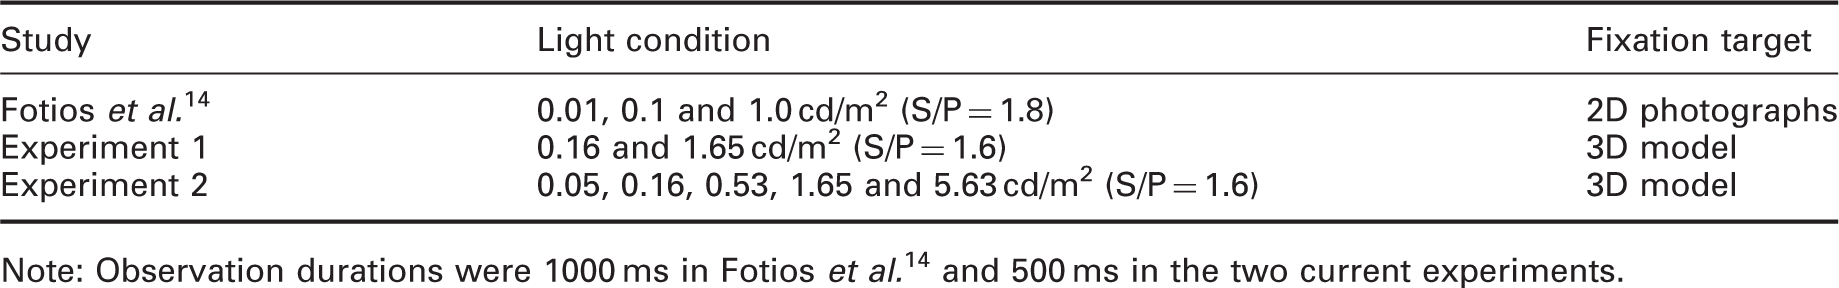
The conditions compared are shown in Table 13. For this comparison, only results from single task trials in the current work are used (i.e. face-only trials). There is little difference between the current results and those of Fotios et al.
14
for targets of similar luminance which suggests that the potential need to conduct an alternative or additional task did not affect performance. Identification rate plotted against target luminance for two previous studies and current two experiments (only used single task condition data). The condition used to compare are listed in Table 13 Conditions compared in Figure 11 for three FER experiments. The experiments simulated interpersonal distances of 10 m (Fotios et al.14) and 9.2 m (current work) Note: Observation durations were 1000 ms in Fotios et al.
14
and 500 ms in the two current experiments.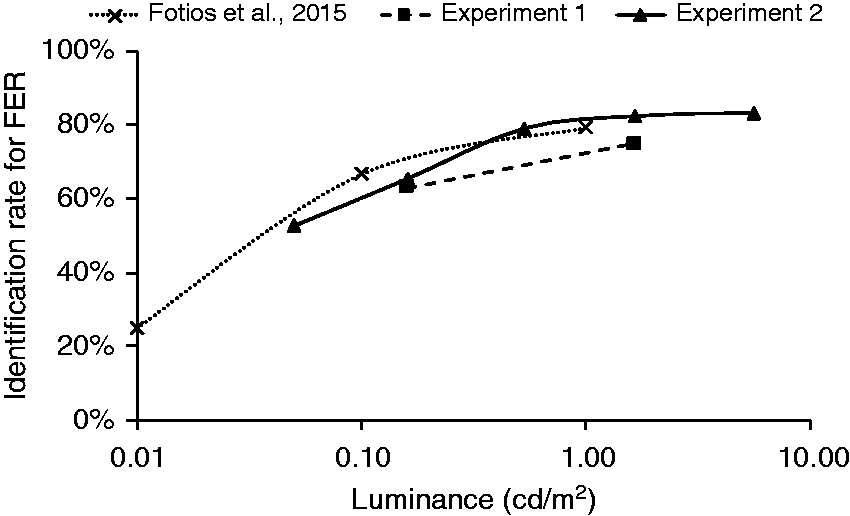
The effect of multi-tasking as revealed by comparing performance on a task when only that task was conducted to performance on that task when a second task was also likely is suggested to be impaired performance on one task (peripheral detection task) but not the other (FER task). A similar conclusion was reached above in analysis of the task condition variable (single task versus dual task) using results of the current study only. The datum for both approaches to analysis is performance on a single, specific task; the difference is the comparator. In the former approach, it remains the same, single task, but with the uncertainty that it would be that task in the imminent experimental trial. In the latter it was performance of that task in the same 500 ms observation period as a second task.
The reduction in attention available to perform each task due to multi-tasking appears to have impaired one task but not the other. This may be a result of task priority. In experimental trials, this priority may be instructed by the experimenter, with the risk that participants do not follow such instruction, 36 while in natural settings the self-selected priority may depend on the consequences of impaired performance on each task. Attention is prioritised to stimuli which are threatening or feared. 37 If the unknown intentions of other people represent a greater threat or fear than does tripping, then priority attention would be devoted to the FER rather than the detection task leading to greater impairment on the detection task than on the FER task, as is seen in the results.
Rather than allocating the impairment of multi-tasking to a specific task type, an alternative explanation can be offered for task location: multi-tasking impaired performance of the off-axis but did not impair performance of the task located at the fixation point. If instead obstacle detection had been the task located at the fixation point, then task impairment may have changed. Specifically, this may have led instead to impairment of the FER task rather than the detection task. The approach used in the current work was intended to follow the typical experimental design of previous studies (FER being and on-axis task and obstacle detection being an off-axis task) and is suggested by eye tracking to be ecologically valid: if there is another person in the visual field, there is a tendency to look towards them.3,4
5.3 Tripping risk
Evidence of gaze behaviour using eye tracking suggests a typical tendency to fixate on other people for about 500 ms. With gaze and attention focused on that person, there may be a risk of tripping over an unseen pavement obstacle. To successfully modify gait pattern and safely negotiate a detected hazard requires that it is seen at least two steps ahead, about 800–1000 ms. 38 The typical walking speed of a pedestrian varies with age, ranging from 1.25 m/s for a person aged 14–64 years, reducing to 0.97 m/s for people aged 65 and older. 39 Consider an obstacle located 3.4 m ahead, the typical distance for detecting hazards 10 but which is not yet detected, and that the pedestrian spends the next 500 ms fixating another person. In that period they would typically walk distances of 0.62 m (younger) or 0.48 m (older). To walk the remaining 2.78 m (younger) or 2.92 m (older) would take a further 2.2 s (younger) or 3.0 s (older) which remains a longer duration than that needed to modify gait.
6. Limitations
The face models used in this study (Figure 3) comprised only male Caucasian faces. This was not a purposeful decision but a consequence of availability – attempts at 3D printing face models from a validated database did not produce models of sufficient resolution. This sample does not, therefore, represent female faces or non-Caucasian faces.
This raises the question as to whether gender and ethnicity matter for facial expression discrimination. If different skin tones lead to differences in facial contrast, then this may lead to differences in the ability to recognise facial expressions, with greater contrast leading to more rapid recognition. For the current work, an optimal luminance determined for one facial contrast may be suboptimal for a face with lower facial contrast. This was examined by comparing the RVP 29 for facial contrasts associated with different skin tones.
Facial contrast is characterised by the contrast of the lips, eyebrows and eyes against the skin immediately surrounding these features.24,25 Note that while others report facial contrast as a Michelson contrast, here we use Weber contrast as is required to determine RVP. We used the young female faces reported by Porcheron et al., 24 specifically the Caucasian and South African faces, which correspond approximately to types II and VI of the Fitzpatrick Scale. 40 Facial contrast was determined separately for each facial feature (eyes, eyebrows, mouth) and then averaged, leading to facial contrasts of 0.314 (Caucasian face) and 0.138 (South African face). The adaptation luminance was taken as the average the lit surface 30 : an adaptation luminance of 0.6 cd/m2 represents a road lit to an average illuminance of approximately 10 lx. To determine RVP, we assumed an observer age of 25 years and a target which subtended 0.0006 steradians, simulating an interpersonal distance of 9.2 m. RVP reduced from 0.94 for the Caucasian face to 0.87 for the South African face. In other words, the ability to discriminate the facial expression of a South African face at 10 lx is similar to that for a Caucasian face but at an illuminance of approximately 3.3 lx (Figure 4).
Gender is expected to influence facial emotion recognition because females tend to have higher facial contrast than males. 25 Balanced numbers of male and female targets were used in previous FER studies,14–16 but did not report whether this influenced the results.
One limitation of the models (Figure 3) is that while the anger, sadness and neutral faces all had swept-back hair, this was not the same for all of the happiness faces: happiness face 4 had swept back hair but the other three have hair combed to the side. It may therefore be the case that discriminations were based on hairstyle rather than facial expression. If that were the case, happiness 4 would be more easily confused with the other facial expressions, and we would expect a higher error rate for happiness 4 than for happiness 1 to 3. This is not supported by the results: in experiment 1 the error rates for happiness faces 1 to 4 were 32%, 61%,42% and 38% (1.0 lx), and 10%, 37%, 27% and 15% (10.0 lx). Appendix 4 shows the recognition rates for the faces used in Experiment 1. As noted above, statistical analysis of correct recognition rates does not suggest a consistent difference between happiness 4 and the other three happiness faces.
Some pedestrians may choose to wear a hat, as protection against the weather or as a choice of style: none of the targets used in the current work wore hats or other head covering. A hat may influence perception of facial configuration, especially in the forehead region; hats may lead to an impairment in facial recognition 41 which is why the current work sought recognition of facial expression rather than identity. A hat with a brim above the face has two implications for face evaluations under road lighting, both of which reduce the ability to recognise facial expressions: it may lower the overall luminance of the face, and it may reduce the luminance contrast of facial features and their shadows. Facial details may also be obscured by glasses and hands placed in front of the face.42,43 Further work is required to identify the more critical of these possibilities hence to consider the impact of changes in lighting.
The accuracy of facial identification is maintained across a wide range of lighting directions but can be reduced by lighting from extreme directions. 44 In the current experiment, the light direction was fixed, from near-overhead sources (Figure 1). The vector/scalar ratio was about 3.3 for all cases (Appendix 1). Field measurements conducted in a subsidiary road to gain an idea of the typical range suggested vector/scalar ratios of about 3.5 for measurement underneath a lamp post, reducing to 1.0 when located midway between two successive lamp posts. Hence, the current experiment resembled observation of a face when that person was standing nearby a lamp post.
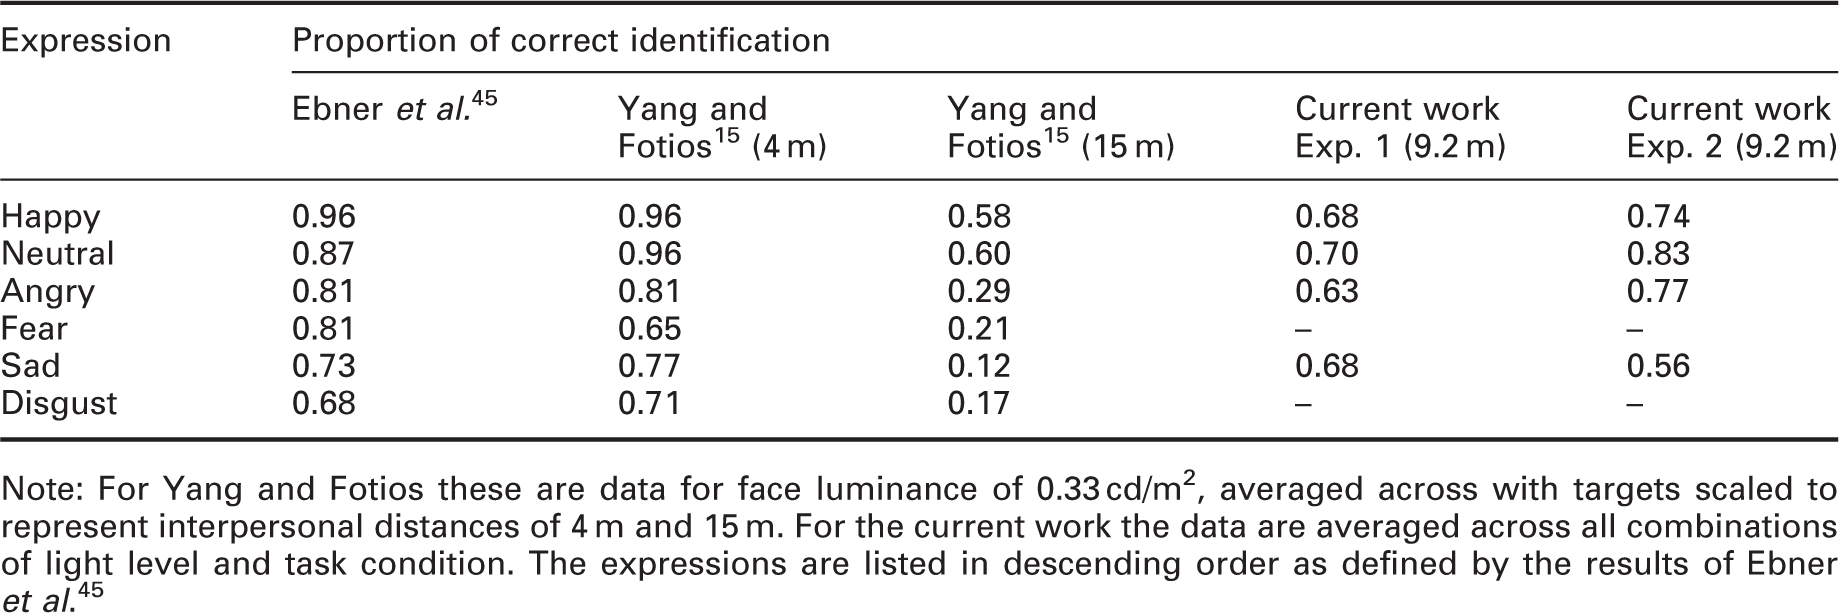
Note: For Yang and Fotios these are data for face luminance of 0.33 cd/m2, averaged across with targets scaled to represent interpersonal distances of 4 m and 15 m. For the current work the data are averaged across all combinations of light level and task condition. The expressions are listed in descending order as defined by the results of Ebner et al. 45
Proportions of responses given for each type of expression
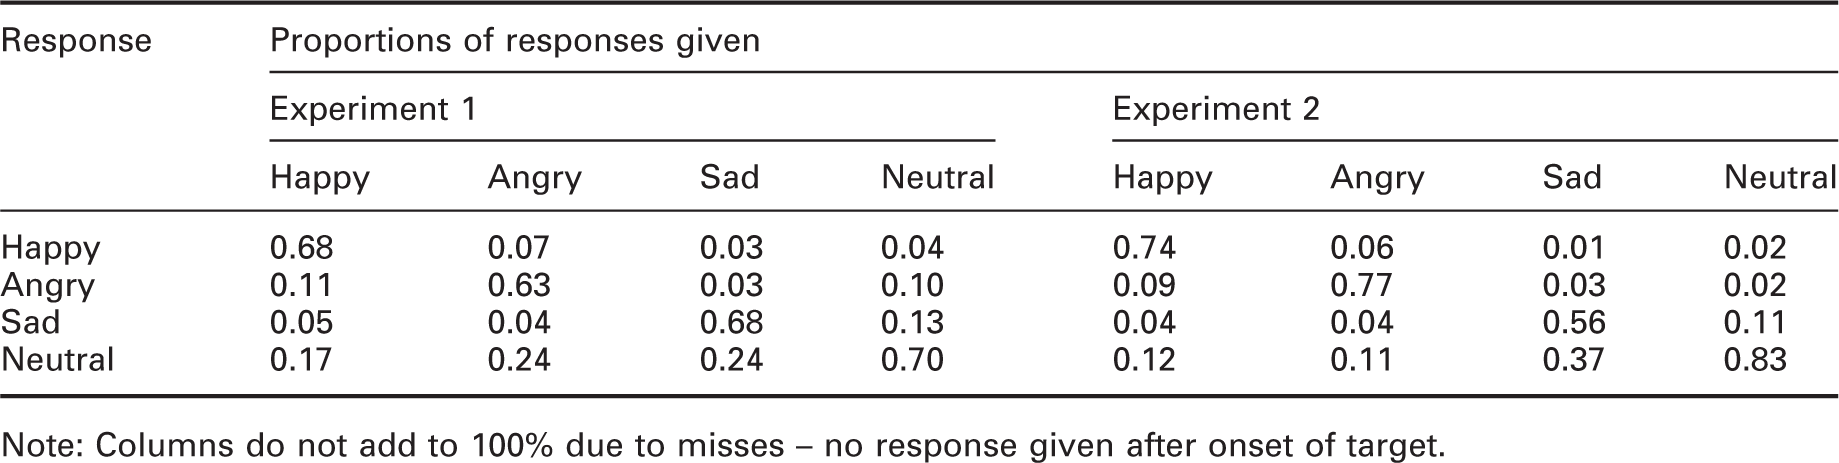
Note: Columns do not add to 100% due to misses – no response given after onset of target.
The tendency to say ‘neutral’ when unsure is a possible reason why the neutral expression received the greater proportion of correct responses in both experiments. In further work, this should be controlled for, either through the choice of visual target or by the frequency of presentation for each type of expression.
In this work, the obstacles were located in one of four locations. Whilst the order in which locations were used was randomised, the locations would have become familiar after a few trials. The effect of location familiarity can be seen in a study of intruder detection. 46 In their experiment 1, intruders were required to walk along the centre line of the test environment (an open field with fences to act as barriers for hiding behind) towards the observers; in their experiment 2, intruders were instructed to traverse the test environment in any manner they deemed likely to avoid detection. The results (their Table 18) show that detection distances were greater for the known (e.g. 86.8 m, HPS flood lighting) than unknown (60.4 m, HPS flood lighting) intruder routes. This suggests that obstacles are more easily detected in known or expected locations. Further work is required to determine whether this affects determination of optimal lighting for pedestrians.
This experiment used only a single lighting geometry. Variation in the relative locations of the obstacle, the lighting and the observer will change target contrast and shadow pattern. Previous work 8 suggests this can lead to significant differences on detection rate, with a higher detection rate found when the light source was overhead and a lower detection rate when located in front of the obstacle. The current study used light sources at both locations (Figure 2) to average the differences.
Eye movements are proactive, seeking out the information needed for a task in the moments before that task is carried out. 47 In these experiments, test participants were required to fixate toward the location of a face model. It may be the case that they chose instead to fixate towards the obstacle rather than the face model, in particular on those trials where the face model was absent. Gaze behaviour was not measured in the current study: In previous work, 48 investigating gaze behaviour during peripheral obstacle detection it was demonstrated using eye tracking that when instructed to fixate towards a fixation mark, test participants tended to do so. However, that was for an experiment with only one task and with the fixation mark being present in all trials: further work is required to determine if this tendency to maintain fixation as instructed is maintained in trials involving different tasks at two locations or when the fixation mark (here, the face model) is absent. Gaze behaviour may further be affected by limitations on observation duration. Mean fixation durations are in the order of 200 ms to 500 ms, 49 but vary with task characteristics, 50 increasing in duration as task difficulty increases, 49 and can be as short as 120 ms. 47 In the current work, the observation duration was 500 ms. Shorter or longer observation durations may lead to changes in gaze behaviour. The results of one study using a search task 49 suggest that reductions in observation duration (from 3.0s, to 2.25 or 1.5s) did not reduce fixation durations. Test participants are capable of very brief fixation durations but may not do so as continuous maximum performance leads to stress. 50
Finally, while this article is phrased in terms of multi-tasking, only two tasks were considered. The need to attend to, or expect to attend to, more than two tasks would further reduce the attention for any one task and the expectation of the next task in a series, and in doing so may further impair task performance.
7. Conclusion
This paper describes two experiments set up to examine the performance of obstacle detection and FER tasks under different light levels. This extended previous work by the requirement for observers to consider both tasks in parallel rather than as individual tasks in separate experiments, thus better resembling the multi-tasking of natural pedestrian situations. To promote ecological validity, the faces used in this work were 3D models rather than 2D images.
Performance of the on-axis FER task followed prediction using RVP. At lower adaptation luminances, an increase in luminance increased task performance, but from an adaptation luminance of 0.21 cd/m2 (a road surface illuminance of about 3.3 lx), further increase in luminance led to negligible increase in task performance. In the current work, this was a face luminance of 0.53 cd/m2. Performance of the off-axis detection task followed that predicted in previous work with a lower rate of detection at 0.33 lx than at the four higher illuminances.
It was found that the potential need to carry out two tasks led to a reduction in performance of the peripheral detection task, but did not impair the foveal FER task. This was established by comparing the results of the current work with those of previous studies where each task was investigated in separate experiments. Despite the impaired detection performance, the current results reveal the same optimal illuminance as found in previous work, a horizontal illuminance of about 1.0 lx.
Footnotes
Declaration of conflicting interests
The authors declared no potential conflicts of interest with respect to the research, authorship, and/or publication of this article.
Funding
The authors disclosed receipt of the following financial support for the research, authorship, and/or publication of this article: This work was carried out with support from the Engineering and Physical Sciences Research Council (EPSRC) (grant number EP/M02900X/1).