
Abstract
It is expected that the detection of peripheral objects, a key visual task for safe driving, is affected by cognitive distraction, by observer age and by the manner in which action is undertaken following detection. An experiment was conducted to measure these effects, using a fixation cross and peripheral target discs displayed on a screen. The experiment was repeated with young (18–25 years) and old (60+years) age groups, with six distraction tasks, and with simple and choice response modes. The older group was found to respond more slowly than the younger group and detected fewer targets. The results suggest that distraction impairs detection, with the degree of impairment depending on the difficulty of the distraction task. Participants were generally slower at responding with choice response but this did not lead to a greater number of missed targets. Where lighting standards are informed by the ability to detect peripheral hazards, the research should represent older people, choice responses and impaired detection due to distraction.
1. Introduction
1.1. Road lighting
Hazard visibility when driving is an important factor in the prevalence of road traffic collisions (RTCs). 1 There is a deterioration in drivers’ visual performance after-dark, resulting in, for example, losses in contrast sensitivity and motion-based perception. 2 A key purpose of road lighting is to offset this deterioration in vision and improve drivers’ ability to detect potential hazards. It is, therefore, important for research to identify the optimal lighting conditions in which to support drivers’ hazard perception.
Summary of past studies of lighting and detection of peripheral targets in the context of driving.
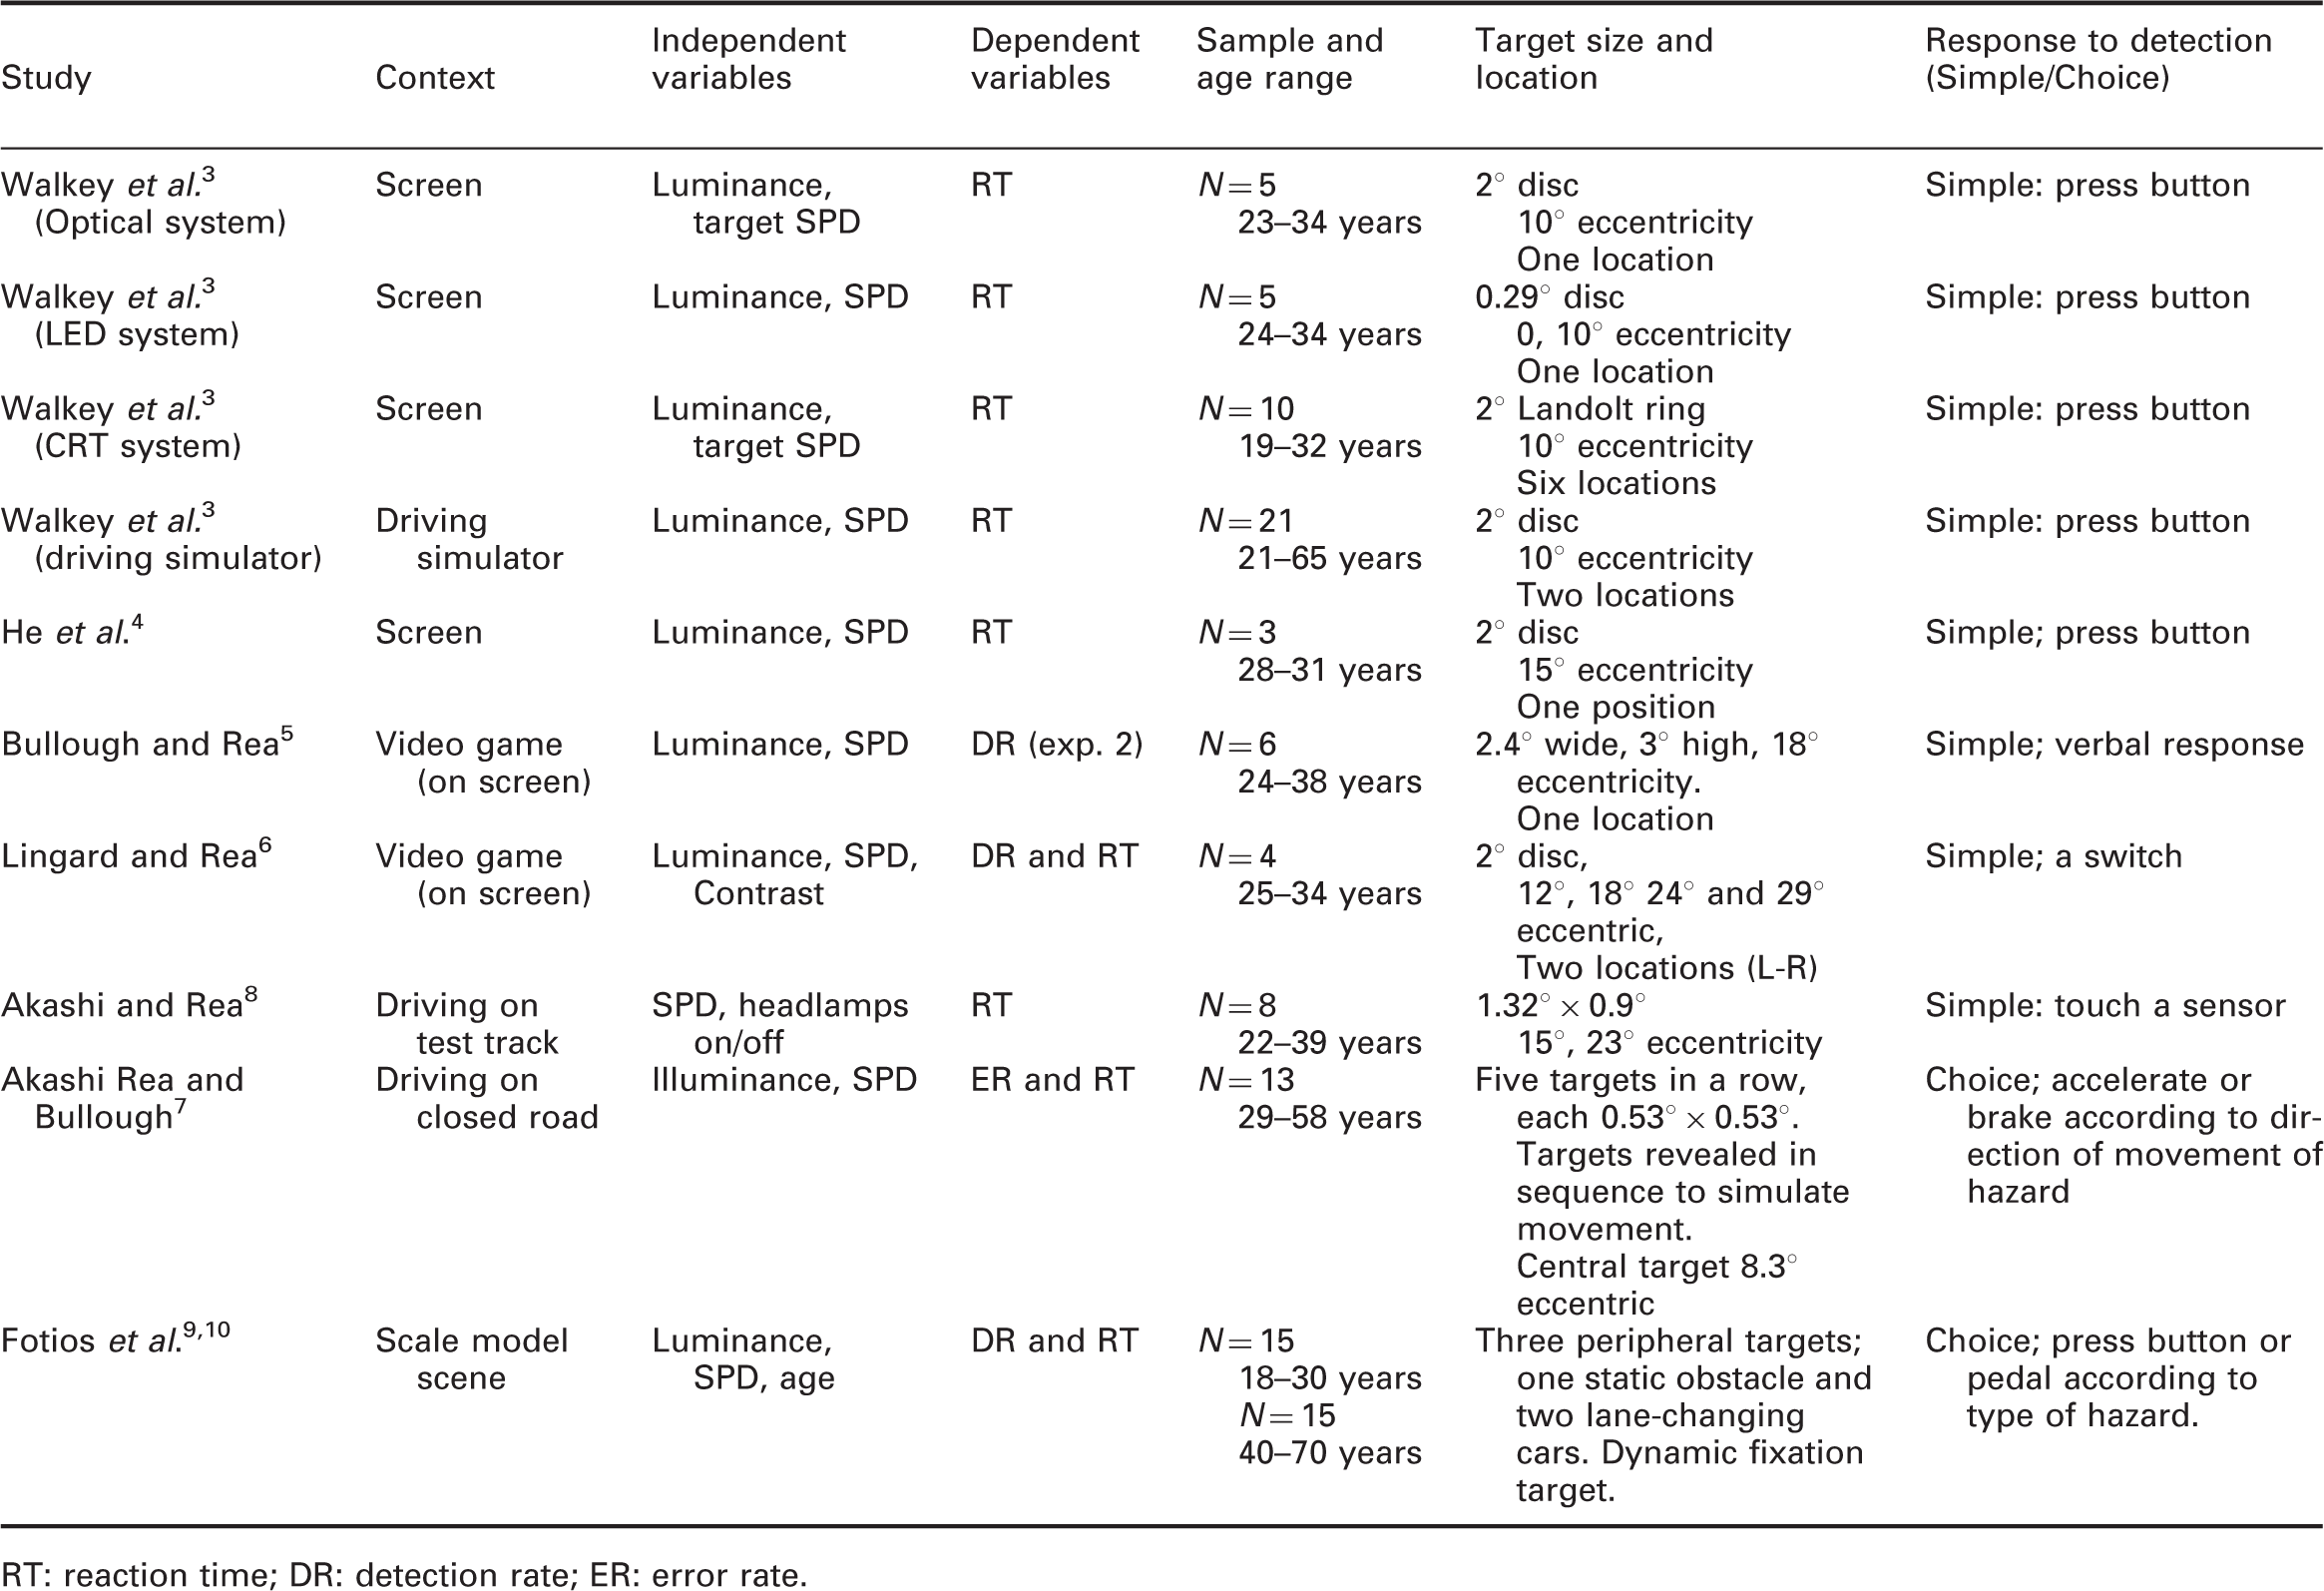
RT: reaction time; DR: detection rate; ER: error rate.
In some studies of peripheral target detection, the degree of context validity is increased by using computer-controlled video games,5,6 driving simulators 3 or by driving a real vehicle along a road. 7 In these experiments, in addition to the target detection task, test participants were also required to undertake a driving task, for example controlling the vehicle position using a keyboard or a steering wheel. Target detection was reported by pressing a button or verbally indicating detection. In Akashi et al. 7 where participants drove a vehicle along a closed road, their response to a target was either braking (perceived movement of target towards the road) or accelerating (perceived movement of target away from the road), a response which involves a choice of possible actions.
A common finding in peripheral detection experiments is that increases in luminance or scotopic/photopic (S/P) luminance ratio lead to an increase in detection probability and/or a reduction in RT to detection following onset of the target.4–10 At some point, the benefits of these increases reach a point from where further increase in luminance and/or S/P ratio bring negligible improvement, and this point provides a useful estimate of optimal lighting conditions.
We consider here three limitations of this body of work; the manner in which the response is given, impairment due to distraction and the age profile represented.
1.2. Response mode
Modes of response in detection experiments may be characterised as simple or choice. Past lighting studies have tended to use simple responses (Table 1) such as where the participant uses a single response button to indicate detection of a target, regardless of the characteristics of that target. Choice response involves multiple response buttons, of which only one button is considered the correct response for a target of particular characteristics. Safe driving requires choice responses, for example, whether to brake or to steer to avoid collision with an object in the road ahead. In some situations, only one of the available responses is appropriate. The brake-or-accelerate response used by Akashi et al. 7 was a choice response. Similarly, Fotios et al.9,10 used two response buttons, a foot switch to indicate detection of a static object on the road surface and a steering wheel button to indicate detection of a vehicle ahead changing lane.
After detecting a target, participants using choice response must also identify the relevant stimulus characteristic and select an appropriate response, leading to slower responses than if giving a simple response.11,12 This difference may affect the identification of optimal lighting criteria. Note, for example, that two studies9,10 using choice response found a significant effect of luminance on RT and DR but did not find a consistent effect of spectral power distribution (SPD): other studies investigating changes in SPD but using a simple response found significant effects of SPD.5,6 It would be useful to investigate further the implications of choice response when studying lighting and hazard detection.
1.3. Distractions
Drivers can be distracted from the essential tasks of driving.13,14 Driving distraction contributes to up to 25% of all road traffic crashes in EU countries 15 and 6% of all fatal crashes in the US, 16 although these are likely to be underestimates due to under-reporting. 17 Therefore, it is important to consider whether optimal lighting levels are equivalent for distracted drivers and those giving their full attention to the driving task.
Driving distraction involves a component of the driver’s attention being diverted to a secondary non-driving-related activity, reducing the cognitive resource available to support safe driving. 18 Distractions may be categorised into four groups: physical distraction such as operating in-vehicle entertainment systems; visual distraction such as looking at a satellite navigation device; cognitive distractions such as ruminating or daydreaming and auditory distraction such as listening to music.19,20 The prevalence of driving distraction has been investigated using two methods, interviews with drivers following collision 21 and observation of drivers on real roads. 22 A review of such work established that auditory distraction from conversation with passengers is the most prevalent distraction when driving. 23
Past studies of peripheral detection (Table 1) did not account for the effect, if any, of distractions. The interaction between lighting and distraction may be considered in two ways. First, the presence of distraction may impair detection performance, leading to a change in the interpretation of optimal lighting conditions. Impaired peripheral target detection performance resulting from distraction was observed by Akashi and Rea. 8 Second, lighting may be able to counter some types and degrees of distraction. For example, auditory distractions are suggested to cause an increase of gaze concentration towards the road centre 24 and thus away from hazards in the peripheral field: increase in S/P ratio may be able to offset this by enhancing detection in the peripheral visual field.
Distraction and lighting are therefore implicated as individually influencing hazard detection when driving, with lighting potentially mitigating the deterioration in detection when distracted. To date, however, there has been no study that has explored the interaction between distraction and lighting on drivers’ hazard detection. Understanding the effect of this interaction could improve policy recommendations for road lighting.
Driving requires attention to multiple tasks. 25 While these are not distractions, the performance of any one task may be impaired when performed in parallel with others and thus influence the relationship between lighting and task performance. This was investigated by Akashi et al. 26 where a foveal tracking task and a peripheral detection task were conducted, in dual-task and single-task modes, under three lighting conditions. It was concluded that performance of the peripheral detection task was impaired when the foveal task was made more difficult (a lower luminance) and hence that lighting of higher S/P ratio would be beneficial.
Future lighting research could investigate the impact of distraction by employing auditory stimuli such as conversation as a parallel task. It is, however, difficult to characterise, control and measure the level of distraction imposed, as needed to ensure a consistent level of distraction across trials. 27 An alternative approach is to use standardised distraction tasks, where the degree of distraction can be manipulated by varying specific components of the task. For example, Mehler et al. 28 used a delayed letter recall task, known as the n-back task, as a form of distraction in a series of driving simulator and on-road driving studies. In the n-back task, an audible series of letters is played to participants who are then required to report this sequence by repeating aloud either the last letter heard (n0), the last letter heard but one (n1) or the last letter heard but two (n2).
1.4. Driver age
Optimal lighting conditions may vary according to driver age. There is evidence that older drivers are at increased risk of crashing per mile driven after age 70. 29 This does not reflect any performance deficit associated with ageing, other than older drivers travelling a relatively low annual mileage, 30 which is predictive of crash involvement across all ages. However, visual difficulties in general, 31 and specifically when driving at night, 32 cause older people to drive less or stop driving entirely. Therefore, ensuring that lighting levels are optimal to support the visual systems of older drivers can help to maintain mobility and social connectedness in this vulnerable age group.
Changes in the visual system and changes in driving experience suggest age will have an impact on target detection and hence upon estimates of optimal lighting. Visual performance declines throughout adulthood, 33 tending to remain stable up to the age of around 50–60 years and then undergoing a rapid decline. 34 Optical performance of the eye deteriorates with age. The range of maximum to minimum pupil size diminishes with age, meaning that the elderly are much less able than young people to compensate for low light levels by opening their pupils. 35 With increasing age, the lens absorbs an increasing amount of light in the short wavelength region, reducing colour vision capabilities. 35 The degree of scatter within the eye also increases with age, progressively degrading the retinal image. 35 In terms of visual capability, increasing age is associated with impaired visual acuity, for near and distant targets, reduced contrast sensitivity and reduced ability to discriminate colours: this impairment tends to start from the age of about 60 years. 36
Haegerstrom-Portnoy et al. 36 demonstrated that the ability to detect targets in the peripheral visual field also deteriorates with age. With fixation towards a red LED, detection of green LEDs in the peripheral field indicated a relatively modest decline in performance with age, with detection ranging from 100% at 60 years to about 90% at 90 years. When this task was accompanied by a parallel task, which involved counting the number of times the red fixation LED turned off, then the age-related decline in performance of the detection task was much greater, from about 98% at 60 years to 30% at 90 years. These results suggest that it is cognitive impairment (the distraction) rather than visual impairment that reduces peripheral detection with age. Furthermore, age-related impairments to task performance are expected to increase as the cognitive demand of the task increases. 37
Past studies of peripheral detection in the context of driving (Table 1) have tended to recruit participants from the young and middle age ranges, which means the findings do not represent the elderly.
In two studies, participants were recruited from two different age groups (18–30 years and 40–70 years) and found mixed results about the effect of age9,10: while neither study found any differences in younger and older drivers’ RT to respond to the peripheral hazards, one 9 found that older drivers were worse at detecting a road surface obstacle compared to younger drivers.
In contrast, Easa et al. 38 found no effect of age on a letter recognition task while driving in a simulator. They compared three age groups: 19–27 (n = 25), 37–56 (n = 23) and 63–84 (n = 27). Under two road surface luminances (0.6 and 2.5 cd/m2), the task was to identify a certain letter from a series of four road-side signs, using a steering wheel button to indicate this, and the dependent variable was recognition distance. Participants of all ages were able to identify signs that were significantly further away with the higher road luminance.
Peripheral detection has also been studied in the context of pedestrians. Fotios and Cheal 39 recruited older (>60 years) and younger (<45 years) participants for trials at three pavement horizontal illuminances, 0.2 lux, 2.0 lux and 20 lux. They found a significant effect of age at 0.2 lux (p < 0.01), with younger people exhibiting better detection performance than older people, but did not find a significant effect at the higher illuminances. Similarly, Uttley et al. 40 found an effect of age on ability to detect a peripheral hazard at the lowest illuminance (0.2 lux), with the younger group (<35 years) being significantly better (p = 0.04) than the older group (>50 years), but not at the higher illuminances used (0.6 lux, 2.0 lux, 6.3 lux and 20 lux).
Overall, while it is expected that increasing age is associated with decreasing ability to detect peripheral hazards, there is insufficient direct evidence of how this varies with luminance (Table 1). If the age-related detriment is a factor of cognitive impairment rather than visual impairment, 36 then it is likely to be further exacerbated by cognitive distraction.
1.5. Aim
The present study was conducted as a preliminary step in our research programme in order to inform the design of future research addressing the limitations in the current road lighting research literature identified above. Specifically, we investigated the effects of a battery of secondary tasks that differ in form and attentional load on simple and choice visual RT tasks. We tested the extent to which the tasks cause similar distraction for older and younger participants. The primary experimental task involved responding to visual targets presented on a screen, similar to He et al. 4
2. Method
2.1. Stimuli and apparatus
A screen-based target detection task was carried out in parallel with one of a series of dual tasks to investigate the effect of distraction on DR and RT. The screen was an HP Probook laptop, having a size 340 mm × 190 mm with a resolution of 1366 × 768 pixels.
Whilst maintaining gaze towards a fixation cross, presented continuously at the centre of the screen, test participants were required to indicate (by button press) immediately the detection of a disc. The target discs appeared for 250 ms, individually, at a location towards one of the four corners of the screen (Figure 1). The eccentricity of this disc from the fixation cross was assigned randomly within the range of 15–18°. Previous investigation using eye tracking suggests that test participants tend to maintain gaze towards a fixation mark when requested to do so during a peripheral detection task,
41
but this was not independently verified in the current work. Furthermore, with the fixation cross being located in the centre of the quadrant marked by the four peripheral target locations, and with target presentation at each location being randomised, there would be no benefit in moving the direction of gaze towards any one target location. A screenshot of the four possible locations of the peripheral target discs. They are shown here at an eccentricity of 18° from the fixation cross. On a given trial, the disc appeared at only one location.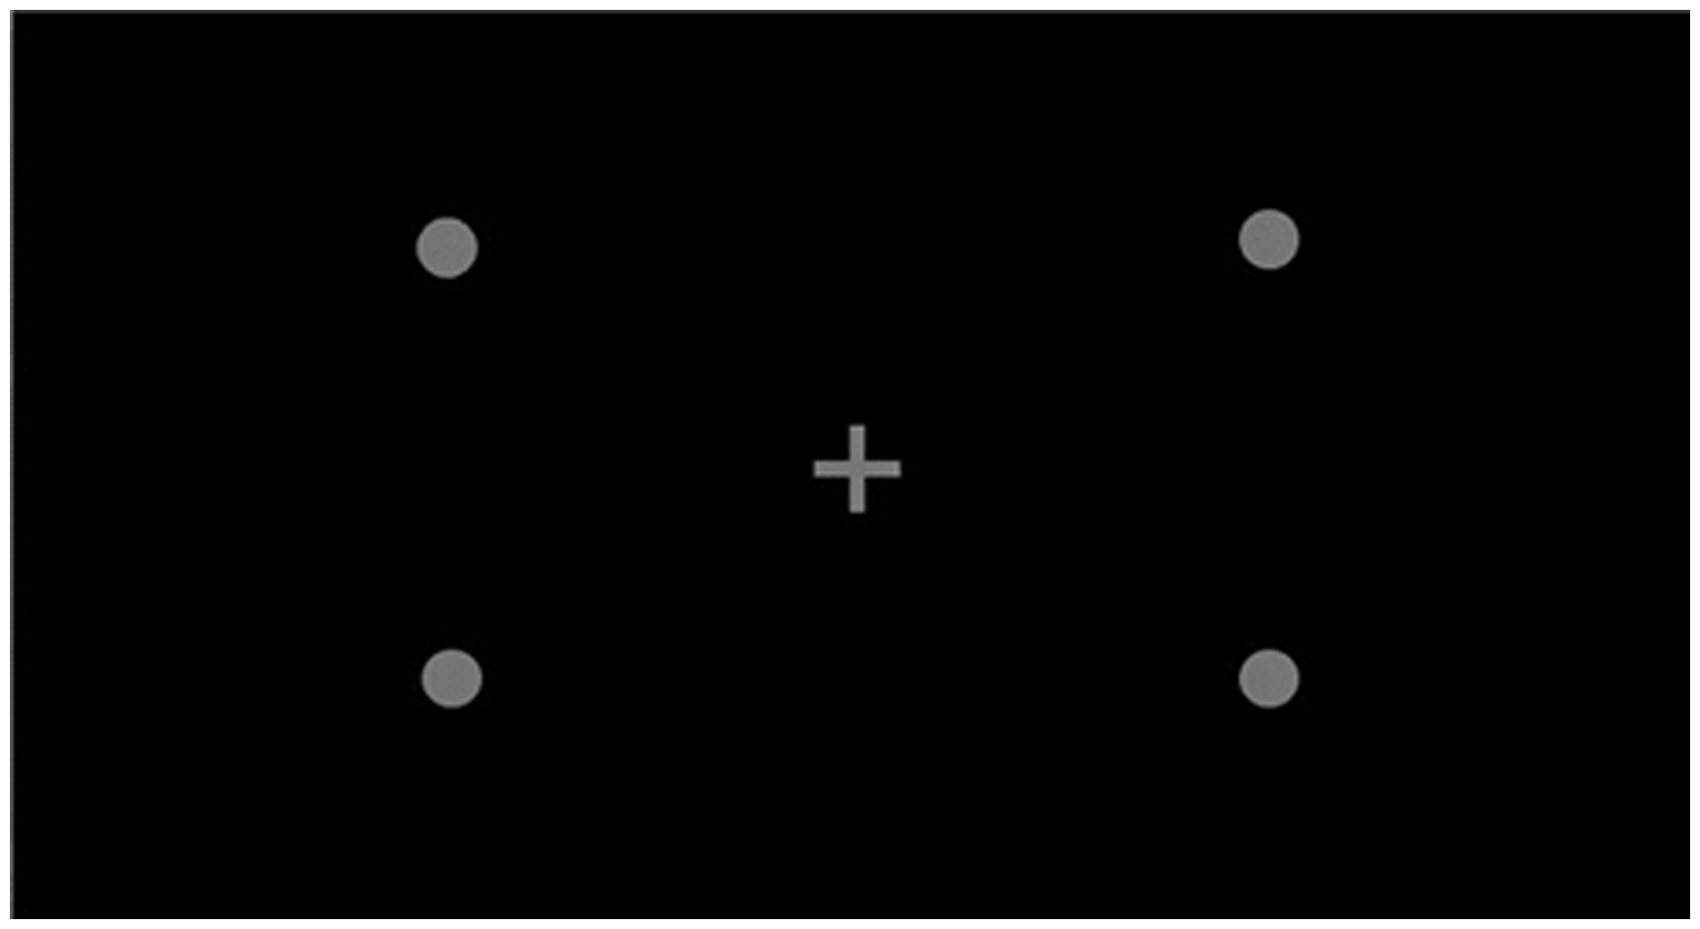
The screen was approximately 780 mm from the observers’ eyes, therefore subtending an angle of 24.6° in width, and 13.9° in height at the observer’s eyes, a solid angle of 0.11 sr. The screen was a black background to represent an outdoor scene after dark. The mean luminance (measured using a Konica-Minolta LS110 luminance meter) of 10 locations was 0.23 cd/m2 (standard deviation 0.05 cd/m2) similar to the lower-middle background luminance of previous work.5,6
The fixation cross was 18 mm in height and width, subtending an angle of 1.3° at the observer’s eyes, thus falling within the 2° foveal visual field. The peripheral targets had a diameter of 12 mm, subtending an angle of 0.88°. The fixation cross, numbers (see below) and detection targets were presented in grey (luminance 5.5 cd/m2, standard deviation 0.27 cd/m2) which was chosen so that the targets were easily seen when viewed off-axis.
Three standardised distraction tasks (and three variations in difficulty level for one of those tasks) were used to explore the variation in cognitive demand, to identify the level of impairment these distractions have.
Auditory distraction is particularly problematic for peripheral target detection 24 and is a prevalent on-road distraction. 23 The current experiment therefore included different types of auditory distraction task. These auditory tasks were compared to one visual task, number fixation, which was used in previous work for the purpose of fixation maintenance.9,10
There were six blocks of trials. In each block, the peripheral detection task remained constant but the distraction task varied. The distraction tasks were the n-back task (with three levels of increasing difficulty, n0, n1 and n2), a word-generation task, a number fixation task and a control (no distraction task). The letters (n-back task) and words were played to participants via the laptop speakers. There were no other intended distractions in the test room.
For the n-back task, a series of letters were presented, with a pause between each randomly chosen from the range of 2–4 s. Performance on this task was determined by the number of letters correctly reported.
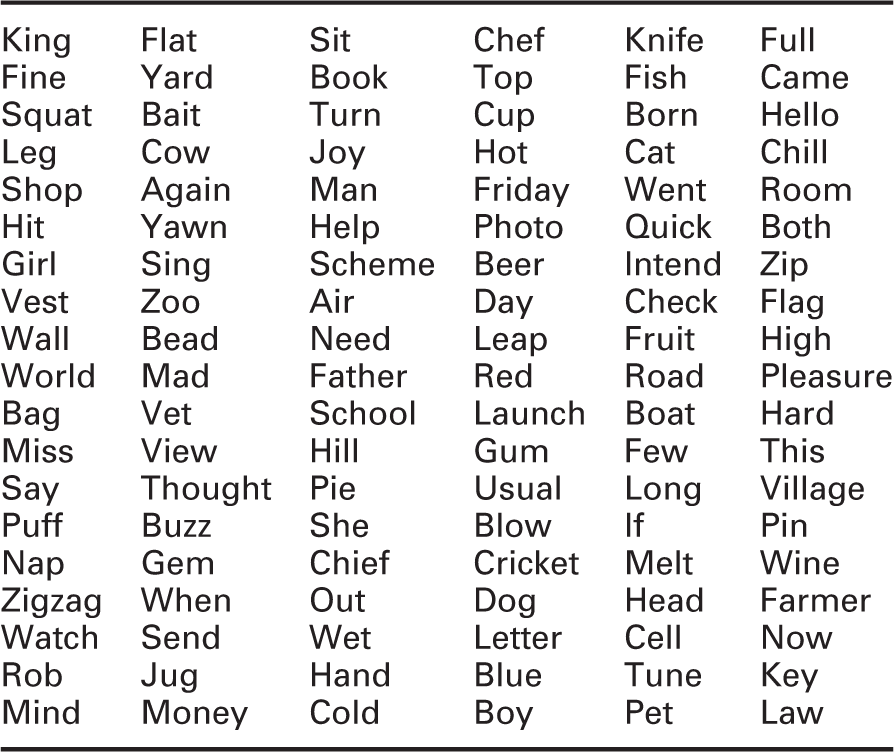
For the word generation task, a randomised sequence of English words was played over the speaker. Participants were required to say aloud a word beginning with the last letter of the word they had just heard. The participant was instructed to come up with a novel word on every occasion, rather than duplicate a word they had already given. The gap between each word was randomly chosen from the range of 4–6 s. The words used for this task are shown in Appendix 1. These are commonly used English words selected from, as a guide, those used to test children’s phonetic abilities during primary education (up to the age of 11 years). 42 This increased the chance that participants would be familiar with these words prior to the experiment. Performance on this task was measured by the number of correct words given, with a correct response being defined by the correct starting letter and novelty. If the same word were used a second time, this was marked as an error.
While the n-back and word-generation tasks involved an auditory stimulus, the number fixation task used a visual stimulus. The central fixation cross changed at randomised intervals (from 2.0 to 3.5 s) to a single-digit integer (1–9) which participants were instructed to read aloud. The digit remained on screen for 0.25 s. The digits used Ariel font, of on-screen height 28 mm subtending a visual arc of 2.0° at the observers’ eye. Performance on this task was determined by the number of digits correctly reported. This is similar to the visual field test of Haegerstrom-Portnoy et al. 36
To provide a baseline, there was also a control condition in which participants were required to conduct the peripheral detection task but without any parallel distraction task.
2.2. Design
The experiment used a 6 × 2 mixed design, with one within-subject factor of Distraction Type (control, n0, n1, n2, word generation, number fixation) and the between-subjects factor of either age (young ( >25 years) vs. older ( ≥60 years)) or response type (simple vs. choice) depending on the sub-group being analysed.
For target detection, there were two dependent measures – DR and RT (seconds) from onset of target to button press. Performance on the distraction tasks was characterised as the percentage of correct responses for each task.
2.3. Procedure
The experiment took place in a laboratory with the room lights turned off and daylight occluded using window covers.
In trials, participants were instructed to fixate on the fixation cross at all times, and respond as quickly as possible on detection of a peripheral target by pressing a button. Each target was displayed on screen for 250 ms.
Two types of response button were used. One group of younger test participants responded using the space bar of the laptop keyboard, with this single response button being used regardless of the target location. This is the simple response condition. For a second group of younger participants and the group of older participants, target detection was indicated using a button box. This box offered four individual buttons, arranged in a rectangular array to represent the locations of the on-screen targets. For correct detection, the button corresponding to the target location needed to be pressed. This is the choice response condition.
In parallel with the detection task, participants were required to perform the relevant distraction task. They were provided with instructions on how to respond to each task at the start of the relevant block. It was stressed to participants that they should try to perform both the target detection task and the distraction task to the best of their ability.
The six experimental blocks were carried out in a counterbalanced order, and the sequence of numbers, letters and words were randomised for each participant. Each block took 450 s to complete, which allowed for 140 target detection trials, with the complete experiment being completed in 45 min. There was a small break between blocks, where participants were reminded of the instructions for the next cognitive task before that block of trials commenced.
2.4. Participants
Eighty-nine participants were recruited and distributed amongst two groups of younger participants and one group of older participants. A power analysis conducted using G*Power 43 indicated that a sample size of 89 was sufficient to detect a medium size effect (f = 0.25, 1 -ß = 0.99, p = 0.05). Participants completed a consent form after reading the experimental information sheet and received a small payment once the tests were completed.
The 60 young participants were aged 18–25 years. This range is similar to that (17–24) used by the (UK) Department for Transport to define young car drivers, for whom there is a high casualty rate when weighted by distance travelled. 44 One group of 30 completed the experiment using the simple response and the other group of 30 used the choice response. For both groups, there were equal numbers of males and females. The older group comprised 29 people aged 60 years and above, this threshold being associated with the onset of significant impairment to visual functions. 36 The older group included 9 males and 20 females, all of whom completed the experiment using only the choice response. All participants had a visual acuity of at least 6/12, the minimum standard for UK drivers, 45 as tested at the start of the experiment, and conducted with habitual correction in place. All participants had normal colour vision as tested using the Ishihara colour plates.
3. Results
Figure 2 shows mean RTs broken down by both age and response type for the six distraction tasks. It can be seen from Figure 2 that for older participants, the mean RTs are longer than those for the younger participants who were also using the choice response, with this difference being greater when the distraction task becomes more difficult. For the younger participants, mean RTs for the group using the choice response are longer than those for the group using the simple response: this difference is larger for control and n0 distraction tasks than for the other four distraction tasks. Distraction effects were greatest in the n2 and word-generation conditions, with some disruption in n1 and number fixation but only minimal disruption in n0. These data suggest that response mode has a larger effect than age in terms of RT to detect peripheral targets. Mean reaction times to detection of a peripheral targets according to age, response type and distraction task. Error bars show one standard error above and below the mean.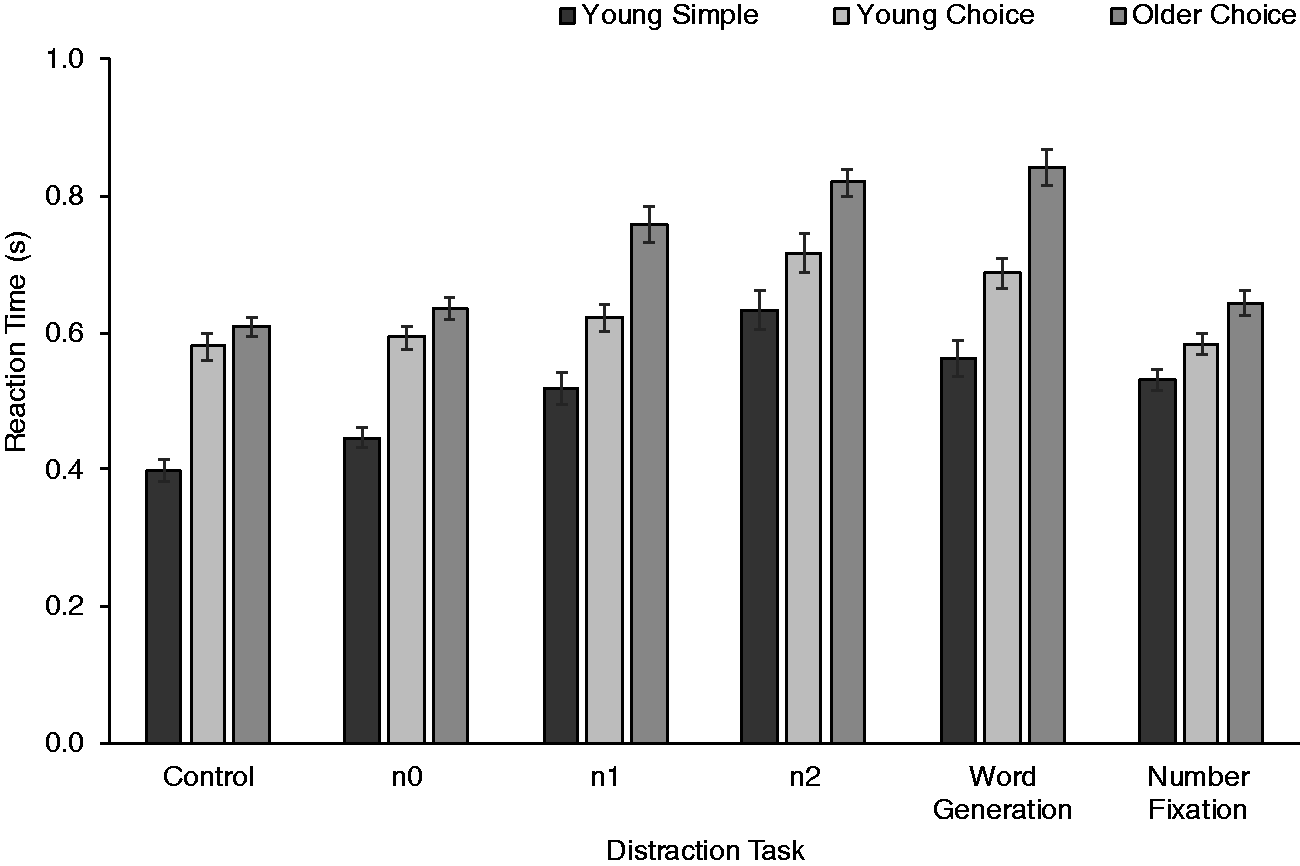
Figure 3 shows mean ERs (percentage of peripheral targets missed), broken down by both age and response type for the six distraction tasks. First, consider the effect of age from two groups using the choice response. It can be seen from Figure 3 that older participants had a higher ER than younger participants, with this difference being larger for the more difficult distraction tasks. Next, consider the effect of response type between the two groups of younger participants. Here, the trend appears to be more complex. Using the choice response resulted in a greater ER than the simple response for the control and n0 distraction tasks, but a lower ER for the four more-difficult distraction tasks. Mean error rate according to age, response type and distraction task. Error bars show one standard error above and below the mean.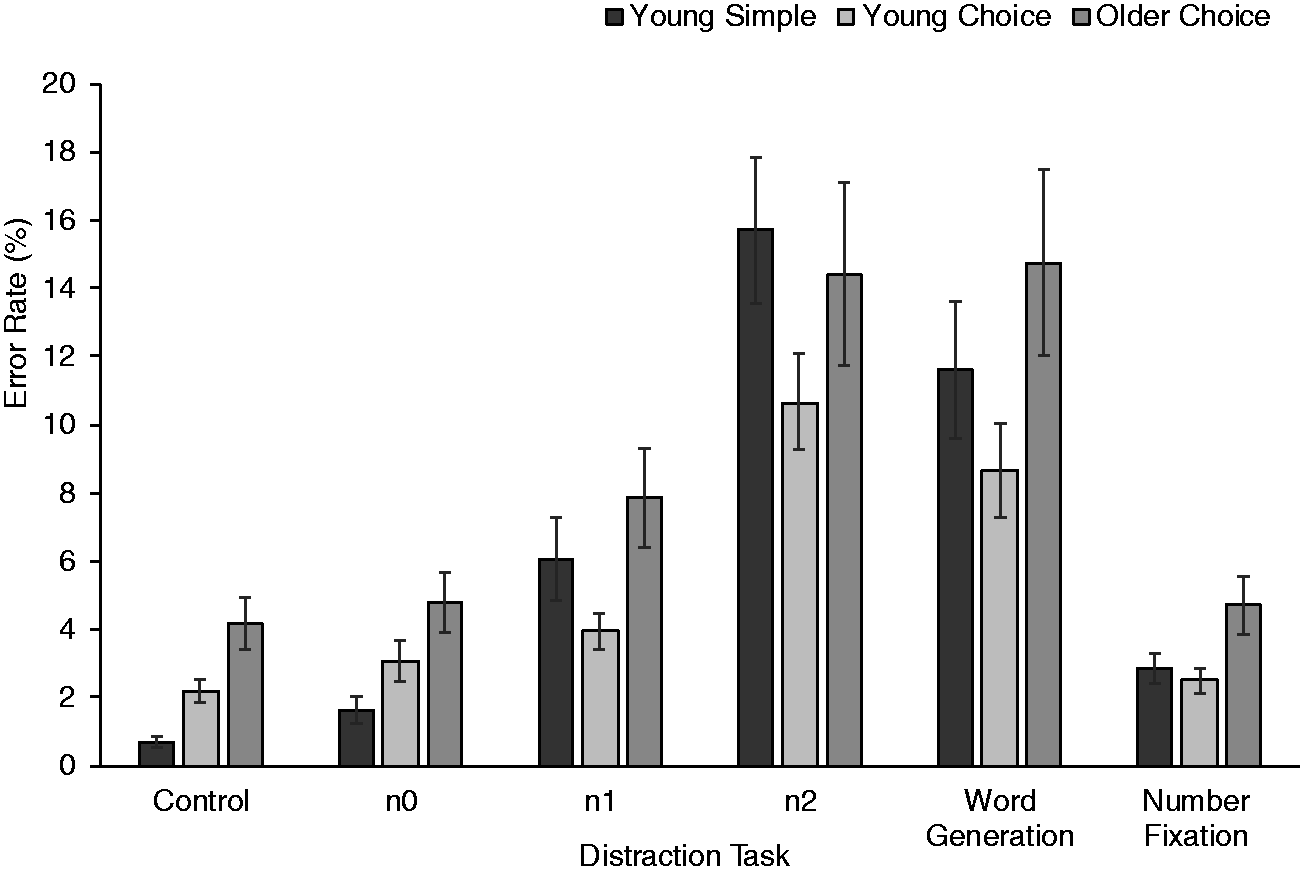
The Kolmogorov–Smirnov test suggested RT data to be normally distributed for all distraction tasks other than for trials using the n1 distraction task. A square root transformation was applied to all RT data which led to all RT data exhibiting a normal distribution.
For ER, the data from all distraction tasks were not normally distributed (p < 0.002), as revealed by the Kolmogorov–Smirnov test and histograms showing positively skewed data. A cube root transformation was used on the data, as this transformation can be used on positively skewed data that contain zeros, and is weaker than the logarithm. 46 After this transformation, all distraction tasks showed a normal distribution (p > 0.06) and therefore these transformed data were used for all subsequent statistical tests.
As the within-subjects factor of distraction type included six levels, Mauchly’s test of sphericity was used and in cases where a significant breach of sphericity was detected, significance testing has been conducted using Greenhouse–Geisser adjusted degrees of freedom. Occasions where the correction was used are indicted by decimal places in the reported degrees of freedom.
Performance on the five distraction tasks was recorded in addition to ER and RT. These data were not normally distributed according to the Kolmogorov–Smirnov test. Distraction performance data were analysed using a non-parametric Friedman’s test to compare participants’ performance on the distraction tasks (n0, n1, n2, word generation and number fixation).
4. Effect of age
The effect of age was investigated using a 6 × 2 mixed design, with the within-subject factor of Distraction Type (control, n0, n1, n2, word generation, number fixation) and the between-subjects factor of age (younger ( >25 years) vs. older ( ≥ 60 years)) for the dependent variables of RT and ER. Only the choice response data were used here as older participants did not take part in the simple response condition.
4.1. Age, distraction and RT
Mean RTs for younger and older participants in the choice response condition for all six distraction tasks can be seen in Figure 2. A main effect of Distraction Type was found (F (3.91, 223.34) = 81.73, MSe = 0.002, p < 0.001, n2p = 0.59). Pairwise comparisons with a Bonferroni-adjusted significance level (p < 0.008) for multiple comparisons indicated that participants responded to the peripheral targets significantly faster in the control condition compared to n1, n2 and word generation (p < 0.001) but were not significantly different from n0 (p = 0.20) and number fixation (p = 0.40). Participants responded significantly faster when completing n0 compared with n1, n2 and word generation (p < 0.001), but this was not significantly different for number fixation (p = 1.0). Participants’ responded to peripheral targets significantly slower when completing n1 compared to number fixation, but were significantly faster than n2 and word generation (p < 0.001). Participants’ responded to peripheral targets significantly slower when completing n2 and word generation compared to any other task (p < 0.001); however, these did not significantly differ from one another (p = 1.0).
A main effect of age was found (F (1, 57) = 13.71, MSe = 0.02, p < 0.01, n2p = 0.19), indicating that older participants responded to peripheral targets slower (mean = 0.72 s) compared to younger participants (mean = 0.63 s). There was also a significant interaction between distraction type and age (F (3.91, 223.34) = 7.63, MSe = 0.002, p < 0.001, n2p = 0.12). Post hoc tests with Bonferroni correction were conducted (p < 0.008). This revealed that while older participants are significantly slower than younger participants at responding to peripheral targets when completing n1, n2 and word generation (p = 0.003), there was no significant difference for control (p = 0.17), n0 (p = 0.06) or number fixation (p = 0.01).
4.2. Age, distraction and ER
Mean percentages of peripheral targets missed for younger and older participants in the choice response condition for all six distraction tasks can be seen in Figure 3. A main effect of Distraction Type was found (F (4.38, 249.73) = 47.57, MSe = 0.23, p < 0.001, n2p = 0.46). Pairwise comparisons with a Bonferroni-adjusted significance level (p < 0.008) for multiple comparisons indicated that participants missed significantly fewer peripheral targets in the control condition compared to n1, n2 and word generation (p < 0.001), but this was not significantly different from n0 and number fixation (p = 1.0). Participants missed significantly fewer peripheral targets in n0 compared to n1, n2 and word generation (p < 0.01) but not control and number fixation (p = 1.0). Participants missed significantly fewer peripheral targets in n1 compared to n2 and word detection (p < 0.001), but missed significantly more targets compared to control, n0 and number fixation (p < 0.01). Participants performance in n2 was not significantly different to word generation (p = 1.0), and participants missed significantly more peripheral targets when performing n2 and word-generation tasks compared to all other distraction tasks (p < 0.001). Finally, participants missed significantly fewer peripheral targets during number fixation compared to n1, n2 and word generation (p < 0.001), but was not significantly different to control and n0 (p = 1.0).
There was a main effect of age (F (1, 57) = 12.83, MSe = 0.83, p < 0.01, n2p = 0.18) indicating that younger participants missed significantly fewer peripheral targets (mean = 5.17%) compared to older participants (mean = 8.44%). However, there was no significant interaction between distraction task type and age (F (4.38, 249.73) = 0.29, MSe = 0.23, p = 0.89, n2p = 0.01).
5. Effect of response type
The effect of response type was investigated using a 6 × 2 mixed design, with the within-subject factor of Distraction Type (control, n0, n1, n2, word generation, number fixation) and the between-subjects factor of response type (simple vs. choice) for the dependent variables of RT and DR. Therefore, for these comparisons, we compared younger participants in the simple and choice response conditions.
5.1. Response type, distraction and RT
Mean RTs for younger participants in the simple and choice response conditions for all six distraction tasks can be seen in Figure 2. It was found that there was a main effect of distraction task type (F (3.08, 178.67) = 68.16, MSe = 0.003, p < 0.001, n2p = 0.54). Pairwise comparisons with a Bonferroni-adjusted significance level (p < 0.008) for multiple comparisons indicated that participants responded to the peripheral targets significantly faster in the control condition compared to any of the other distraction tasks (p < 0.001). Participants responded significantly faster when completing n0 compared to n1, n2, word generation and number fixation but significantly slower than control (p < 0.001). There was no significant difference in participants RTs when completing n1 and number fixation (p = 1.0), but participants were significantly faster in these tasks compared to n2 and word generation (p < 0.001). Finally, participants responded to peripheral targets significantly slower when completing n2 compared to word generation (p < 0.01).
There was a main effect of response type (F (1, 58) = 26.16, MSe = 0.02, p < 0.001, n2p = 0.31), with participants responding to peripheral targets faster in the simple response condition (mean = 0.52 s) compared to the choice response condition (mean = 0.63 s). There was also a significant interaction between distraction task type and response type (F (3.08, 178.67) = 9.92, MSe = 0.003, p < 0.001, n2p = 0.15). Post hoc tests with Bonferroni correction were conducted (p < 0.008). This revealed that the simple response Condition were significantly faster at responding to peripheral targets than the choice response condition for control, n0, n1 and word generation (p < 0.001), but were not significantly different for number fixation (p = 0.02) or n2 (p = 0.04).
5.2. Response type, distraction and ER
Mean percentage of peripheral targets missed for younger participants in the simple and choice response conditions for all six distraction tasks can be seen in Figure 3. A main effect of Distraction Type was found (F (4.17, 242.11) = 71.70, MSe = 0.27, p < 0.001, n2p = 0.55). Pairwise comparisons with a Bonferroni-adjusted significance level (p < 0.008) indicated that participants missed significantly fewer peripheral targets in the control condition compared to all distraction task types (p < 0.001) except n0 (p = 0.21). Participants missed significantly fewer peripheral targets in n0 compared to n1, n2 and word generation (p < 0.001) but not number fixation (p = 0.34). Participants missed significantly fewer peripheral targets in n1 compared to n2 and word generation (p < 0.001), but was not significantly different to number fixation (p = 0.21). Participants’ performance with n2 was not significantly different to word generation (p = 0.01), but both n2 and word generation caused participants to miss significantly more targets tasks than all other distraction tasks (p < 0.001). Finally, participants missed significantly fewer peripheral targets during number fixation compared to n2 and word generation (p < 0.001), significantly more targets compared to control (p < 0.001), but this was not significantly different to n0 (p = 0.34) and n1 (p = 0.21).
There was no main effect of response type (F (1, 58) = 0.28, MSe = 1.21, p = 0.60, n2p = 0.01); however, there was a significant interaction between distraction type and response type (F (4.17, 242.11) = 6.02, MSe = 0.27, p < 0.001, n2p = 0.10). Post hoc tests with Bonferroni correction were conducted (p < 0.008). This revealed that the participants in the simple response condition missed significantly fewer targets than in the choice response condition for control (p < 0.001), but were not significantly different for n0 (p = 0.08), n1 (p = 0.85), n2 (p = 0.14), word generation (p = 0.51) or number fixation (p = 0.32).
6. Distraction task performance
The mean (mean percentage correct) and standard deviation (SD) performance in the five distraction tasks.
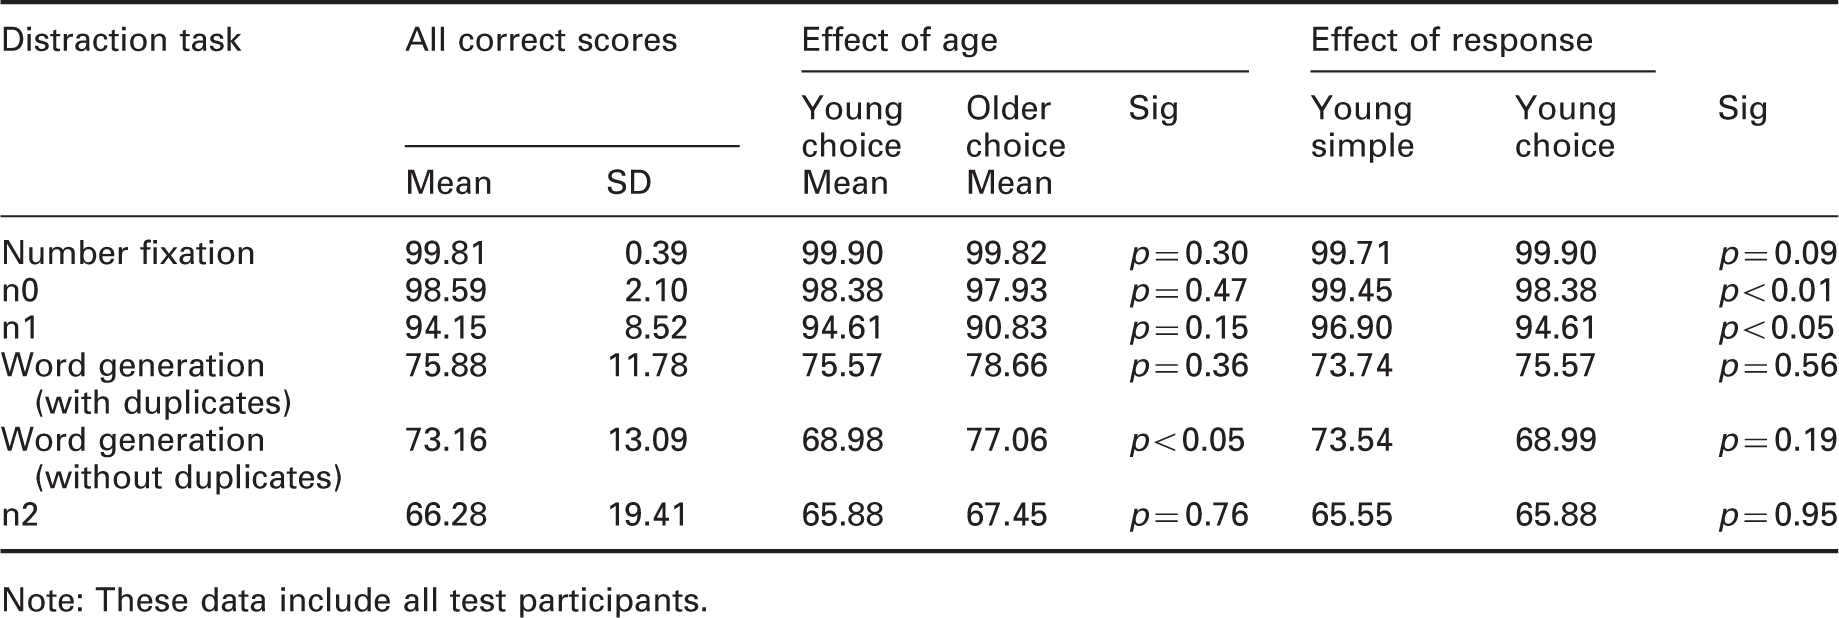
Note: These data include all test participants.
The Z-scores and significance (Wilcoxon signed-rank test) comparing performance in the five distraction tasks.
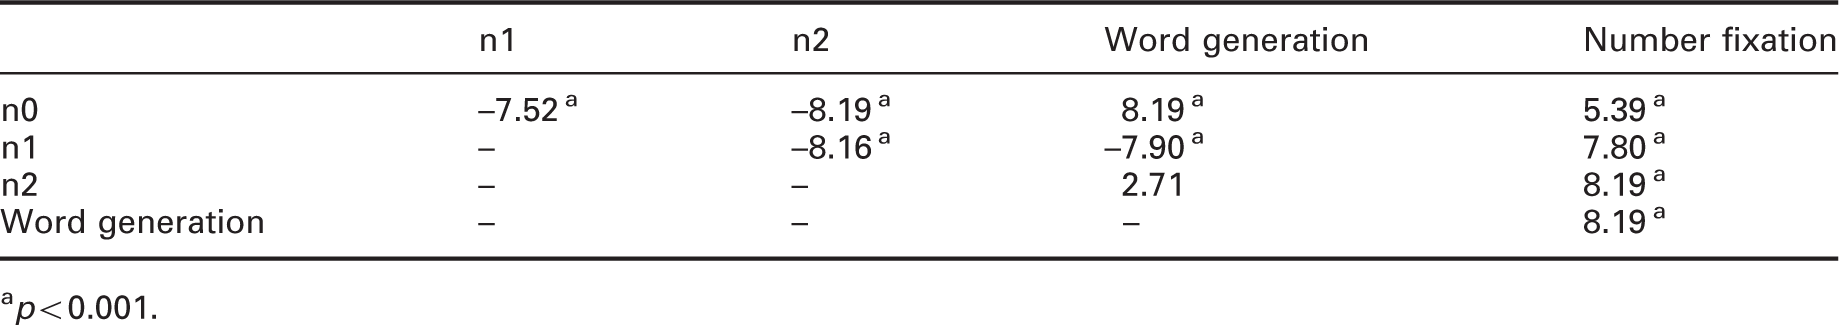
p < 0.001.
Table 2 also shows participants performance on the five distraction tasks, broken down by age and by response mode. Between-subject t-tests were conducted to see if there were significant differences between the groups. It can be seen that while younger participants performed better than older participants when the task was relatively easy (number fixation, n0 and n1), these differences were not statistically significant. Older participants performed better on the relatively hard distraction tasks (word generation and n2), but the difference was significant only for the word-generation task (without duplicates). As for response mode, the differences between simple and choice responses were small and significant only for the n0 and n1 tasks, with reduced distraction task performance found when using the choice response for the detection task.
7. Discussion
The experiment described in this article was conducted to compare the detection of peripheral targets with and without parallel cognitive distraction. In addition, it examined the effect of observer age and response mode.
The results confirm that distraction impairs the detection of peripheral targets, and in particular that non-visual distractions can impair the detection of peripheral visual targets. In terms of ER and RT, the distraction tasks tended to fall into three groups, with the control, n0 and number fixation tasks imposing the least distraction, the n1 task imposing significantly more distraction, and the word generation and n2 tasks imposing the greatest amount of distraction. These groups are reflected in performance of the particular task (Table 2), in that the more demanding the distraction task, the harder it was to detect peripheral visual targets. One deviation from this trend is that analysis of response mode using RT suggested significant differences between all tasks except for between n1 and the number fixation task.
Older participants tended to respond more slowly to target detection than did younger participants for the n1, n2 and word-generation tasks (the more difficult distraction tasks – Table 2) but not for the control, n0 or number fixation tasks. For all distraction tasks, older participants missed significantly more detection targets than did younger participants.
We expect age-related impaired detection to be associated with the additional cognitive load of distraction. 36 For the word generation and n2 tasks, which were the most disruptive distractions, older participants performed slightly better than younger participants; however, this difference was only significant for word generation. This suggests that older participants opted to give more attention to the more complex distraction tasks at the expense of the detection task: similar effect has been shown in previous work. 37
In this work, the instructions did not specify to which task, the distraction task or the detection task, participants should give priority attention but to perform both tasks to the best of their ability. This was sufficient for the current purpose of discriminating between the different distraction tasks. In some previous work, participants were instructed to prioritise driving over the secondary task or vice-versa47,48; in other studies, like the current work, the participant was not instructed to prioritise one task over the other. 49 Without priority instruction, different participants may have chosen different priorities: further work is required to determine the degree to which this adds heterogeneity in the results. A study of gait stability whilst walking suggests that gait stability will be prioritised over the performance of a secondary cognitive task when no specific prioritisation instruction is given. 50 In trials with priority instruction, it would be interesting to investigate a participant’s tendency and consistency to follow the assumed prioritisation – different drivers are unlikely to respond similarly to instructions concerning task priorities. 51 In future work, it could be useful, upon completion of trials, to ask participants about their task prioritisation.
One consideration is whether drivers’ task prioritisation or the influence of distraction vary with age. Roadside observation studies of driving distraction did not find a significant effect of age on the prevalence of passenger conversation, 52 the most frequently observed driver distraction, 23 but found a decrease in mobile phone distraction with age.22,52
The interaction between age and task priority allocation was investigated in a study of walking. 53 Participants were drawn from younger (mean age 27 years) and older (mean age 72 years) age groups. In some trials, walking along a 30 m corridor was accompanied by a verbal fluency task similar to the word-generation task of the current work, with instructions to prioritise either walking, the verbal fluency task, or neither, in separate trials. When asked to prioritise walking, walking speed increased, and when asked to prioritise the verbal fluency task, walking speed decreased: the direction of change was the same for both age groups but the magnitude of the change was smaller for the older age group. This was interpreted as the older group having a reduced ability to prioritise and flexibly allocate attention among different tasks.
In real driving, failure to detect a hazard may have significant consequence, such as personal injury or monetary cost. One reason why some participants may have concentrated more on the distraction task than on the detection task is that there was no consequence for not doing so. A possible solution is to introduce a consequence, such as additional payment to the test participant for each item detected and deducted payment for each item missed. While some past studies have demonstrated an improvement in task performance following reward, the improvement may be slight, 54 it may depend on the nature of the task 55 and how the incentive reward is communicated, 56 or may have no effect on performance. 57 It would be interesting to see whether task performance consequence makes much difference to the detection task and the effect of different distractors.
Choice responses led to significantly longer RTs than did simple responses for all distractions except number fixation or n2, the easiest and most difficult of the five distraction tasks respectively (Table 2). In terms of ER, the effect of response mode was not significant except during trials with the control task (no distraction) in which case there were fewer missed targets in trials with the simple response than with the choice response. In other words, participants were generally slower at responding with choice response but this did not lead to a greater number of errors. For a real driving situation, this translates as distraction did not prevent the hazard from being seen, but the response action was delayed and response delay increases the risk and severity of an RTC.
To extend current knowledge of road lighting and hazard detection, one factor in the basis of road lighting standards, these results show that further work should account for distraction, observer age and response mode.
We do not suggest that these are the only important factors that deserve consideration. The detection of peripheral hazards may also be affected by the driver’s expectation and the traffic complexity. Traffic complexity, as might be defined by variation in the types of road user (e.g. cyclist, pedestrian and motorist) and variation in traffic speed, is known to affect the risk of RTCs.58–60 Regarding expectation, eye tracking has demonstrated that drivers develop a visual scanning strategy which gives greater attention to the detection of more frequent dangers, ignoring and possibly masking detection of less frequent dangers. 61 Traffic complexity influences the items that a driver should aim to detect and identify; expectation influences the degree to which covert attention is drawn towards some items rather than others.
It has been suggested that conversation is a critical distraction when driving 23 and the current results confirm that parallel distraction impairs the ability to detect peripheral targets. However, it is difficult to establish the degree of distraction imposed by conversation due to it being unstructured, emotionally involving, and needs to be tailored to each participant 27 and the nature of the conversation. Using a standardised task rather than natural conversation in further work offers better consistency between participants and trials and therefore a more controlled study design on which to base lighting standards. Of the distraction tasks used in the current work, the word-generation task may be considered the closest to natural conversation: it required listening (to the given word); reflection (determination of the last letter of that word); and action (think of a new word beginning with that letter and say it aloud). A limitation of the word-generation task is that the choice of given words may cause variation in task difficulty, for example where homophones have different end letters. We would recommend the n-back task is used in further work. It appears in each of the three task difficulty groups, showing that the difficulty of that task can be manipulated by changing n. The higher of the three levels used here (n2) offered similar distraction to the word-generation task. The n-back task is also a well-defined task, in that the stimuli are letters which are well known to native speakers of that language.
Response mode may affect analyses conducted using RT (but not ER) which is a common approach (Table 1). Choice response should be used in studies informing lighting design guidance because that offers the greater ecological validity. That the effect of response mode was not revealed when analysing ER suggests that both RT and ER (or, RT and DR) should be analysed in hazard detection studies: that a study reveals no effect of an independent variable on ER could be misleading if there was an un-measured impairment in time to react.
Observer age affects detection performance, with older people performing less well than younger people at peripheral detection. Where lighting design guidance is based upon detection ability, it should therefore be established from studies which account for the visual capabilities of older people; doing so ensures that the guidance also meets the needs of younger people. Note that the visual acuity test was used to confirm only that the minimum standard for driving was met, as in previous work. 49 The precise visual acuity of test participants was not recorded.
In this work, test participants were not driving during trials but seated in a laboratory and responding to targets on a display screen. This contrasts with previous work where detection was studied while participants drove a vehicle,7,8 but in which context it could be unethical to introduce purposeful distraction. This suggests a suitable option for further work would be to use driving simulators; the participant conducts the normal tasks of driving and the experimenter can introduce distraction without risk of physical injury to the participant. However, driving simulators are, as yet, unable to precisely vary lighting characteristics. Furthermore, while head movements when driving in real and simulated situations are similar, there are differences in gaze behaviour, with longer fixations in the simulator than when driving on-road. 62 Overall, this shows that data from a range of experiments are needed.
This work was conducted as a pilot study prior to further tests where lighting conditions will be changed. There were no changes to the target stimulus, either through changes in ambient lighting or target contrast on screen. A limitation is that whilst the results indicate impairments to detection due to age, distraction task and response mode, it is not possible to compare the significance of these impairments with those associated with changes in lighting conditions. That will be investigated in further work.
Further work is needed to establish optimal lighting for hazard detection whilst driving. We recommend trials in laboratory settings, simulators and on-road to consider the limitations of any one approach. In simulator and on-road driving, a choice response to detection of a hazard is inherent; in abstract laboratory tasks such that of the current work, we would recommend choice rather than simple response. To standardise distraction, of those tasks considered in the current work, we recommend the n2 n-back task. To establish the effect of changes in lighting, we would recommend a range of conditions chosen to enable changes in detection performance from chance to maximum.
We would recommend the use of young and elderly participants to consider the changes with age in visual function, driving experience and approaches to dealing with secondary tasks. For some tasks, the differences between young and elderly test participants is negligible 40 in which case age does not affect the choice of optimal conditions. If there is a significant effect of age, this may be addressed by establishing optimal lighting using the results only of the age group requiring the more extreme criteria.
8. Conclusions
An experiment was conducted to investigate the effect of distraction on participants’ ability to detect targets in peripheral vision. Distraction can significantly impair detection performance, with the degree of impairment depending on the difficulty of the distraction task. Participants represented younger (18–25 years) and older (60+ years) age groups. The older group was found to respond more slowly than the younger group and detected fewer targets. Two groups of young participants were compared, one indicating target detection with a simple response and the other with a choice response which required correct identification of target location. Participants were generally slower at responding with choice response but this did not lead to a greater number of missed targets.
Detection of hazards is a critical task for driving and the potential for road lighting to mitigate impaired vision after dark is one factor in the determination of lighting standards.
Lighting standards should be informed by work that represents older people, choice responses and impaired detection due to distraction.
Footnotes
Declaration of conflicting interests
The author(s) declared no potential conflicts of interest with respect to the research, authorship, and/or publication of this article.
Funding
The author(s) disclosed receipt of the following financial support for the research, authorship, and/or publication of this article: This work was carried out with support from the Engineering and Physical Sciences Research Council (EPSRC) grant number EP/S004009/1. Scott Fox is an Economic and Social Research Council (ESRC) Studentship Award Holder through the White Rose Doctoral Training Partnership (WRDTP).
Appendix 1
| King | Flat | Sit | Chef | Knife | Full |
| Fine | Yard | Book | Top | Fish | Came |
| Squat | Bait | Turn | Cup | Born | Hello |
| Leg | Cow | Joy | Hot | Cat | Chill |
| Shop | Again | Man | Friday | Went | Room |
| Hit | Yawn | Help | Photo | Quick | Both |
| Girl | Sing | Scheme | Beer | Intend | Zip |
| Vest | Zoo | Air | Day | Check | Flag |
| Wall | Bead | Need | Leap | Fruit | High |
| World | Mad | Father | Red | Road | Pleasure |
| Bag | Vet | School | Launch | Boat | Hard |
| Miss | View | Hill | Gum | Few | This |
| Say | Thought | Pie | Usual | Long | Village |
| Puff | Buzz | She | Blow | If | Pin |
| Nap | Gem | Chief | Cricket | Melt | Wine |
| Zigzag | When | Out | Dog | Head | Farmer |
| Watch | Send | Wet | Letter | Cell | Now |
| Rob | Jug | Hand | Blue | Tune | Key |
| Mind | Money | Cold | Boy | Pet | Law |