
Abstract
Light enables us to see and perceive our environment but it also initiates effects beyond vision, such as alertness. Literature describes that at least six factors are relevant for initiating effects beyond vision. The exact relationship between these factors and alertness is not yet fully understood. In the current field study, personal lighting conditions of 62 Dutch office workers (aged 49.7 ± 11.4 years) were continuously measured and simultaneously self-reported activities and locations during the day were gathered via diaries. Each office worker participated 10 working days in spring 2017. Personal lighting conditions were interpreted based on four of the six factors (light quantity, spectrum, timing, and duration of light exposure). Large individual differences were found for the daily luminous exposures, illuminances, correlated colour temperatures, and irradiances measured with the blue sensor area of the dosimeter. The average illuminance (over all participants and all days) over the course of the day peaked three times. The analysis of the duration of light exposure demonstrated that the participants were on average only exposed to an illuminance above 1000 lx for 72 minutes per day. The interpretation of personal lighting conditions based on the four factors provides essential information since all of these factors may be relevant for initiating effects beyond vision. The findings in the current paper give first in-depth insight in the possibilities to interpret personal lighting conditions of office workers.
1 Introduction
Light influences human performance through the visual system, the circadian system and through the mood and motivation pathway. 1 Light transduced by the intrinsically photosensitive retinal ganglion cells (ipRGCs) initiates effects beyond vision such as melatonin suppression or an acute increase in alertness.1,2 Effects beyond vision have been extensively researched. 3 Most studies have investigated the relationship between light and effects beyond vision by applying two different light scenarios (different quantity and/or spectrum of light). In contrast, some studies applied a wider range of lighting conditions and developed dose–response curves for the relationship between light and effects beyond vision. 4 Cajochen et al. demonstrated an acute response on alertness by exposing participants to higher illuminances at night. 4 They determined logistic dose–response curves between illuminances and subjective alertness, slow eye movements and electroencephalography (EEG) activity. However, exact dose–response curves for daytime situations have not yet been determined. 5
Some of the performed light effect studies during daytime did not lead to consistent conclusions. These light effect studies were either performed as laboratory studies or as field studies. In controlled environments, the lighting conditions were quite easily set and even in these laboratory studies results were not consistent regarding the relation between light and effects beyond vision. 6 In addition, lighting conditions in field studies have higher variability compared to laboratory studies and this complicates the light effect studies. A field study, performed by Van Duijnhoven et al. found limited and inconsistent significant correlations between lighting conditions and alertness. 7 They suggested to further investigate the correlation between lighting conditions at daytime and subjective alertness. The question arose whether a certain threshold for lighting conditions at certain moments on the day needs to be met to initiate an effect on alertness.
Although there is no consistency yet about a threshold or recommendation for lighting conditions to initiate effects beyond vision, at least six factors (luminous factors: light quantity, spectrum, directionality and temporal factors: timing, duration, and history of light exposure) were identified to influence these effects. 8 In order to explore these light factors, light measurements at the individual level need to be performed. Since the relationship between light and effects beyond vision, besides light quantity and spectrum, may depend on the timing and duration of light exposure, it is recommended to include continuous measurements of light exposure throughout a light effect study. 9
Many studies have been performed in controlled environments whereas the lighting conditions before and after the experiment may be equally relevant. 10 Normal patterns of light exposure people receive are usually dissimilar to the lighting conditions participants receive in a controlled lab study. 5 Well-controlled lab studies often include wash-out periods as well as recovery periods for the participant. Nevertheless, measuring lighting conditions continuously allows the full option to investigate for what timing and for which duration the light exposure is essential to initiate effects beyond vision. Continuously measured lighting conditions at the individual level (i.e. light which enters the individual’s eyes) were introduced as the term personal lighting conditions. 11 This term will be applied in the remainder of this paper.
Personal lighting conditions can be measured applying location-bound measurements (LBM), person-bound measurements (PBM), or estimated using the location-bound estimations (LBE) method. 11 Since neither the LBM nor the LBE included the exact location of the individual yet at the time of this study, these methods were still too inaccurate when personal lighting conditions throughout the entire course of the day are desired. A large advantage of the PBM method is that it measures continuously at individual level (i.e. since the measurement device is worn by the individual). However, performance deviations and wearing comfort issues need to be considered when applying PBM.12–16
In addition to the unknown timing and duration of light exposure, the recommended light quantity and spectrum to initiate effects of light are unknown. Therefore, the specific light quantities that need to be measured must be deliberately elected. Effects beyond vision, such as alertness, were often investigated in relation to illuminance (E) and correlated colour temperature (CCT). 3 However, the usage of photometric quantities (weighted to the spectral sensitivity for vision) in studies investigating effects beyond vision is often questioned. 17 The spectral sensitivity of the ipRGCs is different from the spectral sensitivity of the rods and cones (related to vision). Therefore, the photometric quantities related to vision may be inadequate to be related to effects beyond vision.18,19 It is recommended to measure spectral power data or at least the α-opic quantities to investigate effects of light.15,19 Unfortunately, most wearable person-bound light measurement devices are still not equipped to measure the spectral power distribution.13,15 Therefore, light effect studies that include continuous light measurements often still relate these effects beyond vision to photometric quantities. Using person-bound devices equipped with RGB sensors allow gathering additional measurement data. In these cases, the measurements of the blue sensor are being used to link to effects beyond vision since the ipRGCs are most sensitive to the bluish part of the spectrum. 20
However, continuous measurements at individual level do not allow the identification of light directionality and history of light exposure. Directionality relates to the different angles of incidence of light on a certain surface. Since, to the knowledge of the authors, no wearable light measurement device to measure light directionality was readily available at the time of the study, light directionality was excluded for the current field study. In addition, history of light exposure is often defined as the light exposure prior to an experiment. Although the current study was an exploratory study measuring baseline conditions rather than applying experimental light interventions, it is hard to determine the history of light exposure within the current study. It has been suggested before to clearly define the term history of light exposure. 8
Measuring continuous lighting conditions at individual level has been applied in numerous research studies. In the majority of these studies, the focus was on the light effect (e.g. sleep,21–28 vitality,24,29 circadian phase,22,30–32 mood,22,23,25,26,28 or social behaviour 33 ). Very rarely, no outcome measure was directly linked to the actual lighting conditions. For example, Heil and Mathis described daily lighting conditions of 11 hospital employees and investigated the differences between the lighting conditions inside and outside the hospital. 34 They concluded that the long exposure duration to dim light has been linked to the work environment and that the individual’s decision to be indoor or outdoor outside working hours is one of the most important determinants for bright light exposure.
Once the relationships between lighting conditions and effects beyond vision are established, one can design a system to individually tailor personal lighting conditions of an individual towards their needs and desires. In order to be able to tailor personal lighting conditions, it is essential to identify predictors of personal lighting conditions. The identification of these predictors is discussed in a subsequent paper. 35
The current paper describes the interpretation based on four out of the six factors related to effects of light beyond vision: illuminance and luminous exposure (H) to demonstrate light quantity, CCT and the measured irradiances with the blue sensor area (B) to represent an estimation of the light spectrum, and the continuous measurements to assure information on timing and duration of light exposure. Two main research questions are addressed where the second contains two sub questions:
Do continuously measured personal lighting conditions allow the interpretation of daily light exposure regarding the factors identified to initiate effects beyond vision? What is the daily light exposure of office workers?
What are the daily differences in light quantity and spectrum between and within participants, specific participant subgroups and different locations (i.e. at home, at work or elsewhere)? • What are the timing and duration of light exposure (described as light quantity and spectrum) of the office worker’s personal lighting conditions?
2 Method
A field study was conducted in an open-plan office in the Netherlands (latitude 52.13°). The total duration of the study was 47 days in spring 2017 of which all 62 participants participated on average 9.1 ± 1.7 workdays. Figure 1 shows on which days the participants participated. The order of the participants is randomized to anonymize the data.
Overview of the days the 62 participants participated in the study. Every row represents data of one participant. Black cells indicate days of participation whereas white cells indicate the days the participant did not participate in the study. The study periods were never 10 consequent days due to weekend days and some participants working part time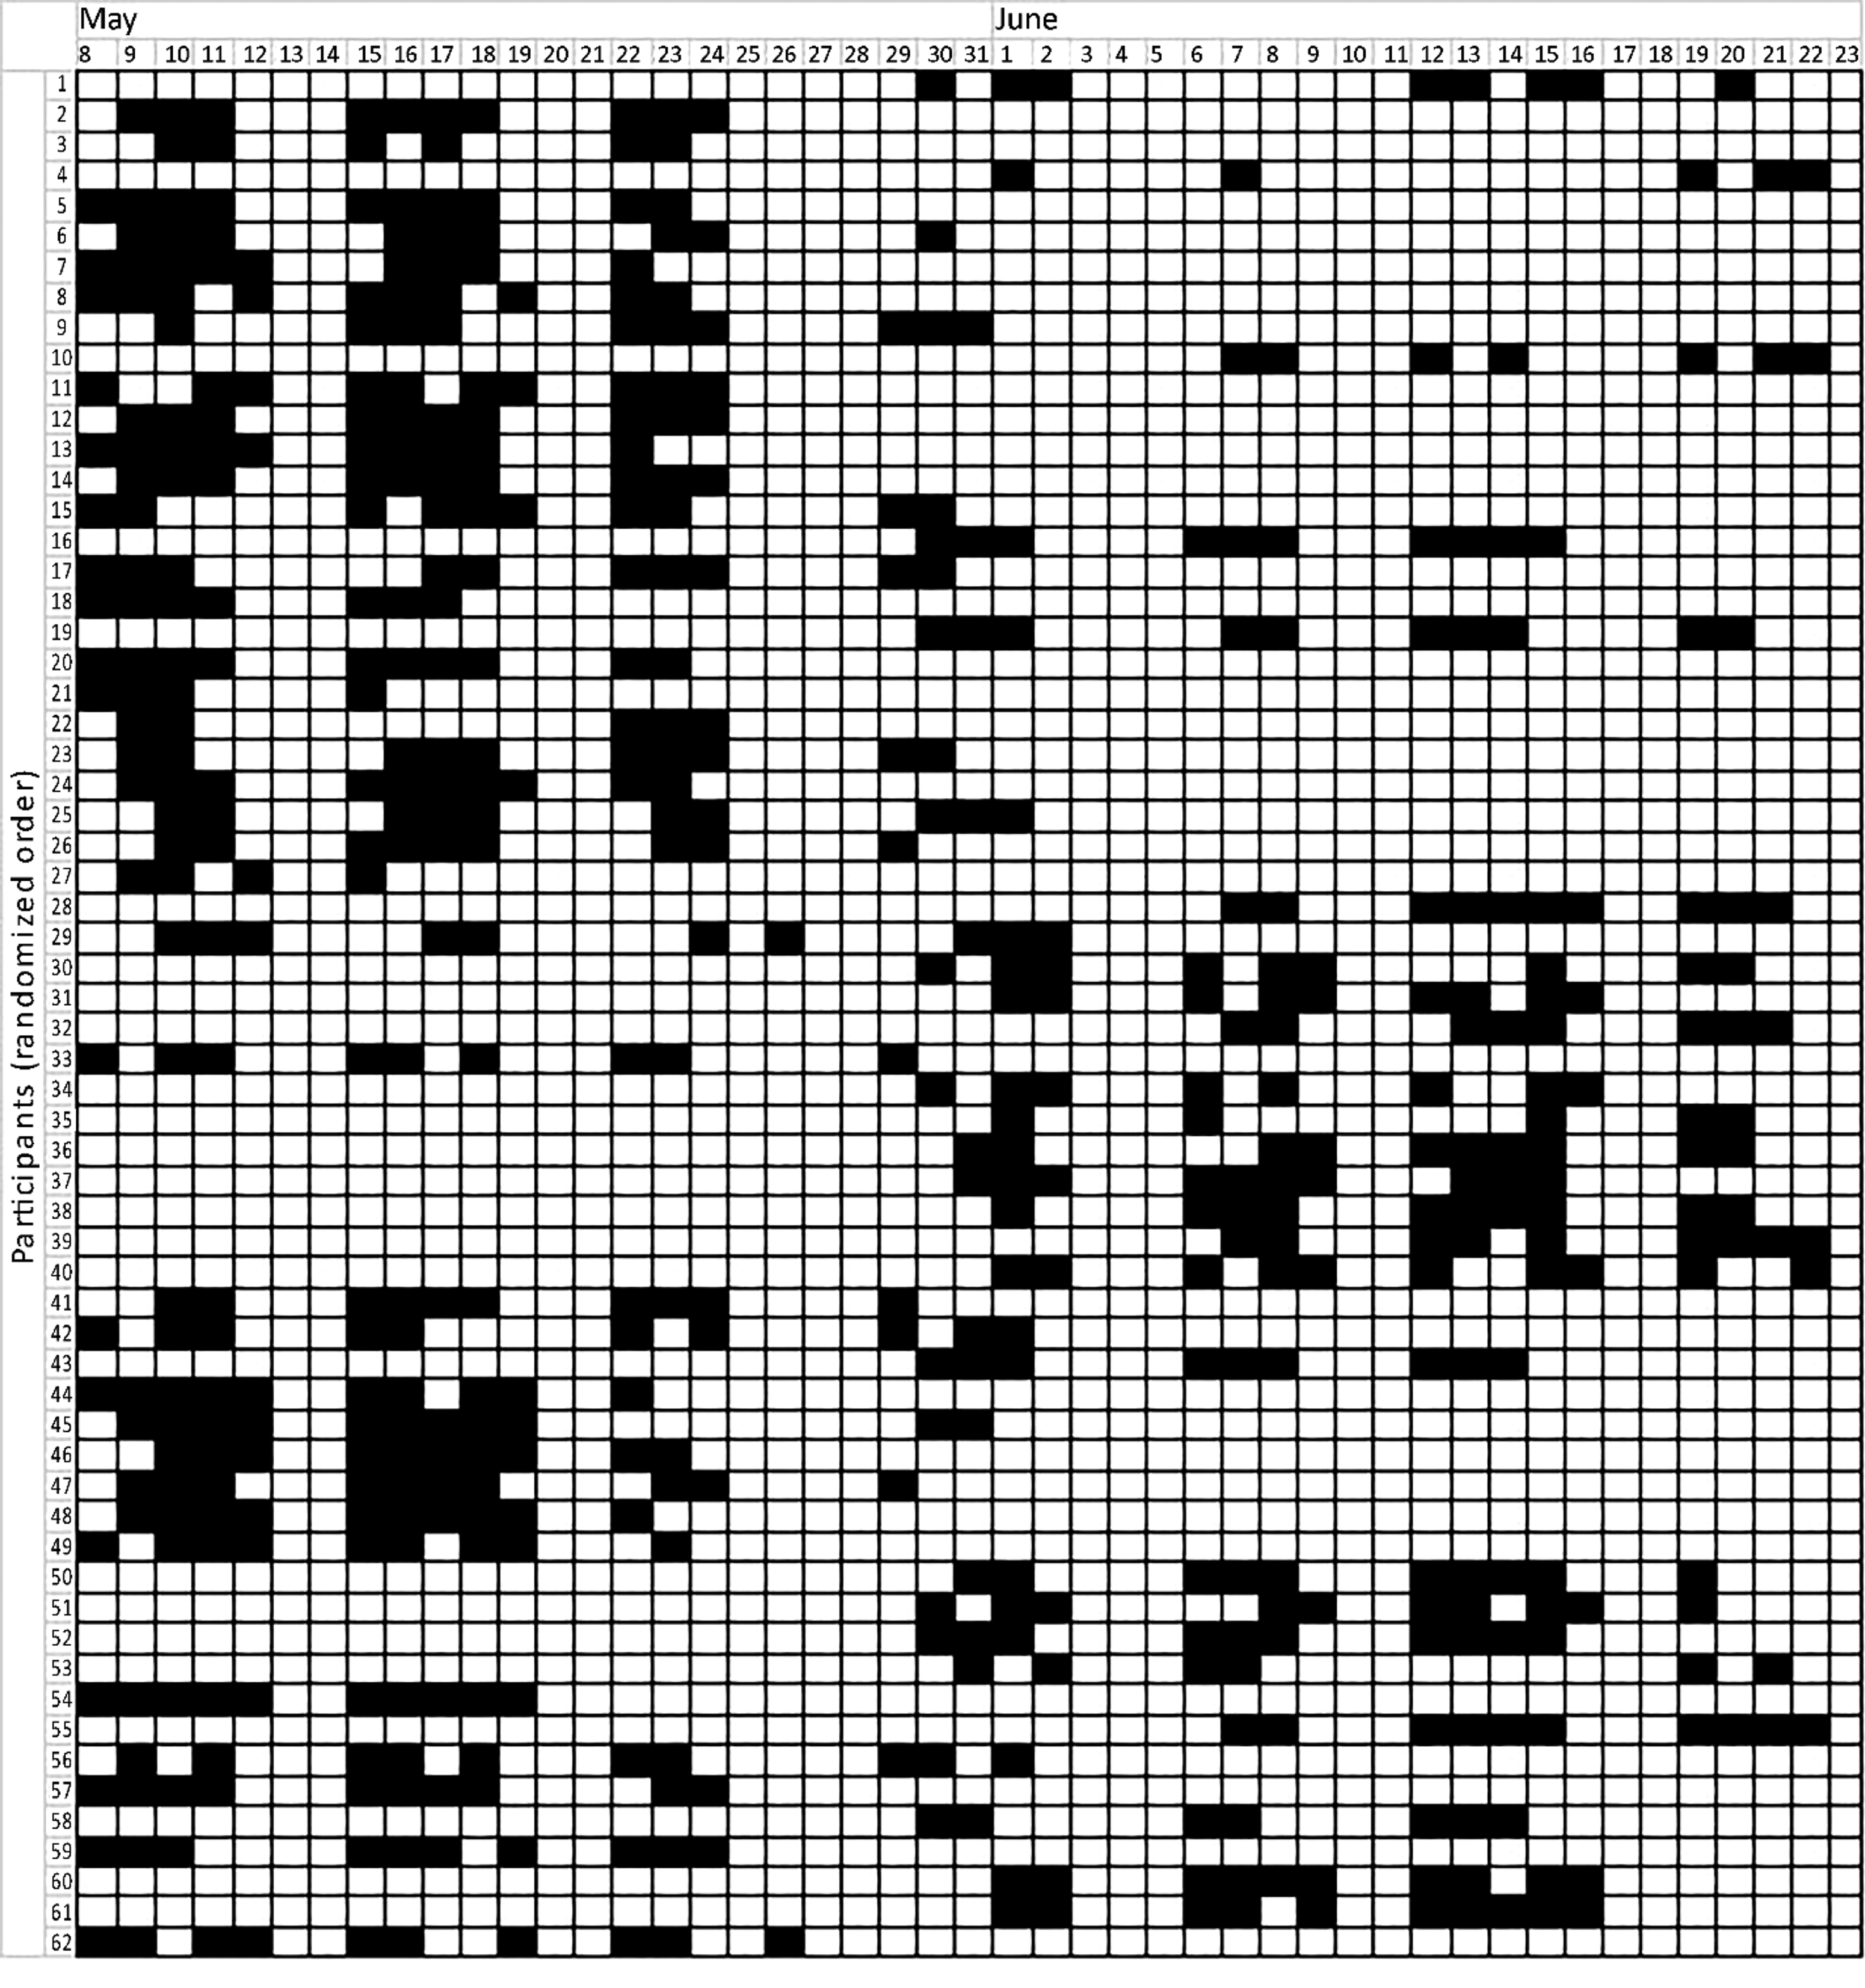
2.1 Office environment
The office building consisted of five floors with fully glazed facades and an atrium situated at the south facade. The total number of desks was 468 of which the open plan offices contained 356 desks. The larger part of the office environment was designed as flexible workspaces. The workspaces of the office workers participating in the field study were on average 5.1 ± 4.0 m away from the closest window and on average placed parallel to the closest window (i.e., a viewing direction relative to the closest window of 95 ± 38° in which 0° means towards the window).
The open plan offices of the ground, first, second, and third floor are equipped with dimmable fluorescent lamps (OSRAM 1 FQ 49W/830). On the fourth floor, another type of dimmable fluorescent lights was installed (PHILIPS HFP WH, 58W/83). Sun shading devices were not equipped at every facade and in addition, some blinds were automatically controlled and others manually.
2.2 Study design and procedure
The participants were asked to join the study for 10 working days following their normal daily routines. On the first day of the study, a general questionnaire was provided containing questions regarding demographics, chronotype (Munich ChronoType Questionnaire: MCTQ),
36
Seasonal Affective Disorder (SAD) sensitivity (Seasonal Pattern Assessment Questionnaire: SPAQ)
37
and general health (36-Item Short Form Health Survey: SF-36).
38
The participants received instructions and the required material to participate in the study (described below). During the study, the participants were asked to:
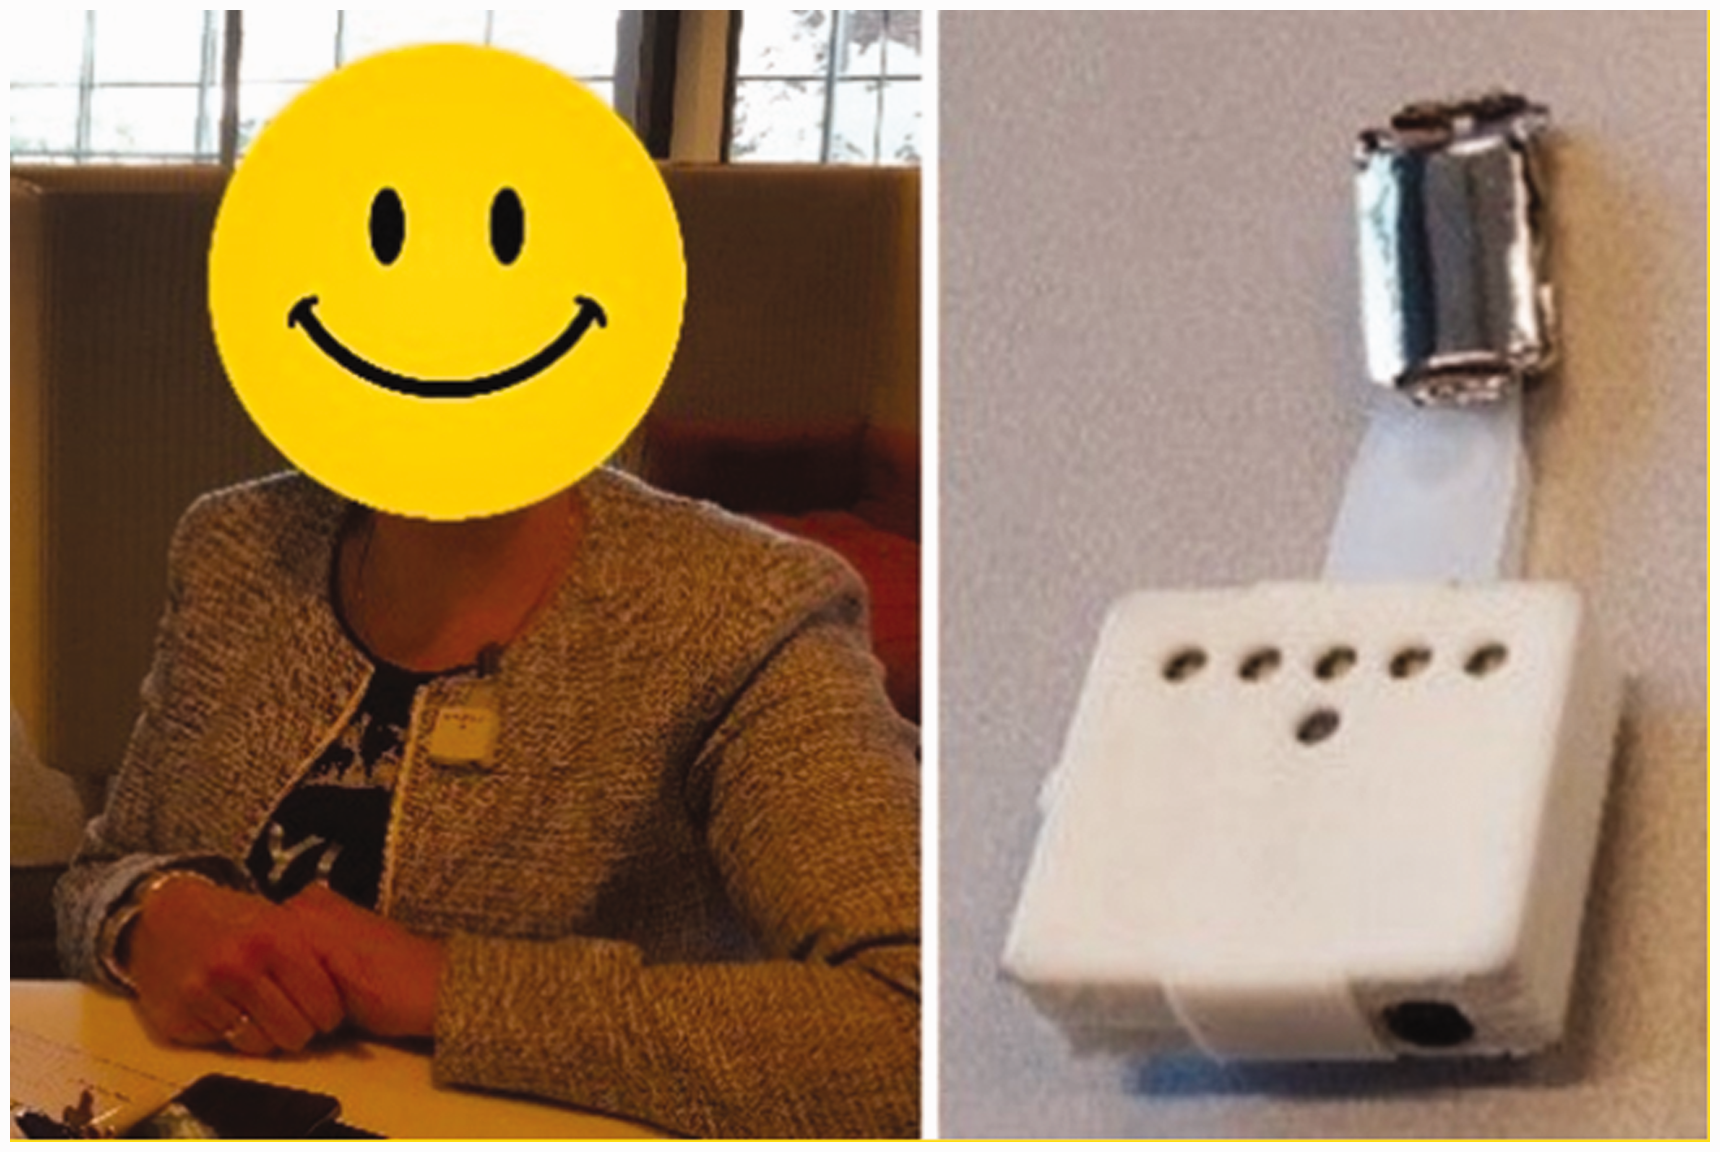
Wear a wearable light measurement device. The Lightlog, developed by Martin,
39
was applied in this study (see Figure 2). Participants were asked to start wearing the Lightlog when they wake up and take it off when they go to sleep. A black storage bag for the Lightlog was supplied in case the device was not worn. Inside this bag the device was measuring negligible low values. The Lightlog continuously measured and the participants did not need to take any action to begin logging or measuring. More information regarding the Lightlogs is provided in Section 2.3. Fill in the paper diary. The diary consisted of a set of questions and a table to be completed daily. The questions regarded the time the participant was awake (wake up time and bed time), when the Lightlog was worn (start and stop time of wearing the Lightlog), and when they were travelling to and from work. The table consisted of time, location, activity, a check whether the Lightlog was worn and notes. Only breaks longer than 30 minutes were asked to be reported in the diary. Fill in four online questionnaires a day. The questionnaires were sent to participants’ email addresses at 09:00, 11:00, 14:00 and 16:00. These questionnaires included questions about, amongst others, sleep (asked at 09:00), work (asked at 09:00), activities (asked at 09:00, 14:00 and 16:00), office characteristics (asked at all times) and alertness (Karolinska Sleepiness Scale: KSS score)
40
(asked at all times). Participant wearing a Lightlog (left) and separate picture of the Lightlog wearable photometer developed by Martin (right).
39
2.3 Objective light measurements
Personal lighting conditions were measured using the Lightlogs. 39 Since the Lightlogs were attached to the clothes at the right side of the chest, the devices measured the lighting conditions vertically (i.e. comparable to the vertical direction of light entering the eye). Therefore, in this paper, when illuminances (E), CCT or irradiances measured with the blue sensor area (B) are mentioned, they refer to vertically oriented measurements.
A Lightlog consists of four sensors: red, green, blue and clear.
39
A software tool (LightLogControl version 2.1, developed by the Eindhoven University of Technology) was used which automatically estimates the illuminance and the CCT based on the first three raw data points (R, G and B). The regression formulas to calculate the tristimulus values
The Lightlogs measured every 5 min for the entire participation period of the participant. The 42 different Lightlogs used in this study were secondly calibrated against a reference photometer (Hagner, model E4-X) 42 for illuminances within the range of 0–13000 lx. These calibrations were performed in a simulated daylight room at the Eindhoven University of Technology. These linear calibration factors for the 42 Lightlogs varied from 0.9 to 1.6.
2.4 Recruitment
The Medical Research Ethics Committee of UMC Utrecht did not have ethical objections to the study proposal (reference number WAG/mb/17/010424). Therefore, general information about the study was distributed on electronical screens in the office building and on the internal intranet website of the municipality. Afterwards, participants were personally recruited. Sixty-nine participants signed the informed consent form and received a unique participant number in order to blind the data for reasons of privacy.
2.5 Participants
Sixty-nine office workers were recruited to this study. Due to missing data, lost devices or travel through different time zones, the data of only 62 participants were included in the data analysis. These were 42 females and 20 males, with a mean age of 49.7 ± 11.4 years. The mean chronotype score was 3.31 according to the MCTQ. 36 The self-reported general health of the participants was on average 67.2 ± 15% on a scale from 0 to 100%, measured with the SF-36. The participants all worked at the same municipality office and had similar work tasks.
2.6 Data processing and analyses
All data analyses were performed using MATLAB R2017a.
2.6.1 Data preparation
The measured personal lighting conditions were prepared for the data analysis by:
Removing all light measurements (E, CCT and B) when the illuminances were below 20 lx. This threshold was set since the applied software converted the measured RGB values from the Lightlogs to illuminances and correlated colour temperatures and this conversion was only validated for illuminances above 20 lx.
41
Removing outliers (i.e. >3 scaled median absolute deviations (MAD) away from the median)
43
per participant per time of the day when they were outside the average daylight period (before the average sunrise at 05:32 or after the average sunset of 21:46).
44
High illuminance levels during the daylight period may also be detected as outliers; however, these high peaks in illuminances can be the exposure to bright light outdoors so these outliers during the daylight period were not removed from the dataset. Removing all light measurement data points for the moments when the Lightlog was not worn. This resulted in differences in the number of data points included when calculating averages. For example, when calculating the average illuminances over the day for one participant, it could be that for all 10 participation days that participant wore the Lightlog at 12:00 so 10 values were included for that time whereas the participant wore the Lightlog only 5 days at 07:00 so only five values were included for that time. The same applies for the division of lighting conditions per location (i.e. at home, at work or elsewhere) where, for example, only five participants were at home at 14:00 whereas all participants were at home at 18:00 so more data points were included to calculate the average lighting conditions at home at 18:00 compared to 14:00. The number of data points included to calculate the average means is provided together with the results.
The following personal lighting conditions were calculated per participant:
Daily luminous exposures (Hday). Daily average illuminances ( Daily average correlated colour temperatures ( Daily average irradiances measured with the blue sensor area (
Daily means in all cases the period in which the participant was wearing the Lightlog.
Furthermore, the lighting conditions were divided in three different locations (i.e. at home, at work and elsewhere). The location elsewhere refers to any location of the participant not being at home or at work. This indicates that the location elsewhere consist of both indoor and outdoor conditions. General information (e.g. furniture, blinds or luminaires) regarding the location at work is provided in Section 2.1. This general information of the other locations (at home and elsewhere) was not collected in this study. The lighting conditions were averaged over all participation days per participant and later averaged over all participants. The 62 averaged lighting conditions per participant per location were averaged to get an average lighting condition per location:
Average illuminances at home, at work and elsewhere ( Average correlated colour temperatures at home, at work, and elsewhere ( Average irradiances measured with the blue sensor area at home, at work and elsewhere ( And last, the lighting conditions were separated for subgroups. More information can be found in Section 2.6.2.
2.6.2 Data analysis
The data analysis in the current paper concerns the interpretation of personal lighting conditions of office workers.
The personal lighting conditions (H, E, CCT, and B) are described in their original scales and were found to be not-normally distributed. Therefore, mostly medians and ranges are provided. 45 The personal lighting conditions per location were tested whether these differed significantly from each other using the non-parametric Mann–Whitney test. The differences were tested two-sided with a significance level of 0.05.
The personal lighting conditions were analysed over the course of the day. Average illuminances and correlated colour temperatures were calculated for each time of the day (i.e. at a 5 minutes interval). Furthermore, the distribution of illuminances and correlated colour temperatures over the day was analysed for the three different locations separately.
In addition, seven levels for illuminances (i.e. 50 lx, 100 lx, 180 lx, 500 lx, 550 lx, 1000 lx, and 5000 lx), four levels for correlated colour temperatures (i.e. 2000 K, 3000 K, 4000 K, and 5000 K), and six levels for irradiances measured with the blue sensor area (50 mW/m2, 100 mW/m2, 500 mW/m2, 1000 mW/m2 2000 mW/m2, and 3000 mW/m2) were used to analyse the duration of light exposure. The illuminance levels 180 lx, 550 lx, and 1000 lx were selected based on previous literature. 32 The illuminance levels 50 lx, 100 lx, 500 lx, and 5000 lx were added to examine whether there exist a linearity in the analysis and these were all included in the recommended scale of illuminances in the European standard.46,47 Levels of CCT were chosen based on common electric lighting applications and the rough distinction of being indoor or outdoor. The levels for the irradiances measured with the blue sensor area were selected based on linearity in the analysis.
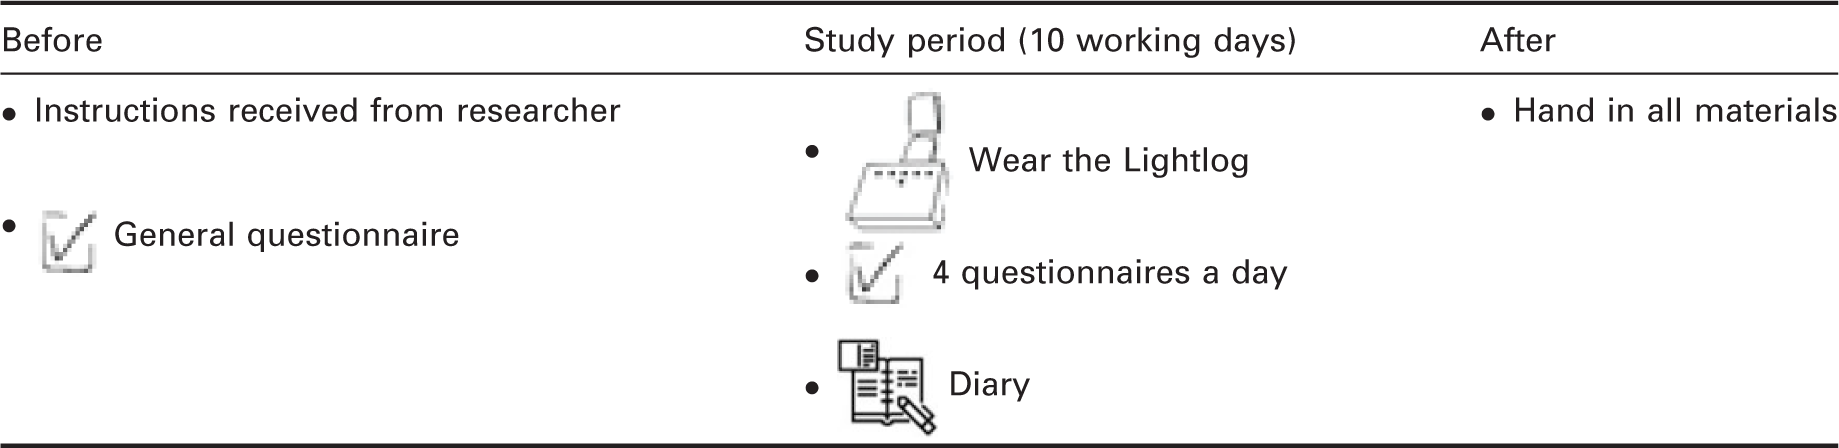
The personal lighting conditions were analysed per office worker per participation day. This led to 552 daily plots of personal lighting conditions. The daily patterns of light exposure were analysed and categorized into 0, 1, 2, or ≥3 peaks of illuminances over the day (see Figure 3).
Categories of daily patterns of light exposure of individuals. The sketches represent light exposure on the y-axis and the time of the day on the x-axis
The measured personal lighting conditions of office workers were analysed for subgroups of the participant sample as well. The subgroups were chosen based on previous literature indicating potential differences in light exposures between the groups.29,32,48–50 The following subgroups were created:
Fulltime/part-time office workers. This binary variable was included in the general questionnaire. General health score >50%/general health score ≤ 50%. This continuous variable was measured via the SF-36 questionnaire within the general questionnaire; 0% and 100% are the lowest and highest possible scores for self-reported general health.
38
Presence eye discomfort/absence of eye discomfort. This variable was extracted from the general questionnaire. The question regarding eye discomfort had four answer possibilities: absent, slight, moderate and severe. Absent was categorized as the subgroup ‘absence of eye discomfort’ and slight, moderate and severe were categorized as the subgroup of ‘presence of eye discomfort’. Transport to work indoor (car)/transport to work outdoor (i.e. by feet, bike, scooter or public transport). This variable was extracted from the daily morning questionnaire.
Personal lighting conditions (illuminances, correlated colour temperatures and irradiances measured with the blue sensor area) have been visualized to investigate differences between the subgroups.
3. Results
3.1 Luminous factors
Daily lighting conditions per participant
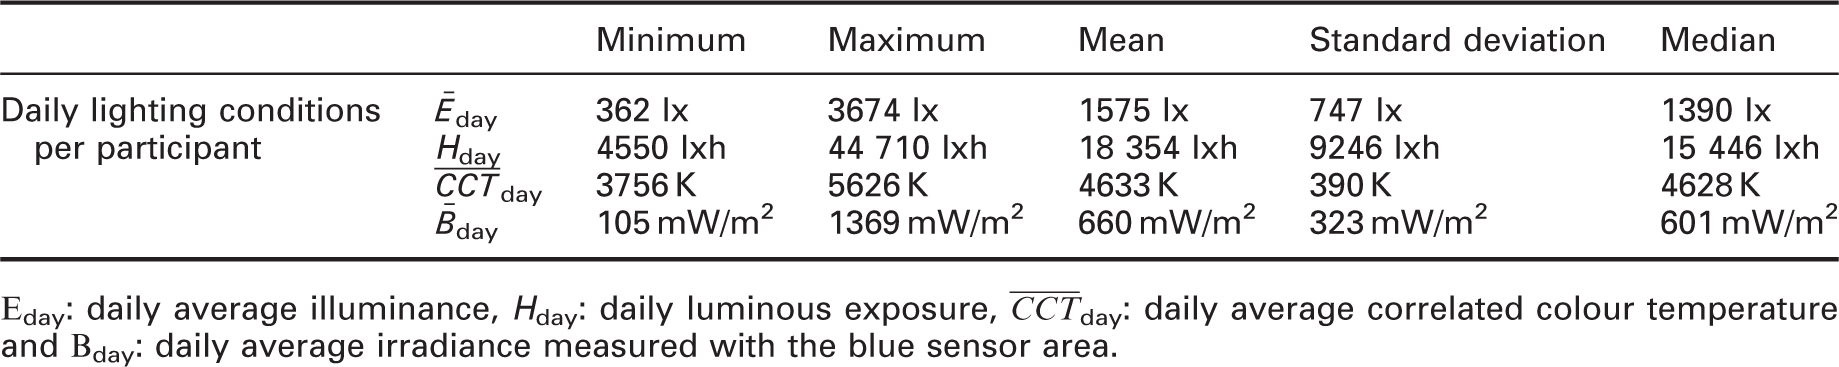
The daily personal lighting conditions per location type were extracted from participants’ diaries. Participants reported to spend on average 22% (207 ± 110 minutes) of their awake day (i.e. time between the average wake up time of 07:02 and average bedtime of 22:25) at home, 42% at work (389 ± 84 minutes) and 17 % elsewhere (160 ± 77 minutes). Nineteen percent of their awake day was recorded as when the participants were not wearing the Lightlog and no location was registered. The median start and end times for all participants for the three locations were 07:35–22:00 at home, 08:25–16:30 at work and 08:05–18:05 for elsewhere. Section 3.2 further elaborates on the timing and duration of light exposure during the day and the corresponding lighting conditions per location.
In addition, the personal lighting conditions were split per location (i.e. at work, at home and elsewhere).
3.2 Temporal factors (timing and duration of light exposure)
The lighting conditions varied over the course of the day. Figure 4 shows the mean illuminances over the day as the mean for all participants and during all participation days. The distribution of illuminances over the day, the timing of personal lighting conditions, shows three peaks: one in the early morning, one around noon and one in the late afternoon. The same figure also demonstrates the mean correlated colour temperatures over the day and the mean irradiances measured with the blue sensor area. A similar pattern as demonstrated by the mean illuminances was found for the mean irradiances measured with the blue sensor area consisting of three peaks throughout the day. However, the correlated colour temperatures are less varying throughout the day. It is notable that the three lighting conditions (Figure 4) had the highest values between sunrise and sunset. Figure 5 also demonstrates the mean lighting conditions over the course of the day. The shading used in these circled plots indicates the number of data points included to calculate the averages. These graphs show that the means calculated using the most data points (i.e. >500) were between 09:00 and 17:00.
Averaged personal lighting conditions of 62 office workers over the day. Study period was May–June 2017. The upper graph shows average mean illuminances, the middle graph average mean correlated colour temperatures and the lower graph average mean irradiances measured with the blue sensor area over the day. The data are averaged per participant over all days and then averaged over all participants. The dotted lines indicate average sun rise and sun set for this period.
44
Average personal lighting conditions over the course of the day for all locations (at home, at work and elsewhere). The upper plot shows average mean illuminances, the middle plot average mean correlated colour temperatures and the lower plot shows average mean irradiances measured with the blue sensor area over the day. The shading indicates the number of data points included to calculate the average means. The dotted lines indicate average sun rise and sun set for this period.
44
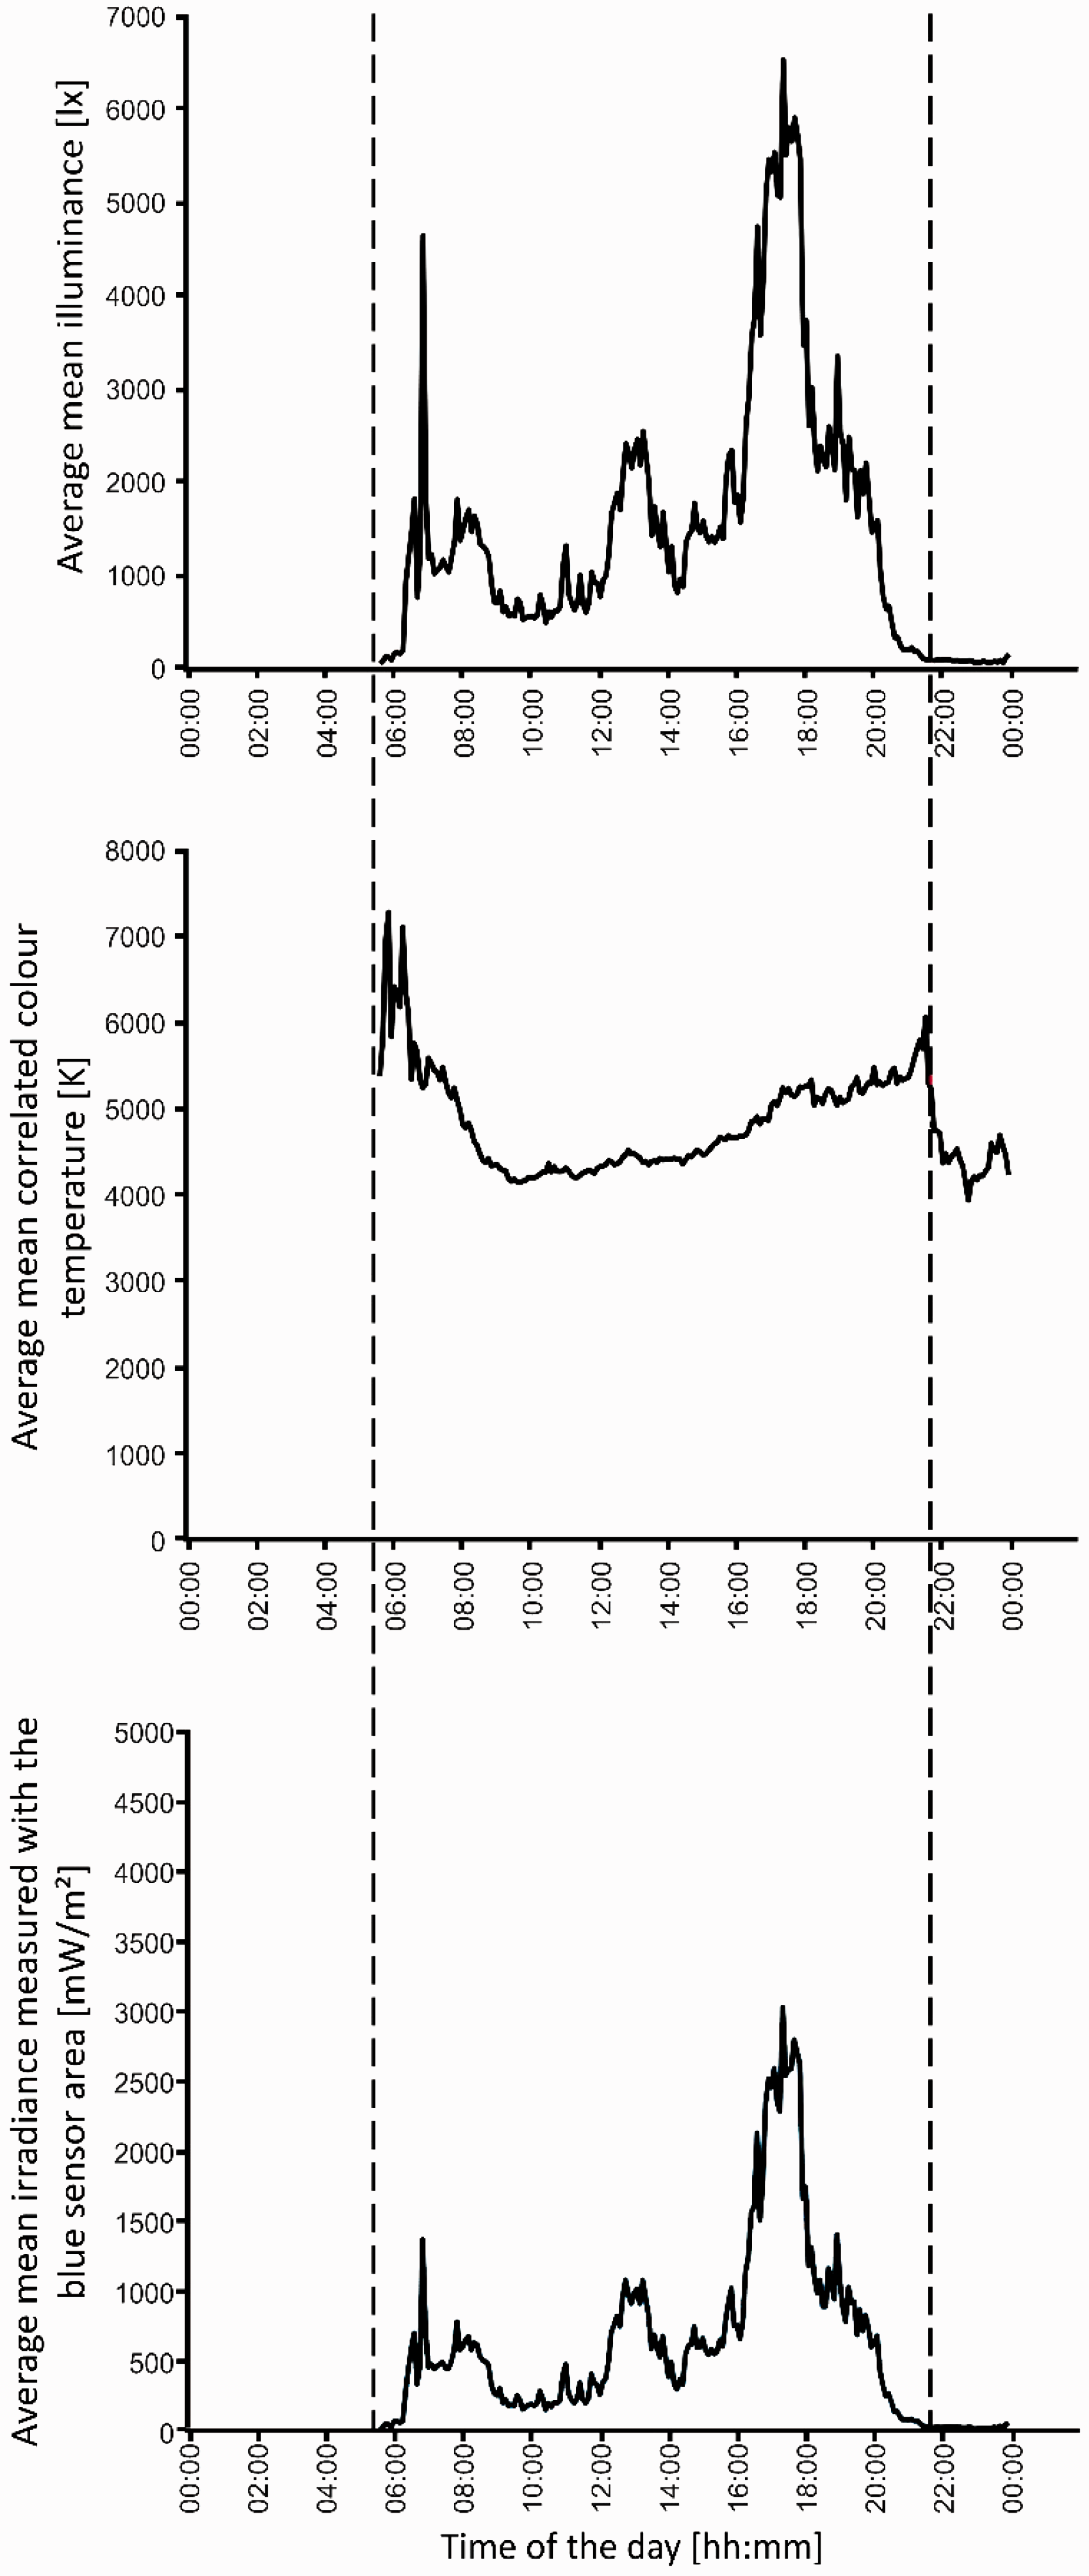
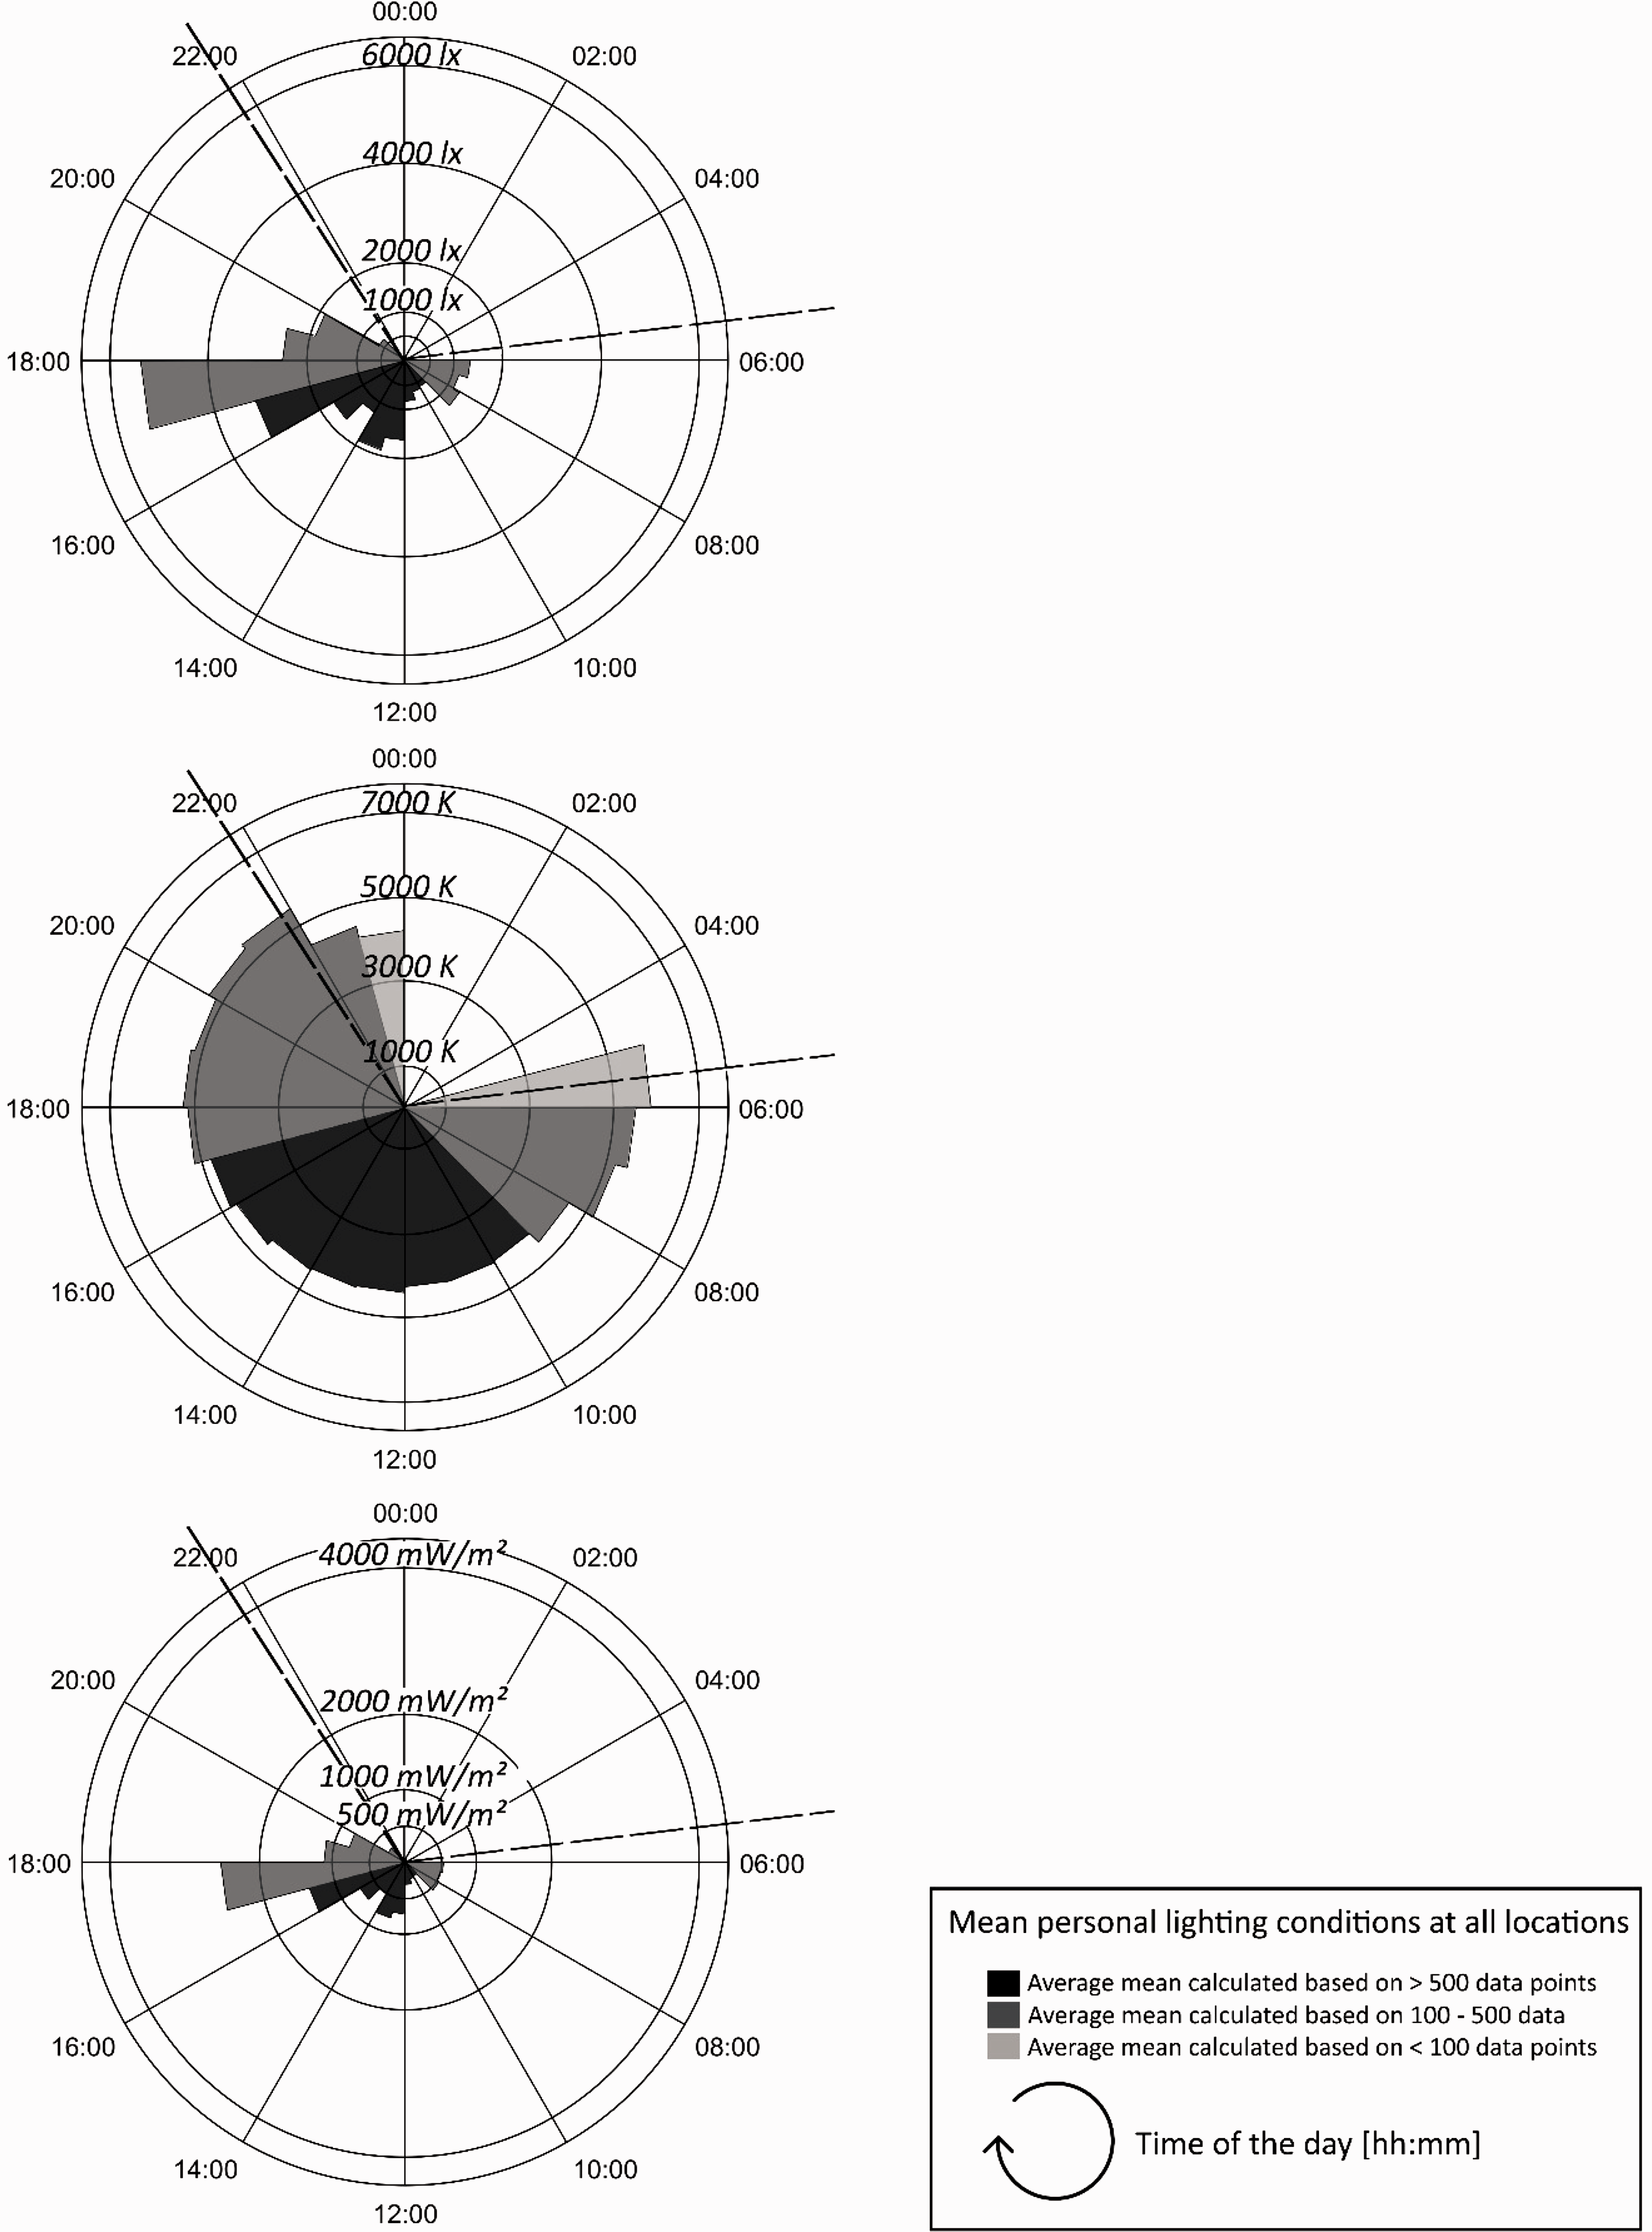
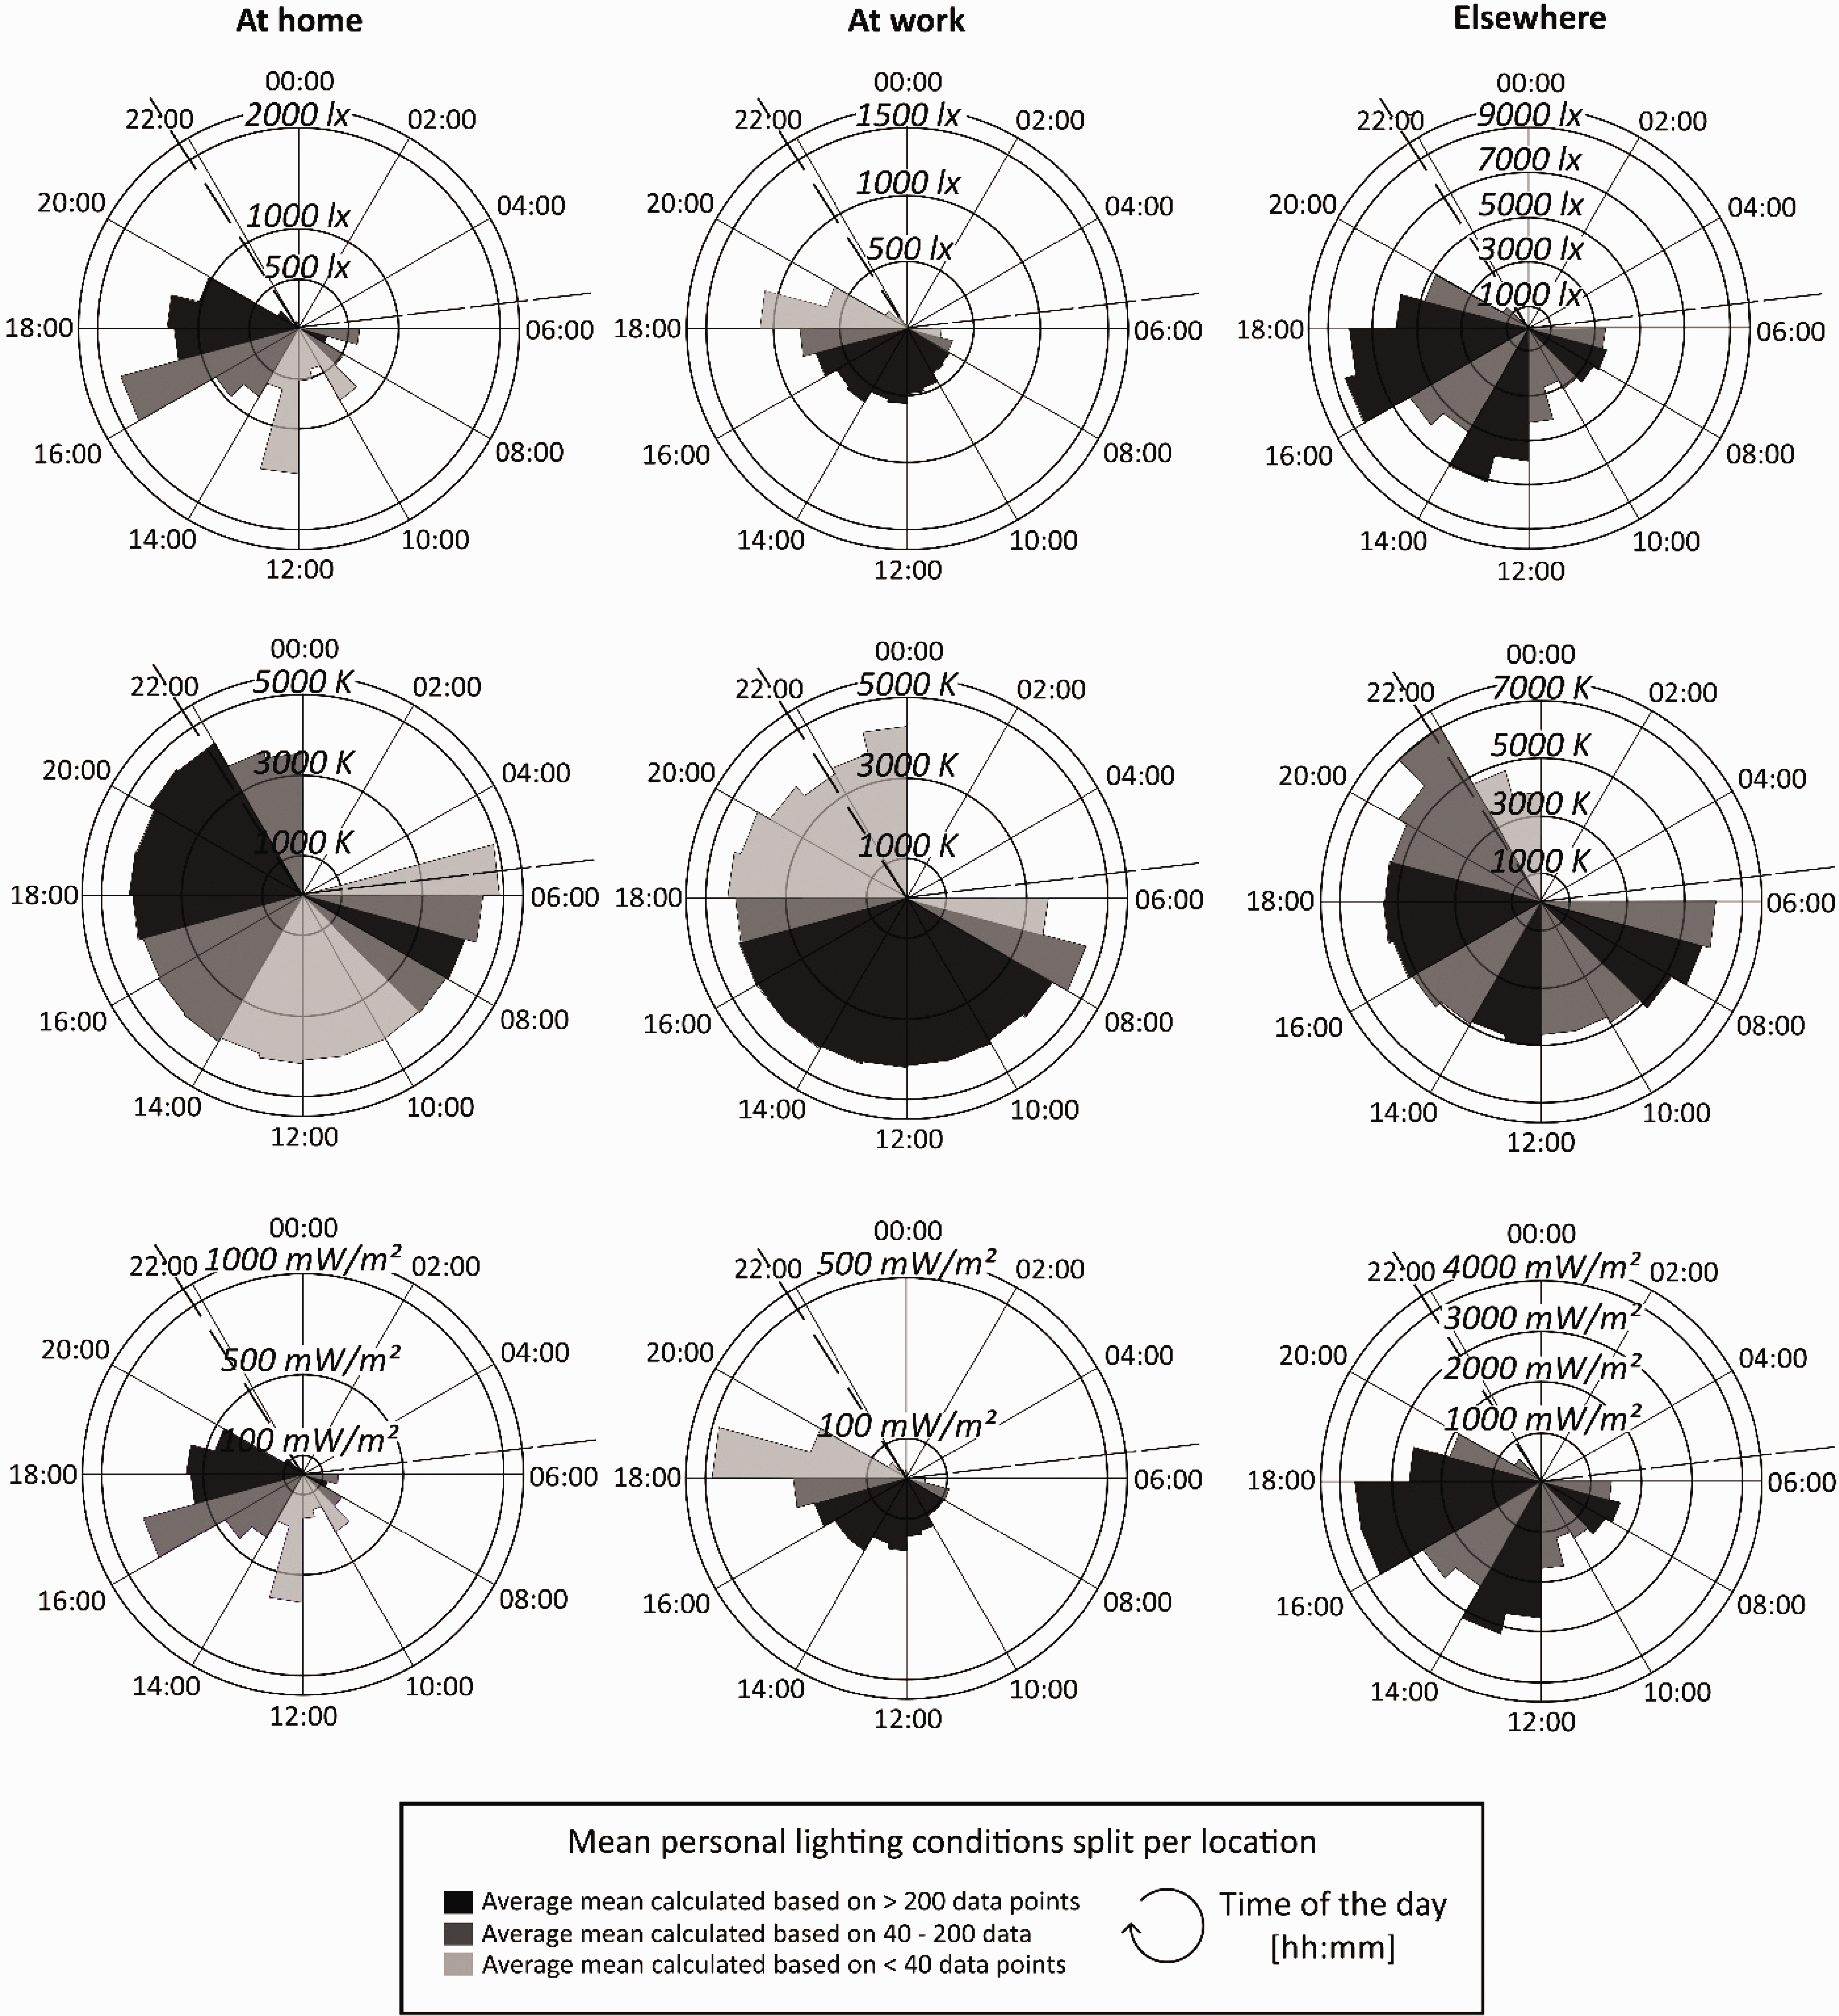
Figure 6 shows the distribution of the personal lighting conditions over the day as well but then divided per location (at home, at work and elsewhere). Similar to Figure 5, the shading indicates the number of data points included to calculate the mean illuminances. The graphs show that most people were at home between 07:00–8:00 and after 17:00, at work between 08:00–17:00, and elsewhere during the three moments similar to the three peaks visible in Figure 4. Figure 6 also shows the distribution of mean correlated colour temperatures and mean irradiances measured with the blue sensor area over the day, again split per location.
Average personal lighting conditions over the course of the day, split per location (at home, at work, elsewhere). The upper three graphs show average mean illuminances, the middle three graphs average mean correlated colour temperatures and the lower three graphs average mean irradiances measured with the blue sensor area over the day. The shading indicates the number of data points included to calculate the average means. The dotted lines indicate average sun rise and sun set for this period.
44
In addition, timing and duration of light exposure were explored by analysing participant’ clock times in relation to their lighting conditions. Participants reported the clock times when they woke up, started wearing the Lightlog, stopped wearing the Lightlog and when they went to bed. The clock times were respectively
Timing of illuminances
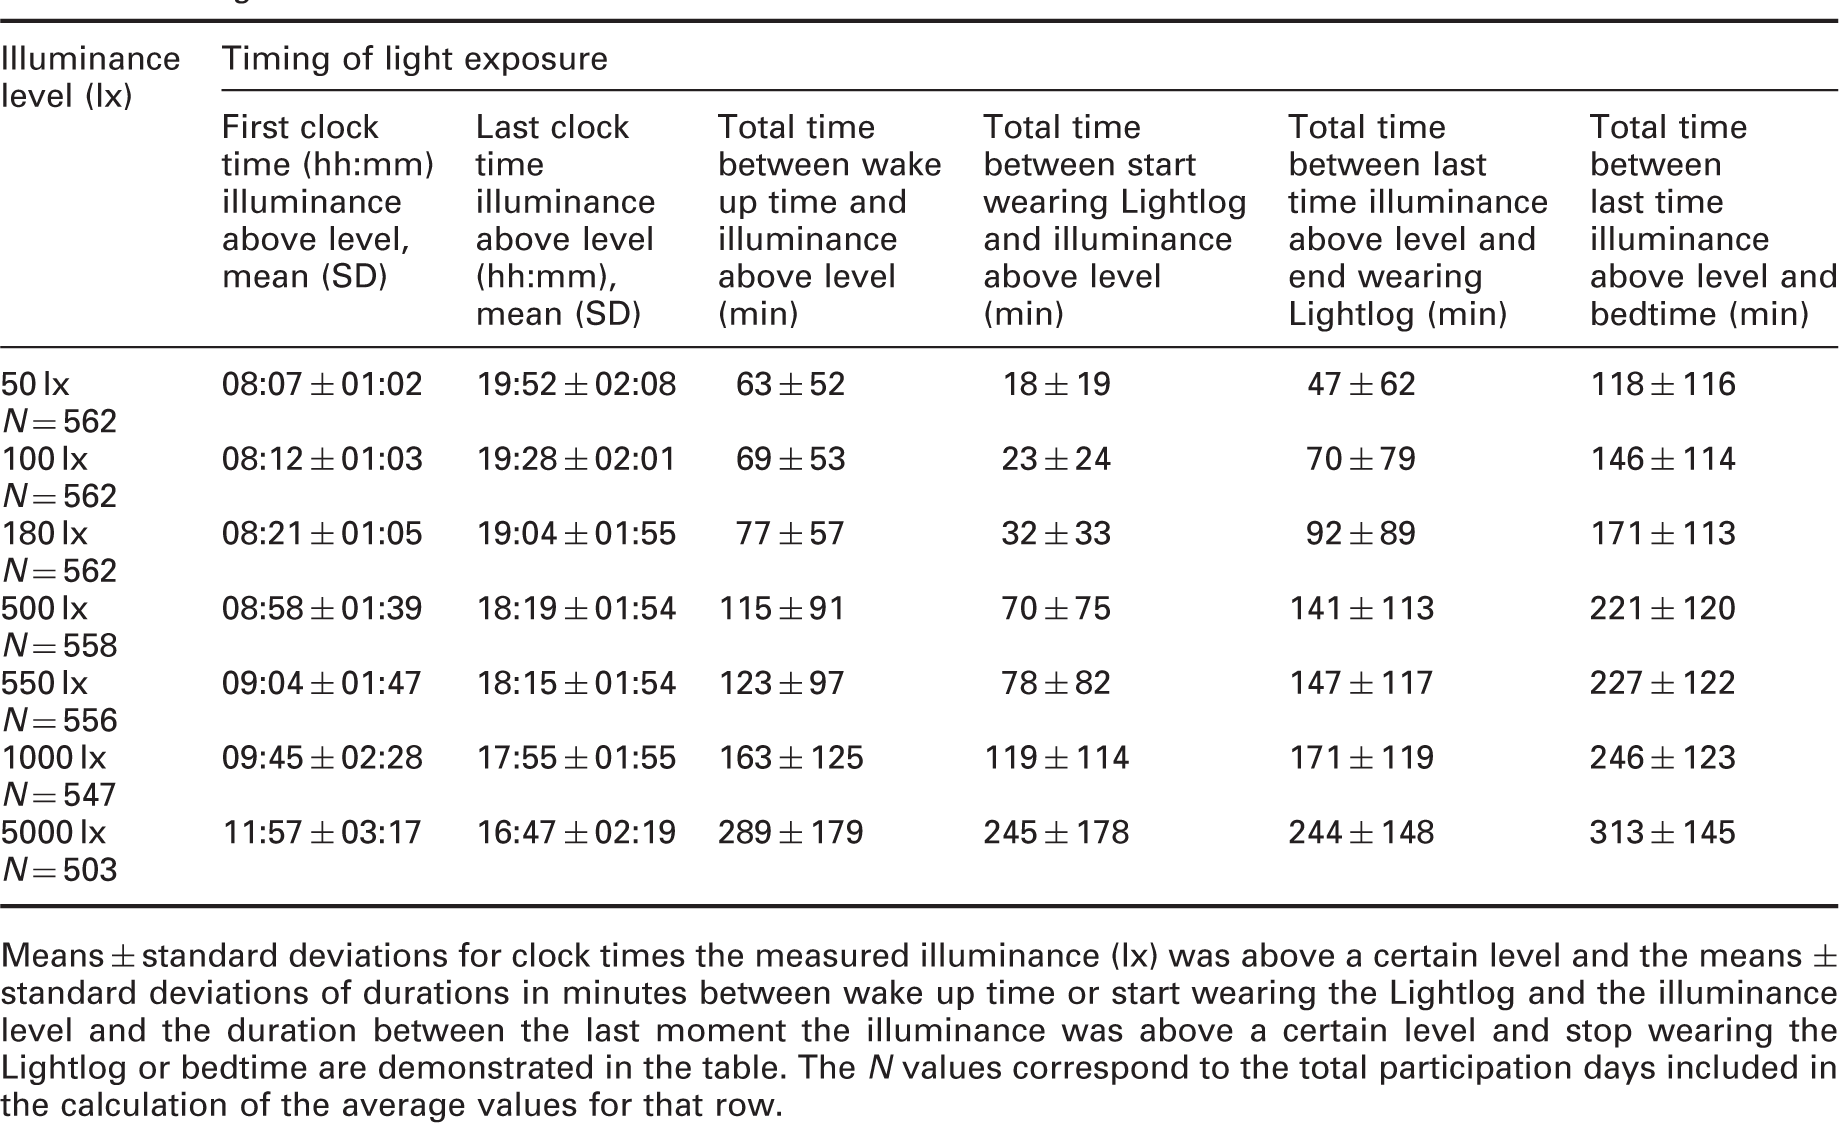
Means ± standard deviations for clock times the measured illuminance (lx) was above a certain level and the means ± standard deviations of durations in minutes between wake up time or start wearing the Lightlog and the illuminance level and the duration between the last moment the illuminance was above a certain level and stop wearing the Lightlog or bedtime are demonstrated in the table. The N values correspond to the total participation days included in the calculation of the average values for that row.
Timing of correlated colour temperatures
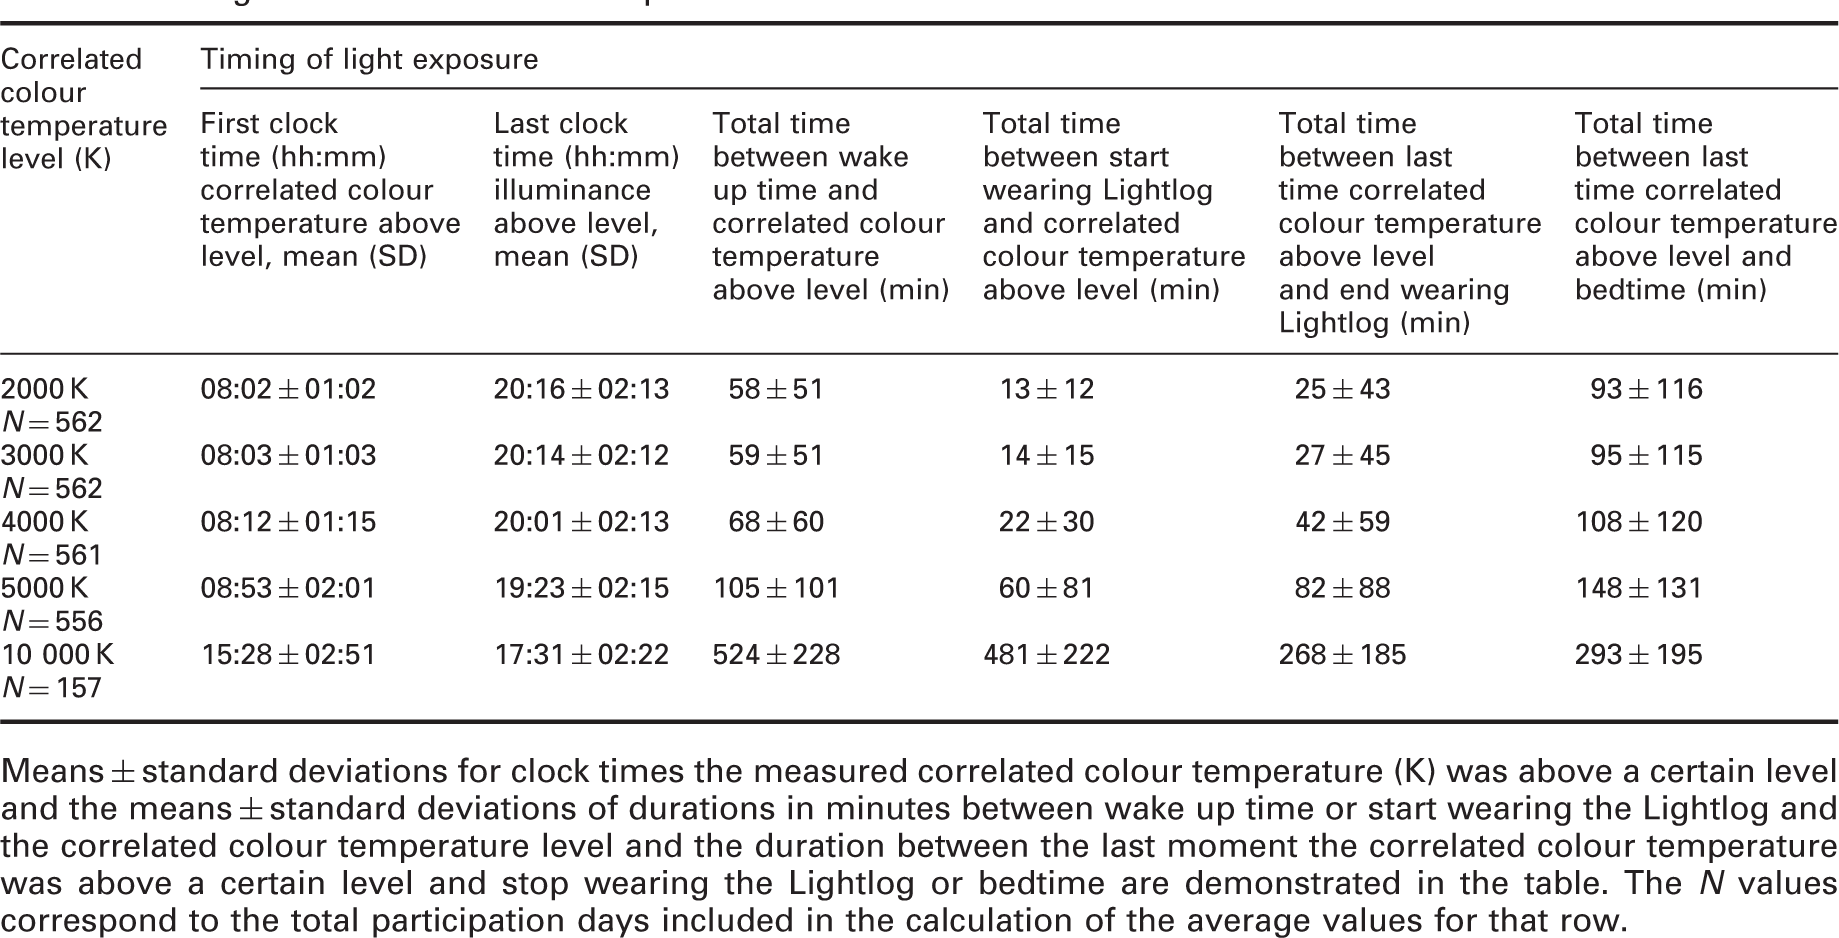
Means ± standard deviations for clock times the measured correlated colour temperature (K) was above a certain level and the means ± standard deviations of durations in minutes between wake up time or start wearing the Lightlog and the correlated colour temperature level and the duration between the last moment the correlated colour temperature was above a certain level and stop wearing the Lightlog or bedtime are demonstrated in the table. The N values correspond to the total participation days included in the calculation of the average values for that row.
Timing of irradiances measured with the blue sensor area
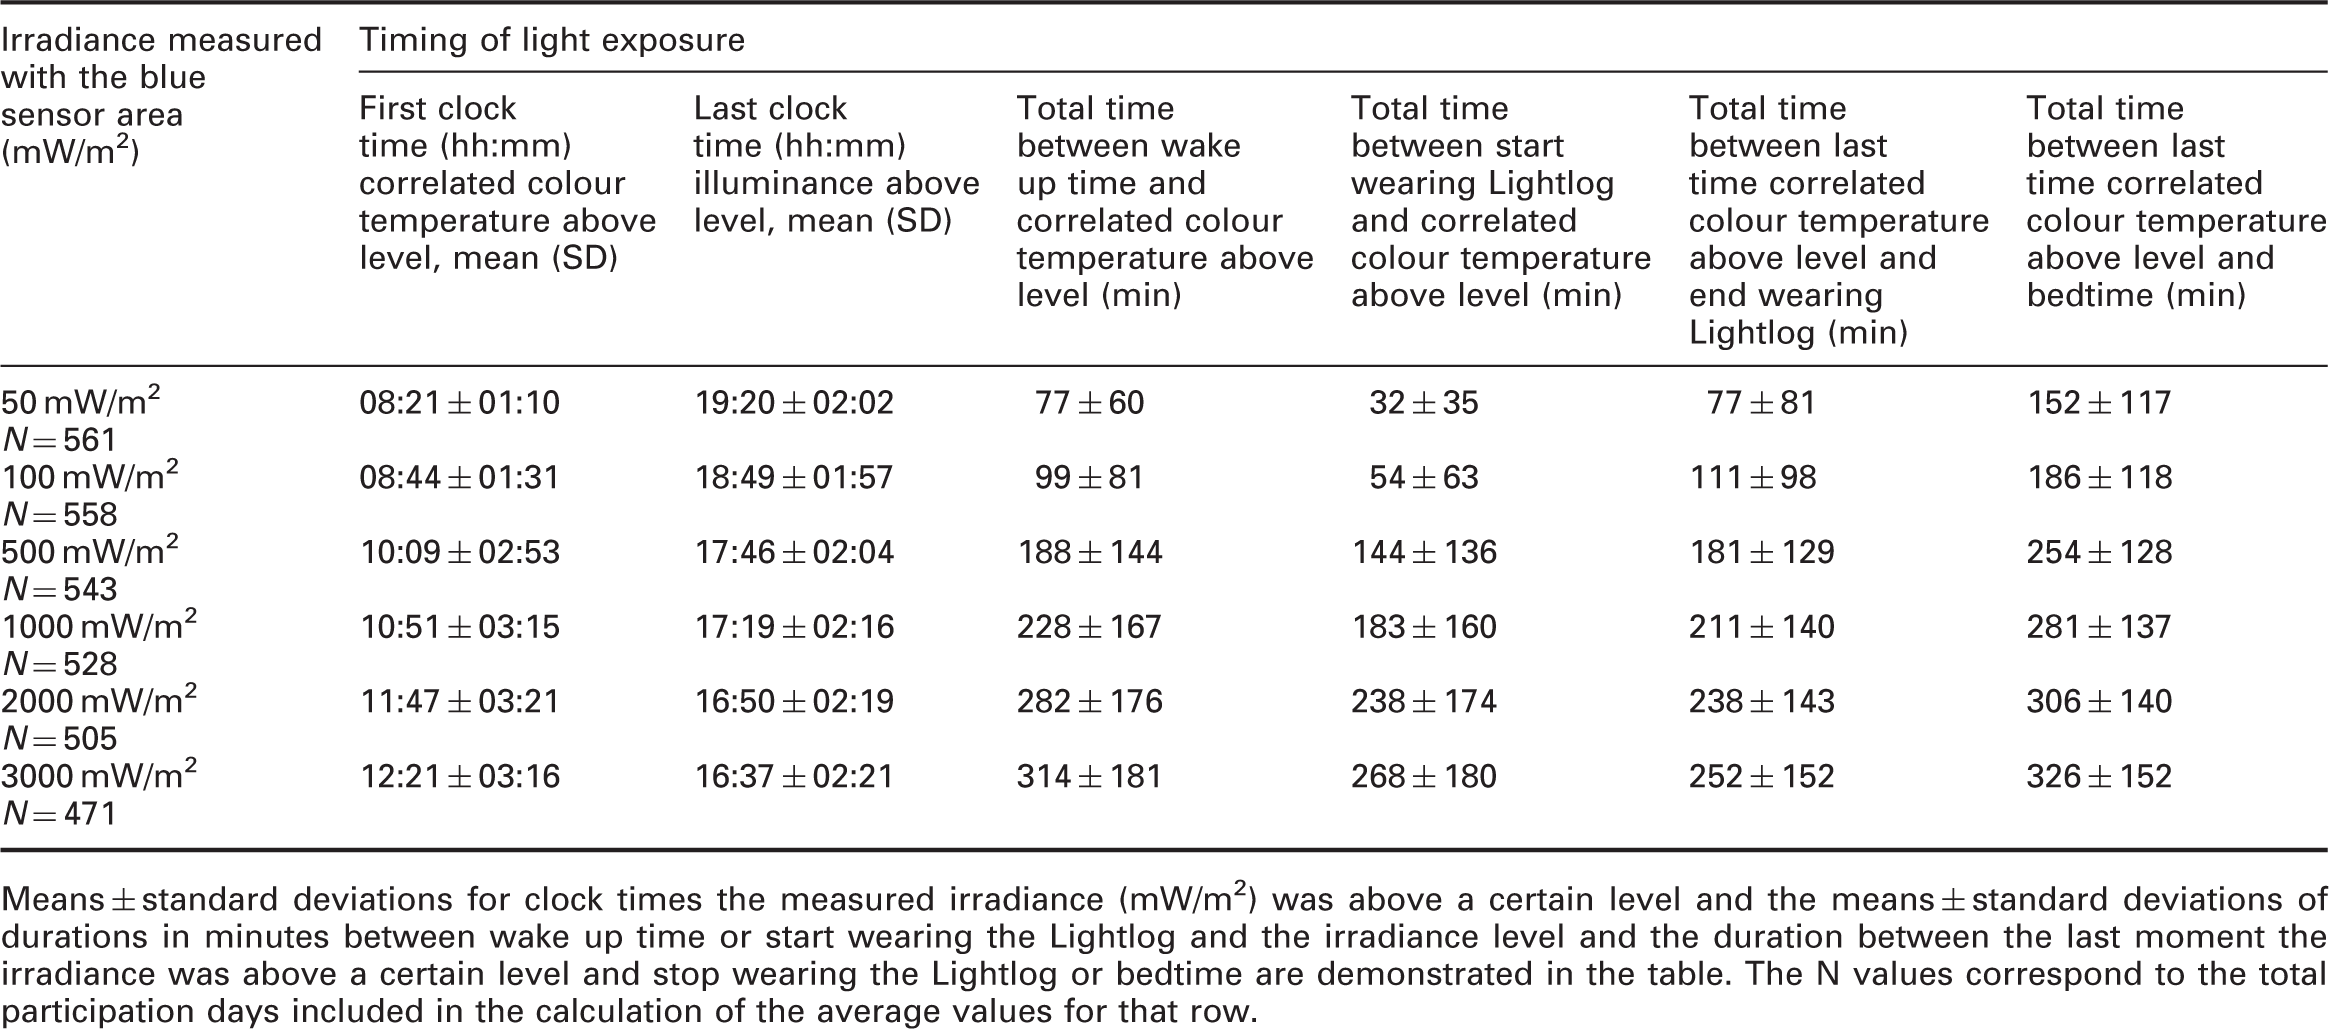
Means ± standard deviations for clock times the measured irradiance (mW/m2) was above a certain level and the means ± standard deviations of durations in minutes between wake up time or start wearing the Lightlog and the irradiance level and the duration between the last moment the irradiance was above a certain level and stop wearing the Lightlog or bedtime are demonstrated in the table. The N values correspond to the total participation days included in the calculation of the average values for that row.
Duration of light exposure (i.e. illuminances, correlated colour temperatures and irradiances measured with the blue sensor area)
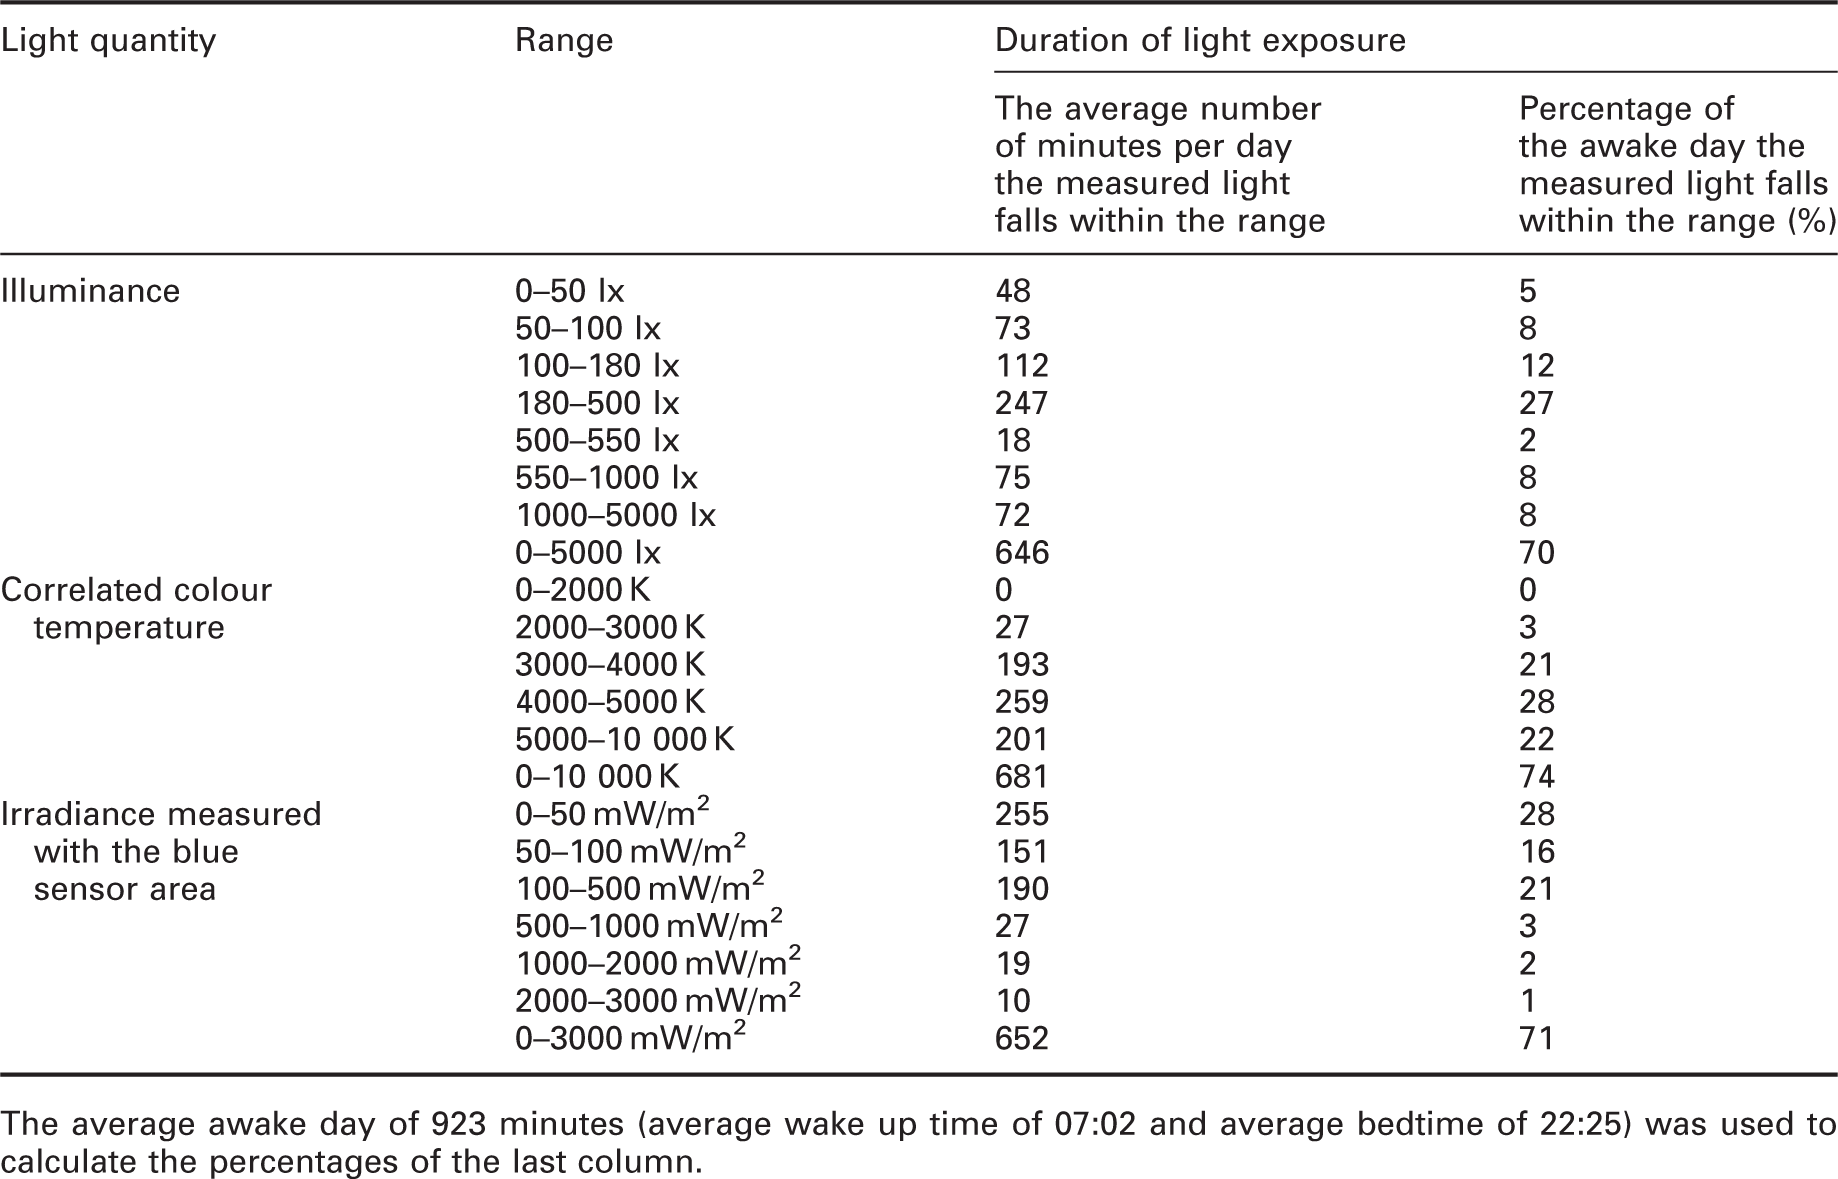
The average awake day of 923 minutes (average wake up time of 07:02 and average bedtime of 22:25) was used to calculate the percentages of the last column.
3.3 Exploring personal lighting conditions per individual
The results provided in Sections 3.1 and 3.2 were averaged over all participants. In this section, the differences in personal lighting conditions between the individuals are highlighted. Figure 7 demonstrates these differences. The times of the day for the three peaks in illuminance as demonstrated in Figure 4 are also the times of the day where the variation in illuminances between participants was the highest.
Boxplots demonstrating the variation in mean illuminance between participants. The bold black curve represents the average mean over all participants. The dotted lines indicate average sun rise and sun set for this period.
44
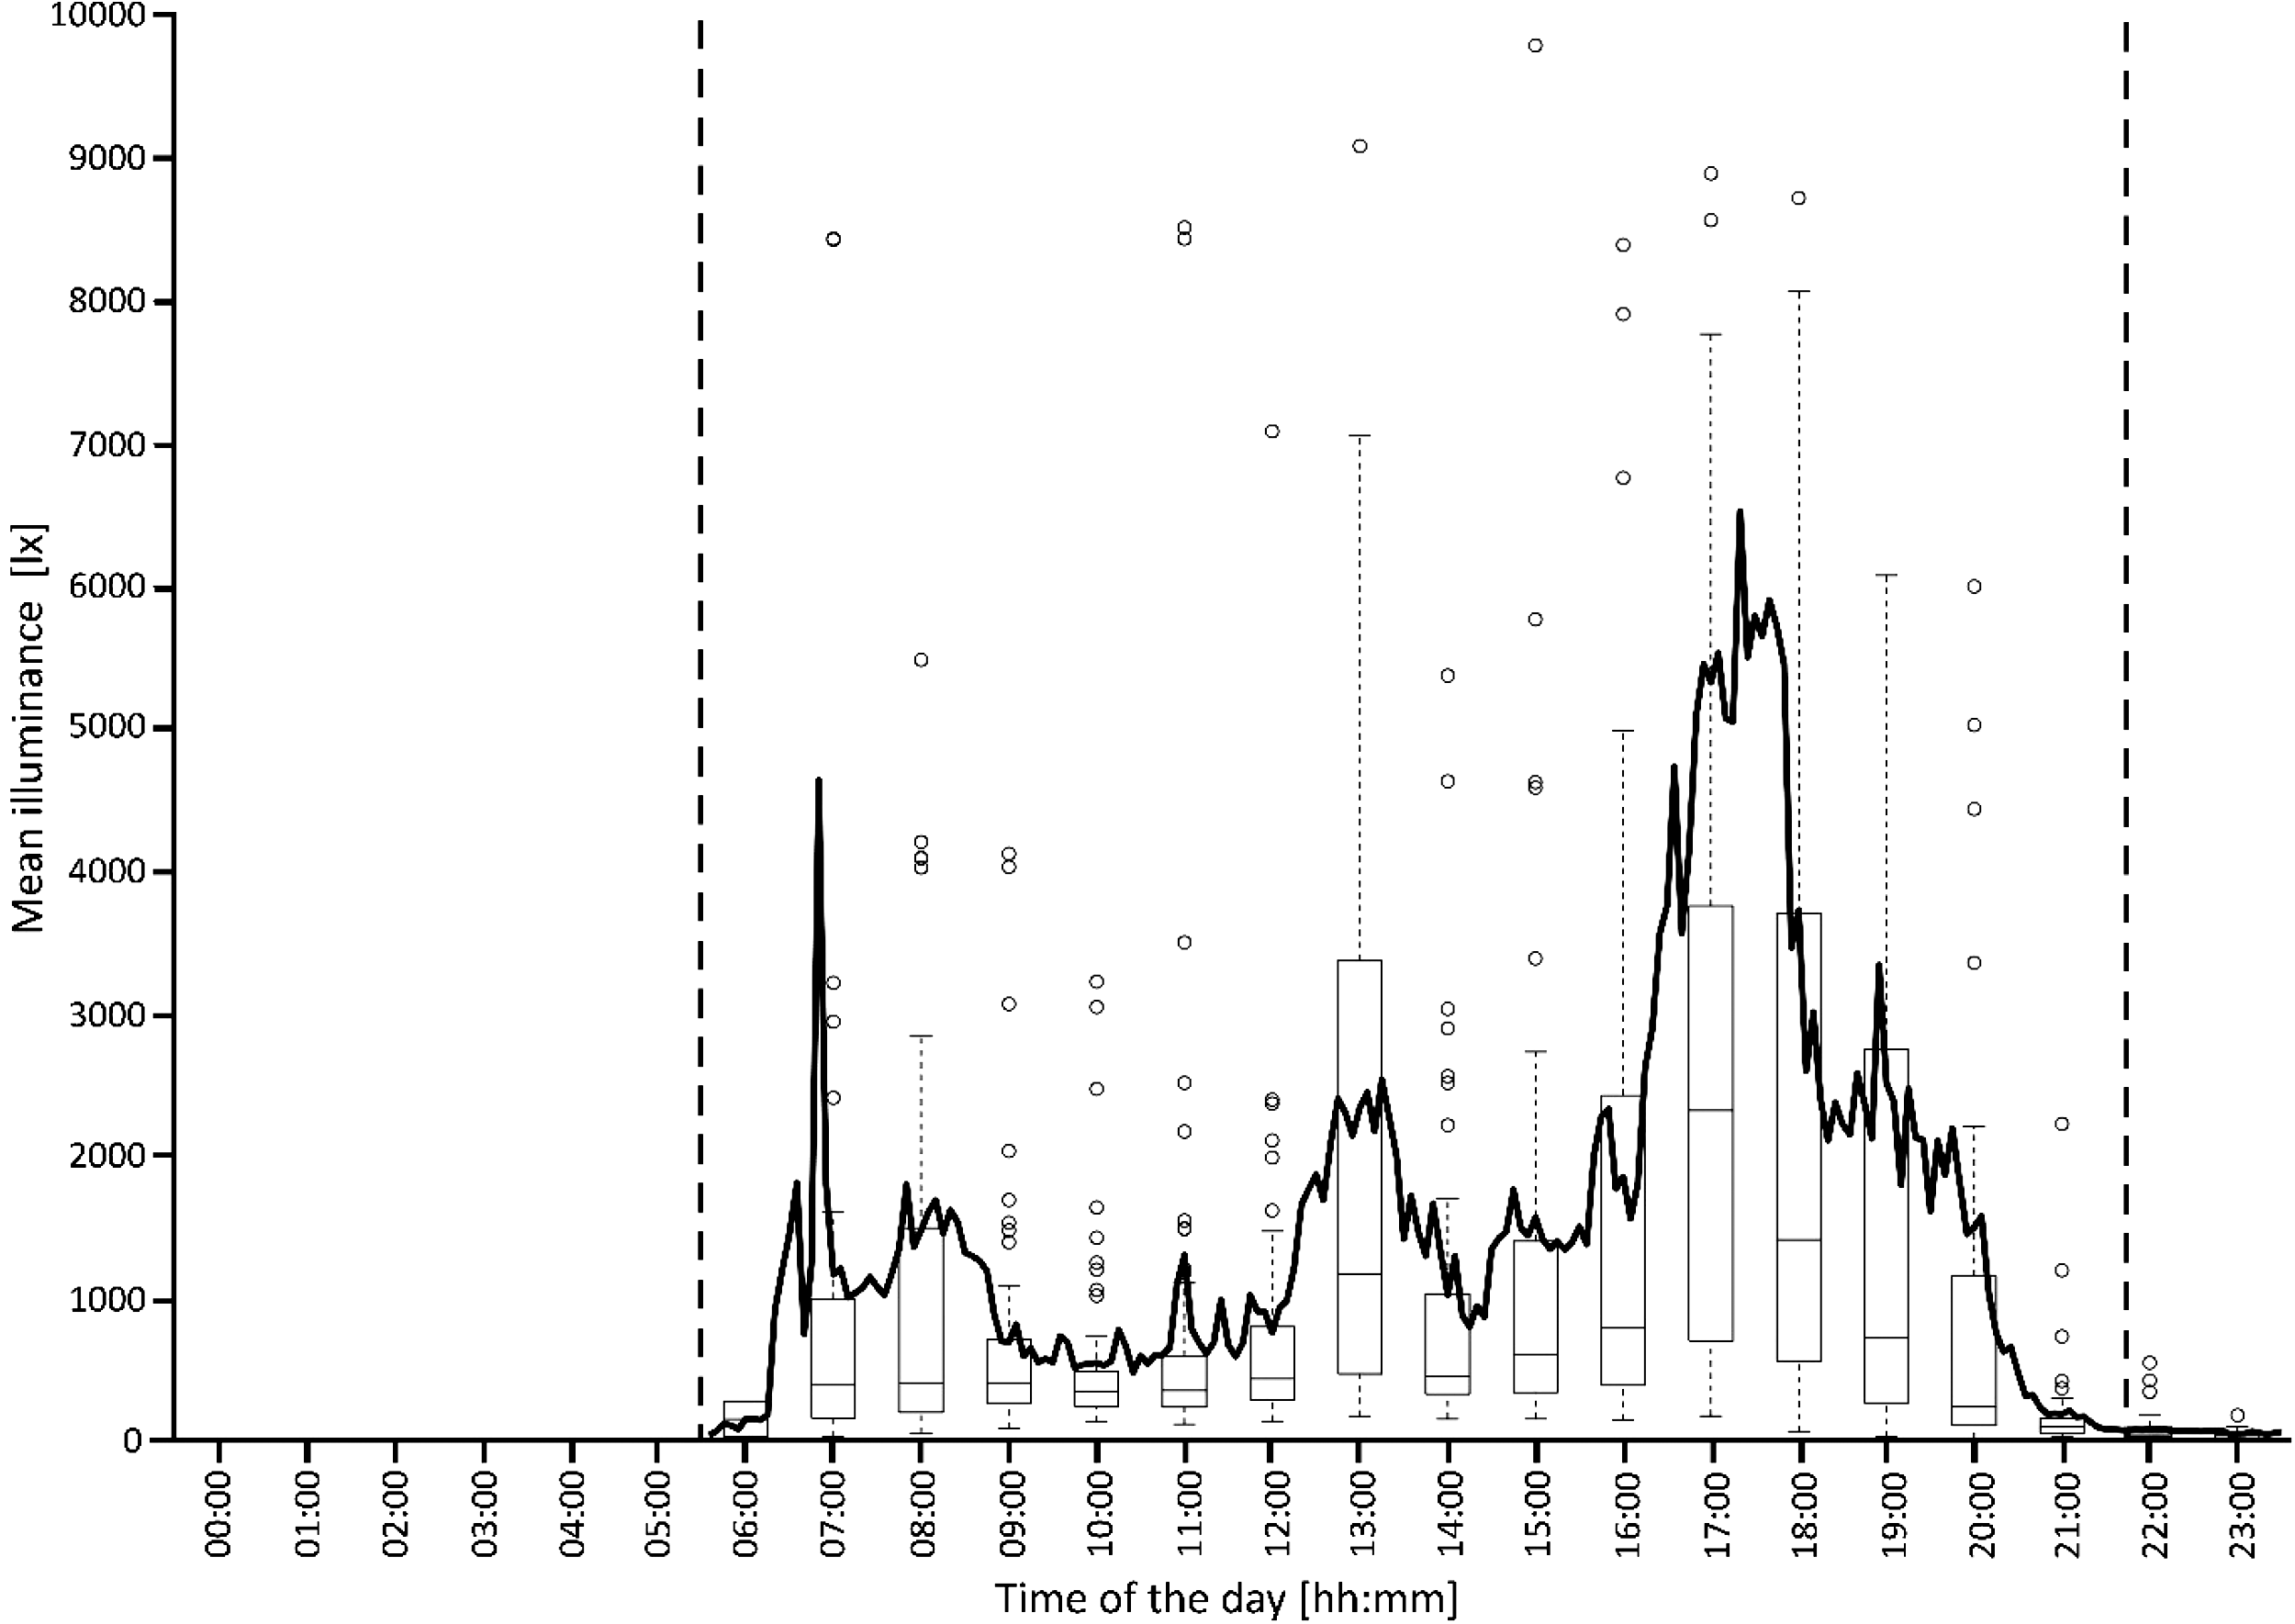
To zoom into the daily pattern of personal lighting conditions, all patterns per participant per participation day were analysed separately. The light measurements of only 6% of the participation days did not show any peak in the lighting conditions. For 37% of the participation days, two peaks in illuminances were visible. These two peaks were in 24 cases in the morning and during lunch time, 128 times in the morning and afternoon and 53 times during lunch time and in the afternoon. The daily pattern of light exposure consisting of three peaks, as demonstrated with the average curves (see Figure 4 and the black curve in Figure 7), was recognized in 149 participation days out of the total 552.
3.4 Exploring personal lighting conditions of subgroups
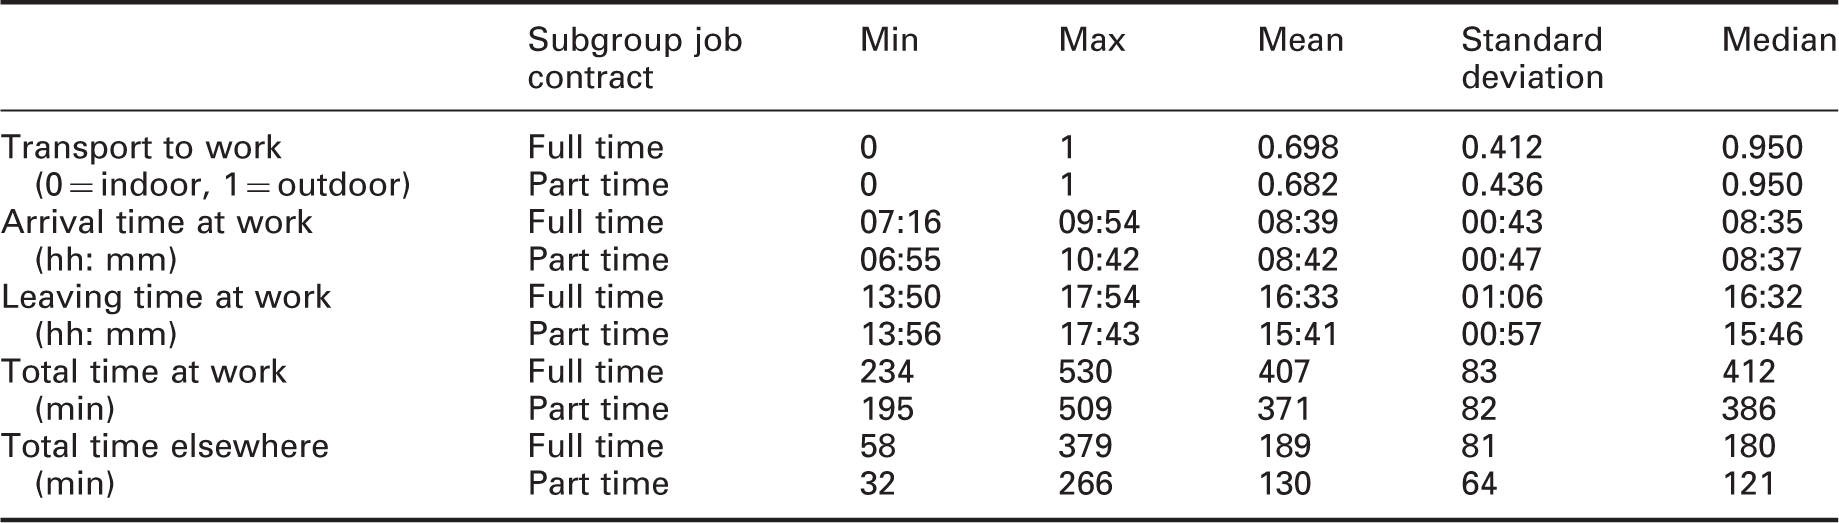
In addition to the average means over the entire sample size or the individual analyses, illuminances, correlated colour temperatures and irradiances measured with the blue sensor area were visually analysed for the four sets of subgroups as explained in Section 2.6.2. The set of graphs for the subgroups fulltime/part-time office workers was the only set of subgroups visually demonstrating differences in personal lighting conditions. Both subgroups consisted of exactly 30 office workers. Figure 8 demonstrates average daily personal lighting conditions for both subgroups. The peaks in personal lighting conditions were less visible for the group of fulltime office workers compared to the part-time office workers. In addition, Table 7 shows descriptive data for both subgroups. The full-time office workers spent more time at work, they arrived earlier at work and they left work later compared to the part-time office workers.
Average mean personal lighting conditions (illuminances, correlated colour temperatures and irradiances measured with the blue sensor area) for both subgroups: 30 full-time office workers (black curve) and 30 part-time office workers (grey curve). Study period was May–June 2017. The dotted lines indicate average sun rise and sun set for this period.
44
Descriptive statistics for both subgroups: full-time/part-time office workers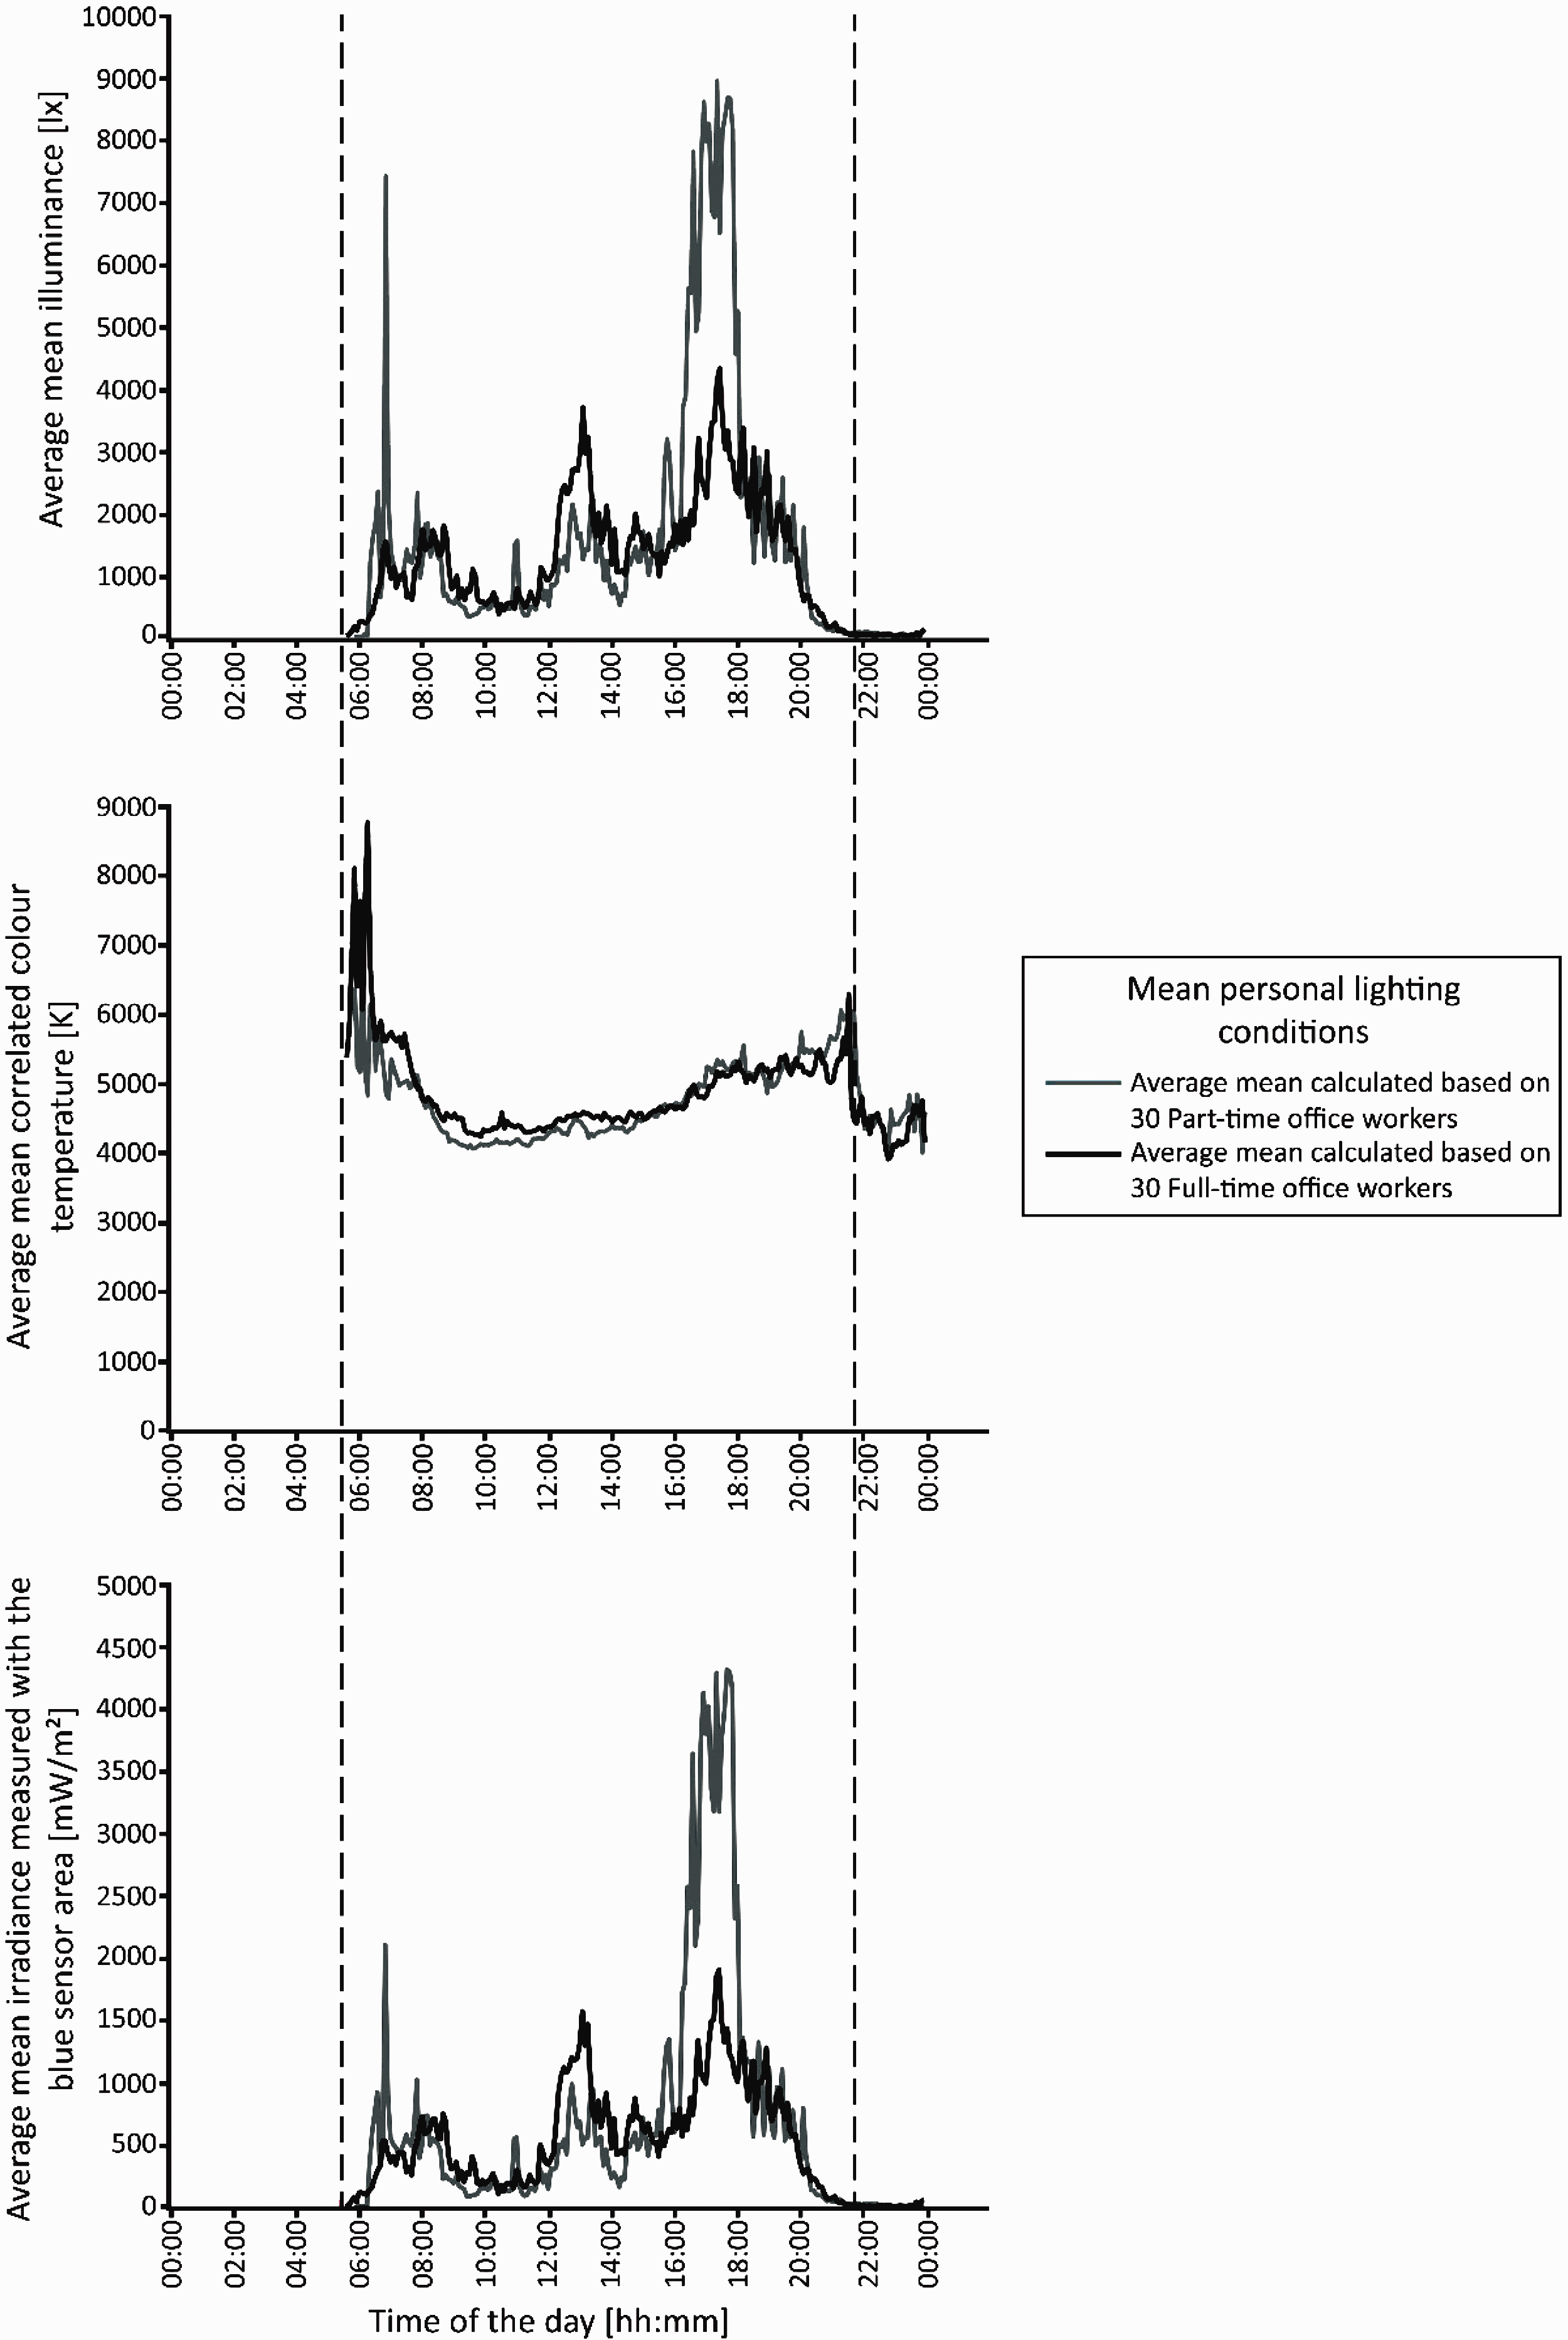
4 Discussion
Personal lighting conditions of 62 office workers in the Netherlands during spring 2017 were analysed from the perspective of effects beyond vision. This section describes the potential when using personal lighting conditions (4.1), the findings of the actual interpretation of personal lighting conditions based on four of the factors identified to be relevant for initiating effects beyond vision (4.2), the limitations of the study (4.3), and future research directions (4.4).
4.1 Potential when using personal lighting conditions
This paper demonstrates the potential of personal lighting conditions when interpreted based on factors relevant for initiating effects beyond vision. Personal lighting conditions refer to lighting conditions at the individual level and thus automatically include individual’s locations. This inclusion enables the interpretation of personal lighting conditions per location type. In addition, the continuous measurements throughout the entire day allowed the interpretation of timing and duration of light exposure. It is highly recommended to include personal lighting conditions in light effect studies. 9
4.2 Interpretation of personal lighting conditions
Even though this study only included participants from one office building and it was only performed in spring 2017, still large individual differences in personal lighting conditions were found. These individual differences in personal lighting conditions may be caused by fixed personal characteristics (e.g. gender, age, chronotype),29,51,52 sleep behaviour, preferences, 53 job tasks and behaviour or the used workplace.22,54,55 In addition, differences in personal lighting conditions between days were also found and may be explained by the weather 56 or possibly changing work schedules of the office workers.
The work schedule of the office workers included in this study was demonstrated using the percentages of time spent at a certain location. Respectively 22%, 42% and 17% of the awake day was reported as time spent at home, at work and elsewhere. The standard deviation in time spent at work was relatively small considering all participants (84 minutes), whereas the standard deviations for time spent at home and elsewhere were found to be larger. The ratios between time spent at home, at work or elsewhere may depend, amongst others, on type of employment (fulltime/part-time) and possibilities to work from home. 57 The possibilities to have individualized flexible working times or places differ between countries. 58 The differences between participants in time spent at a certain location may have caused the individual differences of the personal lighting conditions.
Besides the individual differences, the personal lighting conditions differed between multiple location types (at home, at work and elsewhere). Although
In addition, the distribution of personal lighting conditions throughout the course of the day was also investigated. The three notable peaks of illuminances throughout the day (i.e. one in the early morning, one around noon and one in the late afternoon, see Figure 4) are strongly explained by
Furthermore, the duration of light exposure was investigated (Section 3.2). The percentage of time per day the participant was exposed to a certain illuminance varied from 2% for 500–550 lx to 28% for 180–500 lx. The correlated colour temperatures did not vary much and the results showed 3% of the time a CCT of 2000–3000 K to 30% for a CCT of 4000–5000 K. For the irradiances measured with the blue sensor area the percentages varied from 1% for 2000–3000 mW/m2 to 28% for 0–50 mW/m2. It needs to be mentioned that the participants did not wear the Lightlog for an average of 19% of the awake day. Since this 19% of the time was mainly outside daylight hours, it is expected that the percentages of the day with illuminances up to 1000 lx (i.e. corresponding to indoor situations 32 ) will increase whereas the percentages for illuminances above 1000 lx would remain similar.
The mean number of minutes for which the participant was exposed to at least 1000 lx (i.e., 72 minutes in the range between 1000 and 5000 lx, see Table 6) is lower than found in the study from Tsuzuki et al. 21 (180 ± 101 minutes), but higher than found in the study of Heil and Mathis 34 (36 ± 6 minutes). Although the participants in the study of Tsuzuki et al. were asked to live their regular lives during their participation, it remains unclear whether they were at work or not. Since their mean age was 64 years, the higher number of minutes above 1000 lx may be explained by more time spent outside. In contrast, the number of minutes above 1000 lx was much lower in the study from Heil and Mathis. This study took place in September and the job of the participants (i.e. hospital employees) was different then in the study described in the current paper. This may explain the lower lighting conditions. The numbers of minutes above certain minimum illuminances are comparable to the results of the study of Crowley et al. 32 However, the first and last clock times above a certain illuminance are different between both studies. Crowley et al. described earlier clock times for first clock time the measured illuminance was above the illuminance levels and also later clock times for the last clock time the illuminance was above this level. This difference may be explained by the difference in latitude of the study location (i.e. Chicago: 41°, Alphen aan den Rijn: 52°) and the corresponding sun positions, the differences in work behaviour and normal working hours between American and European office workers, the persistence in wearing the photometer during the participation days or the total number of participants in the study (i.e. the standard deviation of the current paper, calculated from the data of 62 participants, is higher compared to the data of Crowley et al. including 14 participants).
Lastly, personal lighting conditions were analysed per individual office worker or per subgroup of office workers. The analysis of personal lighting conditions per participant per participation day demonstrated the most common daily patterns of light exposure. For 64% of the days a daily pattern including two or more peaks in illuminance levels was visible. These peaks were mostly received in the morning, during lunch time or in the afternoon. These results suggest again that office workers receive their highest personal lighting conditions (vertical illuminances) probably during their commute to and from work or during lunch time (probably outside). When analysing personal lighting conditions for subgroups of participants, only differences between full-time and part-time office worker were found for the mean illuminances, mean correlated colour temperatures and mean irradiances measured with the blue sensor area. The peaks were less prominent for the group of full-time office workers. The group of fulltime office workers had on average a longer working day (earlier arrival time and later leaving time) and spent more time at work. Since the personal lighting conditions the office workers received at work were lower compared to elsewhere and at home, the higher amount of time spent at work may cause lower personal lighting conditions. However, the reason why the peaks for personal lighting conditions throughout the day are less prominently present is unclear. It may be because of the different commute durations between these two subgroups. 61 It may also be explained by the high standard deviation for time spent elsewhere for the group of full-time office workers. Since the total time spent elsewhere has a large range, it may be that the peaks appear less in the average curves for personal lighting conditions for this subgroup. This may be further investigated via the personal curves for personal lighting conditions throughout the day.
4.3 Limitations of the study
First, this paper only includes four factors (light quantity, spectrum and timing and duration of light exposure) when describing personal lighting conditions, whereas the International Commission on Illumination (CIE) recommended to include as many light quantities as possible to describe the total lit environment. 62 In addition, it was stated that, when investigating effects of light beyond vision, at least six factors are of importance: light spectrum, quantity, directionality and timing, duration and history of light exposure. 8 Light directionality and history of light exposure were not included in this paper.
Second, the objective light measurements were performed using the PBM method. 11 This method is known as a practical method to easily gather personal lighting conditions throughout the entire day. However, this method also suffers from disadvantages such as relatively high performance errors and the experience of wearing discomfort.12,13,16 Although the PBM device was mounted at the chest to strive for vertically oriented measurements, the exact angle of mounting the device on the chest differs per person and may have had an influence on the measured personal lighting conditions. In addition, the deviation from measuring at chest level compared to a reference measurement in between both eyes was found to be 7–17% for respectively outdoor and indoor conditions. 13 Accessories such as hats or sun glasses were not taken into account in determining this deviation, so it can be expected that lighting conditions measured at chest level may differ even more from actual personal lighting conditions entering the eyes of an individual. It has been recommended though, considering the performance, practical aspects and wearing comfort of person-bound devices, to measure lighting conditions at chest level of the individual. 63
Besides the practical and comfort issues of the applied measurement method, the Lightlogs applied in this study were unable to measure full spectral data. Without this full spectral data, it was impossible convert the measured personal lighting conditions of the office workers to α-opic light quantities.19,64 Therefore, the personal lighting conditions were only analysed as illuminances, correlated colour temperatures, and irradiances measured with the blue sensor area. Although these irradiances measured with the blue sensor area were suggested as alternative for spectral data when investigating effects of light beyond vision, the specific spectral sensitivity of the blue sensor area needs to be taken into account. 20 Due to the abovementioned potential inaccuracies of the measurement method, the daily personal lighting conditions of the 62 office workers were analysed in an explorative manner. The reader should be cautious interpreting the exact numbers of the personal lighting conditions presented in this paper.
Third, there are some limitations to the field study design itself. Wearing the device from wake up time until bed time, putting the device in the black bag when the device was not worn and remember to always put the device on the outer layer of clothes requires perseverance of the participant. It is unknown how often these tasks were forgotten or how often the participants were cutting corners. The same perseverance was asked for completing the daily diary. It may also be questioned what impact it has on ecological validity when participants are reminded about their participation to the study throughout the entire day (i.e. other people may notice that the participant is wearing a Lightlog, the diary on the desk of the participant to be filled in, and the emails sent by the researchers including the questionnaires). Besides the study procedure of the participants, the field study only included working days whereas including non-working days or weekend days in future would make it possible to extend the duration of light exposure or to include history of light exposure to be investigated in relation to longer term effects beyond vision. Furthermore, the comparison between different seasons, similar to the studies of Crowley et al. 32 and Figueiro and Rea, 26 needs to be done with larger and more extended light effect studies.
4.4 Future research directions
Future research needs to consider three aspects. First, since it is unknown which of the six light factors is/are the most relevant to initiate effects beyond vision and since there is no (daily) threshold yet known to examine whether a certain light effect will emerge, it is uncertain whether the participants in the current study received ‘sufficient’ light during their participation days. It is suggested to perform more light effect field studies that incorporate continuous measurements of personal lighting conditions. Second, it is recommended to take into account at least the six identified factors relevant for the potential relationship between light and effects beyond vision in future light effect studies. Each of these factors should be considered thoroughly. For example, the study duration may be extended to include multiple seasons in the data collection to give a broader interpretation of the personal lighting conditions. And third, it is recommended to collect as many data from objective measures as possible to reduce the effort of the participants to fill in diaries and questionnaires. For example, Global Positioning System (GPS) or even the light measurements itself may be used to determine the participant’s location and may eliminate the daily diaries from the study design.
5 Conclusion
The current study interpreted personal lighting conditions of office workers (N = 62, study period in spring 2017) using four out of the six factors identified to initiate effects beyond vision. The findings in the current paper give in-depth insight in the possibilities to interpret personal lighting conditions of office workers from the perspective of effects beyond vision. However, the findings should be treated with caution and cannot be generalized. While interpreting the personal lighting conditions based on the luminous factors (H, E, CCT and B), large individual differences were found even within the selective sample of 62 office workers. Besides the individual differences, the study demonstrated large differences in lighting conditions between different office worker’s locations. Furthermore, the timing of light exposure was investigated. The average illuminance and irradiance measured with the blue sensor area (over all participants and all days) over the course of the day peaked three times: in the morning, during lunch time and at the end of the afternoon. The duration of light exposure demonstrated that, out of the average 646 minutes of exposure to 0–5000 lx, the participants were only exposed to an illuminance above 1000 lx for 72 minutes. The findings of this paper show that it is highly recommended to include personal lighting conditions in future light effect studies.
Footnotes
Acknowledgements
This research was performed within the framework of the strategic joint research program on Intelligent Lighting between TU/e and Koninklijke Philips N.V. and the Impuls II SPARK program. The municipality of Alphen aan den Rijn, the Netherlands and its employees were recognized for participation in this study. In addition, the doctoral committee members reviewing the PhD dissertation of Juliëtte van Duijnhoven are acknowledged for their feedback on this paper.
Declaration of conflicting interests
The authors declared no potential conflicts of interest with respect to the research, authorship, and/or publication of this article.
Funding
The authors received no financial support for the research, authorship, and/or publication of this article.