
Abstract
A recent paper proposed a more precise approach for investigating the impact of ambient light (daylight versus after dark) on road traffic collisions. The present paper first repeated that analysis of road traffic collisions in the UK to test reproducibility; it then extended the analysis to determine whether the greater precision affected the outcome of road traffic collision analyses. Results of the previous analysis were reproduced in terms of the direction of the effect, but the repeated analysis found greater differences between daylight and darkness. The odds ratio determined using the new method led to higher odds ratios than the analyses used in some past studies, suggesting that past studies may have underestimated the detrimental effect of darkness on road traffic collision risk.
1. Introduction
The risk of a road traffic collision (RTC) is influenced by many factors, including the alertness, intoxication and visual status of the driver,1,2 traffic speed, 3 traffic composition 4 and distraction from secondary tasks.5,6
After dark, there is a deterioration in visual performance, including reductions in contrast discrimination, depth perception and reaction time 7 which reduces the probability and speed of detecting potential hazards that might lead to an RTC. Road lighting partially offsets this,8–12 and is assumed to improve drivers' ability to detect potential hazards not otherwise revealed by vehicle headlights. 13 A reduction in reaction time to detection allows an earlier braking or avoidance response which can prevent a collision or at least reduce the speed of impact. One reason for installing road lighting is, therefore, to reduce the frequency and severity of RTCs after dark.
One approach to measuring the impact of ambient light on RTC rate is to compare the frequencies of RTCs that occur in daytime and darkness. To isolate the effect of ambient light from other factors which influences RTC risk, the comparison is made of RTC frequencies for a specific period of the day, which is daylit at one moment and dark at another. The clock change approach takes advantage of the twice-yearly change to clocks, in which clocks are advanced or retarded by 1 hour in response to changes in daylight: a certain time of day is therefore daylit immediately before clock change and dark immediately following clock change (or vice versa). The numbers of RTCs occurring within specific time windows are compared for the days immediately before, and immediately after, the clock change date. The clock change approach has been used to study the effect of ambient light on RTCs14,15 and travel behaviour. 16
An alternative to the clock change approach is to take advantage of the seasonal variation in daylight hours across the whole year and pick a period of the day which is daylit for one part of the year and dark for the remaining part. This approach permits a greater amount of data to be included in the analysis since it captures RTCs occurring year-round and not just those in the week(s) before and after clock changes. This may be important when disaggregating the analysis to smaller geographic areas, e.g. when trying to calculate individual odds ratios (OR) for specific locations. However, it exacerbates the influence on RTCs of seasonal effects such as weather. To isolate the effect of ambient light from other seasonal variations, an OR can be used. 17 The OR compares the day/dark ratio of RTCs in the case period with the corresponding ratio of RTCs for a control period: control periods are those which remain daylit or dark across the evaluation period. The whole-year method has also been used to study RTCs2,18 and travel behaviour. 19
One key point of these analyses is the definition of darkness, or, the degree to which RTCs occurring in twilight were omitted. Twilight is the partially daylit periods immediately before morning sunrise and immediately after evening sunset, when daylight persists due to the reflection and scattering of sunlight towards the horizon of a terrestrial observer. 20 The twilight periods are thus not fully daylit nor dark but a gradual transition between the two, and RTCs occurring in twilight introduce ambiguity as to the effect, if any, of ambient light. There are various standardised stages of twilight. Civil twilight is the stage where there is sufficient daylight illuminance to enable outdoor civil activity to continue unhindered without resorting to the use of electric road lighting: it is the period where solar altitude is between 0° and −6°. 20
The RTC study by Johansson et al. 18 defined darkness as after sunset and before sunrise (a solar altitude of 0°), which they defined as ‘approximately correct’. They used a 1-hour time window which, according to this definition, was daylit for part of the year and dark for part of the year. Clearly, there would be periods when this time window was in twilight. Sullivan and Flannagan14,21 set their dark hour as that occurring before the start of civil twilight in the morning and after the end of civil twilight in the evening.
While Johansson et al. 18 also considered RTCs in control periods to account for seasonal variation in their whole-year analysis, Sullivan and Flannagan14,21 did not. Sullivan and Flannagan 14 compared RTC rates in the two weeks before clock change with the two weeks after clock change (see their Figures 9, 10, 12, 13 and 14) with an assumption that ‘traffic volume, pedestrian exposure, and weather do not substantially change shortly before and shortly after the time change’. In later work, Sullivan and Flannagan21,22 used five-week windows before and after clock change. Ferguson et al. 23 considered 13 weeks before and 9 weeks after each clock change, and thus 44 weeks altogether, which approaches the whole-year period of Johansson et al. An assumption of insubstantial seasonal effects becomes less robust as the evaluation period increases.
A recent study by Raynham et al. 24 introduced a further development to the clock change method of investigating the effect of ambient light on RTCs. They considered RTCs in the seven day periods before and after clock change, and defined darkness according to civil twilight rather than sunset and sunrise. In addition, they added a further requirement: an RTC was considered to be within the case window if it occurred in darkness (a solar altitude of <−6°) but also if it was daylight (a solar altitude of ≥0°) for the same time of day in the opposite week (e.g. the week before clock change for an RTC occurring after dark in the week after clock change). This resulted in case periods which were reduced in duration (from 5 to 33 minutes – see Table 6 in Raynham et al.) compared with the 1-hour periods used by others.14,18,21 However, Raynham et al. did not report the degree to which the outcome of their analysis differed from previous work.
This paper reports four analyses of RTCs carried out to compare the differences between methods of analysis. First, the analysis of Raynham et al. 24 was repeated to test reproducibility, 25 the degree to which consistent results are reached when the same data are independently re-analysed. The Raynham et al. method was then extended to establish an OR. Third, the analysis was conducted using 1-h case and control time windows. Finally, a whole-year analysis was conducted.
2. Method
2.1 Analysis 1: Reproduce the analysis of Raynham et al.
This research used data from the STATS 19 database 26 of police-reported road traffic collisions (RTCs) that occurred in England, Scotland and Wales in the period 2005 to 2015. This is the same data source and the same period as was used by Raynham et al. 24 STATS 19 includes a data file for all vehicles involved in an RTC, and another which provides details on all the casualties involved: this allows for three sorts of data – the number of collisions, the number of vehicles involved and the number of casualties. The number of casualties can be further categorised as vehicle occupants (which includes all casualties that are not pedestrians or cyclists), pedestrians and cyclists.
The weeks before and after the Spring and Autumn UK clock change between the years 2005 and 2015
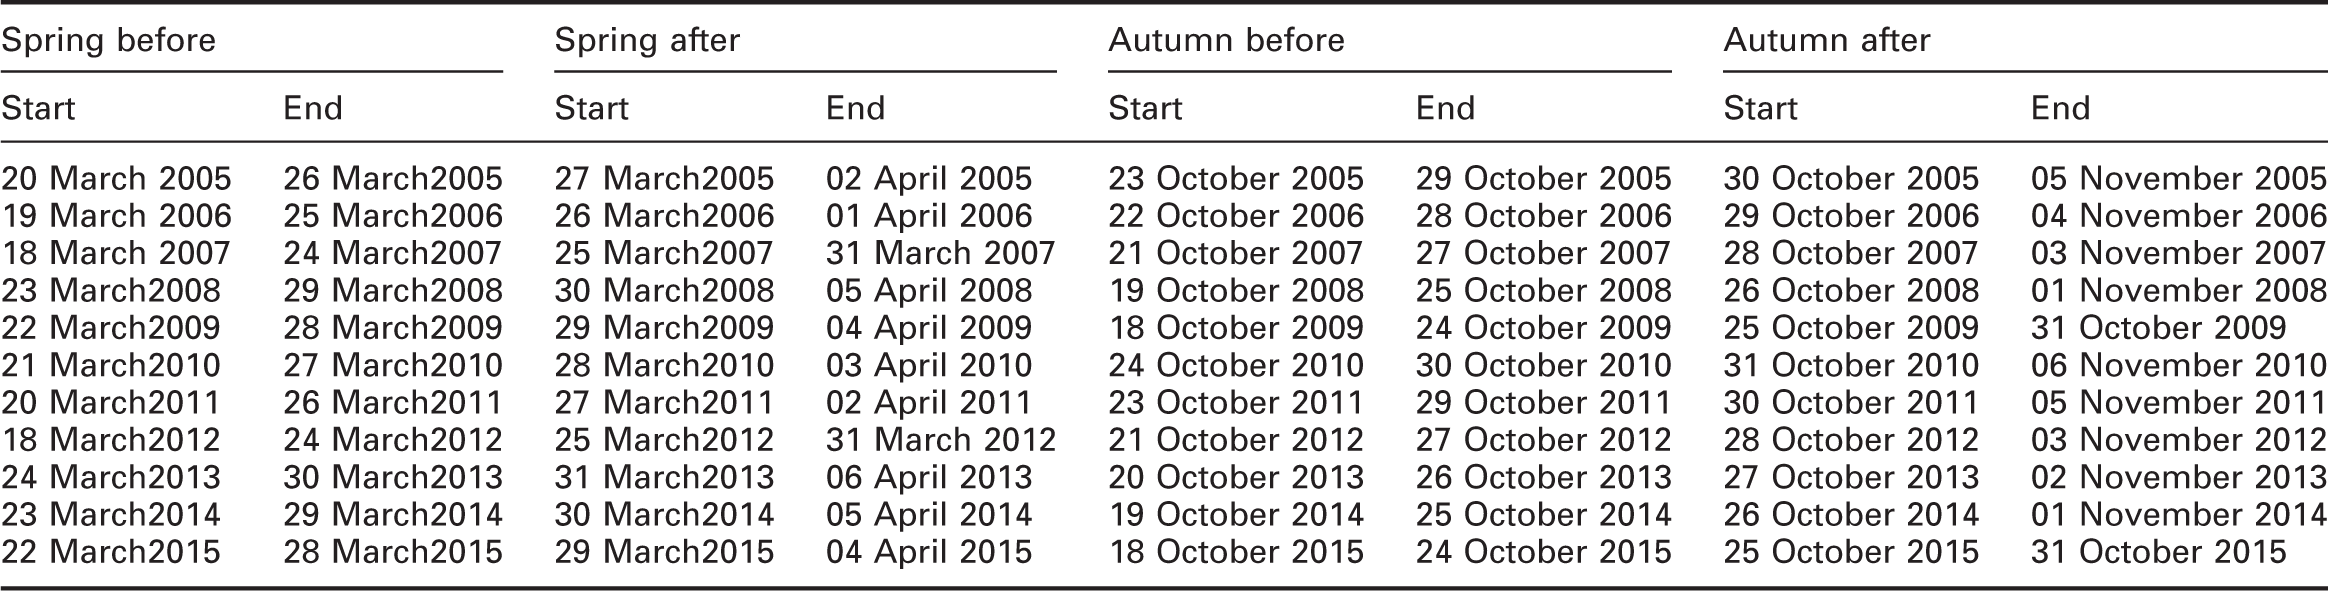
Solar altitude was calculated using the National Oceanic and Atmospheric Administration method 28 for each RTC. This method requires the date of the collision, the time zone, and the location (longitude and latitude) of the collision, all of which data are available in the STATS 19 data set. Solar altitude was also calculated at the exact same time for the paired week (i.e. if the collision took place in the week before the clock change, this was solar altitude in the week after clock change).
Periods that were searched for Case RTCs
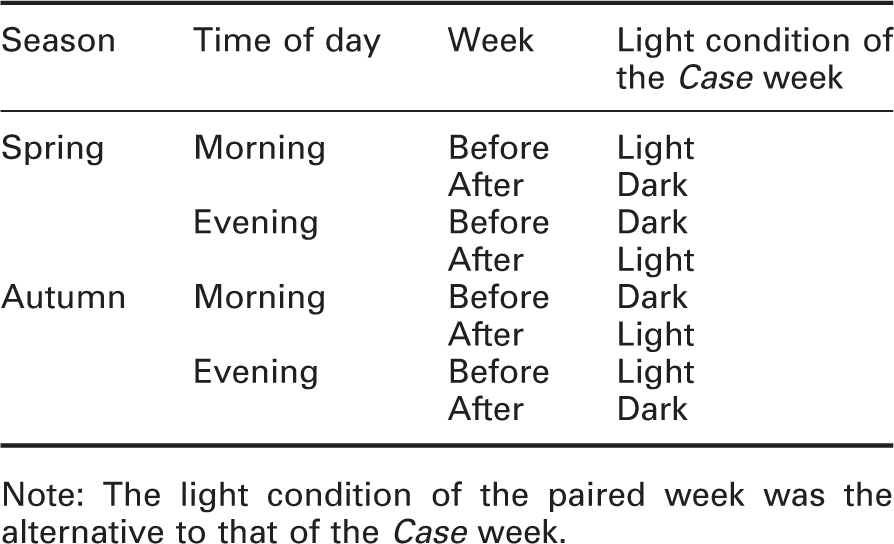
Note: The light condition of the paired week was the alternative to that of the Case week.
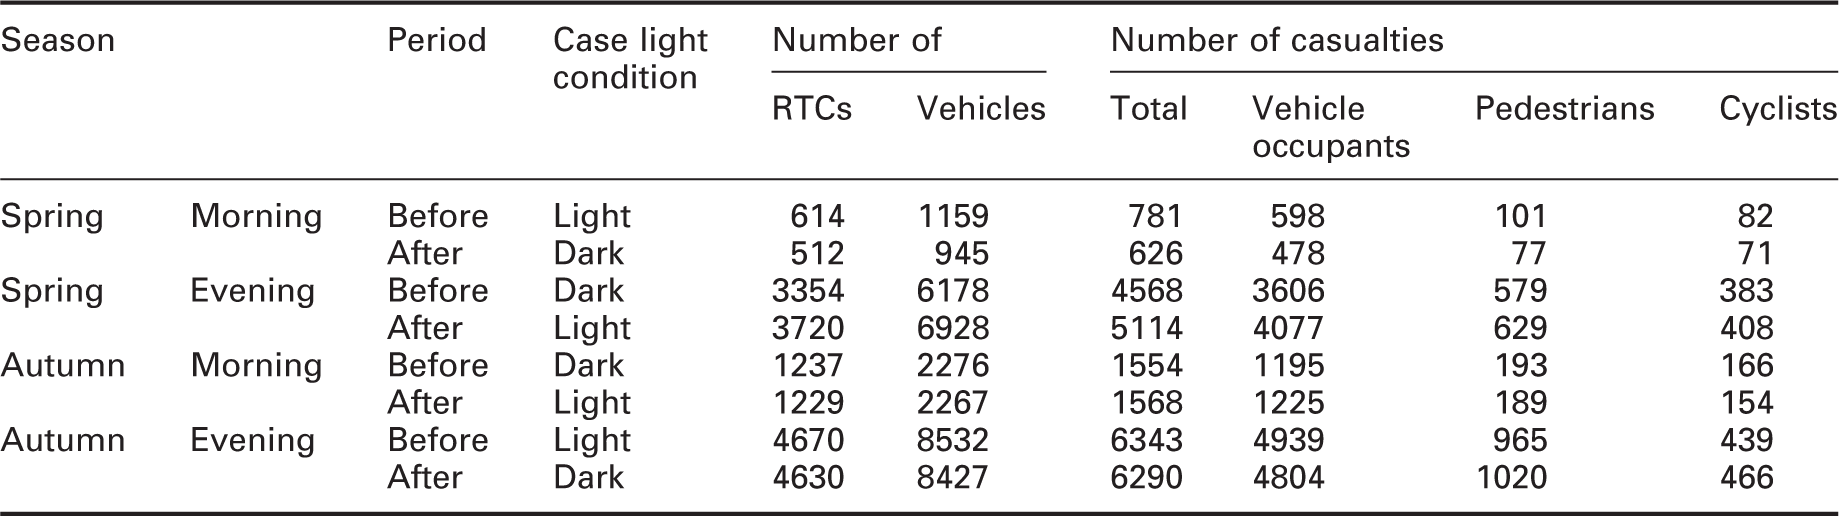
The numbers of collisions, vehicles and casualties in the case period
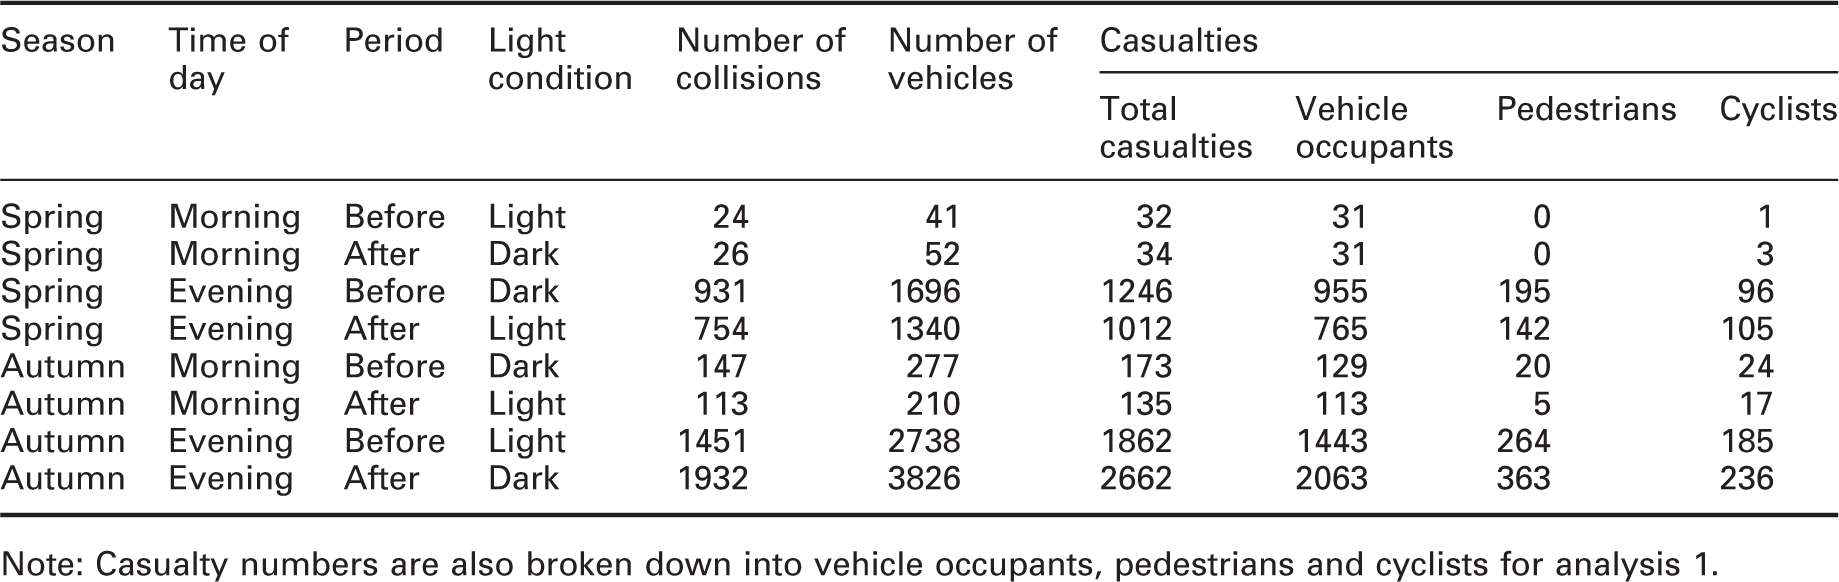
Note: Casualty numbers are also broken down into vehicle occupants, pedestrians and cyclists for analysis 1.
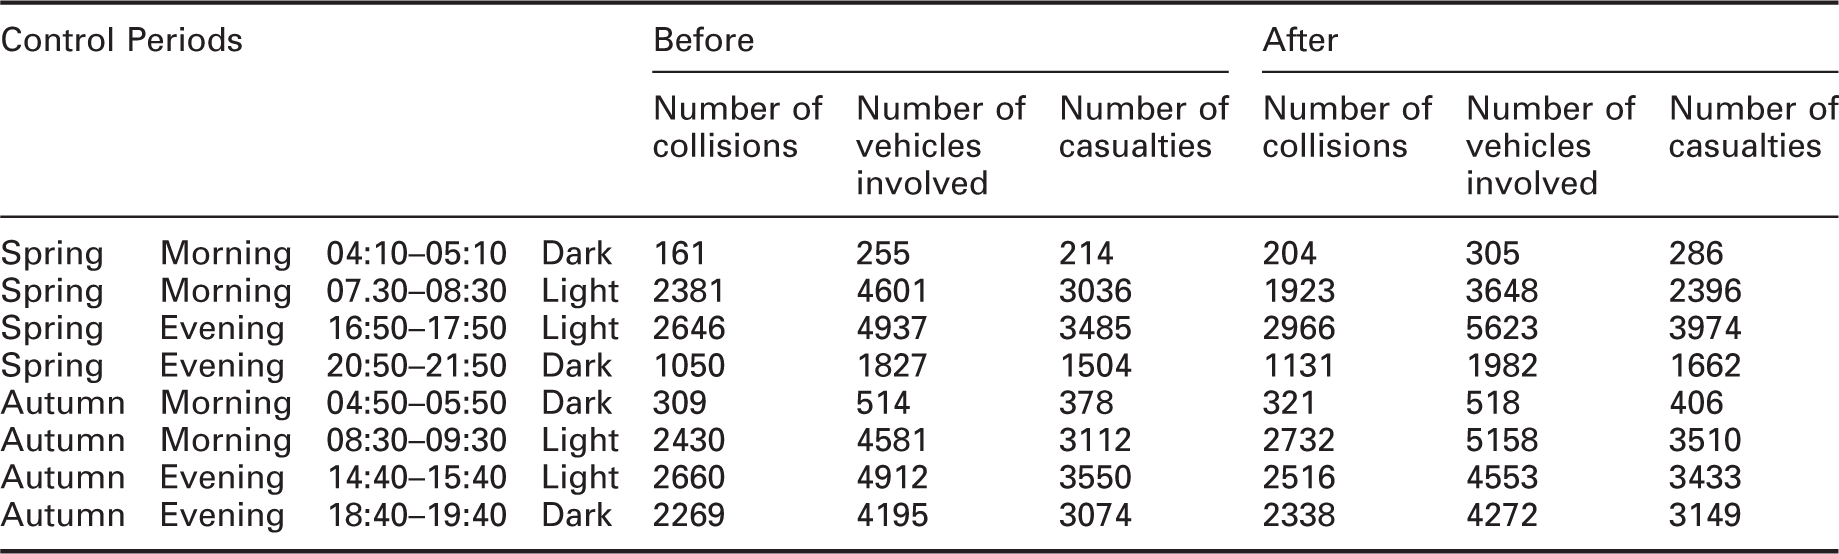
Definition of the control periods, and the numbers of collisions, vehicles and casualties before and after the clock change for analysis 1
According to our understanding of their work, this method of analysis was identical to that used by Raynham et al. 24
2.2 Analysis 2: Odds ratio for Raynham et al.
The first analysis calculated the number of ‘Case’ collisions using the Raynham et al. approach to distinguish RTCs in daylight and darkness. However, following Raynham et al., the length of the control periods (one hour) was much longer than the short durations of the case periods. Given that all previous research has matched the case and control period time windows, to determine ORs, the current analysis calculated the duration of the ‘Case’ collision time windows for each year, and used control periods which were the same overall length. These are summarised in Appendix 1.
The times of the control periods were determined by either adding or subtracting 2 hours to the case time window, producing a daylight control window (where the whole period had a solar altitude of 0° or above), and a dark control window (where the whole period had a solar altitude of −6° or below). For example, if the morning case window was between 06:06 and 06:10, then the dark control window was 2 hours before this (i.e. 04:06 to 04:10), and the daylight control window was 2 hours after this (i.e. 08:06 to 08:10). Table A1 shows the timings for these two control windows.

The number of collisions, number of vehicles involved, and number of casualties, broken down into vehicle occupants, pedestrians and cyclists that occurred during the Dark and Day control windows detailed in Table A1
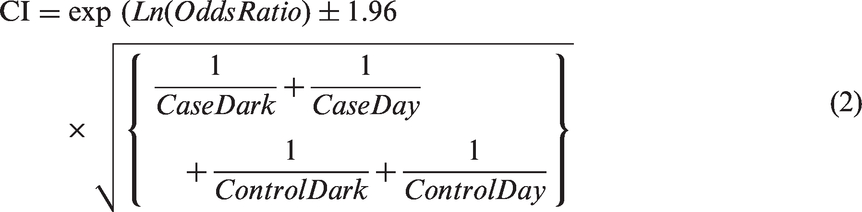
where
CaseDark is the count of RTCs that occurred when the solar altitude was −6° or below, and the paired week was 0° or greater. CaseDay is the count of RTCs that occurred when the solar altitude was 0° or greater, and the paired week was −6° or below. ControlDark is the count of RTCs in the day and dark Control periods on days when the Case RTCs would be in darkness. ControlDay is the count of RTCs in the day and dark Control periods on days when the Case RTCs would be in daylight.
2.3 Analysis 3: Defined case hour
The third analysis employed a previously used assumption regarding the definitions of daylight and darkness, using 1-hour case and control periods. 15 Following that previous study, this analysis considered only the evening daylight-to-dark transition. The case hour was defined as the hour immediately preceding the time of sunset on the day of the Spring clock change, and the hour immediately after the time of sunset on the day of the Autumn clock change. During Spring, the case hour changes from darkness before the clock change to daylight after the clock change, and in Autumn the case hour changes from daylight before the clock change to darkness after the clock change.
The time of sunset on the day of the clock change was calculated for each RTC using the National Oceanic and Atmospheric Administration method, 28 accounting for the date of clock change and location of the RTC. This resulted in a range of sunset times between 18:14 and 19:00 (GMT) during the Spring clock change and between 16:14 and 17:10 (GMT) during the autumn clock change.
In addition, two 1-hour control periods were identified, with these having the same light condition both before and after the clock change. Following previous research, 15 these were a daylight control hour between 14:00 and 14:59 and a dark control hour between 21:00 and 21:59. The total number of Case and control records was 22,324 collision records, 41,428 vehicle records and 31,291 casualty records.
2.4 Analysis 4: Whole year approach
For the whole year approach, 18 the case hour was set as 18:00–18:59: for one part of the year, this hour is in daylight, and for the other part it is in twilight or darkness. As with analysis 3, this considered only the afternoon daylight-to-dark transition. Choosing the same hour of the day to compare darkness and daylight, this limits the influence of non-light factors that may be associated with RTC risk. The two control hours, where the ambient light condition remained constant throughout the year, were 14:00–14:59 and 22:00–22:59. This method used a later dark control hour compared to the previous method as the whole year method includes summer time, and therefore the control hour needs to be later to ensure it is in darkness throughout the whole year. This data set comprised 320,826 collision records, 590,598 vehicle records and 438,471 casualty records.
3. Results
Table 6 shows the percentage changes in RTCs, according to type, for the case and control periods, as determined using analysis 1 and also the results reported by Raynham et al. 24
The percentage increase in the number of ‘Case’ RTCs, number of vehicles and number of casualties in dark compared to daylight, and the percentage change during the hour control periods
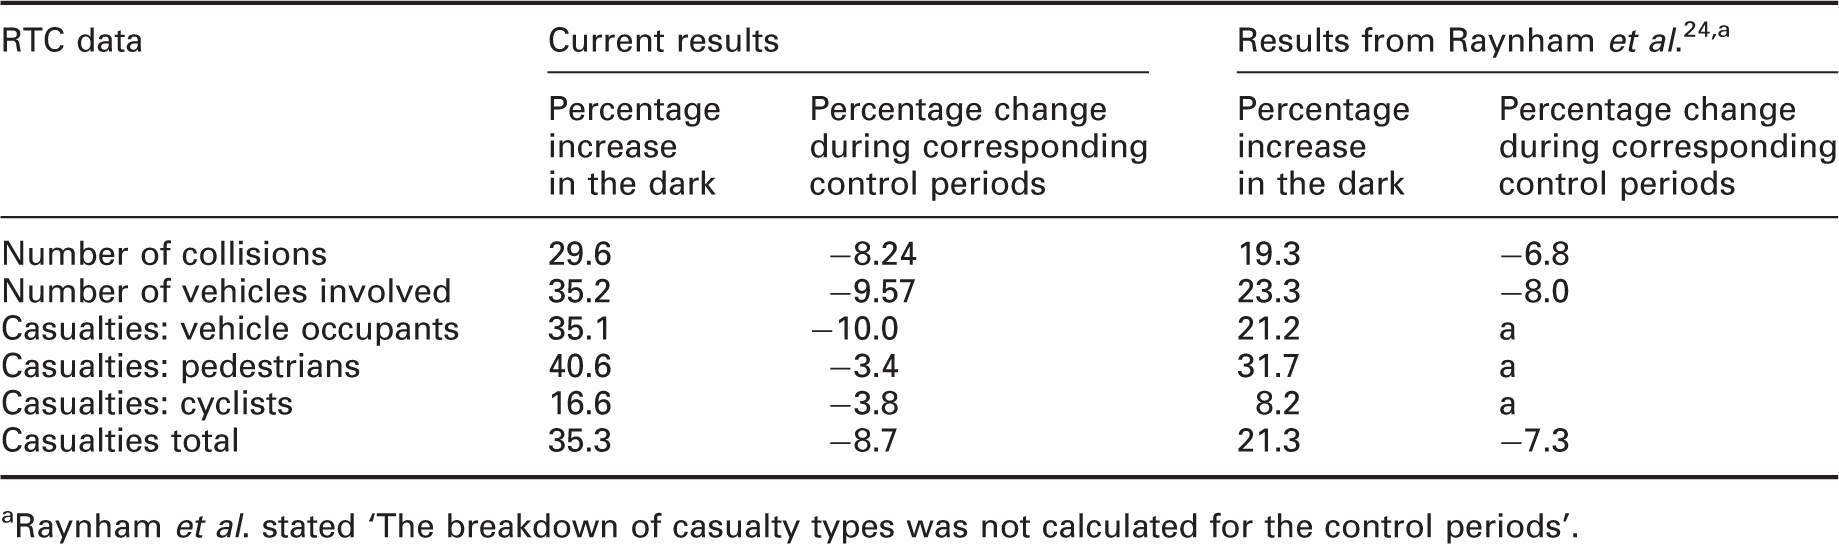
aRaynham et al. stated ‘The breakdown of casualty types was not calculated for the control periods’.
The darkness versus daylight odds ratio (OR), associated 95% confidence intervals (CI), and p-values for number of collisions, number of vehicles involved and casualties
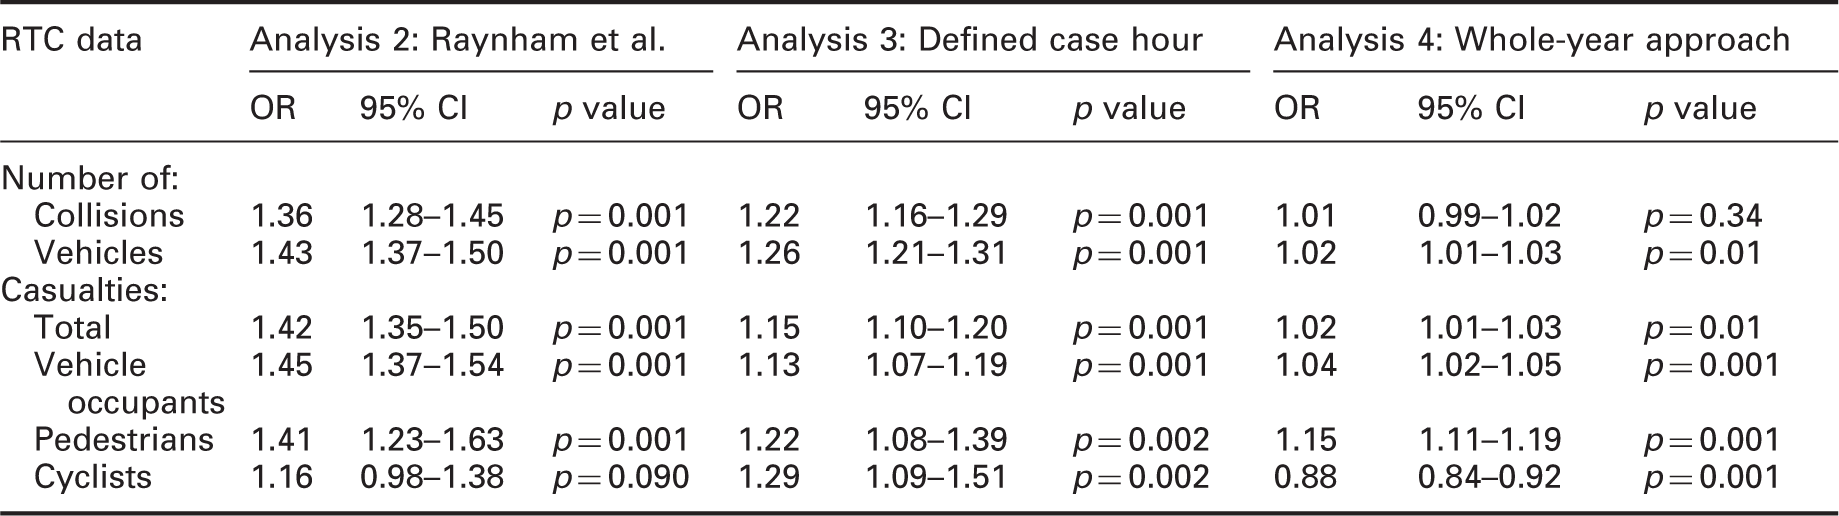
Comparison of odds ratios (ORs) determined using the three methods of analysis
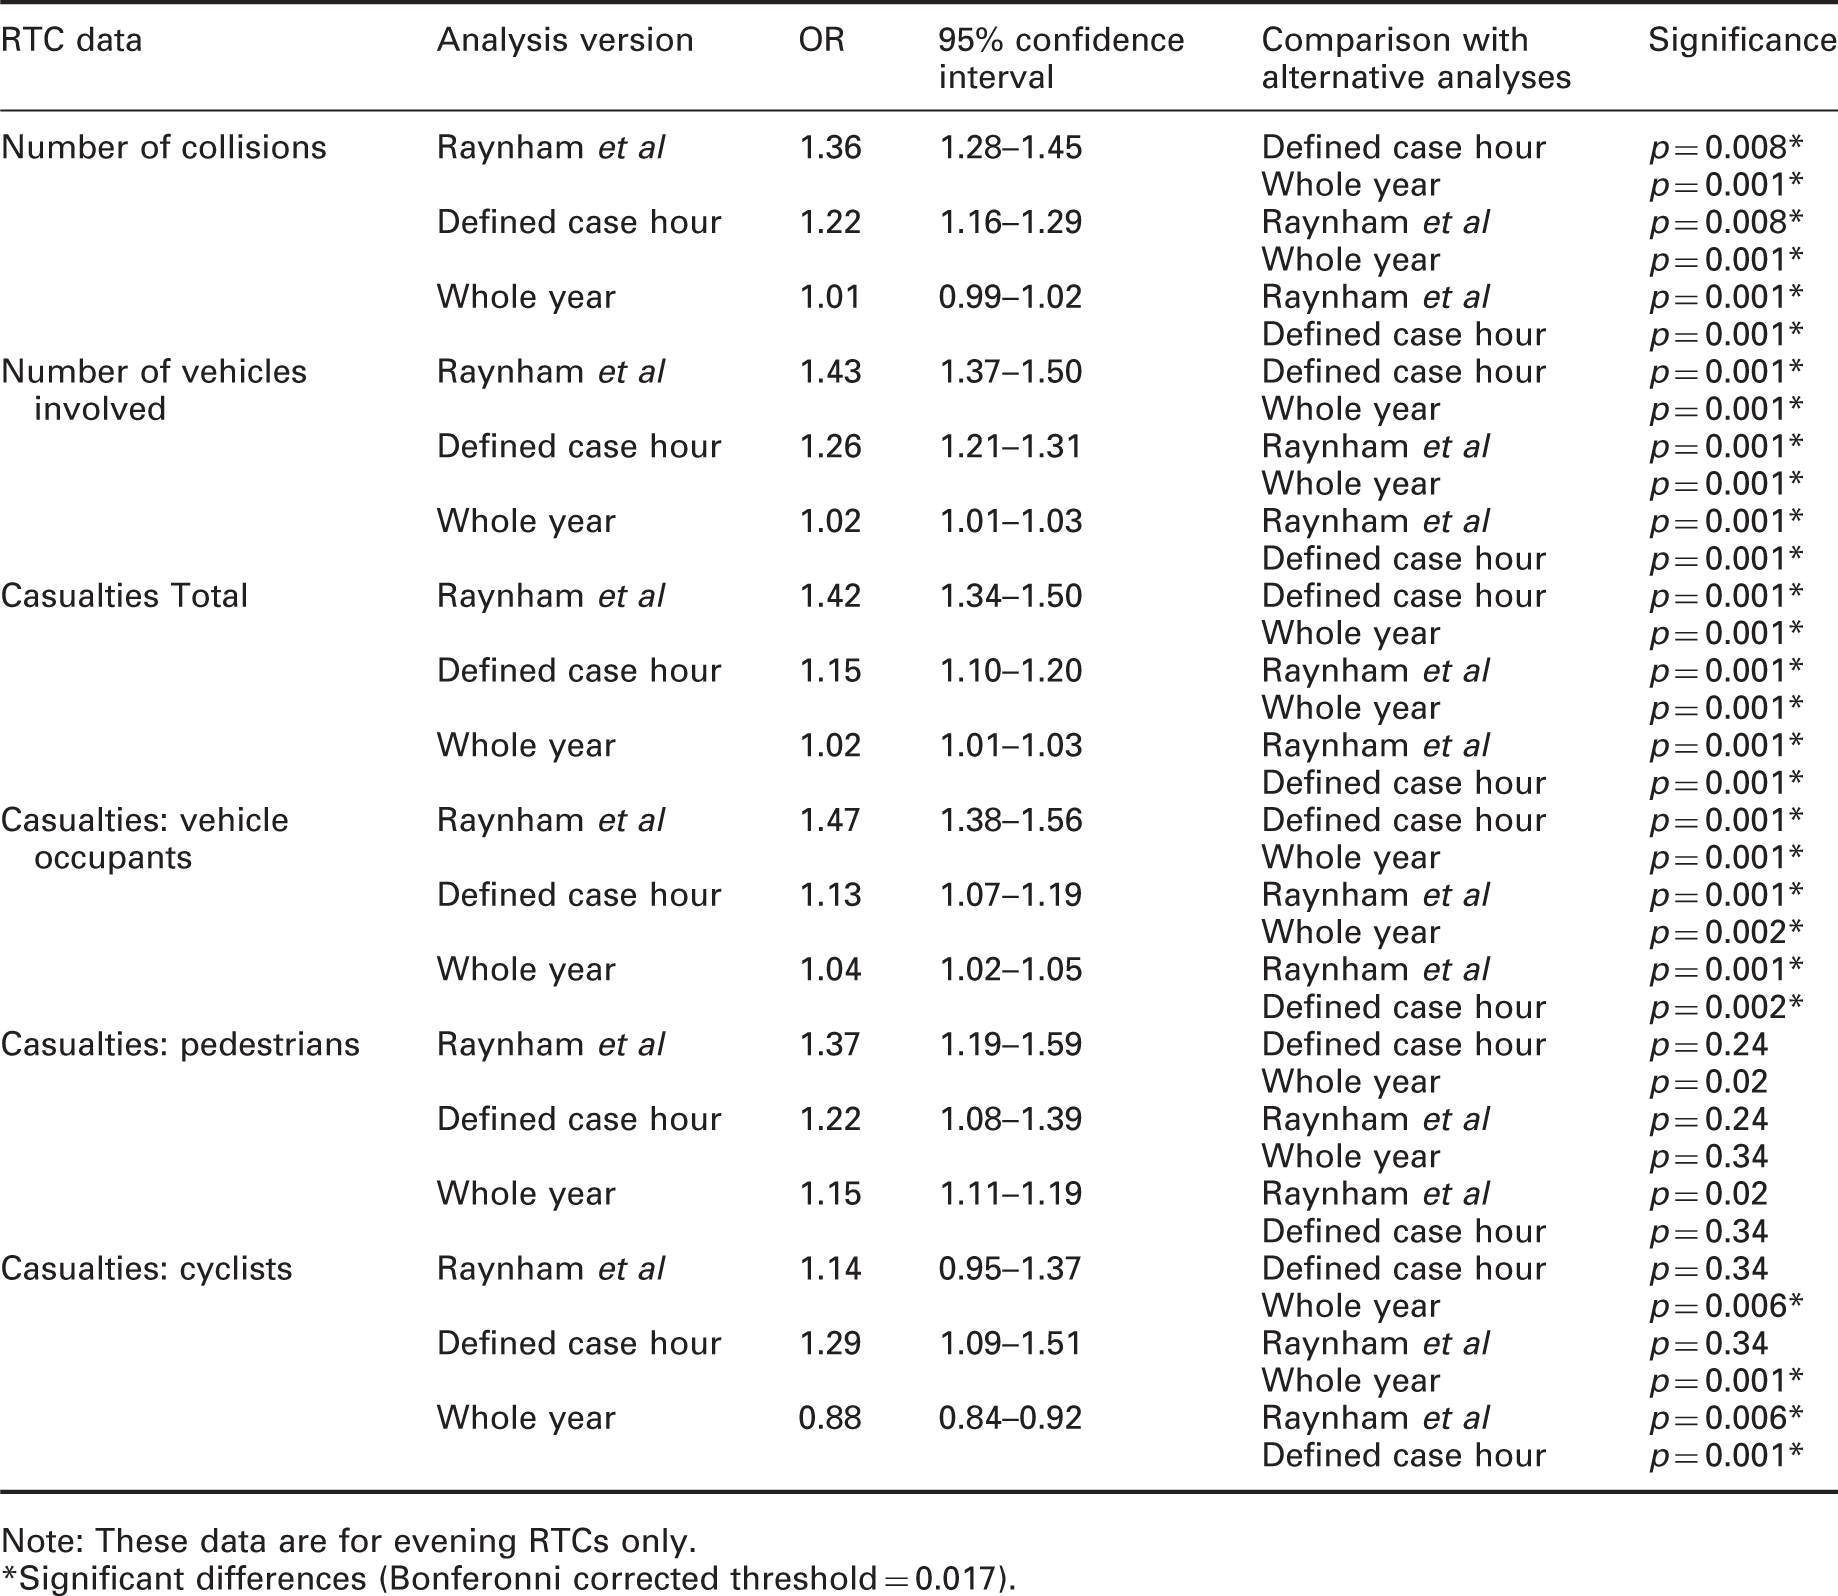
Note: These data are for evening RTCs only.
*Significant differences (Bonferonni corrected threshold = 0.017).
4. Discussion
The first analysis reported the percentage increase in RTCs occurring after dark (Table 6). Analysis 1 led to greater differences than those reported by Raynham et al. for all instances, but the differences do not change the direction of effect. The percentage differences in RTC frequencies in light and dark periods (the Case periods) are greater than those found for the control periods: this suggests that the change in ambient light across Case periods was a significant factor. Percentage differences in control periods are in the opposite direction to those for Case periods: we are yet to establish an explanation for this. An advantage of analysis using odds ratios is that the Case and control periods are considered together.
There may be two explanations for the differences between the findings of the current and Raynham et al. studies. First, it may be the result of researcher degrees of freedom, 30 the apparently arbitrary decisions made during the analysis. Second, there are differences in definition of the before/after clock change periods, as can be seen by comparing Table 1 in the current article with Table 5 in Raynham et al. 24 During the Autumn clock change for the years 2010, 2011 and 2012, the Raynham et al. analysis reports the two weeks before the clock change during that year, instead of one week before and one week after the clock change. Dates given for the Spring clock change in 2015 are also incorrect in Raynham et al., and the number of days for the weeks before and after the Autumn clock change of that year is not balanced (six days in the before period, eight in the after period).
Next consider the ORs as shown in Tables 7 and 8. ORs determined in accordance with the Raynham et al. approach with clock change data (analysis 2) led to ORs which depart further from unity than those estimated using the defined one-hour case and control windows with clock-change data (analysis 3). The whole-year method (analysis 4) led to the smallest ORs which, in many cases, were significantly smaller than those estimated using the other analyses. Generally, the stricter the approach for excluding RTCs occurring in twilight, the larger the odds ratio and thus the larger the estimated influence of darkness on RTCs. Analysis 3, for which the definition of darkness leads to a less extreme contrast between the two ambient light conditions than analysis 2, underestimates the effect of darkness on RTCs; ambient light levels may play a stronger role in RTC risk than concluded in earlier studies.
These trends between methods of analysis were found for the number of collisions, the number of vehicles involved, total casualties and vehicle occupant casualties, with significant differences between the ORs. Although the same trend existed for analyses of pedestrian casualties, the use of different criteria for defining dark and daylight did not cause significant differences between the ORs (Table 8). For cyclists, the ORs estimated with all methods were low, particularly the whole-year method.
In Tables 3 to 5, it can be seen that the number of RTCs in the morning is less than the number of RTCs in the evening, for both Spring and Autumn, for both the case and control periods. One possible change between these periods is traffic volume: Figure 1 of Raynham et al. 24 shows that traffic flows vary with time of day. For the morning and evening periods of the current analyses (see Appendix 1), and for traffic flow in the UK (Figure 1 in Raynham et al. 24 ), the morning period represents approximately 3.8% of daily traffic flows and the evening period approximately 5.8%. There is some evidence of an association between traffic volume and type and RTCs, for example an increase in the volume of light non-passenger cars increases the likelihood of more severe accidents (although this is not the case for passenger cars and heavy vehicles), 31 and the number of collisions involving pedestrians is expected to increase with an increase in the average annual daily traffic. 32 However, it is not known whether a change in traffic flow of 2% is sufficient to cause significant change in RTC numbers. An alternative explanation is that the Raynham et al. method leads to shorter case periods in the mornings than the evenings (see Appendix 1).
5. Conclusion
This paper has explored different approaches to analysing the impact of ambient light upon RTCs as recorded in the UK database STATS19 for the period 2005 to 2015. This study repeated the method of analysis used by Raynham et al. and found greater percentage differences in collisions and casualties between light and dark conditions. The Raynham et al. method follows previous work by defining the daylight and dark periods according to civil twilight (solar altitudes of > 0° and <−6° respectively) but furthermore defined the case period as that which was dark before clock change and also daylight after clock change (and vice versa according to season and time of day): this results in smaller time windows than the 1-hour periods used in previous studies. This more precise approach for distinguishing between RTCs in daylight and darkness twilight led to greater ORs (analysis 2) than found if these criteria are relaxed (analyses 3 and 4), providing more compelling evidence of the detrimental effect of darkness on RTC rates.
Time windows for the ‘Case’ collisions, and the time windows for the daylight and darkness control periods for Analysis 2: Raynham's approach with odds ratios
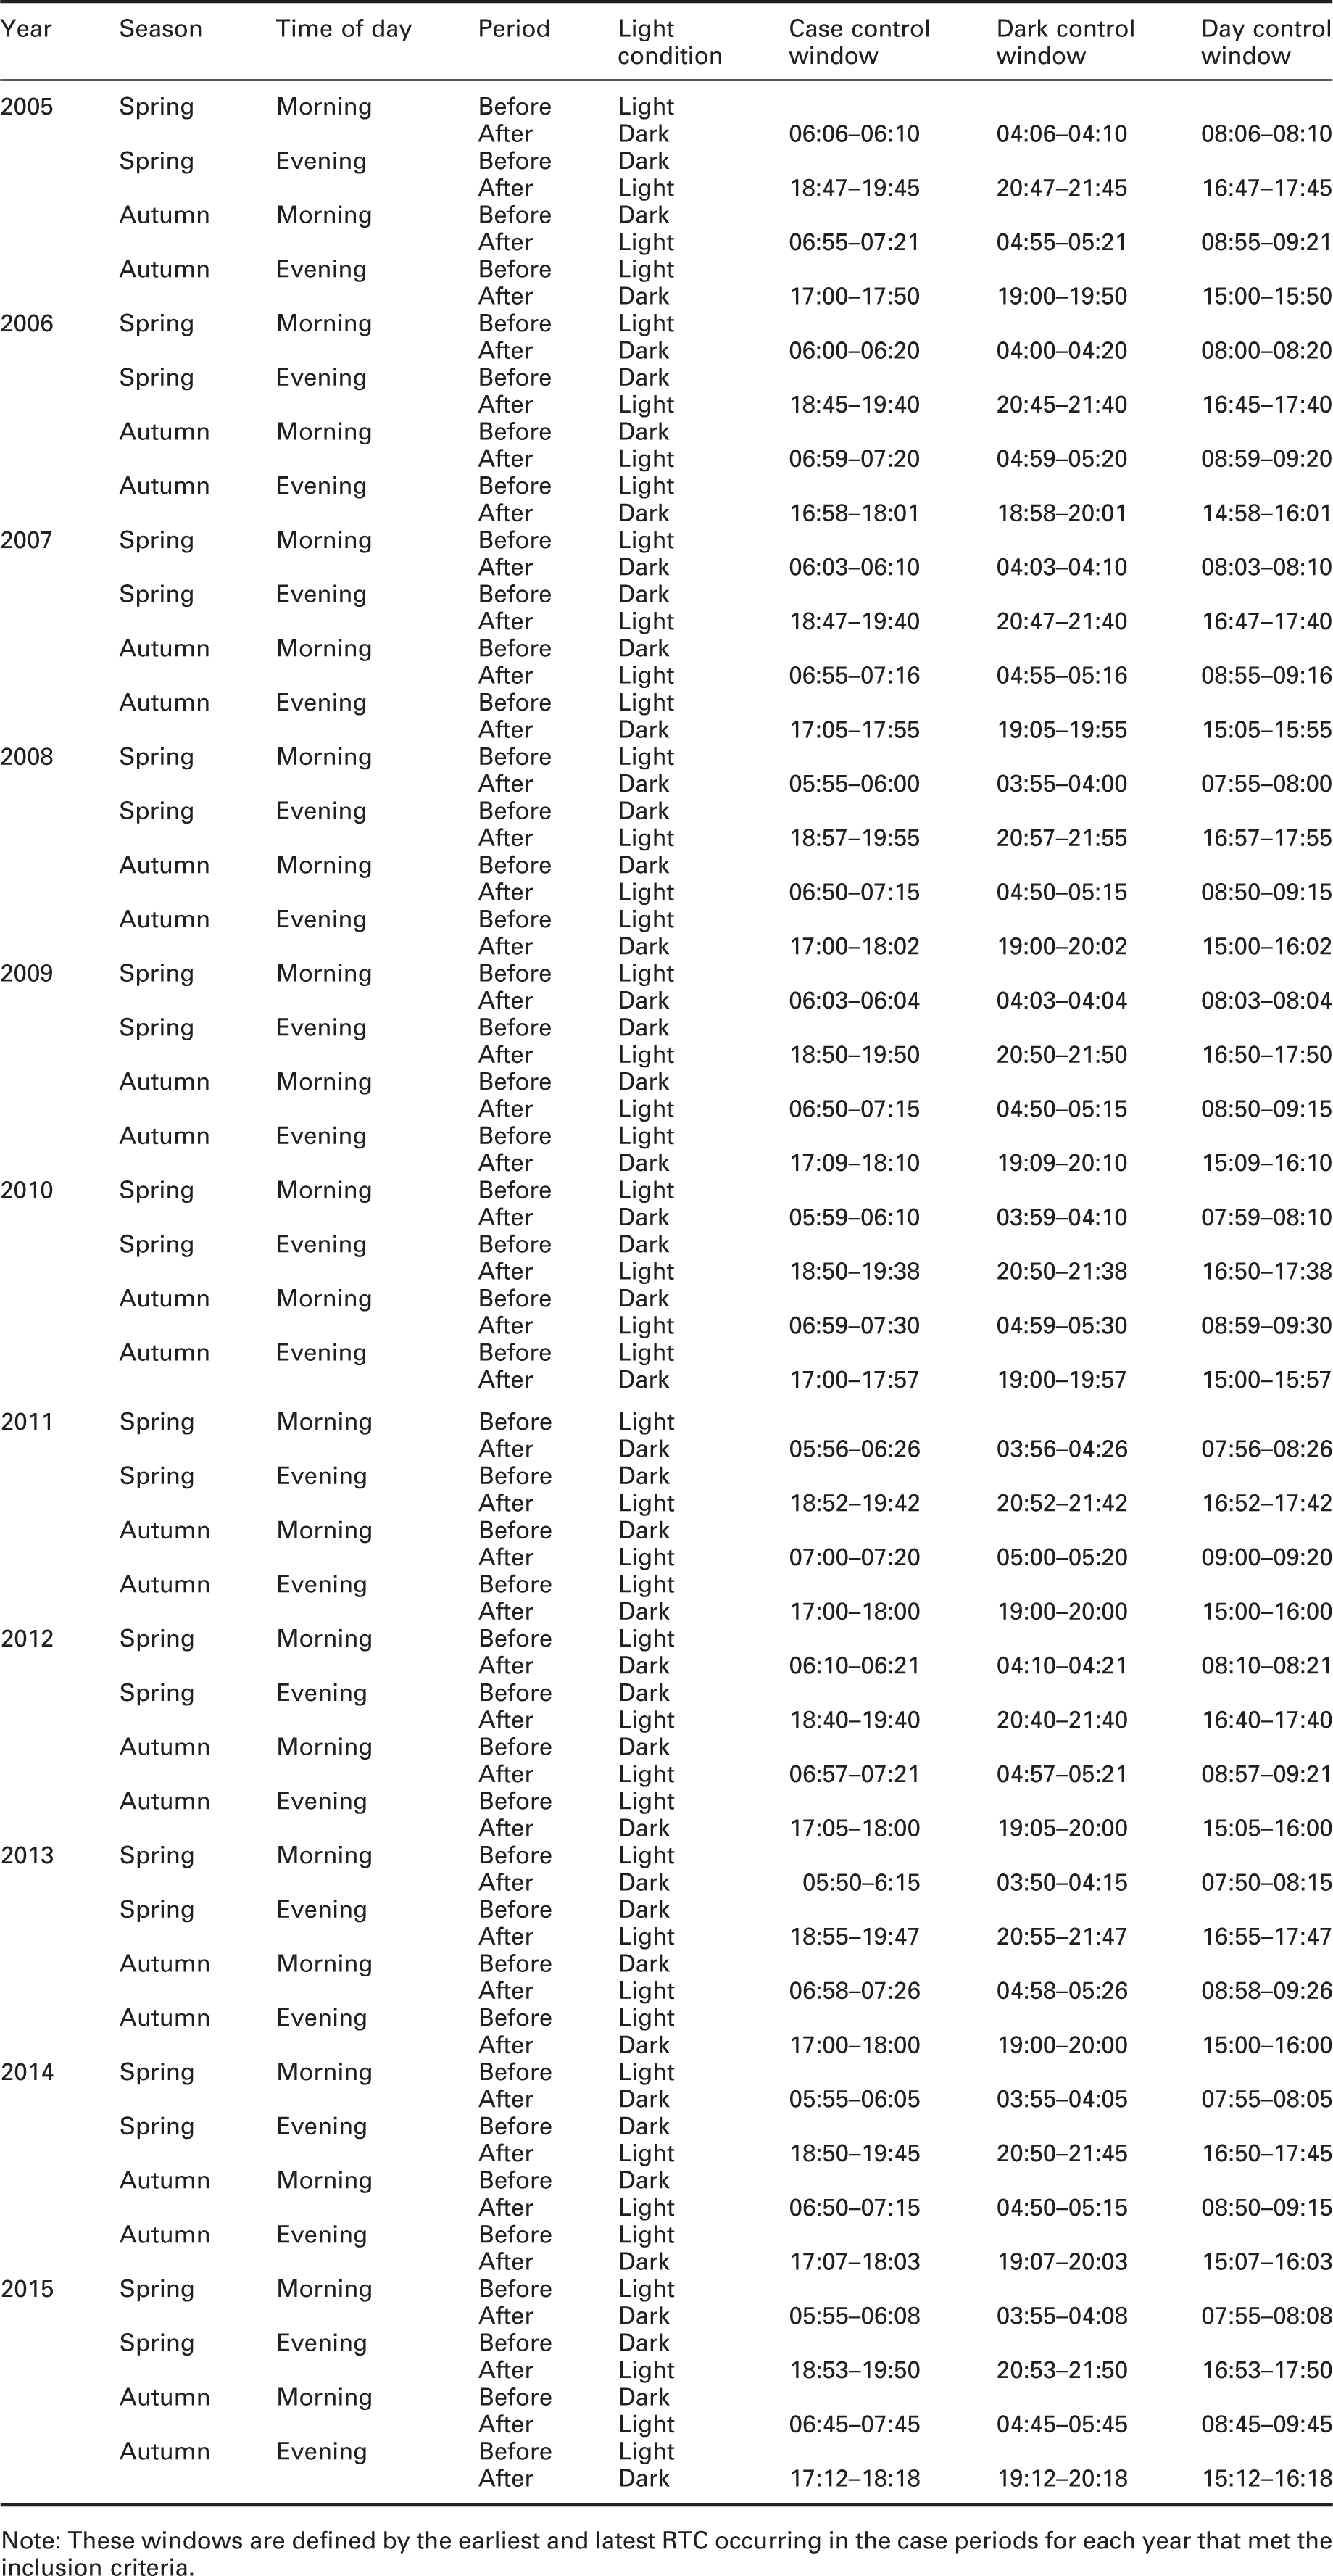
Note: These windows are defined by the earliest and latest RTC occurring in the case periods for each year that met the inclusion criteria.
Footnotes
Declaration of conflicting interests
The authors declared no potential conflicts of interest with respect to the research, authorship, and/or publication of this article.
Funding
The authors disclosed receipt of the following financial support for the research, authorship, and/or publication of this article: This work was carried out with support from the Engineering and Physical Sciences Research Council (EPSRC) grant number EP/S004009/1.