
Abstract
Presently, luminance distribution measurement devices, using High Dynamic Range technology, are increasingly used as they provide a lot of relevant data related to the lit environment at once. However, the accuracy of these devices can be a concern. It is expected that the accuracy would be improved by incorporating the effect of the camera spectral responsivity and the spectral power distribution of the illuminant under which the measurements are conducted. This study introduces two optimization criteria incorporating these aspects to improve the spectral match and the performance of luminance distribution measurement devices. Both criteria are tested in a theoretical model and in practical measurements using two cameras and three illuminants: LED, halogen and fluorescent. Both methodologies support the hypothesis that the conventional method to determine the luminance introduces spectral mismatches that can be limited by optimizing relative to the spectral responsivity of the camera. Additionally, substantial evidence was found, by both the theoretical model and the validation measurements, that the spectral power distribution of the illuminant also has an effect on the performance.
1. Introduction
In the past, general lighting was typically measured using illuminance-based devices because it is easy to measure. However, with technological advances, luminance-based measurement devices are gaining more popularity, as luminance is closely related to the human visual perception of brightness. 1 In addition, the luminance distribution contains information on multiple lighting quality aspects such as the distribution, directionality, dynamics of light and glare. 2 Furthermore, daylight simulations can benefit from the implementation of actual measured sky luminance distributions 3 instead of generic sky models. 4 Moreover, an increasing number of automated daylight systems are implemented in the built environment. These kind of systems can benefit from the actual and real luminance distributions, capturing the environment and the fast variations of daylight, to optimize user comfort and energy performance in a closed loop control system.5,6
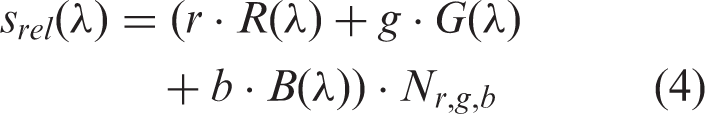
It has been shown that the luminance distribution can be measured with camera systems,6–10 using the floating point Red Green Blue (RGB) values of High Dynamic Range (HDR) images.
11
The HDR technology is essential as it is able, in contrast to standard 8-bit images, to capture high luminance ranges. To calculate the luminance, the RGB colour space is generally converted to the XYZ colour space because the CIE XYZ colour space has been developed such that the colour matching function
Generally, the standard Red Green Blue (sRGB) colour space is assumed because this colour space is used in most applications such as internet and printing applications. 11 This assumption means that this colour space is expected to provide a reasonable approximation of the camera sensor's spectral responsivity;7,15 however, Ramanath et al. 17 states that ‘the data captured by the sensor is in the colour space of the camera and has little to do with colorimetric (human) values’. Moreover, Wu et al. 18 indicate that the spectral responsivity of the camera can have a severe disparity with the RGB colour space as manufacturers aim to achieve compelling colours. The sRGB colour space is a rendered or output-referred colour space designed for an output medium,11,17 while HDR images are scene-referred images because the pixels are directly related to the radiance of the captured scene 11 . An HDR image cannot be displayed without tone-mapping, which can be considered the transformation of a scene referred to an output-referred image. 19
HDR images are generally formed by merging multiple output-referred images. The commonly used HDR builder requires JPEG or Tagged Image File Format (TIFF) files with an 8-bit depth per channel. 20 During the imaging pipeline for output-referred images, multiple corrections and transformations are applied to achieve a visually appealing image 17 while losing valuable information. To account for this information loss, radiometric calibration is required which directly relates the HDR pixel values to the scene irradiance, 21 while also accounting for proprietary corrections in the image pipeline. Moreover, Lenseigne et al. 22 showed that the spectral responsivity of the HDR has large similarities, including the effect of white balancing, to the raw spectral responsivity, indicating that the colour space of the HDR image is camera dependent and not necessarily similar to the spectral sRGB responsivity.
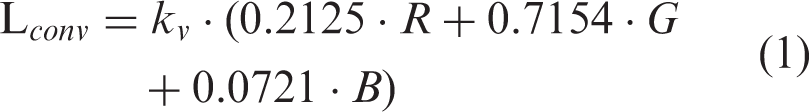
Additionally, the sRGB colour space can theoretically lead to negative RGB values, as it assumes negative sensitivities for certain wavelengths in the visible spectrum to prevent information losses, while this is physically not feasible for a three-channelled camera. Summarized, the assumption of the sRGB colour space seems not fitting. As a result, it is hypothesized that the r, g and b weighting factors based on the sRGB colour space transformation, hereafter referred to as the conventional method, will result in significant spectral mismatches.
Second, the conventional method is dependent on the spectral power distribution (SPD); the white point, one of the conversion matrix' parameters, is reliant on a standard illuminant, for sRGB this is standard illuminant D65. The white point is the chromaticity that corresponds to the image area that is perceived as white for a specific illuminant. 23 Kruisselbrink et al. 6 showed that this white point is reliant on the correlated colour temperature (CCT), and hence SPD dependent, potentially causing significant deviations in luminance values further from the CCT of the standard illuminant.
Moreover, the CIE
24
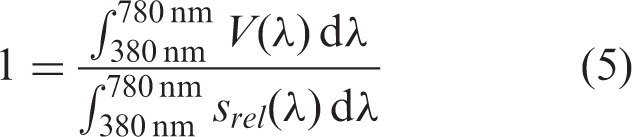
states that using a photometer with a spectral responsivity that differs from the spectral luminous efficiency function for photopic vision (
In the literature, a number of studies18,27–32 have been found that optimized a camera system to capture spectral efficiencies as accurately as possible. Borisuit et al.27,28 suggested applying an optical filter to the sensor to match the
To assess the hypotheses, the weighting coefficients are optimized according to a theoretical model introducing the spectral responsivity of two cameras and the SPDs of three illuminants: LED, halogen and fluorescent. Moreover, the theoretical model is validated with practical measurements. Based on the measurement accuracy of the theoretical model and the practical measurements, the hypotheses are assessed.
2. Theoretical model
In this section, two optimization criteria are developed for an image-based system, in addition to the conventional method, with the objective to improve the accuracy of the luminance distribution measurement. This is achieved by improving the spectral match of the cameras relative spectral responsivity by tuning the r, g and b weighting factors. Additionally, one performance indicator is proposed which helps to assess both optimization criteria and the conventional method, similarly and independently.
2.1 Conventional method
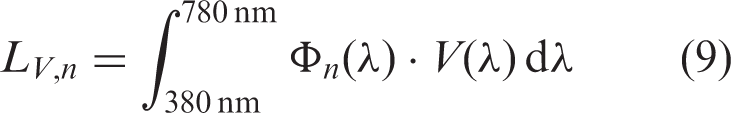
For the conventional method, the luminance (
2.2 Optimizations
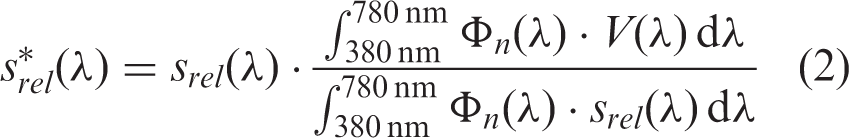
Two different optimization criteria are developed to optimize the spectral match between the relative spectral responsivity
2.2.1 Criterion 1
The first optimization criterion is based on the General
For cameras the relative spectral responsivity
To limit the spectral mismatch of
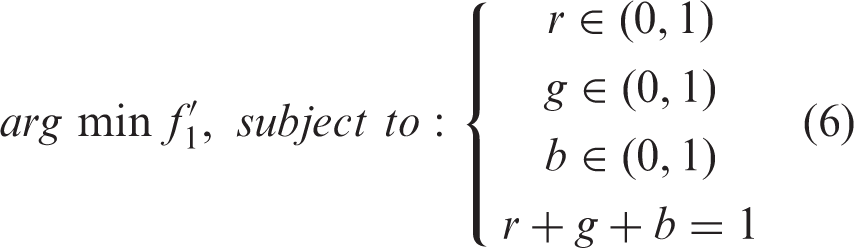
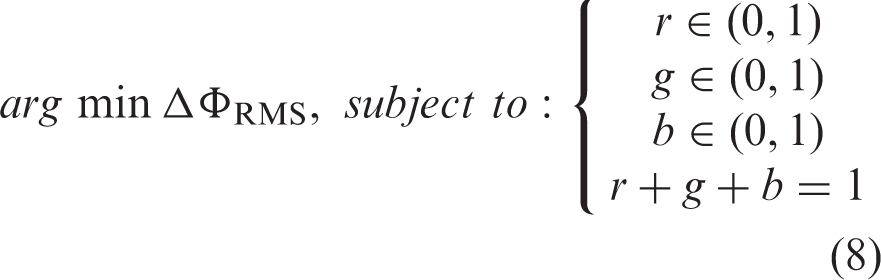
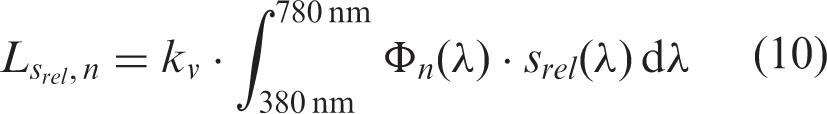
2.2.2 Criterion 2
Criterion 2 aims to match the

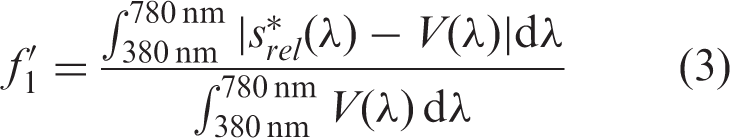
2.3 Performance indicator
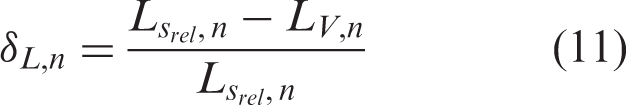
To assess criteria 1 and 2, independently, a performance indicator is introduced that defines the relative difference to the physical luminance. The relative difference in luminance
2.4. Input characteristics
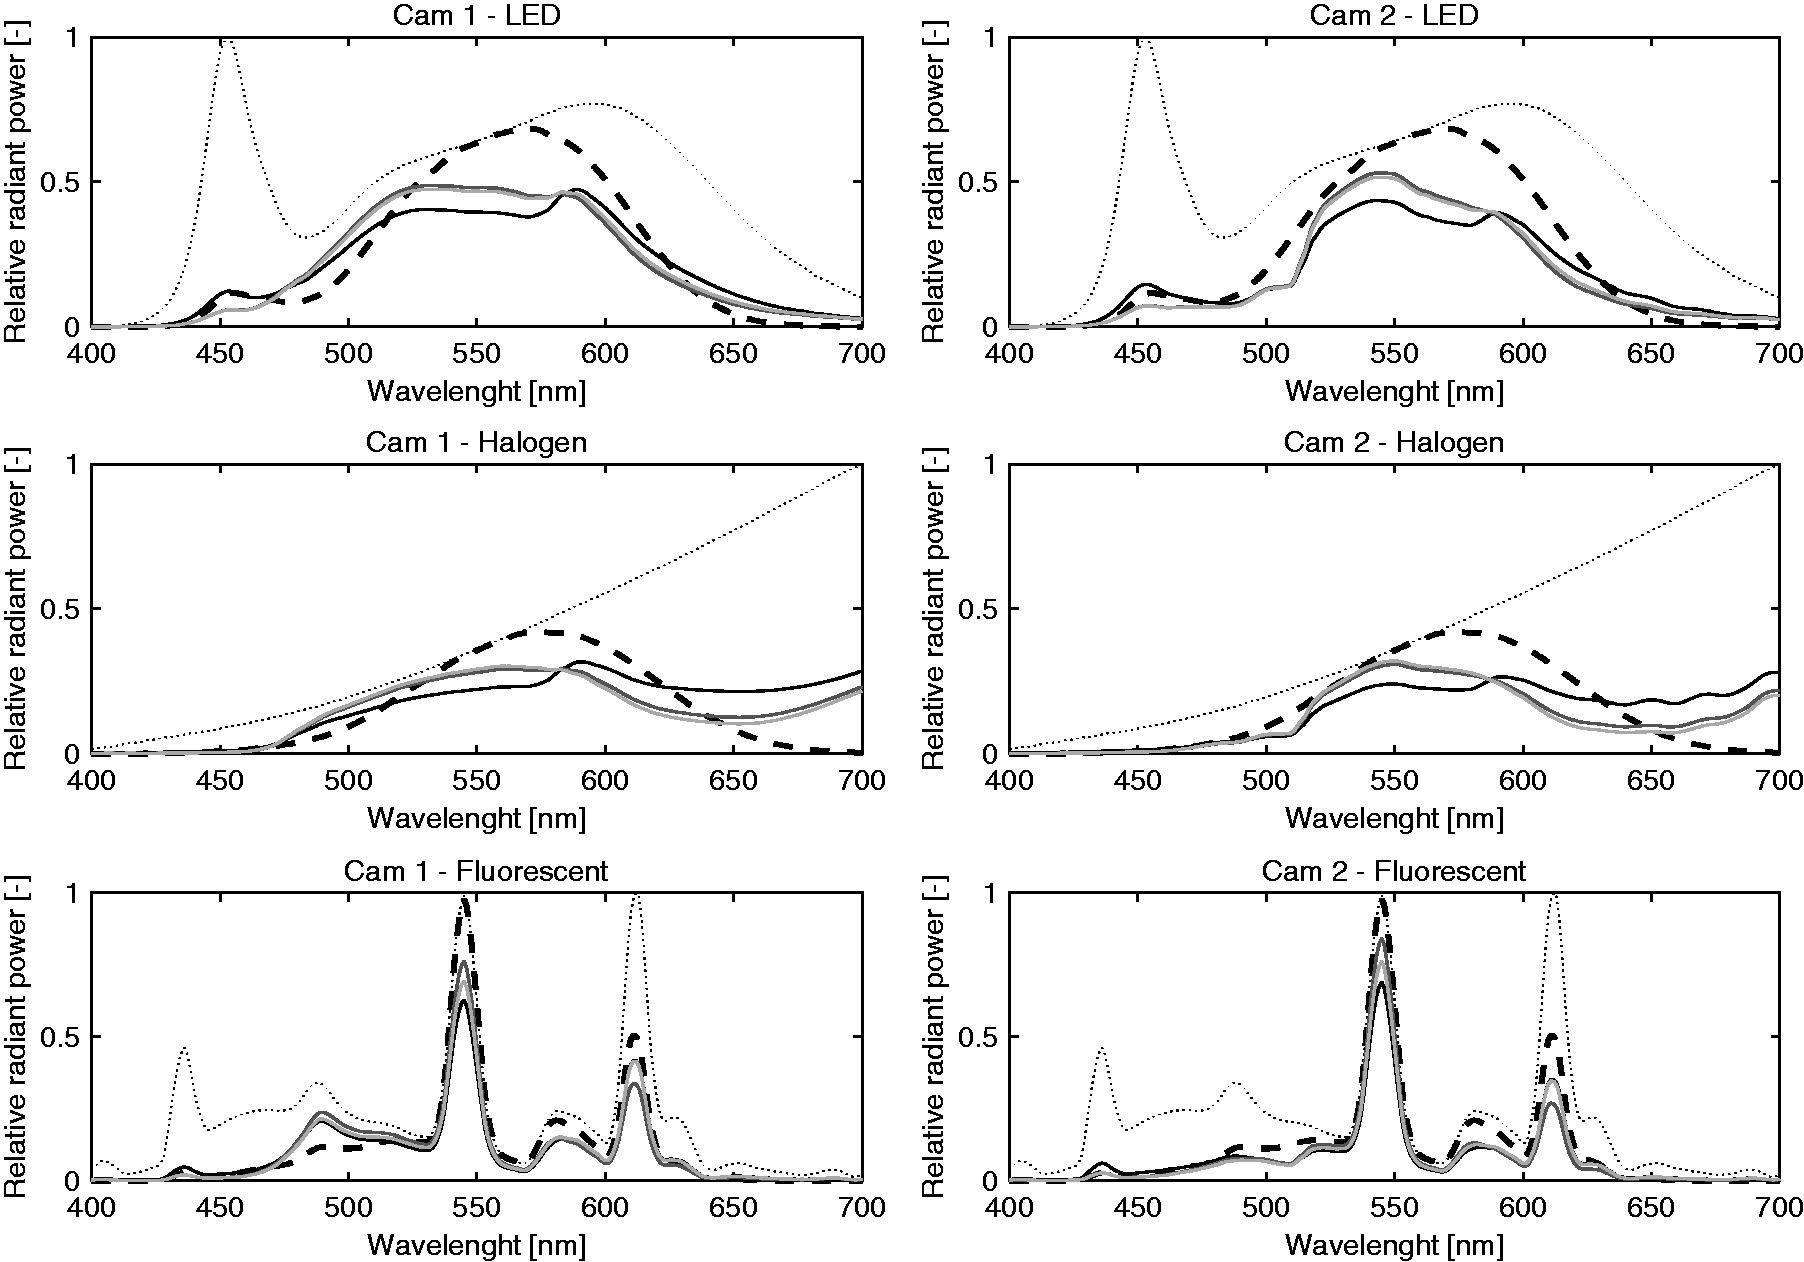
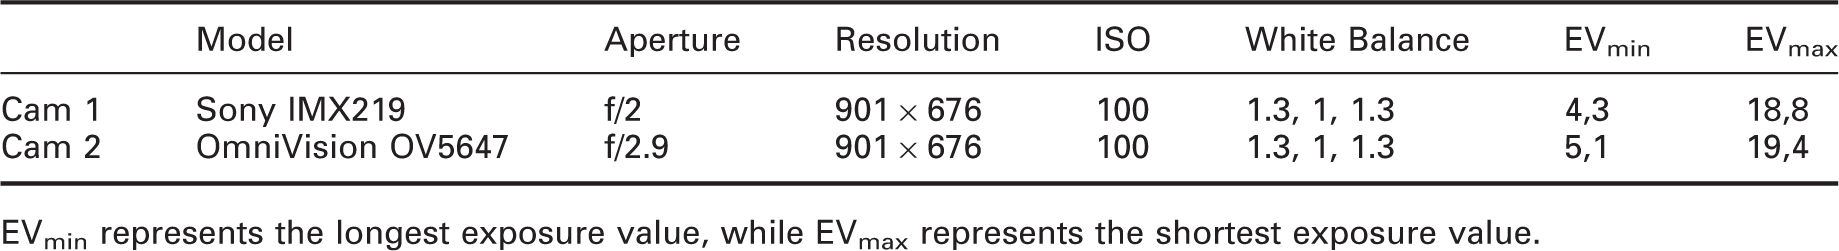
The inputs required for the optimizations are the spectral responsivity of a camera for the R, G and B channels and the SPD of the respective illuminant. In this research, optimizations were performed for two different cameras, the Sony IMX219 (Cam 1) and the OmniVision OV5647 (Cam 2), respectively, with known spectral responsivities in the range of 400 nm to 700 nm with 1 nm increments originating from Koen Hufkens
34
as shown in Figure 1. Additionally, three different illuminants; LED ( Spectral responsivities of the R (solid), G (dashed) and B (dotted) channel for Cam 1 and Cam 2 including the white balancing. Moreover, it indicates the spectral content of the illuminants used, the LED (solid), halogen (dashed) and fluorescent (dotted) SPDs, respectively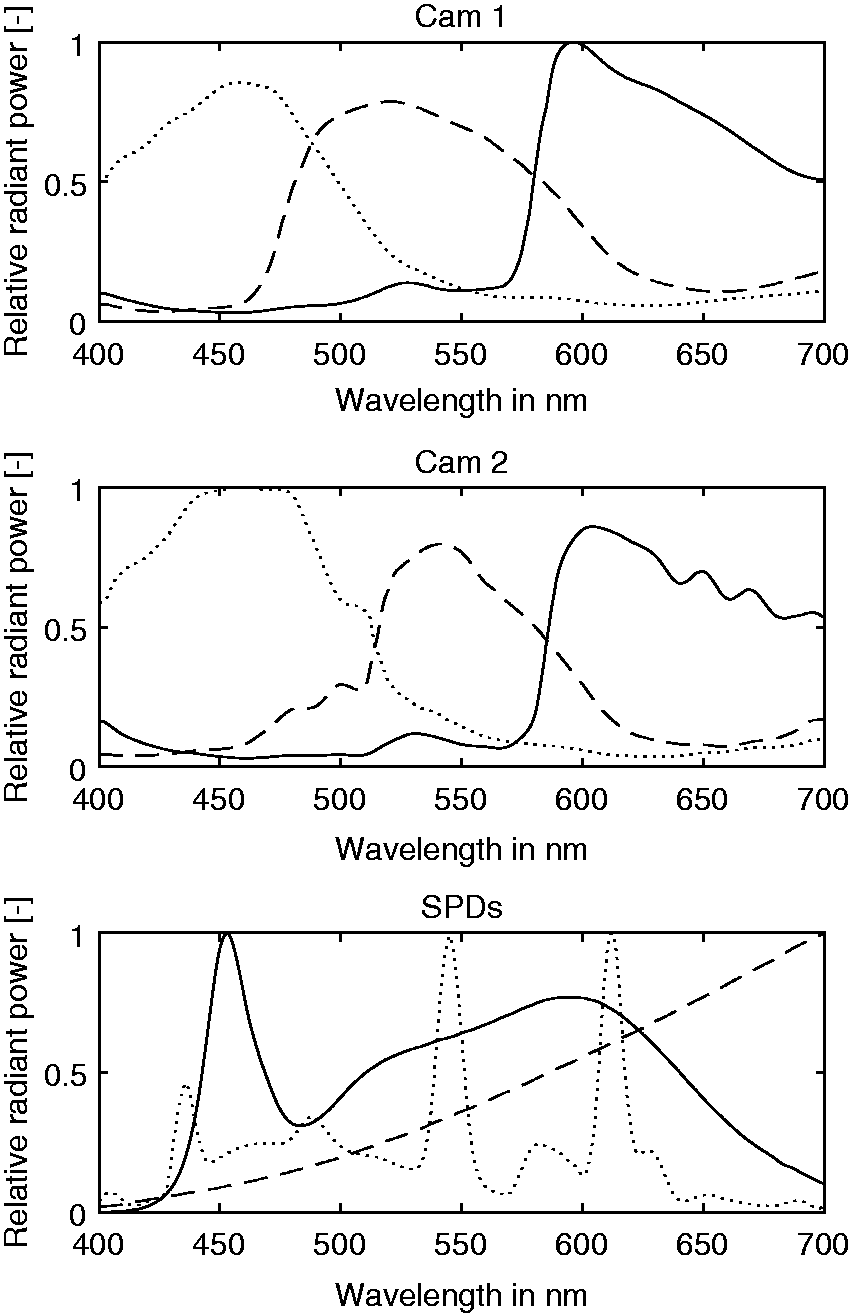
3. Method
To validate the previously described model, measurements were conducted with Cam 1 and Cam 2 under the exact same SPDs. Therefore, luminance distribution measurements were conducted with Cam 1 and Cam 2, while simultaneously point luminance measurements were conducted as a reference. The luminance, using the cameras, was calculated according to the conventional method, theoretical optimization of criterion 1 and theoretical optimization of criterion 2. Eventually, the performance of the methodologies was compared with the point luminance measurements according to equation (11).
3.1 Measurement setup
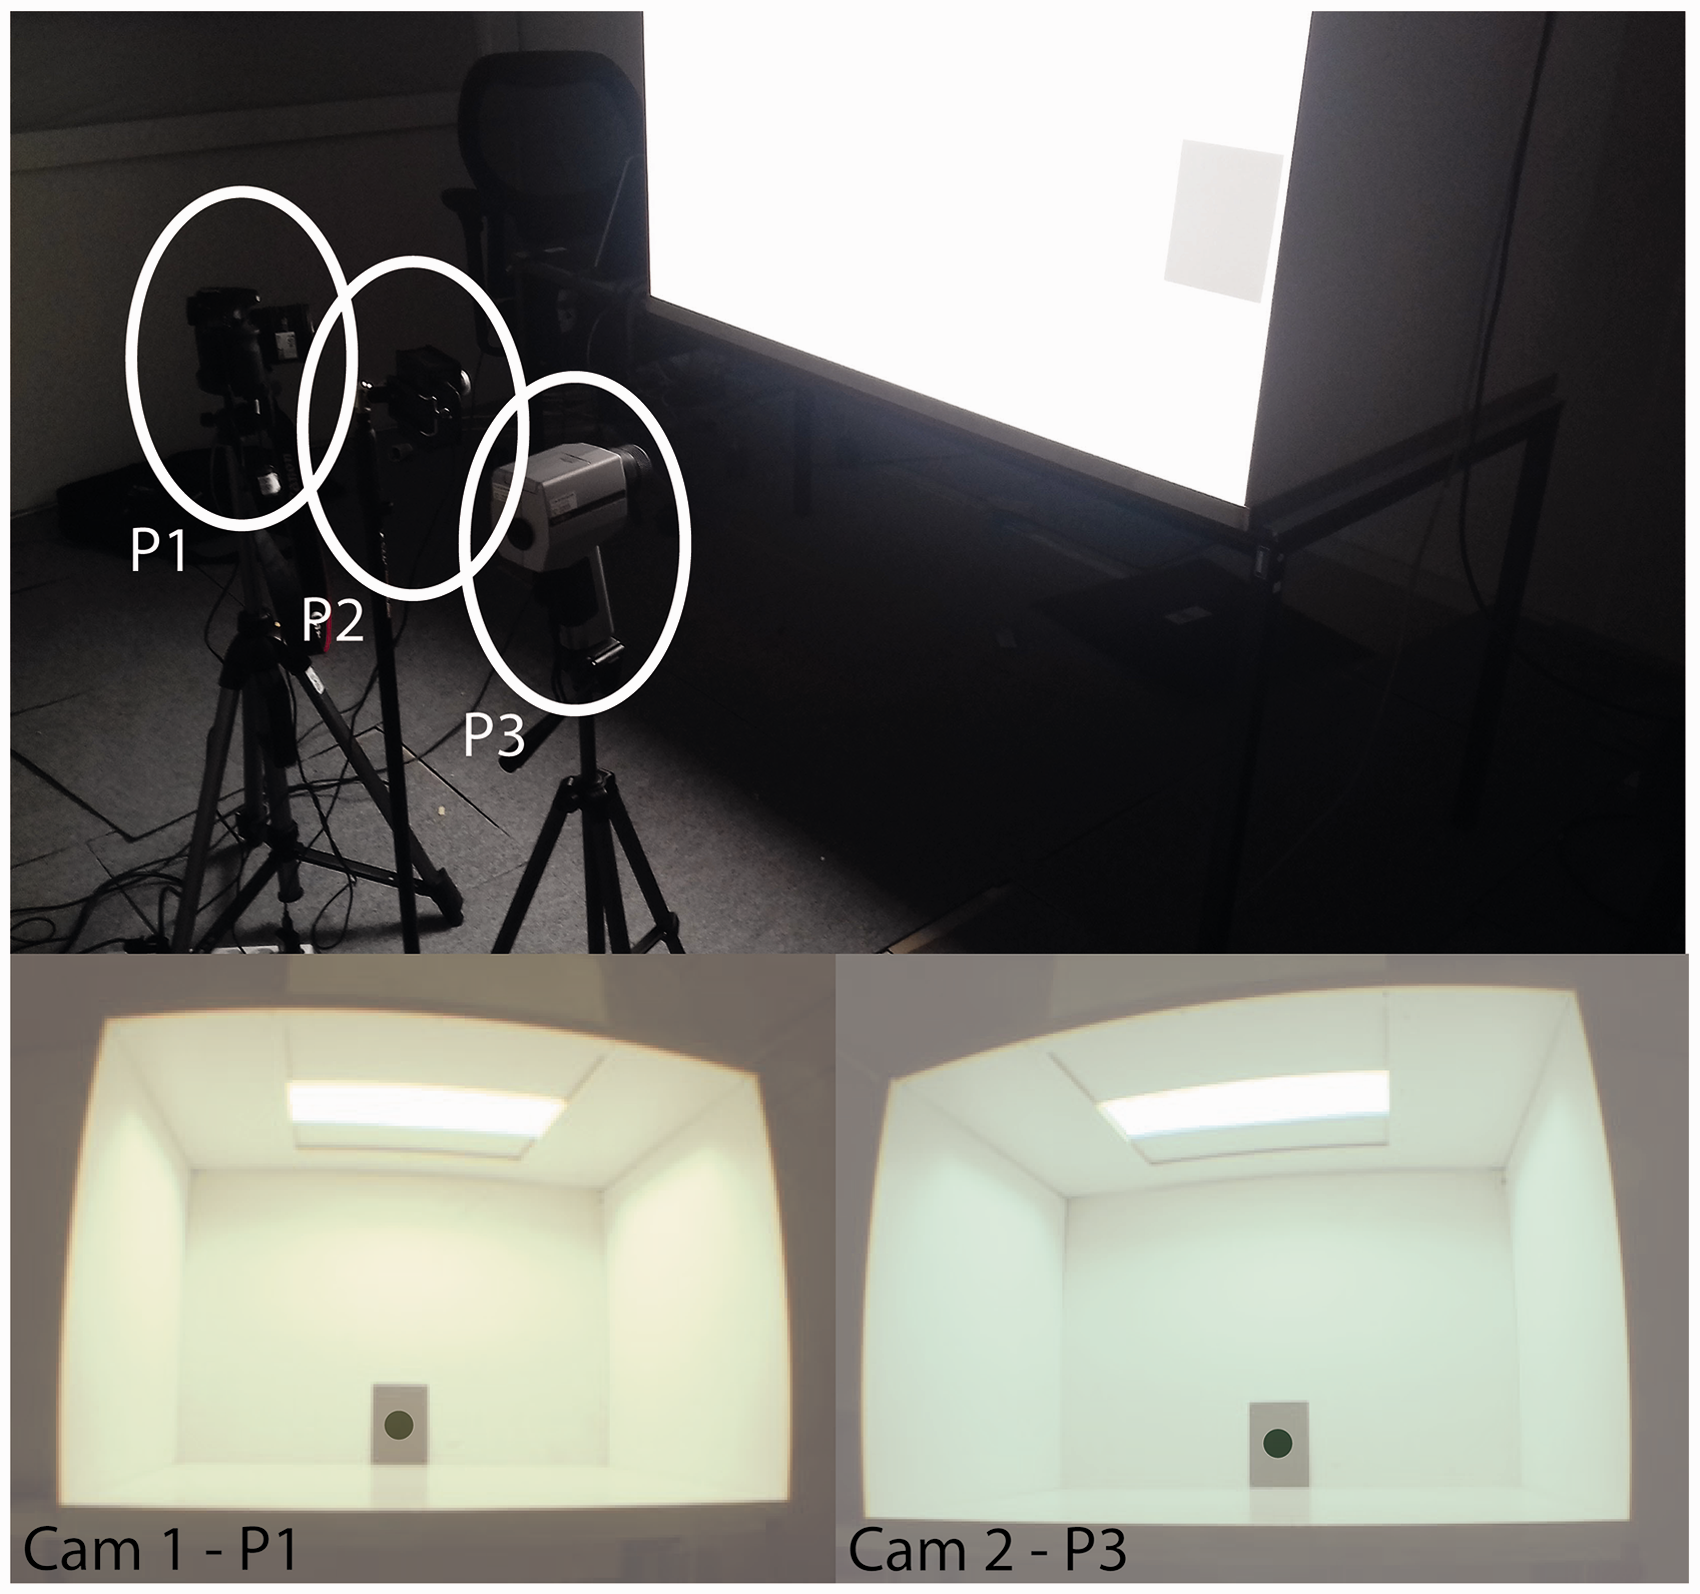
The measurements were conducted in a dark windowless room (4.4 m × 3.6 m × 2.7 m) in which a lightbox was placed. The lightbox, measuring 1.2 m wide, 0.8 m deep and 0.8 m high, with a white painted interior (
To indicate the effect of the illuminant's SPD, the luminance should be measured with a minimum of spectral disruptions to preserve the original SPD. Therefore, 10 grey samples were applied because it is not possible to measure the luminance of the illuminant directly. The targets were successively placed at the back wall in the middle of the lightbox. Grey targets have a relative uniform spectral reflectance; by applying 10 different samples, we intended to limit the effect of the imperfect uniform reflectances. The reflectances of these samples were 0.12, 0.18, 0.26, 0.28, 0.38, 0.41, 0.43, 0.74, 0.90 and 0.93, respectively.
Point luminance measurements were conducted with a Konica Minolta LS-100 luminance meter with an accuracy of ±2% and a general Measurement setup with the sample in red. P1–P3 represent the measurement locations of the three devices Measurement setup with three measurement positions aligned. The bottom images show the relevant part of the HDR images at P1 and P3 for a fluorescent illuminant, the dark area represent the applied luminance masks The relative spectral sensitivity of camera 1 and 2 weighted by the SPD (dotted) of the LED, halogen and fluorescent illuminants for the theoretical conventional method (black), criterion 1 (grey), criterion 2 (light grey) and perfect Fixed camera settings for Cam 1 and Cam 2 EVmin represents the longest exposure value, while EVmax represents the shortest exposure value.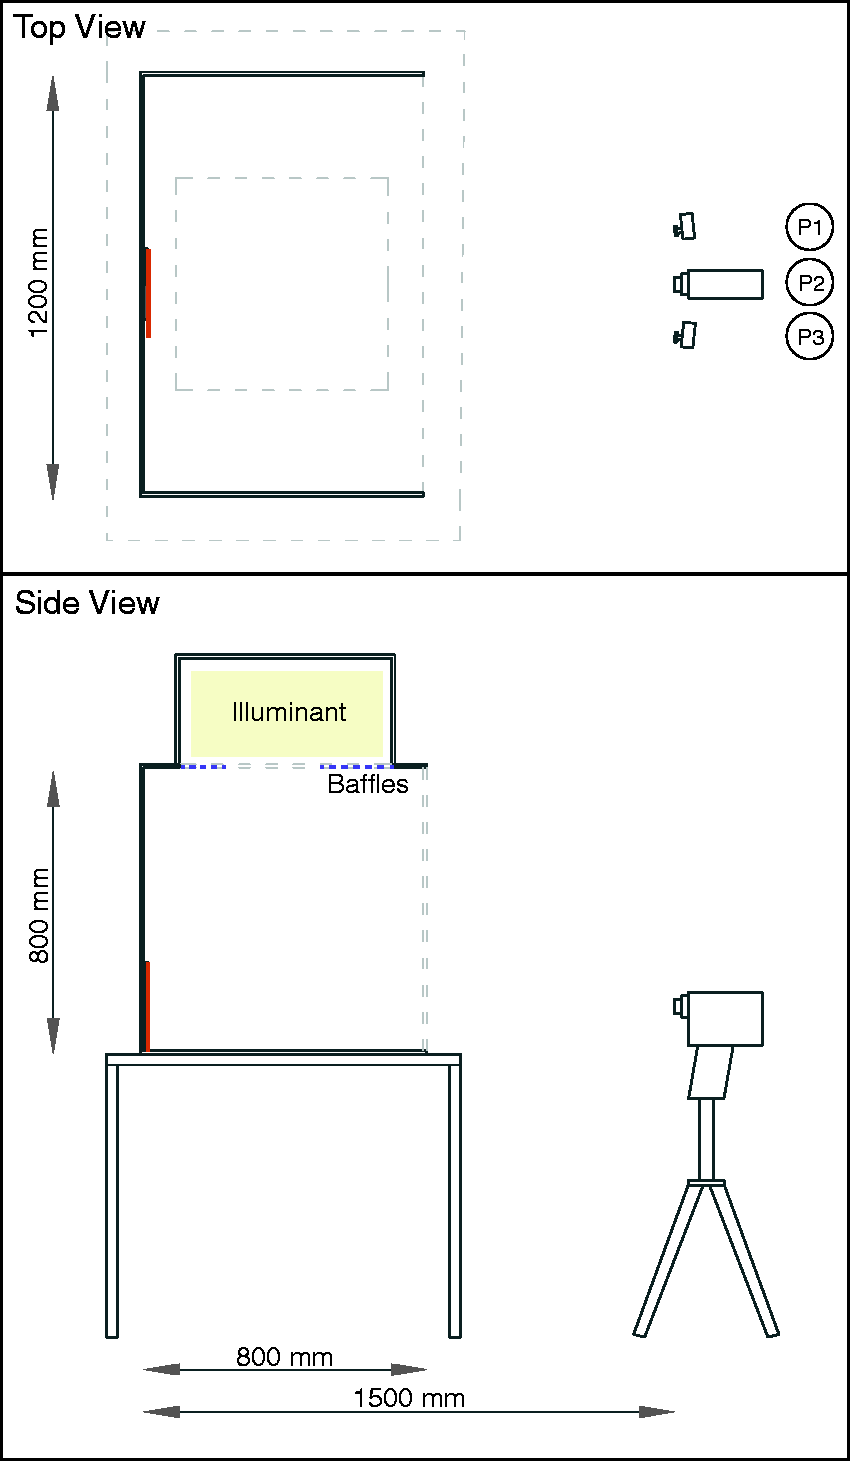
3.2 Protocol
In total, 90 measurements were simultaneously conducted for all three devices. The measurements were conducted simultaneously because some minor variations were exhibited during the measurements with the illuminance spectrophotometer for the halogen illuminant mainly. Three positions (P1–P3) were distinguished at 1.5 m from the sample as shown in Figures 2 and 3. To account for the potential differences between measurement positions, the equipment was rotated such that each device conducted a luminance measurement for each condition (10 samples and 3 illuminants) at all three positions. Hence, each condition was measured thrice, resulting in a total of 90 measurements.
3.3 Analysis methods
Each luminance distribution measurement provided one single HDR image applied with a luminance mask identical to the opening angle of LS-100 luminance meter (Figure 3). Based on the HDR image, the luminance was calculated for each illuminant by the conventional method and both optimizations, by applying the respective r, g and b weighting factors originating from the theoretical optimization found in Table 3. An individual photometric calibration (Section 2.3, k
v
) was applied for each camera and method (conventional, criterion 1 and criterion 2). This calibration factor was developed such that average measured results are equal to the average expected results for the conventional method, criterion 1 and criterion 2, respectively. Subsequently, inferential statistical methods, such as one-sided and two-sided unpaired t-tests, with a confidence interval of 95% were applied. Moreover, Lin's Concordance Correlation Coefficient (
4. Results
In this section, the results of the theoretical model, or the expected results, and the measurement results both generally indicated by the performance indicator representing the relative difference in luminance (equation (11)) are shown. Additionally, a comparison between the results, using inferential statistics, is presented.
4.1 Theoretical model
Average theoretical optimization results of the r, g and b weighting factors using LED, halogen and fluorescent illuminants
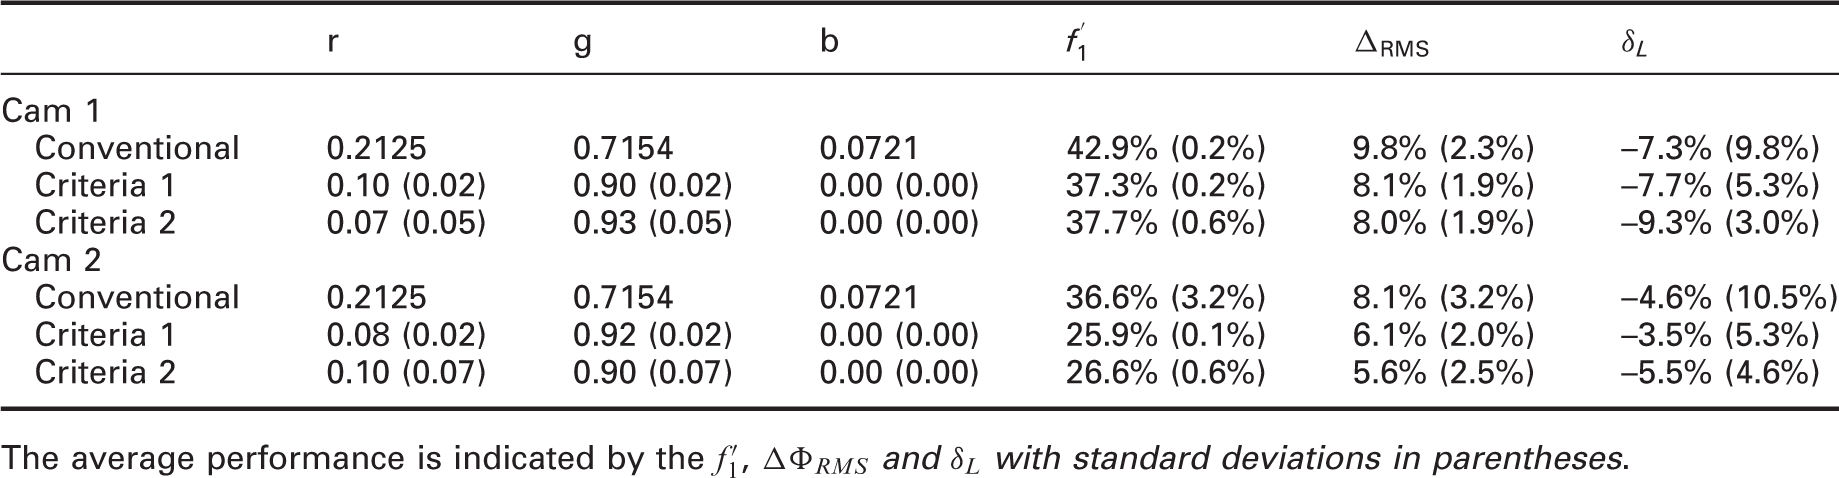
The average performance is indicated by the
The theoretical optimization results are illustrated per wavelength in Figure 4. The dashed black line highlights the weighted SPD with a perfect
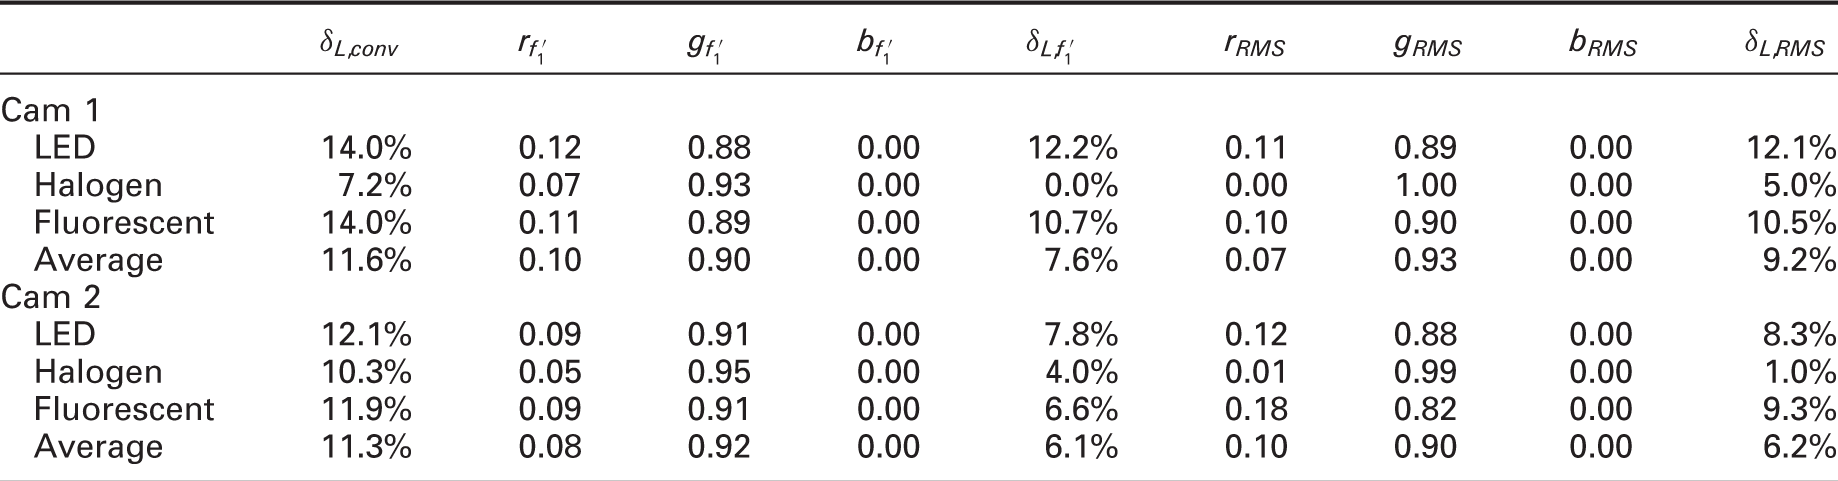
The optimization results for the individual illuminants, cameras and methods are presented in Table 3 and Figure 4. The relative spectral sensitivities of Figure 4 were achieved using the r, g and b weighting factors displayed in Table 3. The weighting factors differ significantly compared to the weighting factors of the conventional method. The main difference related to the conventional method is in the weighting factor of the blue sensitivity, which was zero for both optimizations and 0.0721 for the conventional method. Additionally, the weighting factors for the halogen illuminant are very different compared to the LED and fluorescent illuminant. In contrast to Table 2, the performance of the optimized weighting factors provided a higher accuracy indicated by a lower
4.2 Measured results
Based on the HDR images captured during the measurements, the luminance was determined for the conventional method and the optimizations. For the optimizations, the r, g and b weighting factors were originating from the theoretical optimization presented in Table 3.
Figure 5 illustrates the relative difference in luminance for the two cameras compared to the point luminance measurements conducted with the Konica Minolta LS-100. Additionally, the absolute luminances measured with the Konica Minolta LS-100 are displayed. Figure 5 shows that the relative difference in performance between the three different methods was relatively constant for the 10 samples. Only Cam 2 exhibited substantial differences in performance between samples under the fluorescent illuminant. Moreover, the relative differences found between illuminants and cameras were substantially different. Both luminance cameras exhibited the lowest performance for the halogen illuminant; furthermore, the optimizations even had a negative effect on the relative difference in luminance for the halogen illuminant compared to the conventional method. The other illuminants, except the fluorescent illuminant for Cam 2, show an improved performance.
The relative difference in luminance from camera-based luminance measurements in the lightbox compared to point luminance measurements. Results are averaged based on the three different measurement orientations and ranked according to the spectral reflectance (low to high). The black, dark grey and light grey bars correspond to the conventional method, criterion 1 and criterion 2, respectively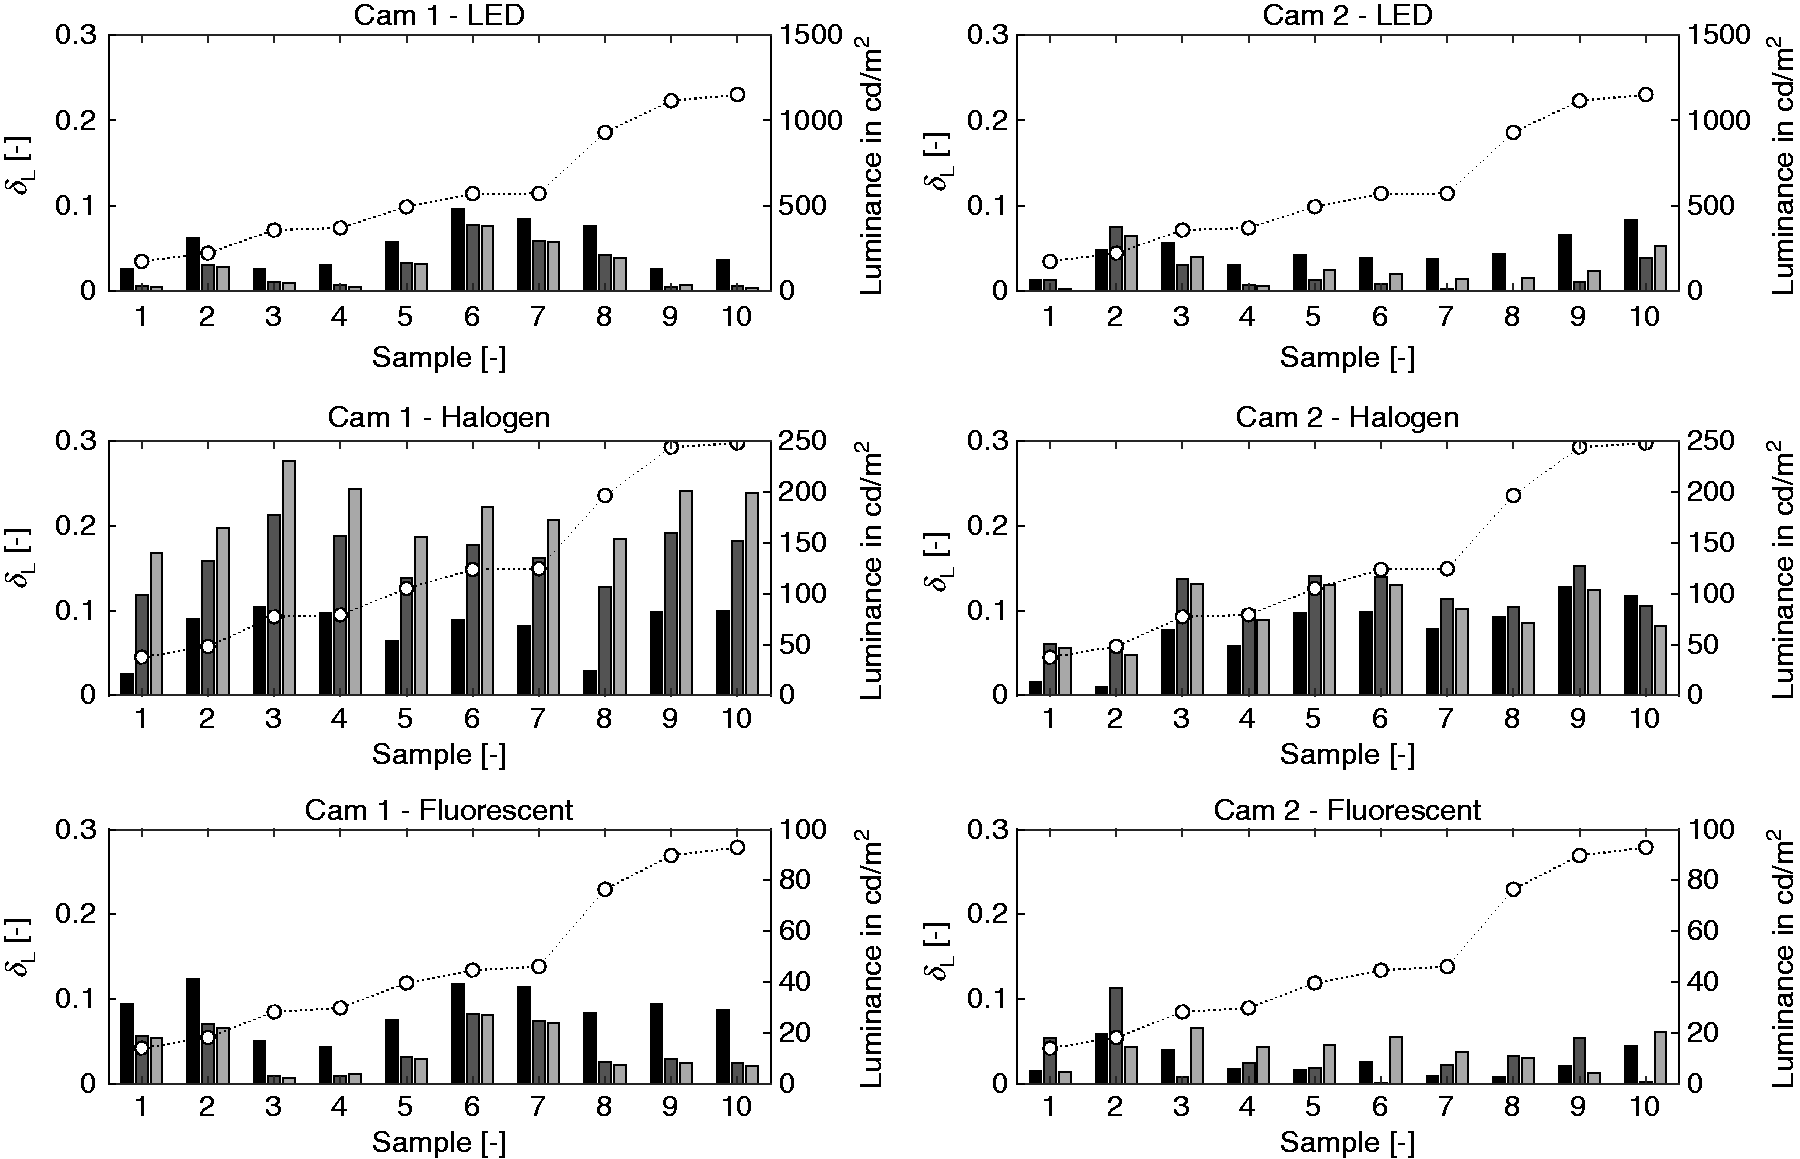
The average performance of the optimizations for the illuminants and cameras, including error bars representing the standard deviation, are shown in Figure 6. It shows that the results for the LED and fluorescent illuminants, for both cameras, were rather similar. A small improvement of Error bar plots of the average 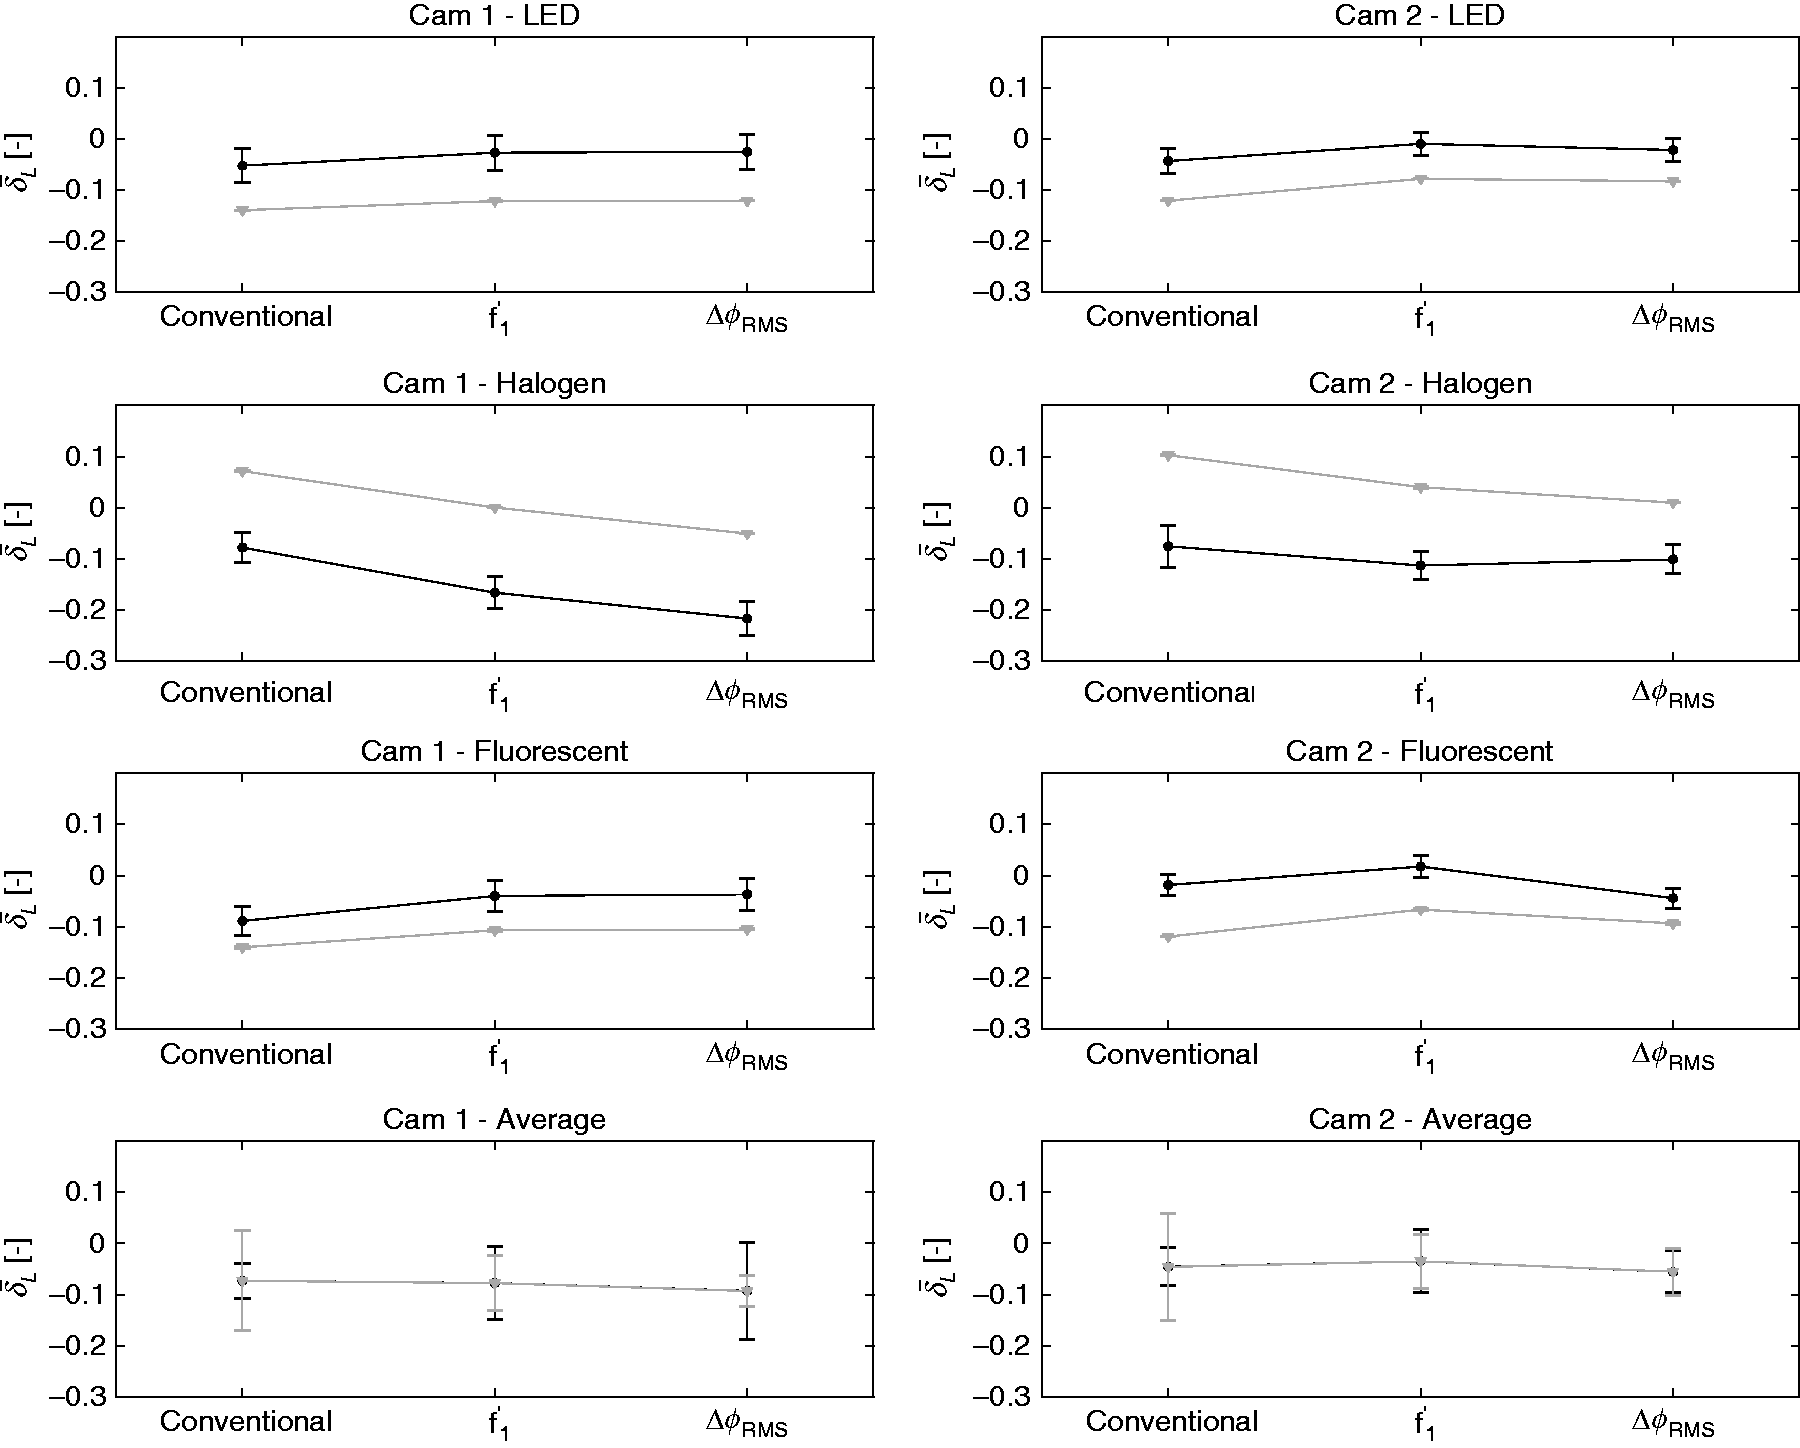
4.3 Comparison
Based on the theoretical method introduced in Section 2, we were able to form expectations of our measurement results. However, the expected results, as indicated in Figure 6 (grey), did not exactly match the measured results. Based on a t-test, it was also found that the measured The relative difference in luminance between the conventional method and optimizations according to the theoretical model and measurements. The dark grey bars represent optimization criteria 1, whereas the light grey bars represent optimization criteria 2. Error bars describing the standard deviation are added to elaborate on the spread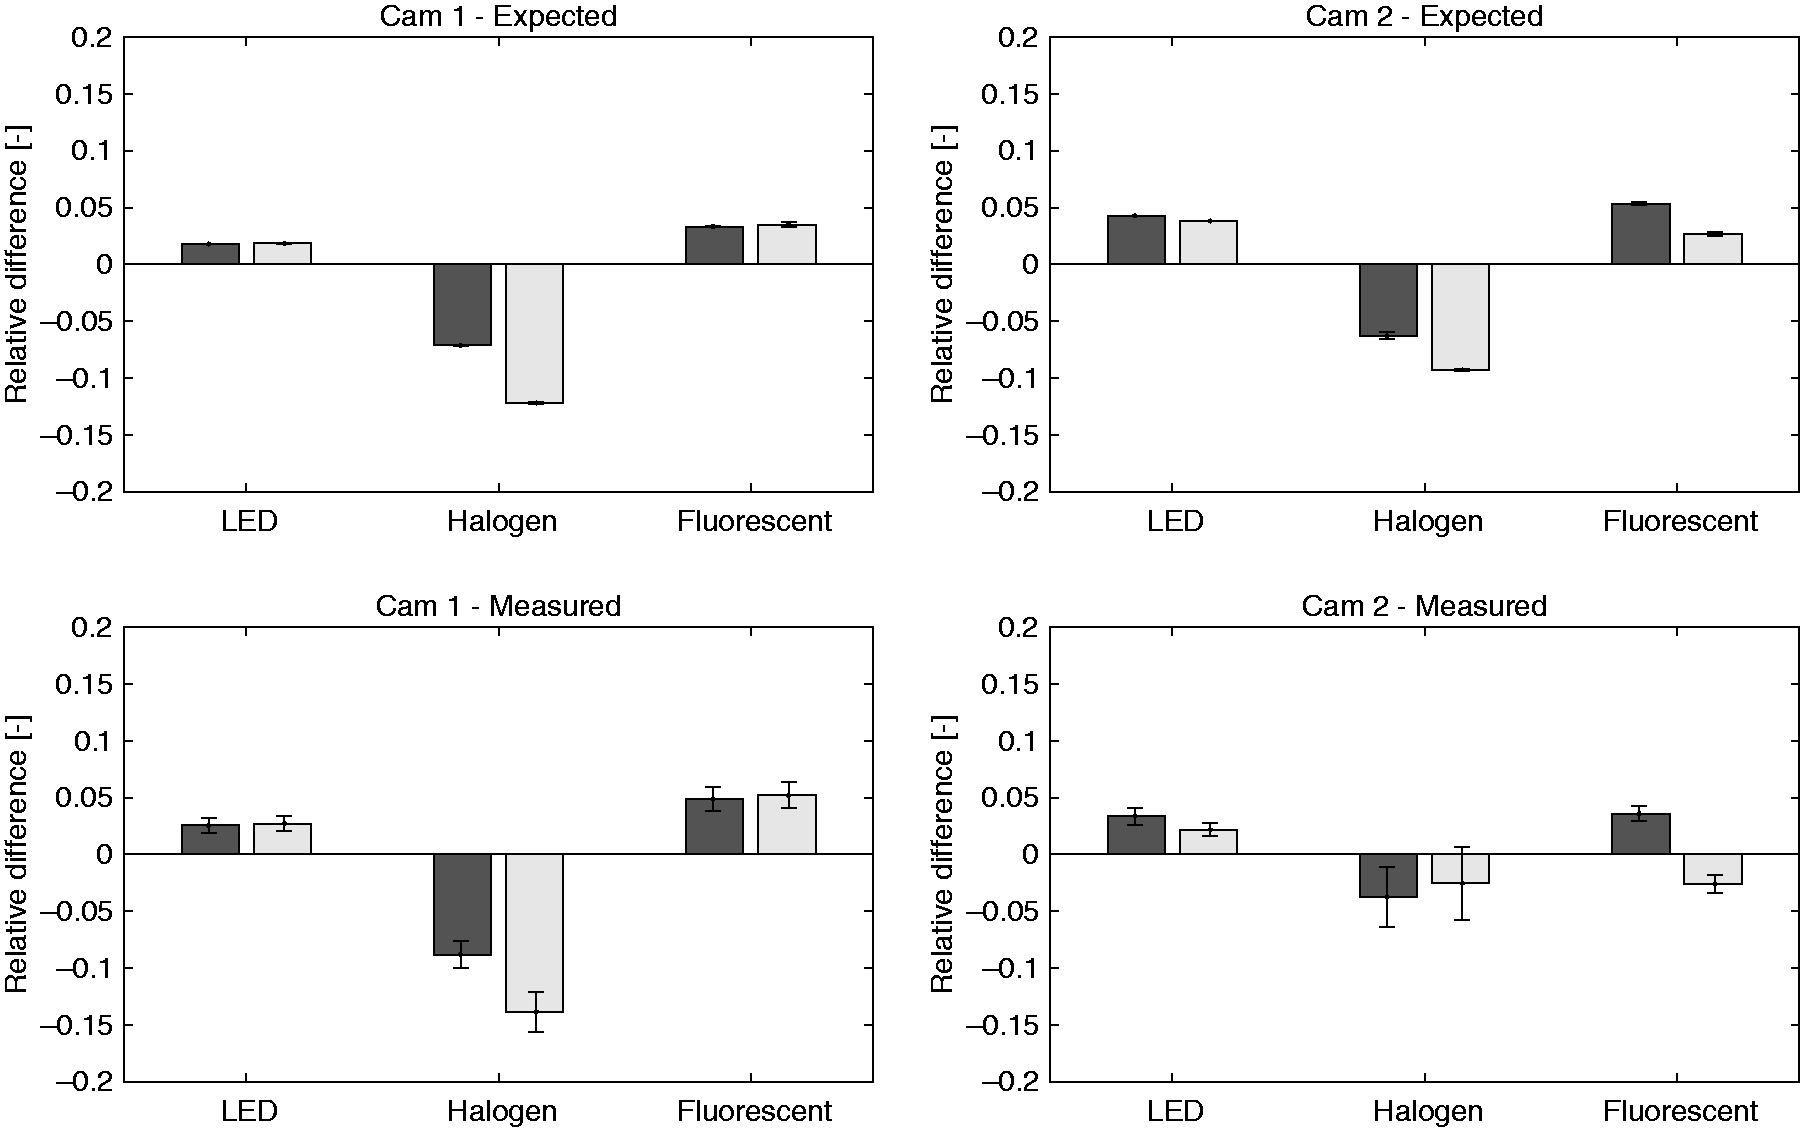
Expected absolute results, individually represented for the relative difference in luminance according to the conventional method (
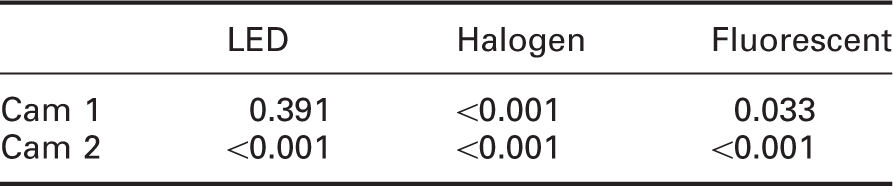
p-Values of a one-sided t-test (X–Y<0) with X as the conventional method and Y as criteria n as measured in the lightbox with a confidence interval of 95%
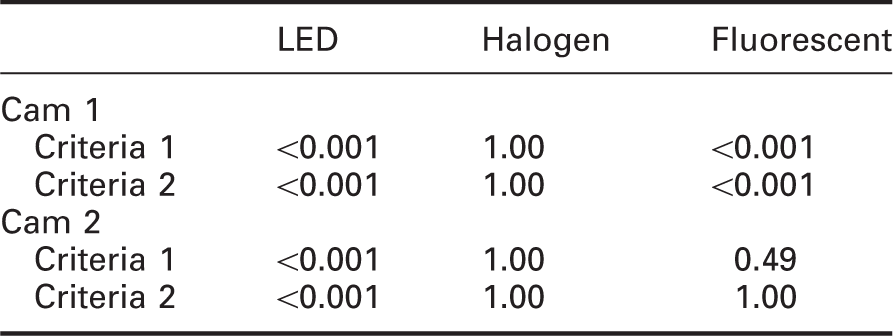
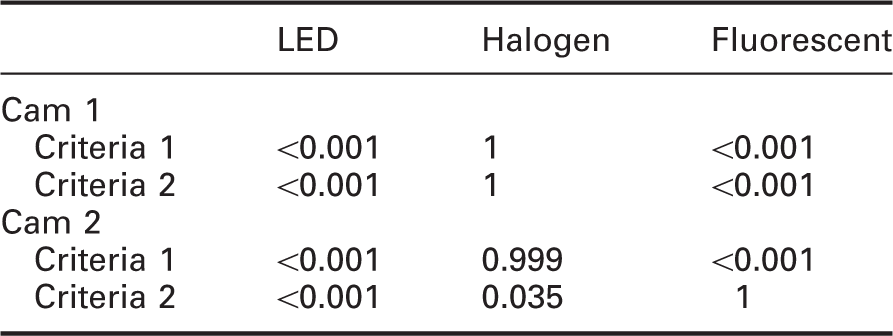
Using an alternative approach, the difference between optimization methods and the conventional method were analysed using Lin's Concordance Correlation Coefficient, and the result is presented in Figure 8. Nearly all combinations had an almost perfect (<0.99) agreement with the reference measurement. However, only a substantial (<0.95–0.99) agreement was achieved for all conventional methods for Cam 1 and all measurements with the halogen illuminant. A t-test was implemented to test whether the correlation ( Lin's concordance correlation coefficient of cameras 1 and 2 relative to the three illuminants and the conventional method, criterion 1 and criterion 2 p-Values of a one-sided t-test (X–Y>0) with X as 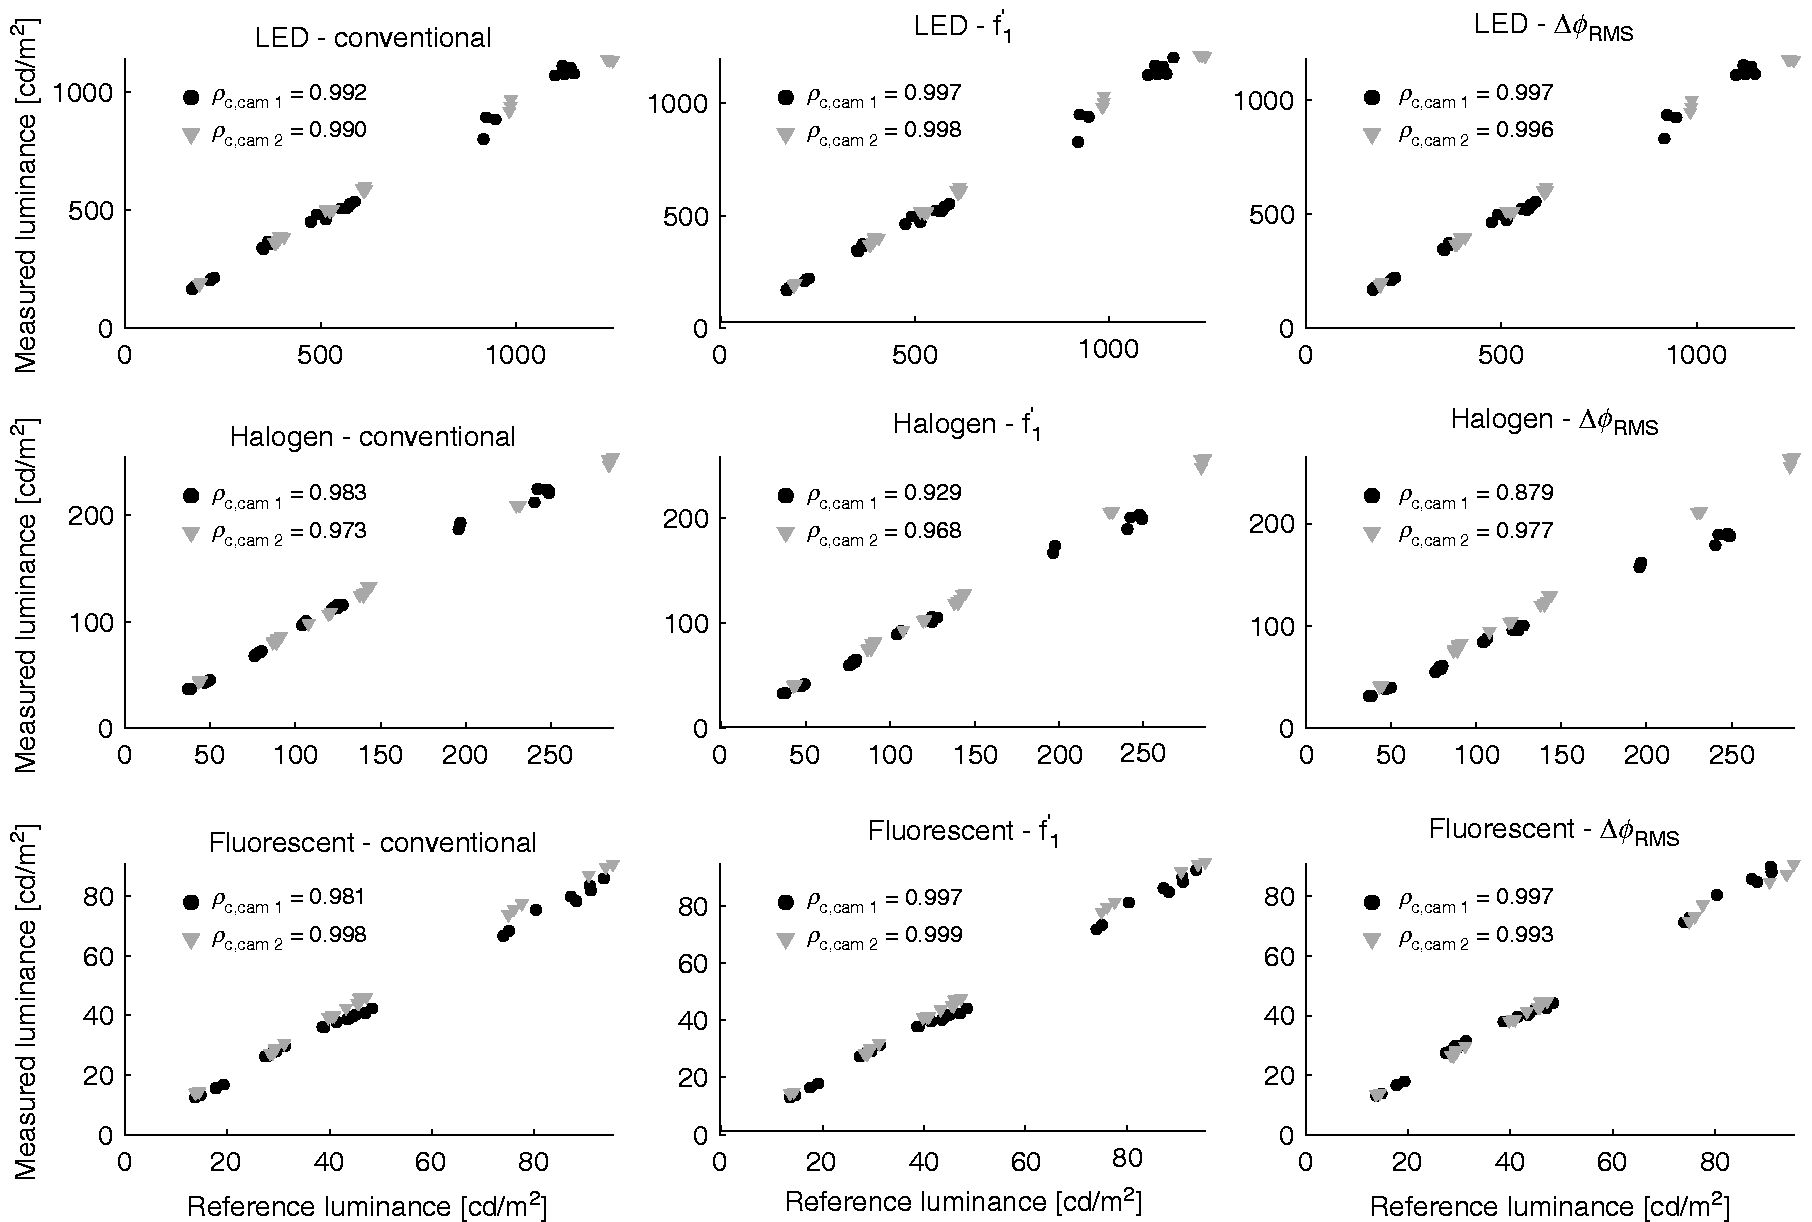
p-Values of a two-sided t-test (
p-Values of a two-sided t-test (
5. Discussion
The study showed that image-based luminance distribution measurements can be improved by optimizing the r, g, and b weighting coefficients based on the camera's spectral responsivity and the SPD of the respective illuminant. It was hypothesized that both these aspects could improve the accuracy of the luminance distribution relative to the conventional method. This was tested using a theoretical model and validated with measurements.
The results of the theoretical model showed that the conventional method introduces significant spectral mismatches up to approximately 40% (Table 2), as was also indicated by Wu et al.
18
. The DIN 5032 Part 736 distinguishes four performance categories, classes L, A, B and C, for the general spectral
However, the results, per illuminant, shown in Table 3, showed that the optimized r, g, and b weighting factors based on the SPD improved the accuracy as was hypothesized. In correspondence to Geisler-Moroder and Dür
29
, the relative error, for the theoretical model, was generally higher than 5%. Table 3 also shows that for these specific cameras, the B channel is not required because especially the G channels show large similarities to the
The measurement results also showed differences between the two cameras. For instance, Cam 2 had lower relative differences in luminance compared to Cam 1, for the conventional method. This indicated that the spectral mismatch of Cam 2 was lower than Cam 1, as shown by the results of the theoretical model (37%–43%, Table 2). Apparently, the spectral responsivity of Cam 2 was more similar to sRGB responsivity than Cam 1; nevertheless, the errors that were introduced are still substantial. During the optimizations, by incorporating the spectral responsivity of the camera, lower spectral mismatches were achieved, always resulting in improved accuracies. The lowest spectral mismatch corresponds to the highest performance (Table 2). Hence, there is strong evidence that the conventional method introduces spectral mismatches at the expense of the measurement accuracy.
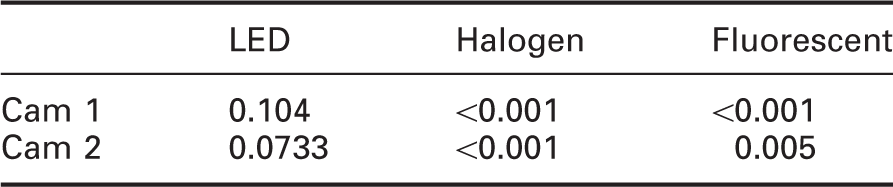
The measurement results showed that the performance of Cam 1 and Cam 2 under the LED and fluorescent illuminants were significantly improved for both illuminants (Table 4), except for Cam 2 under the fluorescent illuminant using optimization criterion 2. However, this table also indicates that the optimizations could not improve the performance of both cameras under the halogen illuminant, it even resulted in a decreased performance. However, this can be explained by methodological issues, described later in this section. In contrast to the theoretical model, there is only limited evidence to acknowledge that the SPD has an effect on the optimal r, g and b weighting factors.
Also, the measurement results, shown in Figure 5, showed some differences between criteria 1 and 2, albeit smaller than in the theoretical model. Nevertheless, the differences were generally significant (Table 6). These relative differences are in correspondence to Fliegel and Havlin 30 (10%), but significantly higher than found by Cauwerts et al. 31 who used DSLRs and an extensive calibration process. For Cam 1, criterion 1 seems to perform slightly better, aside from the halogen illuminant, while for Cam 2, criterion 2 seems to perform better.
Both the theoretical model and the practical measurements provided some evidence that both hypotheses can be accepted. However, the relative differences in luminance for these two approaches differed significantly (Table 4) against expectation. Visually (Figure 6), the trends of improvement look rather similar for the theoretical and practical method, indicating that the relative difference in luminance was shifted, for instance, due to the calibration factors applied to the practical measurements. However, inferential statistics showed that also the trend was significantly different (Figure 7). There are a number of potential explanations for the differences between the two methodologies, both at the theoretical side as well as at the practical side.
The model on which the expected results were based is a simplified model that does not account for the image pipeline. During this image pipeline, multiple corrections are introduced such as demosaicing, gamma correction and colour transformation to achieve a visually pleasing image. During the HDR building process, these corrections are partly corrected by the camera response curve. However, the camera response curve was in this case, and also typically, approximated using the algorithm by Mitsunaga and Nayar 21 using HDRgen. Approximation errors in this function can lead to both a decrease or increase relative to the expected results. Moreover, the cameras exhibited noise that might have compromised the accuracy which was not accounted for in the theoretical model. For the theoretical model, the spectral responsivities of Cam 1 and Cam 2 (Figure 1) were taken from the specification sheets. 34 The spectral responsivities of Cam 137 and Cam 210 were also measured, by third parties, using monochromators. Some differences can be found, mainly around 700 nm, the responsivities from the specification sheets are much higher. This might be caused by inconsistencies between cameras of the same make and model. For this exact reason, in best practice, the camera response curve is determined for each individual sensor. 7 However, this might also be caused due to a potentially applied infrared filter, which seems not present in the specification sheets. This can explain why large differences were found between the theoretical model and practical measurements, especially for the halogen illuminant that had a lot of energy in this area. Due to the assumed high spectral responsivity in the red area, low weighting factors were applied for the R channel. In the case of an infrared filter, this leads to an underestimation of the red light, which is exactly exhibited for the underestimated halogen in Figure 6. Therefore, we can conclude that the contradictory results for the halogen illuminant are caused by the inconsistent input instead of an inadequate optimization algorithm. After all, the theoretical model (Table 3) showed improvements for all illuminants. Consequently, when possible, it is advised to measure the spectral responsivity of the camera instead of using the specification sheets.
Moreover, for practical reasons, the measurements could not exactly replicate the theoretical model. Instead of direct measurements of the illuminant, indirect measurements, using ten different grey samples, were applied introducing a spectral responsivity that was not always perfectly uniform. These indirect measurements were chosen because direct measurements of the illuminant led to luminance values that were too high to capture using luminance cameras. Additionally, light sources are not completely uniform. As a result, it was not possible to compare the absolute luminance values of the theoretical model with the measured luminance; nevertheless, the relative difference in luminance could be compared. Grey targets were used to disrupt the SPD of the illuminant as little as possible. For instance, using coloured targets would add an additional level of complexity, as this would also introduce the spectral reflectance, which is also variable over the space, next to the spectral responsivity and the SPD of the illuminant. Moreover, the reference luminance measurements using the Konica Minolta LS-100 had an uncertainty of ±2%, according to the specifications, which might have caused these differences.
Additionally, a photometric calibration factor was applied to the practical measurements to limit the inaccuracies introduced by the hardware. It was found that the calibration factor, besides the average luminance, also influenced the standard deviation of the relative luminance. Therefore, it can be concluded that this calibration factor had a large effect on the measurement results. The calibration factor can be determined in multiple ways; in this research, it was chosen to calibrate the luminance cameras, for all methods, such that the average relative difference in luminance was similar to the expected relative difference in luminance. This allowed us to examine the relative differences in luminance and its trends for each individual illuminant.
Even though this study aimed to answer the fundamental questions whether the spectral responsivity and the SPD of the illuminant should be integrated in the luminance distribution measurement, the practical aspects should not be neglected. It can be argued that instead of optimizing the r, g and b weighting factors, the easy solution would be to apply a calibration factor to each individual camera, similar to the work performed by Jung and Inanici, 38 and/or the illuminant, especially for ad-hoc measurements. However, this requires an additional measurement device to take the calibration measurements when the conditions change. This is a consideration for the end user, related to the desired accuracy. The optimizations stated in this research could be implemented and automated on the luminance camera, the only requirement is that the spectral responsivity of the camera is measured once, or extracted from databases, 39 and that information is acquired about the SPD. The authors envision that such a system can be used during long-term measurements40,41 and/or in lighting control systems.2,42 This means that the luminance camera has a fixed position, which would generally mean that there is one fixed SPD, the luminaires, with the addition of a variable daylight SPD. To account for these SPDs, some measurements are required, but these are not more extensive than general commissioning. Also, a number of studies have already proven that it is possible to estimate the illuminant based on camera readings.43–45 Alternatively, one could chose to only implement the spectral responsivity of the camera, which is proven to improve the accuracy 31 (Section 4.3). Moreover, these optimizations have a physical basis where a photometric calibration only corrects faulty measurements. Ultimately, a combination of both would achieve the highest accuracy because the optimizations also do not have a perfect spectral match. Another possibility is to improve the spectral match by applying an optical filter, which has shown that low spectral mismatches can be achieved,18,27 something that is not feasible with digital corrections as presented in this study.
6. Conclusion
The theoretical model and practical measurements showed that the spectral responsivity of the camera had an effect on the accuracy of the luminance measurement. Therefore, it can be concluded that the r, g and b weighting factors originating from the sRGB colour space can lead to significant mismatches; however, these mismatches can be of different scale depending on the camera and its spectral responsivity.
Moreover, we found substantial evidence that the SPD had an influence on the accuracy of the luminance distribution. Generally, the r, g and b weighting factors originating from an optimization including the SPD led to improved performance. Only the practical measurements under the halogen illuminant resulted in a decreased performance; however, this was caused by inaccuracies in the applied spectral responsivities of the camera close to 700 nm which did not contain an infrared filter. Nevertheless, the optimization algorithms in this study seem to work. After all, the theoretical model showed improvements for all illuminants.
Two optimization criteria were developed that performed significantly differently, incorporating the spectral responsivity and the SPD; however, criterion 1 performed better on average. Nevertheless, it could not be concluded which criterion was most suitable for what situation.
For further assessment, it is recommended to generalize these conclusions by performing similar measurements with and without daylight (high blue content) using different cameras that have a significantly different spectral responsivity, allowing different scales of potential improvement. Also, a different approach should be developed to improve the theoretical model such that cameras can be analysed quickly and on a large scale.
Implementation of these control algorithms can be complex, especially implementing the effect of the illuminant can be complicated. For long-term measurements, it is relevant to implement the spectral responsivity of the camera and/or the SPD of the illuminant because this does not make it necessary to perform a photometric calibration for each measurement. Ultimately, the end user should make the choice about what method to use. However, for ad-hoc measurements, it is more practical to use the conventional method with an additional photometric calibration.
Footnotes
Declaration of conflicting interests
The authors declared no potential conflicts of interest with respect to the research, authorship and/or publication of this paper.
Funding
The authors disclosed receipt of the following financial support for the research, authorship, and/or publication of this article: This work is part of the research program ‘OPTILIGHT: Mathematical Optimizations for Human Centric Lighting’ with project number 14671, which is partly financed by the Netherlands Organization for Scientific Research (NWO), and which is conducted in the context of a bilateral cooperation between TU/e and Philips Lighting B.V. in the Intelligent Lighting Institute (ILI).