
Abstract
We studied pedestrians’ perception of their ability to see when outside after dark, the luminance of the pavement after dark and the association between perception and luminance. These data were captured by a citizen science network of smartphone users, with and without an eye disease. They used an app to report their ability to see when outside after dark in their own neighbourhood and measured the luminance of the pavement using the smartphone camera. Logistic regression was used to determine the influence of luminance, age, gender and eye disease on reported ability to see after dark. Amongst those respondents who did not report an eye disease, 11% reported visual conditions they perceived to make walking difficult; this increased to 40% for pedestrians who reported an eye disease. The recorded luminances were typically 0.01–0.1 cd/m2. For those respondents with healthy eyes, the percentage reporting difficult visual conditions increased especially below 0.01 cd/m2; for those with an eye disease, the increase started at higher luminances, which may limit their mobility after dark.
1. Introduction
Visual performance worsens with decreasing luminance,1–4 and as luminance decreases, the likelihood of road accidents increases. 5 Therefore, public lighting is intended to enhance visibility and safety for road users in outdoor public spaces after dark. 6 Although motorized traffic and slow-moving traffic like pedestrians may have different visual needs, the luminance of the road is of great importance for both groups.7–10
The eyes of a motorist are mainly focused on the road ahead and assisted by headlights.9-12 Pedestrians, on the other hand, have to detect obstacles without headlights (physical security), should be able to identify the intentions of others (social security) and should achieve a sufficient amount of visual orientation.6,13–15 Since different surfaces with different reflectances are involved in these visual tasks, the illuminance rather than the luminance is the basic lighting parameter that is used for pedestrian lighting recommendations.9,10 A minimal illuminance for pedestrian areas has been recommended.6,14 However, it is luminance rather than illuminance that determines visual performance (the effect of snow and recent industrial efforts to develop high-reflectance asphalt point to this). In the eye-tracking study of Fotios et al., pedestrians’ viewing behaviour in the public space after dark was explored using a dual task approach. 16 Although dependent on the characteristics of the path and the presence of other pedestrians, the path resulted in the highest proportion of observations and the near path (within 4 m) was found to be more important than the far path. This makes knowledge regarding the luminance distribution of the pavement in the public space after dark pivotal, but this knowledge seems scarce, as seems to be the case for knowledge regarding the minimum luminance that is considered sufficient to walk (see Section 4). Furthermore, the minimum luminance needed to walk might differ between people with healthy eyes and people with an eye disease.17–21
The aim of this study was to determine (1) pedestrians’ perception of their ability to see when walking in an outdoor public space after dark, specifically those instances considered to offer insufficient ability to see (visual complaint); (2) the luminance distribution of the pavement after dark and (3) the association between these complaints and luminance. For this purpose, we recruited a citizen science network of smartphone users who, by using an app, reported the amount of visual difficulty outside after dark in their own neighbourhood and measured the corresponding amount of light. Participants were stratified according to the self-reported presence or absence of an eye disease.
2. Method
2.1. Study population
The start of this project was part of the National Science Weekend 2015 in the Netherlands – a national event showcasing science to the general public. This weekend was organized in the International Year of Light (2015). Participants were recruited through national and regional advertising. They were asked to download the app ‘Zicht op Licht’ (translated: Insight into Light) to their smartphone and to conduct measurements in their own street after dark. In addition, all the third-year high school children (aged 13 to 15 years) of one high school in Leek (a town with approximately 20,000 residents, situated in the north of the Netherlands), participated in the context of their research project. Their task was to systematically map all streets of the town of Leek, in order to assess a potential selection bias regarding the distribution of luminances throughout the Netherlands.
The study protocol was approved by the ethics board of the University Medical Center Groningen (UMCG). The download and use of the app were voluntary and the app could be deleted at any time. The study followed the tenets of the Declaration of Helsinki.
2.2. Data collection
An iOS app was built to measure low luminances on the surface one metre in front of the feet of the participant, through the camera of an iPhone. Technically, the app was based on the Dark Sky Meter app (www.darkskymeter.com); the Dark Sky Meter app was modified for our study by its maintainer (see Acknowledgements). The app was calibrated with a Minolta luminance meter with built-in photometric filter (LS-110; Minolta Camera Co. Ltd., Japan). The lowest value displayed by the Minolta was 0.01 cd/m2. However, the output of the app still decreased monotonically with decreasing luminances below 0.01 cd/m2. On the other side, the app saturated at 1 cd/m2. For this reason, recorded luminances were categorized as either <0.01, 0.01 to 1 or >1.0 cd/m2. Valid measurements could be performed with iPhone models 4S, 5, 5C, 5S and 6.
When the app was opened for the first time, participants filled in their personal information: age, gender, the presence of an eye disease and email address. If participants reported an eye disease, they could specify whether this was glaucoma, macular degeneration, cataract, diabetic eye disease or other/more than one/unknown. Subsequently, they were asked to go to an outdoor place, anywhere, outside after dark, to perform a luminance measurement. At the start of each new measurement, participants filled in some multiple choice questions regarding the environment: if they were inside or outside; if they stood somewhere in the public space or in their own garden or yard; if there were street lights; and if they were in a village, town, city or in a rural area.
The luminance measurement was initiated by a button on the screen. Before doing this, participants were instructed (by both text and an illustration) to aim the camera of their smartphone 1 m in front of their feet. During development of the app, we found, by making pictures with the smartphone in different positions, that 1 m was the best distance for actually assessing only the pavement, rather than including either the participant’s shoes or any object or light at distance. Measurements with the Minolta luminance meter showed that there was no systematic effect of distance between 1 and 4 metre (the region within 4 metre was found to be most important for pedestrians).16,22 The luminance measurement itself took approximately 10 seconds.
Immediately after the measurement, the following question was displayed on the screen: ‘Hoeveel moeite heeft u hier met het zien om u voort te kunnen bewegen?’ (in English: ‘How much difficulty do you have with seeing to walk at this place?’). We hereafter use the term visual complaint to describe this question. The response options are described below. After all of the questions were answered, the measurement ended with some feedback to the participant regarding the measured amount of luminance and the sending of the data via internet to our database. With GPS coordinates, every measurement also appeared on an online available map. Altogether, a measurement took less than one minute.
An Android app was built that was identical to the iOS app, but without the actual luminance measurement – it was not possible to include the luminance measurement in the Android app because of the many different brands and types of Android smartphones. In total 70 individuals, half of whom were iPhone users, contributed to the development of the app by testing and providing feedback in the various stages of the development. At the time of submission of this paper, neither the iOS nor Android apps were available due to maintenance costs (every update of the operating system implied thorough testing and calibrating of the app for each iPhone type; we ceased doing this after the data collection; reactivation is possible as the app is a modification of a currently maintained app (see above)).
The data collection started on the first of October 2015 and ended the first of February 2017. Once a month, participants were reminded by an email and a push message to perform a measurement.
2.3. Data analysis
All measurements that were performed inside, or outside during daylight, were excluded from further analysis. Individual iPhone participants were identified by a unique device ID; Android smartphone users by their email address (due to there being many different types of Android smartphone, it was not possible to unambiguously label a unique Android device). If the email address of a measurement with an Android device was missing, we excluded the measurement from further analysis. Measurements that were performed with unsupported iPhones were analyzed as measurements with an Android device (i.e. without the luminance measurement). The study population was described using nonparametric descriptive statistics (median with interquartile range (IQR)). Univariable comparisons of continuous variables between participants with and without an eye disease were made with a Mann–Whitney test; proportions were compared by a Chi-square test with Yates’ correction.
To determine the prevalence of visual complaints in outdoor public spaces, we excluded all measurements that were performed in a garden or yard. Subsequently, we selected only one measurement per unique participant. Some participants measured more than once at a single location, or at multiple locations, or both. If a participant measured more than once, we included only one measurement per participant, being (arbitrarily) the second measurement, independent of the location. Questions regarding visual complaints contained four response options. We dichotomized these response options into two categories: No complaints and Complaints in order to be able to calculate a prevalence and to perform logistic regression. The response options ‘No difficulty at all’ and ‘A little difficulty’ were categorised as No complaints; the response options ‘A lot of difficulty’ and ‘Extreme difficulty’ were categorised as Complaints. We performed logistic regression to determine the influence of age, gender and eye disease on the presence of visual complaints after dark.
To determine the luminance distribution of the outdoor public spaces after dark, we selected all iPhone measurements. Again, all measurements that were performed in a garden or yard were excluded. We used a histogram and nonparametric descriptive statistics (median with (IQR)) to describe the distribution of pavement luminance after dark within the Netherlands. Measurements in Leek were selected with GPS coordinates (latitude between 53.138 and 53.184 degrees; longitude between 6.350 and 6.395 degrees) and presented separately. The luminance distributions for measurements (A) throughout the Netherlands except the town of Leek and (B) Leek were compared using a Chi-square test after stratification in four categories (<0.01, 0.01–0.1, 0.1–1 and >1 cd/m2).
To determine the association between luminance and complaints, we selected only one measurement per iPhone user. If a participant measured more than once, the second measurement was selected (see above). Based on the luminance frequency distribution, the measurements were divided into three groups: a low luminance group, an intermediate luminance group and a high luminance group (see Section 3 section). We used a bar chart to describe the prevalence of visual complaints per luminance group, for participants with and without eye disease. The influence of luminance, age, gender and eye disease on the presence of visual complaints after dark was determined using logistic regression.
All analyses were performed using R (version 3.2.3; R Foundation for Statistical Computing, Vienna, Austria). A significance (p) value of 0.05 or less was considered statistically significant.
3. Results
Figure 1(a) shows a map of the Netherlands with the 6709 measurements performed by 1857 individual participants. Figure 1(b), an enlargement of the north-eastern region of the Netherlands, shows a map of Leek with the subset of 2683 measurements performed by 110 individual participants. After the exclusion of inappropriate measurements (those that were done inside, not in a public space, during the day, or for which a unique participant could not be identified), 3813 measurements belonging to 780 unique participants (of which 54 were from Leek) were available for further analysis.
Distribution of measurements throughout the Netherlands (a) and the town of Leek (b)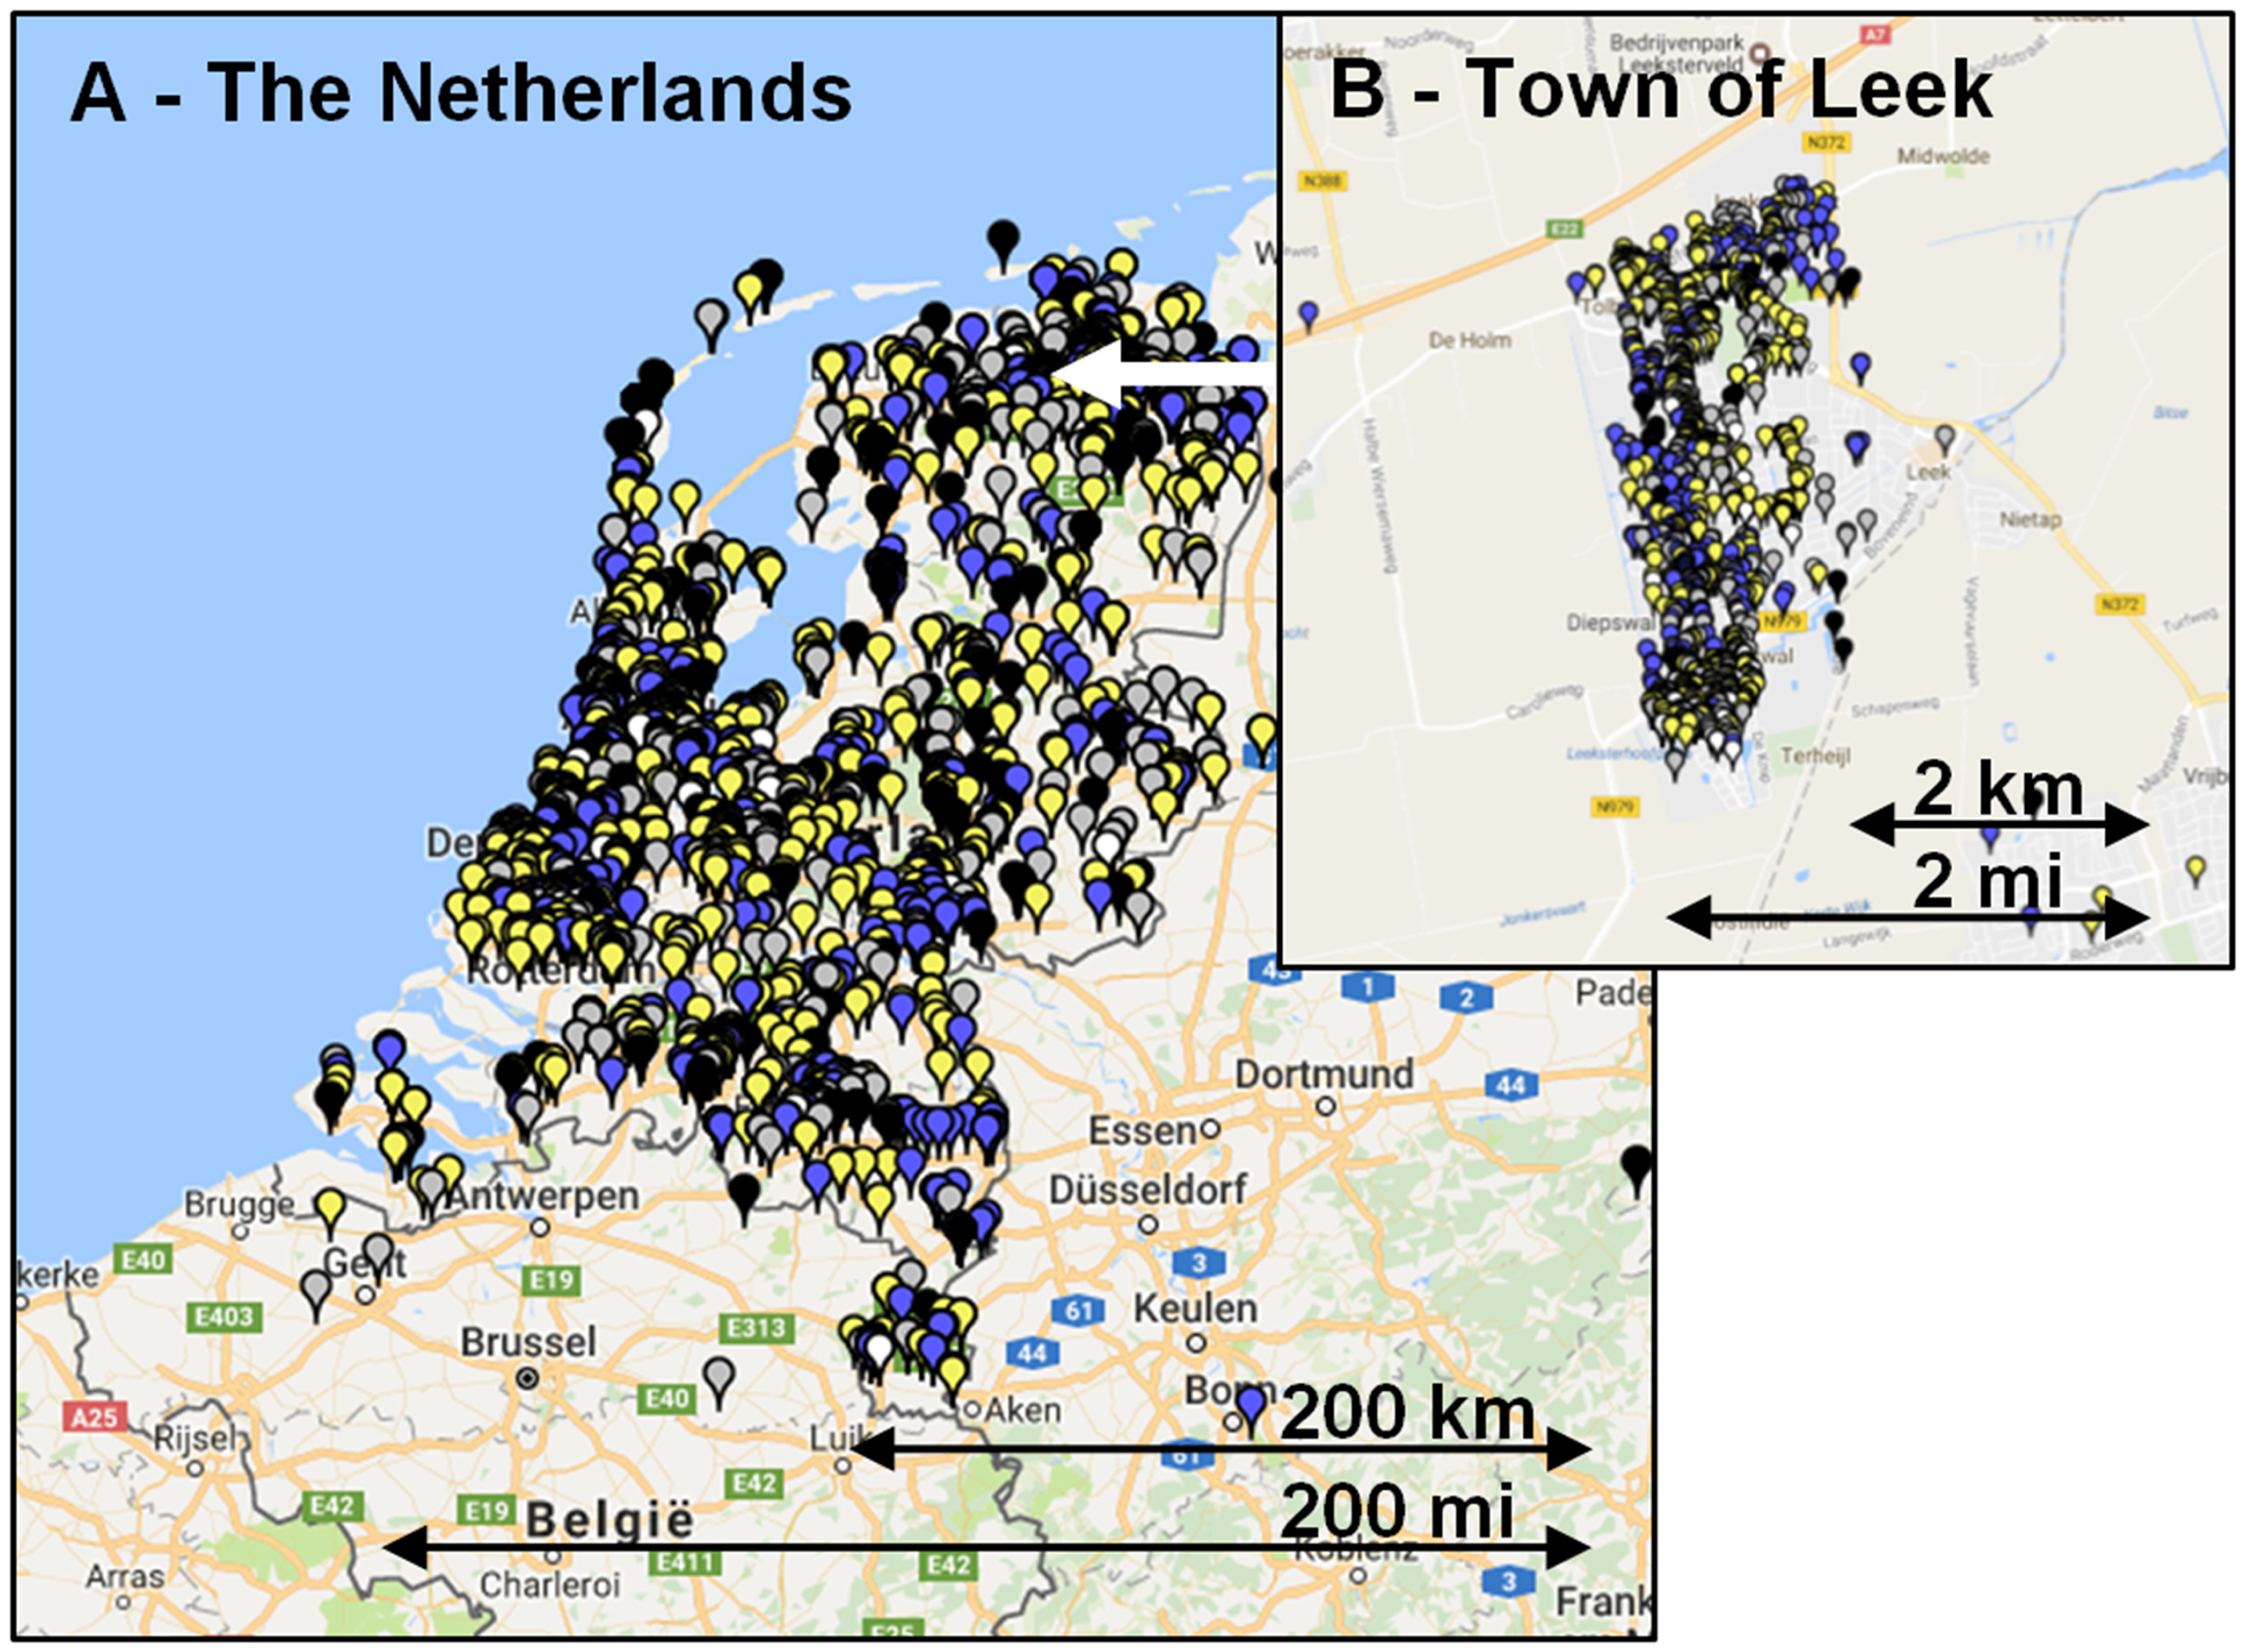
Characteristics of the respondents

The p value describes the statistical significance of the difference between participants with and without an eye disease.
Other: other/more than one/unknown.
IQR: interquartile range; NA: not applicable; MD: macular degeneration.
Odds ratios of visual complaints of pedestrians to walk outside in the public space after dark
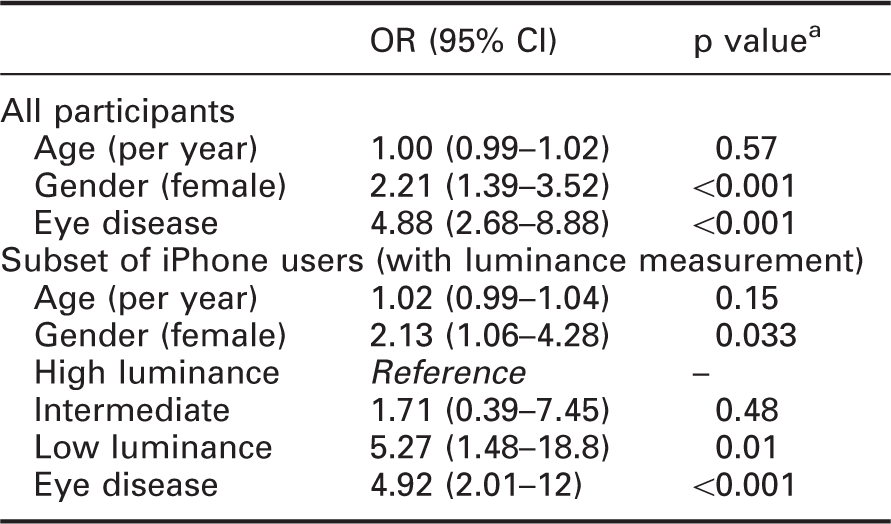
The p value refers to the statistical significance of the odds ratio in the logistic regression model.
CI: confidence interval; OR: odds ratio.
Of 3813 measurements in outdoor public spaces after dark, 2431 (of which 1585 from Leek) were performed with an iPhone and thus included a luminance measurement. These iPhone measurements were performed by 232 unique participants (32 from Leek), with a median (IQR) number of measurements per participant of 1 (1 to 4) outside Leek and 34 (18 to 55) within Leek. Figure 2(a) shows the luminance distribution outside in the public space after dark for the Netherlands excluding Leek; Figure 2(b) shows these data for Leek. The vast majority of the measurements (93%) were conducted in an environment with street lights. The median (IQR) luminance was 0.019 cd/m2 (<0.010 to 0.050) and 0.057 cd/m2 (0.021 to 0.134), for the Netherlands and Leek, respectively. These distributions differed significantly (p < 0.001).
Frequency distribution of pavement luminance at night for measurements throughout the Netherlands except the town of Leek (a) and Leek (b)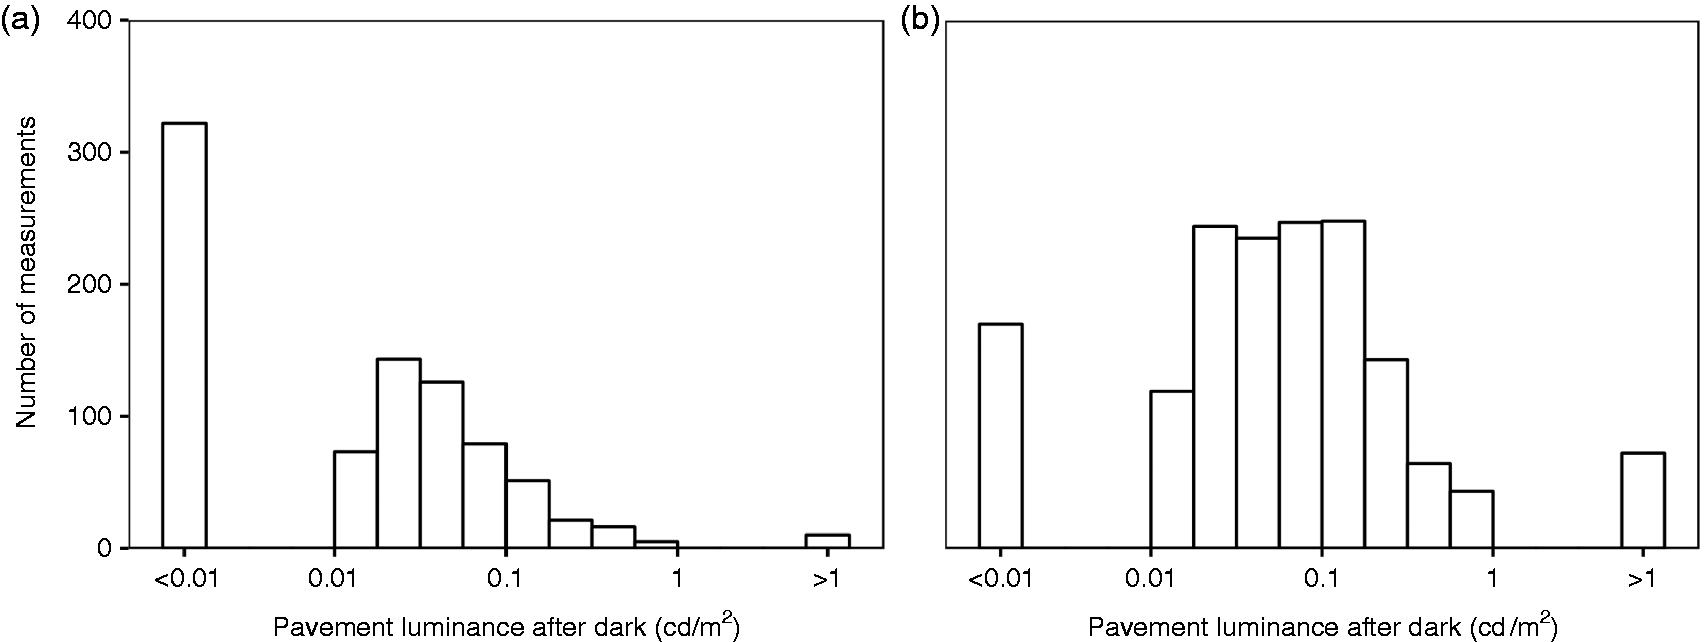
In total, 2848 iPhone measurements were performed outside after dark, the 2431 in public spaces and a further 417 in the garden or yard. These 2848 measurements belonged to 373 unique participants, of which 34 self-reported an eye disease. Table 1 (lower part) shows the characteristics of these 373 unique participants with and without eye disease. More than half of the measurements (n = 200) yielded a luminance of less than 0.01 cd/m2 and therefore a luminance below 0.01 cd/m2 was defined as the low-luminance category. We then took the median of the remaining measurements (n = 173) to define the cut-off luminance between the intermediate-luminance and high-luminance category. This cut-off luminance was 0.04 cd/m2. Figure 3 presents the percentage of participants with and without an eye disease with visual complaints, for the three different luminance categories. The percentage of participants with complaints differed between those with and without an eye disease for the low (p = 0.001) and intermediate (p = 0.01) luminance category, but not for the high luminance category (p = 0.89). For those without an eye disease, the percentage of participants with complaints increased especially below 0.01 cd/m2; for those with an eye disease, the increase started at higher luminances. Table 2 (lower part) shows the corresponding logistic regression analysis. Females and participants with an eye disease reported more complaints, and these complaints were more pronounced in the low-luminance category.
Frequency of visual complaints as a function of the pavement luminance after dark for participants with and without an eye disease. Low luminance was below 0.01 cd/m2, intermediate luminance between 0.01 and 0.04 cd/m2 and high luminance above 0.04 cd/m2. Error bars denote ± one standard error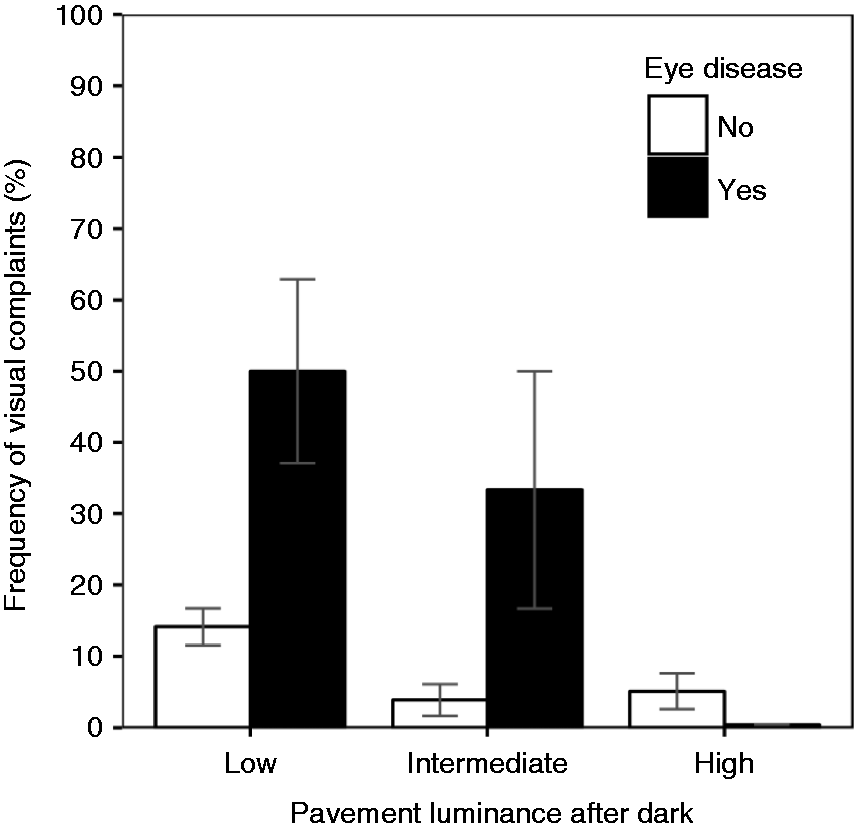
4. Discussion
The prevalence of visual complaints of pedestrians without an eye disease to walk outside after dark is 11%. The luminance of the pavement in the public space after dark is typically in the range of 0.01 to 0.1 cd/m2. Visual complaints of pedestrians to walk outside after dark are more pronounced in women and participants with an eye disease, and below a luminance of 0.01 cd/m2.
Eye-tracking experiments revealed that, after dark, pedestrians spend a significant amount of their time observing the pavement, with a tendency to concentrate on the near (that is, within 4 metre) path.16,22 Intriguingly, we could not find any study that linked the luminance of the pavement directly to visual complaints regarding walking outside after dark. Several questionnaire studies asked for visual performance outside after dark21,23–25. The questions, however, either addressed other tasks (e.g. driving) or did not address a specific task. For example, the question ‘Do you have difficulty seeing at night’ 25 may relate to mobility, but also to facial expression discrimination, spatial orientation or glare disability, and all these factors contribute to visual comfort.9,13,15,26–35 In a recent questionnaire study, we tried to avoid this ambiguity by specifying the task explicitly. Our question ‘Because of your eyesight, how much difficulty do you have with walking or cycling at night on an unlit country road’ yielded a prevalence of visual complaints of 14% in subjects without an eye disease and 54% in patients with glaucoma. 36 These percentages are in good agreement with that of the low luminance category shown in Figure 3.
Two studies related a subjective rating of visual comfort with the amount of light in the public space after dark.37,38 Both studies used a 9-point appraisal scale and determined the luminance that was appraised as poor to adequate (Simons et al. 37 ) and inadequate to fair (De Boer 38 ); in both studies this corresponded to point 4 on the 9-point scale. Simons et al. reported a threshold of 2.5 lux (0.08 cd/m2 assuming a reflectance of 0.1 (see below)) 37 ; De Boer reported a threshold of 0.2 cd/m2 to reach a visual comfort deemed acceptable. 38 These studies were based on 25 and 16 observers, respectively, and did not specify a task but rather asked for a general appraisal.37,38 In addition, in both studies the observers visited all sites. Therefore, it is possible that the range of luminances that was presented influenced the rating itself (range bias), resulting in biased thresholds. These differences might explain why their thresholds seem somewhat high compared to our findings (Figure 3).
Several studies have addressed the influence of light on performance in a laboratory setting. Boyce 39 Simmons 40 and Jaschinski 41 measured speed in an emergency setting and recommended illuminances of 0.3 to 2 lux. The luminance coefficient of the street or pavement has been reported to be typically 0.07. 42 We measured the reflectance of the default Dutch paving stone to be 0.15 and that of asphalt 0.12. Assuming a reflectance of 0.1, illuminances of 0.3 to 2 lux would yield luminances of 0.01 to 0.06 cd/m2. This suggests that the pavement luminance after dark is just about enough to reach the above mentioned recommendations.
Studies investigating obstacle detection found that the largest increase in detection rate occurred between 0.2 and 2.0 lux.8,42,43 Depending on the reflectance of the obstacles, this corresponds roughly to 0.01 to 0.1 cd/m2, which is in agreement with the decrease in complaints from the low to the moderate category shown in Figure 3. International and national quality criteria for public lighting for roads that are used by motorized traffic, state a minimum average luminance after dark of 0.3 cd/m2. For roads that are used by pedestrians or slow traffic, there is no minimum luminance criterion but a minimum illuminance criterion, being 0.4 lux.6,14 With a paving stone reflectance of 0.1, this corresponds to 0.013 cd/m2. Figure 3 shows that the threshold for visual complaints for participants without an eye disease is lower than 0.01 cd/m2, whereas for participants with an eye disease, it is higher than 0.04 cd/m2. Therefore, the minimum criterion of 0.013 cd/m2 seems to be sufficient for people with healthy eyes but not for those with an eye disease.
The influence of gender on visual complaints (Table 2) is consistent with earlier studies that used either subjective and objective outcome measures.20,36,44,45 Although we specifically asked for difficulties with seeing to walk, our results could also be explained by a general feeling of insecurity after dark in females.46,47 Although the effect of age on visual performance as, for example, contrast sensitivity is undeniable,48–51 we did not find an influence of age on visual complaints. A possible explanation of this apparent discrepancy is the fact that the effect of age on contrast sensitivity – albeit highly significant – is small compared to the effect of luminance. For example, Nio et al. 51 found a decrease in contrast sensitivity of typically 0.3 log units between 20 and 70 years of age; a decrease in luminance from 0.1 to 0.01 cd/m2 already results in a 0.5 log units decrease in contrast sensitivity.1,2 Nio et al. performed their measurements at a mean luminance of 200 cd/m2. Age could be a more important factor in a case of a low luminance. We repeated the analysis presented in Table 2 for the lowest luminance category subset; the OR for age increased slightly (OR 1.03 (1.00–1.07); p = 0.06).
To ensure that the participants could perform the measurement, the instructions were displayed both in text and graphically, and the app was adjusted until it was understandable by respondents of all ages. We used two control questions to exclude measurements that were performed inside and not in the public space, and we excluded measurements that were performed with daylight. However, it could be the case that participants who live in a low- or high-luminance environment were more motivated to contribute. To assess this potential bias, we used the school project to map one town (Leek) in detail. When comparing the luminance distribution of the measurements throughout the Netherlands except Leek (Figure 2(a)), with that of Leek (Figure 2(b)), the overall picture agrees well but there seems to be a small bias towards low luminances. Another explanation of this difference could be a real luminance difference between Leek and other towns, villages and cities in the Netherlands. Of all luminance measurements performed outside after dark, 23% were reported to be performed outside a village, town or city, that is, in a rural area (27% in Leek and 17% throughout the Netherlands). Bias could also arise from the fact that participants reported difficulties just because they assumed darkness implies difficulties. The effect of this bias seems limited; we found a clear dose-response relationship and a clear effect of eye disease, and a low percentage (only 5%) of difficulties in those without an eye disease being in an above average luminance situation (Figure 3).
Our citizen science project was inspired by an earlier project in the Netherlands, where atmospheric aerosols where mapped using a citizen science network of smartphone users. 52 A difference with that and other projects, is that not only did we collect data from the environment but also from the citizen scientists themselves. An advantage of using a citizen science network is the arousal of public awareness, in this study, specifically regarding the influence of luminance on the accessibility of the public space after dark. It is possible to perform a large number of luminance measurements with only a few observers (as we did in Leek), and these measurements could be even more accurate. However, a realistic inventory of complaints requires a large number of unique subjects that can be considered a representative sample of the general population – for which the citizen science approach is pivotal. The technology that is offered by tablets and smartphones might enable screening or follow-up of diseases in the foreseeable future. This could be helpful to unburden the healthcare system; due to the fast increase in the number of elderly in the upcoming decades, self-reliance by technology might be necessary. Despite the high potential, medical citizen science projects are still rare compared to other disciplines. 53 A disadvantage of the citizen science approach is the potential for suboptimal data quality and a selection bias, which we address above.
The luminance of the pavement might be more critical for the visually disabled than it is for those people with healthy eyes. 7 Although the group size was small, when going towards lower luminances, visual complaints of participants with an eye disease increased earlier compared to participants without an eye disease (Figure 3). This corroborates with earlier questionnaire studies, which found a higher frequency of visual complaints after dark in subjects with an eye disease.19,21,25 Kuyk et al. 7 studied the duration of an outdoor walk, and the number of mobility incidents, in older adults with low vision with a high (>1000 cd/m2) and a moderate (7 cd/m2) surface luminance. Although their lower luminance was typically 2 log units higher than the luminances we found outside in the public space after dark, they already found a significant increase in the duration and number of mobility incidents with the lower luminance, illustrating the disproportional disability of people with an eye disease after dark. 7 It seems obvious that this could have an effect on the mobility after dark and thereby the quality of life of the visually disabled. 54
In conclusion, approximately 10% of the ophthalmic healthy persons expressed visual complaints regarding walking in an outdoor public space after dark, compared with approximately 40% of those people who self-reported an eye disease. In particular, the visually disabled experienced an increase in visual difficulties with decreasing luminance, which may have an impact on their mobility after dark. The citizen science approach allowed us to make an estimate of the luminance of the public space and its influence on visual complaints. Future studies could focus on the actual measurement of mobility after dark, and might work towards a minimum luminance criterion for the pavement.
Footnotes
Declaration of conflicting interests
The authors declared no potential conflicts of interest with respect to the research, authorship, and/or publication of this article.
Funding
The authors disclosed receipt of the following financial support for the research, authorship, and/or publication of this article: ‘Ergoftalmologie’ of the Dutch Ophthalmological Society (NOG).
Acknowledgement
We would like to thank the National Science Weekend for the opportunity to launch this citizen science project nationally, DDQ (![]() ) for their technical expertise regarding the app, the Lindenborg High School at Leek for their enthusiastic participation, Koninklijke Visio Haren for the use of their light laboratory for the calibration of the app, and all the citizen scientists for providing us with relevant data.
) for their technical expertise regarding the app, the Lindenborg High School at Leek for their enthusiastic participation, Koninklijke Visio Haren for the use of their light laboratory for the calibration of the app, and all the citizen scientists for providing us with relevant data.