
Abstract
Many studies have used surveys to investigate the reactions to changes in lighting from people who walk or cycle. An alternative approach is to use objective data, specifically the number of pedestrians and cyclists present under different lighting conditions. Such data have been reported previously using a daylight savings transition approach. This paper presents a different method for analysing the effect of ambient light conditions in which data from the whole year are examined, rather than only the two weeks either side of the biannual daylight savings clock changes. The results confirm that ambient light has a significant impact: For a given time of day, more people walk or cycle when it is daylight than after dark and more people cycle on cycle trails and walk on foot paths after dark when they are lit than when they are unlit. While both methods use an odds ratio approach, which should account for environmental changes other than lighting, the results suggest the daylight savings method of analysis better isolates changes in weather from the effects of ambient light on travel choice than does the whole-year method.
1. Introduction
Road lighting in subsidiary roads is intended to promote conditions in which people feel it is safe to walk or cycle after dark.1,2 Lighting may be expected to do this because it can modify and thus enhance the ability to detect trip hazards,3,4 to recognise the intentions or identity of other people,5–7 and to feel safer.8,9 Lighting is particularly important for pedestrians because those people who feel safer are likely to engage in more walking behaviour.10,11 Road lighting may make the pedestrian or cyclist feel more visible and less at risk of being hit by a vehicle as poor (or no) lighting increases the rate and severity of traffic collisions involving pedestrians and cyclists, 12 although one study has suggested that pedestrians’ estimates of the threshold distance at which they are recognisable as a pedestrian to approaching drivers is not influenced by changes in headlight intensity. 13
One way to investigate whether lighting promotes a feeling of safety amongst pedestrians and cyclists is to ask them how they feel under different levels of ambient light. It is known, however, that this approach can be easily influenced by factors other than lighting. For example, asking for a rating compels a participant to make an assessment of something they perhaps would not otherwise consider relevant, 2 and evaluations captured using category rating may be prone to stimulus range bias. 14
A further limitation of conclusions drawn from subjective evaluation is that it is not certain whether this is matched by actual behaviour. The influence of ambient light on travel choice (i.e. the decision to walk or cycle) was investigated in one study 15 by comparing the frequencies of walking and cycling to isolate the influence of ambient light on this decision, the analysis was made using travel frequencies recorded immediately before and after the daylight savings time (DST) clock change. This followed the approach used by others to investigate road traffic collisions. 16 The decision to walk or cycle may be influenced by many factors other than lighting, including purpose, destination, weather and fatigue. 17 The biannual changes to clock times resulting from DST provide an opportunity to control these variables whilst changing the ambient light condition. For example, a walk to or from work taking place during daylight in one week would take place after dark following a clock change.
The analysis used pedestrian and cyclist count data collected using automated systems over a five-year period from the Arlington County area of the State of Virginia, USA. 15 A case hour (17:00–17:59) was chosen in which the ambient light level was daylight before the Autumn clock change but twilight tending to darkness following the clock change. A similar case hour (18:00–18:59) was chosen for the Spring clock change, in which the ambient light level was twilight tending to darkness before the change but daylight after. Given that pedestrian and cycle frequencies might change before and after the clock change due to other reasons, four control periods were chosen in which the light conditions did not change (two daylight hours and two dark hours). Frequencies of pedestrians and cyclists during this case hour, for the two weeks before and after the Spring and Autumn clock changes, were compared to frequencies in control periods using an odds ratio (OR). It was found that the numbers of pedestrians and cyclists during the case hour were significantly higher during daylight conditions than after-dark, the ORs being 1.62 for pedestrians and 1.38 for cyclists.
However, there are limitations to the DST approach to analysing changes in activity. 18 First, analysis makes use of data for a single case hour over a relatively short time before and after each clock change, which reduces the number of events available for analysis. Second, using data for the weeks before and after the daylight savings transition may introduce bias attributable to seasonal variation in transport decisions, for example, conditions are likely to get worse as winter approaches (but note that analysis of weather data did not suggest outdoor temperature nor rainfall to be significant factors in the previous analysis 15 ). Third, the DST approach may also be influenced by discrete events that occur within the two-week periods before and after each clock change, which could potentially skew pedestrian and cyclist frequencies.
The pedestrian and cyclist counters record data across the whole year. An alternative approach to analysis of these data is to look across the whole year, by identifying a specific time of day which is either daylight or dark according to the time of year, and compare travel frequencies with control hours, which are always daylight or always dark throughout the whole year. This would address the first limitation. To address the second and third limitations, the previous analysis 15 used an OR approach in which changes during the case hour were compared against changes in control hours, an extension to previous studies using the DST approach. 16
This paper reports a further analysis carried out to validate the previous findings 15 by analysing the same database of pedestrian and cyclist count data but using the alternative approach to analysis as proposed by Johansson et al. 18
2. Method
2.1. Travel count data
Automated pedestrian and cyclist counters have been installed since October 2009 in a number of locations within Arlington County, Virginia, in the Washington DC metropolitan area, on cycle trails, on-street cycle lanes and footpaths. Arlington County is a 26 square mile area that was formerly an inner ring suburb of Washington DC. Walking and cycling have been regarded as important complements to rail and bus transit by the local authority of Washington DC, and led to the development of a healthy active travel infrastructure. This has been matched by investment in active travel count apparatus to support transport planning. The counters continuously record pedestrian and cyclist volumes and these data are available at 15-min aggregations via the Bike Arlington website (http://www.bikearlington.com/pages/biking-in-arlington/counting-bikes-to-plan-for-bikes/data-for-developers/). Separate data for pedestrians and cyclists are provided. The direction of the traveller is provided, as ‘inbound’ or ‘outbound’ relative to the centre of the Arlington area. For the current analysis, inbound and outbound volumes were combined. Count data were downloaded for a four-year period between 1 January 2012 and 31 December 2015. This included data from 11 separate counters in 2012, increasing to 32 separate counters by the end of 2015, as new counters were installed over this period.
2.2. Comparison of day and dark
Following the method used by Johansson et al. 18 to compare daylight and after-dark ambient light conditions across the year, a case hour and two control hours were defined. The case hour, 18:00–18:59, was chosen because it would be in daylight during part of the year and darkness during the rest of the year, due to seasonal changes in the time of sunset. The control hours were defined such that they would always have the same light condition throughout the year (either daylight or darkness) and these were 15:00–15:59 (daylight control hour) and 21:00–21:59 (dark control hour).
Figure 1 illustrates the sunrise and sunset times throughout a typical year in the Arlington location. The shaded areas represent the period before sunrise and after sunset. As can be seen in Figure 1, the case hour occurs after sunset for part of the year (approximately November until March) and before sunset for the other part of the year (approximately April until October). It can therefore be described as being in darkness for part of the year and daylight during the rest of the year. It should be noted however that the transition between daylight and darkness is gradual, with ambient light conditions passing through twilight before reaching dusk and true darkness, the point at which natural illuminance levels are at their lowest point during the diurnal cycle. To maximise the transition between daylight and darkness, the case hour was selected to overlap with the time of sunset when clocks moved forward one hour as a result of the move to DST. This meant that sunset occurred at the beginning of the 18:00–18:59 hour immediately before the Spring clock change but at the end of this hour immediately after clock change. It was not possible to align the case hour with this abrupt change in sunset time for the Autumn clock change however due to the dates of the clock change (usually at the beginning of November) and the sunset time around this date (approximately 18:00 immediately before the clock change and 17:00 immediately after the clock change).
Sunrise and sunset times at the Arlington location in the United States throughout the course of a year. Shaded areas represent periods of darkness. Horizontal bars indicate the periods selected for the two control hours and the case hour.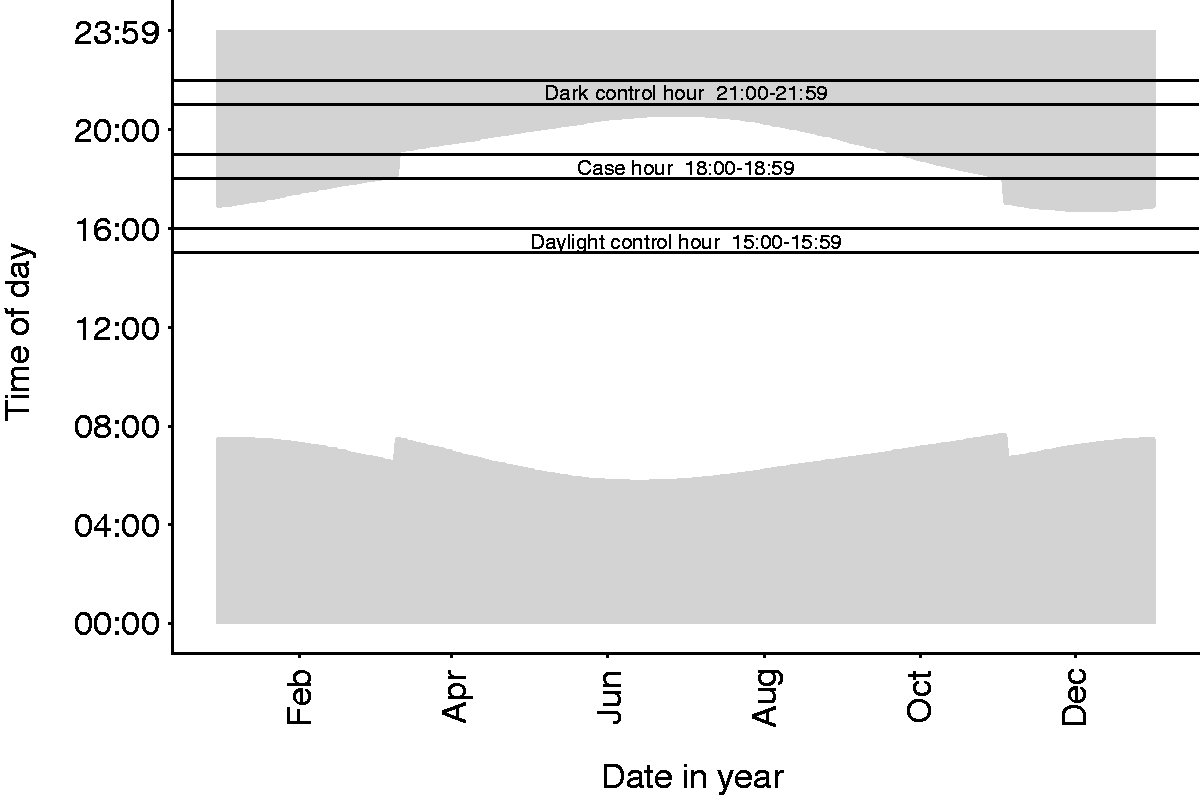
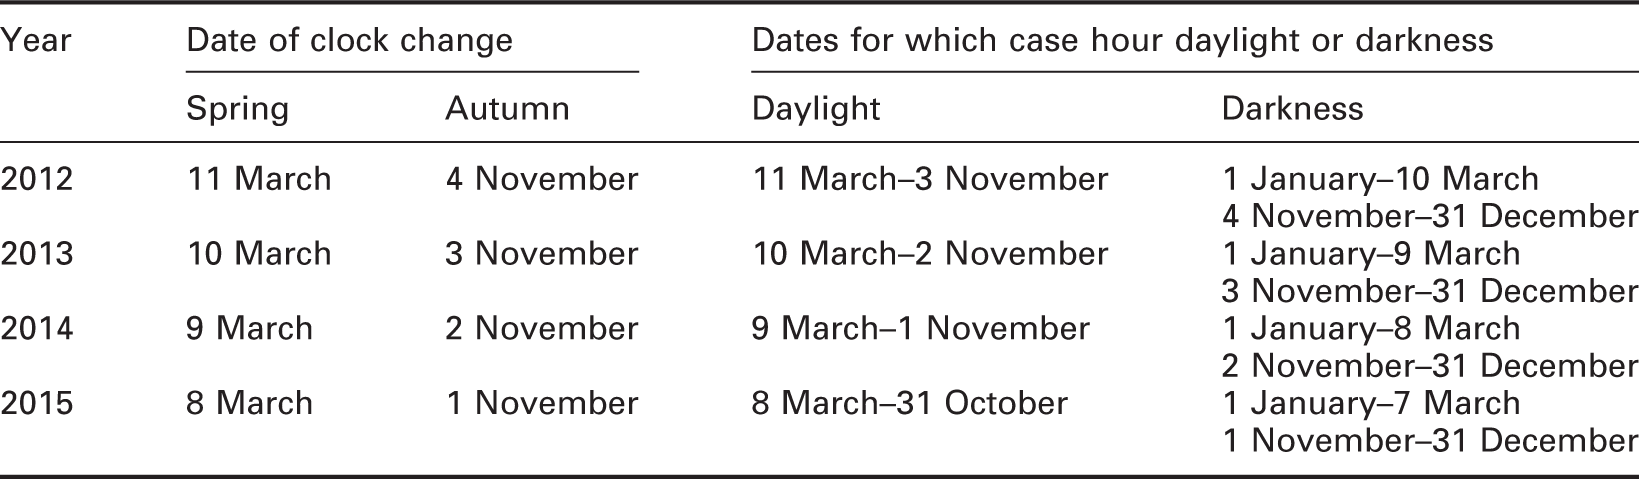
Daylight saving clock change dates and periods when the case hour is defined as in daylight or darkness, 2012–2015
2.3. Odds ratios
An odds ratio (OR) is a measure of association between a particular condition or situation and an outcome.
19
It represents the odds of a particular outcome under a specific condition, compared with the odds of that outcome in the absence of that specific condition. Johansson et al.
18
used ORs to estimate the risk of road traffic accidents under conditions of darkness, compared with daylight. A similar method of analysis is used here to estimate the association between darkness and the frequency of pedestrians and cyclists, compared with daylight. Frequencies of pedestrians and cyclists are summed for the period of the case hour when it is in darkness and when it is in daylight, and the ratio between these two is calculated. This ratio is then compared against the ratio of the summed frequencies during the same two periods of the year but for the two control hours (15:00–15:59 and 21:00–21:59) when the light condition remains constant. The result of this comparison is the OR (equation (1)). An OR above one indicates that daylight is associated with an increase in traveller frequency.

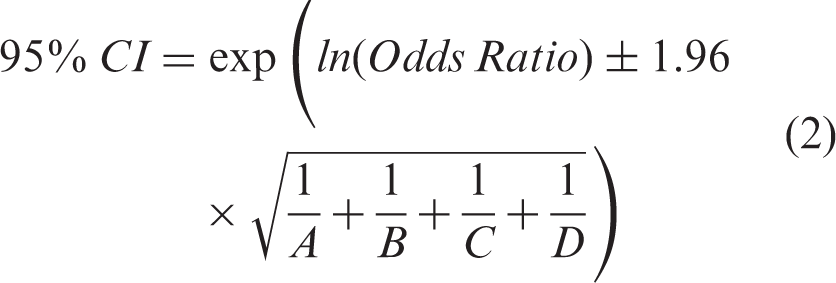
Note that for items C and D, the pedestrian (or cyclist) frequencies from both the dark and daylit control hours were summed. The ratio A/B is a daylight: darkness approach to analysis, with a higher ratio indicating that more people choose to walk or cycle in daylight than darkness. In this form, however, it does not account for other influences on the decision to walk or cycle, such as the weather. The ratio C/D acts as a weighting for these other changes with the assumption that they have consistent effect across the day. Equation (2) describes how the 95% confidence intervals (CI) were calculated for each OR.
3. Results
Frequencies of pedestrians and cyclists during case and control hours, when case hour is in dark and in daylight during the years, 2012–2015
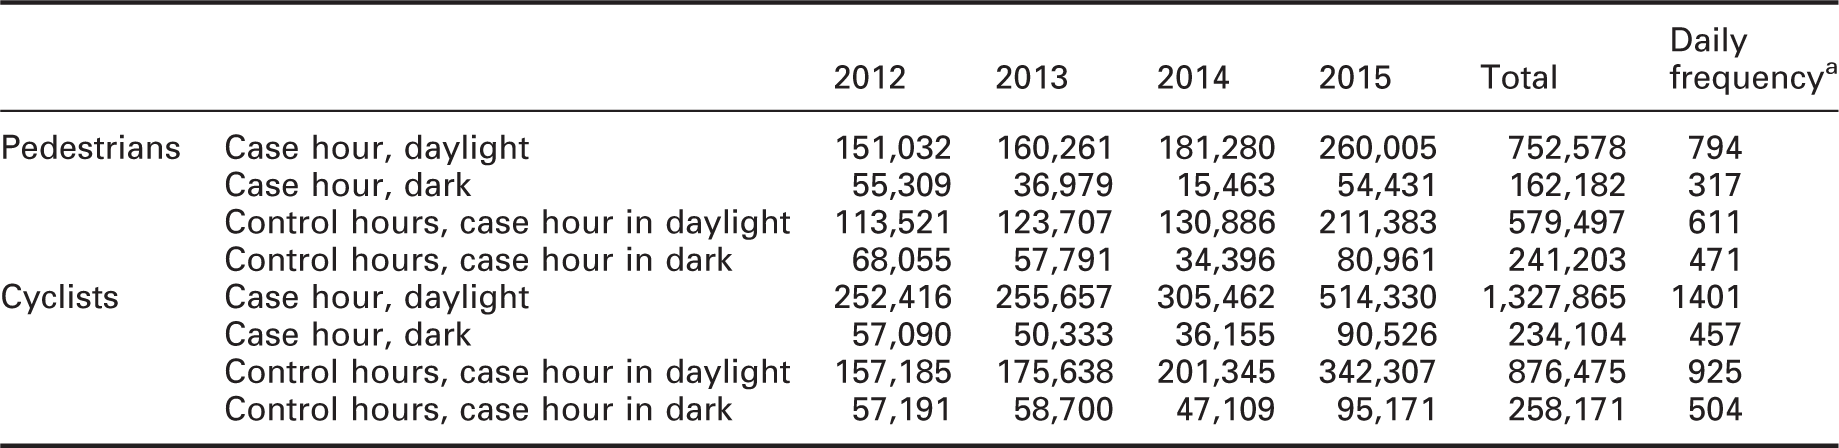
Daily frequency calculated by dividing total frequency by the number of days in that period of the year (237 days when case hour in daylight, 128 days when case hour in darkness – see Table 1 for dates), then by the number of years (four).
Figure 2 displays the ORs calculated using equation (1) for pedestrians and cyclists. These ORs describe the relative change in traveller frequencies during daylight compared to darkness in the case hour, compared with changes over the same period in the control hours. An OR above one indicates that daylight is associated with an increase in traveller frequency and it can be seen that the OR is significantly greater than 1.0 for both pedestrians (OR = 1.93, 95% CI = 1.92–1.95, p < 0.001) and cyclists (OR = 1.67, 95% CI = 1.66–1.68, p < 0.001). These ORs represent a medium effect size using Cohen’s definitions.20,21 The daily frequency of pedestrians in the case hour was 151% greater when it was in daylight compared with when it was in darkness. In comparison, the daily frequency of pedestrians in the control hours increased by only 30% over the same period. Likewise, the daily frequency of cyclists in the case hour when it was in daylight was 206% greater than when it was in darkness. The equivalent increase for the control hours was only 83%. See Table 2 for daily frequencies. Figure 3 shows the ORs determined for discrete years.
Odds ratios for pedestrians and cyclists, describing the relative change in traveller frequency in daylight compared with darkness, through comparison of frequencies in the case hour with frequencies in the control hours. Odds ratios are shown for the whole year method by the current analysis, and for the daylight savings clock change method from Uttley and Fotios.
15
Error bars show 95% confidence intervals. Odds ratios showing the effect of daylight relative to darkness on cyclist and pedestrian numbers, over the year. This graph compares the whole-year method (current analysis) and the daylight savings clock change method.
15
Error bars show 95% confidence intervals.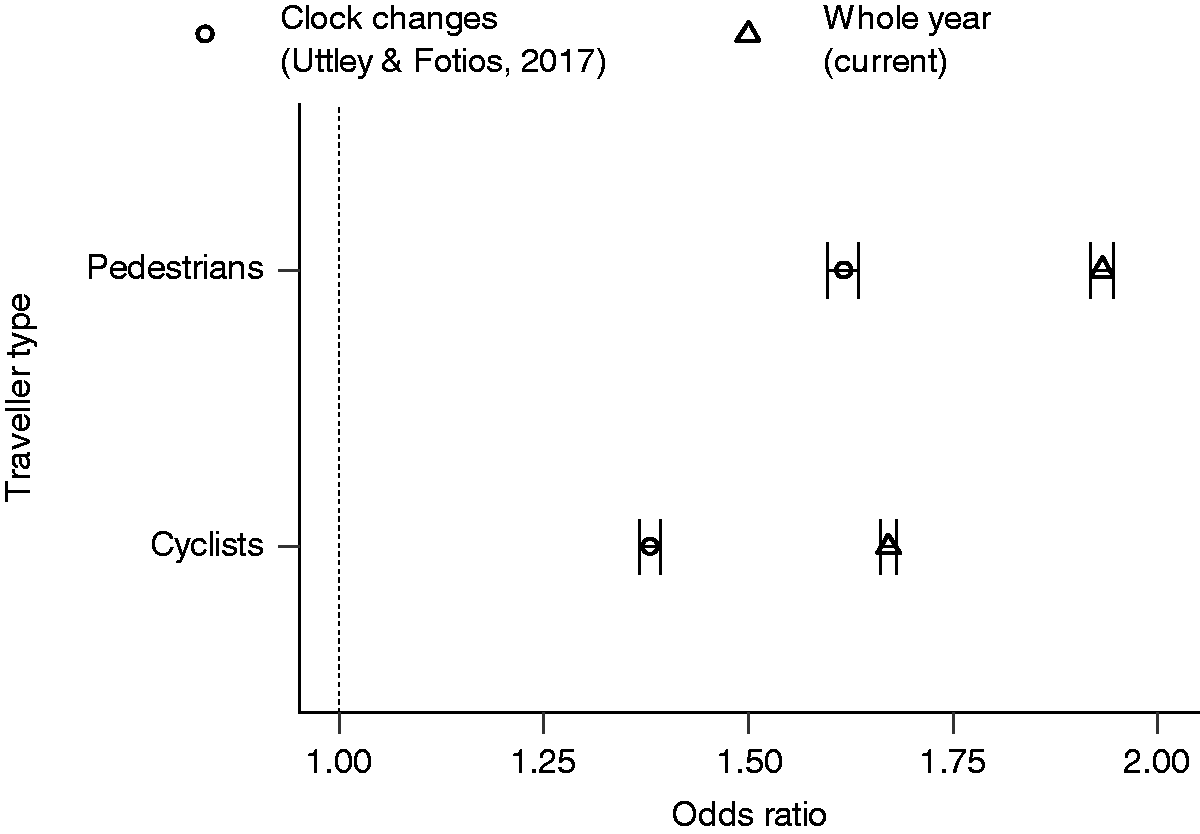
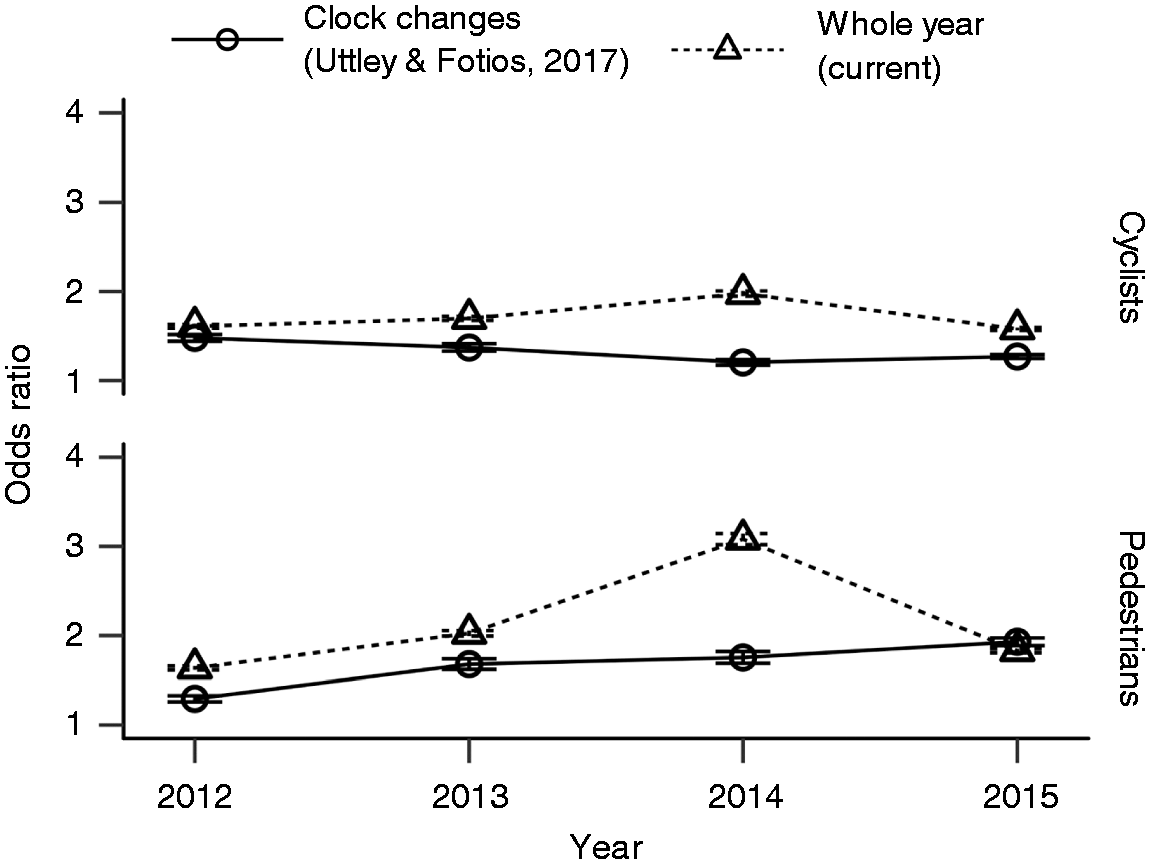
Using the whole-year approach leads to larger ORs than found when using the DST approach. Johansson et al. also found the whole-year approach led to different ORs than did the DST approach, in their work, this being a lower relative risk of pedestrian or cyclists accidents after dark. One reason for this could be that the whole-year approach is comparing more obvious changes in ambient light, whereas the DST method is essentially comparing daylight on one hand to twilight-tending-to-darkness on the other.
Comparison of ORs determined for travel counts on lit and unlit routes
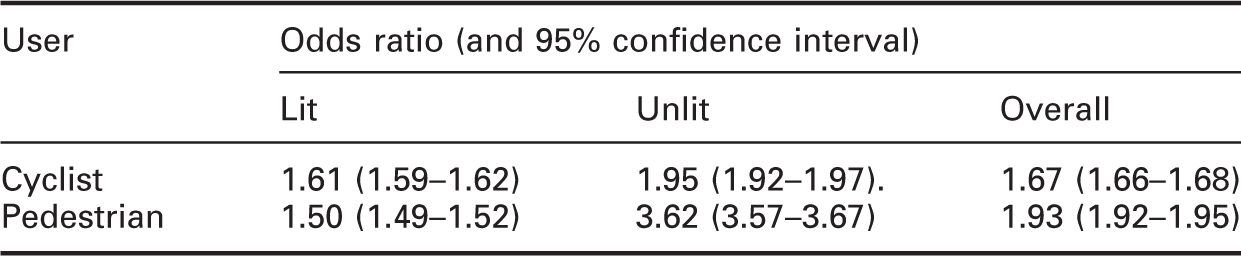
ORs: odds ratios.
4. The influence of weather
In this paper, we used a second method of analysis (the whole-year approach) to validate a previous method of analysis (the DST approach 15 ): we have not attempted to demonstrate that one method is better than the other because we do not have the data to do so. In both approaches, the analysis using an OR, which compares changes in case hours with changes in control hours, is an attempt to account for changes in weather. This assumes that a change in weather between the dates of the dark and day case hours, which might influence travel choice decisions has a similar influence on the control hours on those same days. Johansson et al. 18 introduced the control hour (and hence the OR method of comparison) specifically to control for seasonal variations.
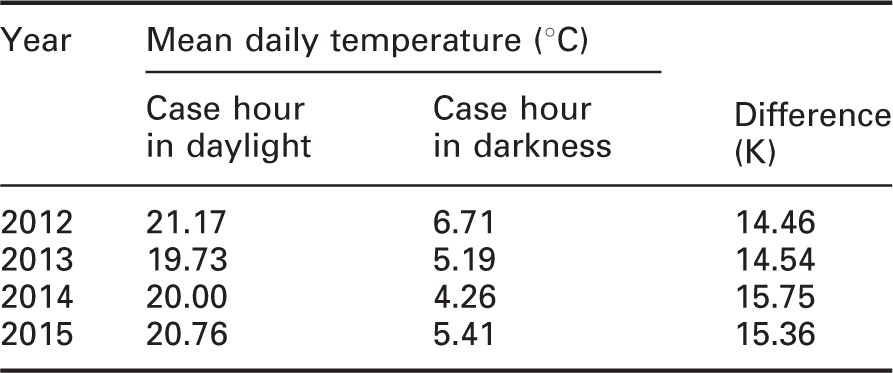
Mean daily temperatures during the period of year when the case hour is in daylight (approximately 10 March–31 October) and darkness (rest of year), by year
In both approaches, it is assumed that people’s lives follow the clock rather than the sun, i.e. that the decision of when to travel is guided by clock time and not by sun time. For journeys made to a place of employment, to school, or to a regular function, this is likely to be a safe assumption (at least, for an urban location as is the case for the current data). Leisure journeys may be more likely to be influenced by external conditions and less by clock time.
5. Conclusions
This paper examined the effect of ambient light on the frequencies of walking and cycling recorded in one city in the USA. For a given time of day, when the purpose of travel is unchanged, the daily frequency of cyclists increased by 206% when this hour was in daylight compared with darkness. In the control hours, when the ambient light remained constant, there was only an 83% increase over the same period of the year. Likewise for pedestrians, the daily frequency increased by 151% when the case hour was in daylight compared with darkness, in contrast to only a 30% increase in the control hours over the same period of the year. This analysis, carried out using data collected across the whole of the year, confirms the effect of ambient light on the number of people walking or cycling as found using the DST approach, which considered only the periods immediately before and after clock change. 15
While these data suggest that the level of ambient light matters, it is a coarse distinction between light and dark, similar to the Loewen et al. analysis of ambient light and reassurance. 9 The next stage of this work is to determine whether this approach is sufficiently sensitive to reveal differences between road lighting of different illuminance.
Footnotes
Declaration of conflicting interests
The authors declared no potential conflicts of interest with respect to the research, authorship, and/or publication of this article.
Funding
The authors disclosed receipt of the following financial support for the research, authorship, and/or publication of this article: Engineering and Physical Sciences Research Council (EPSRC) grant number EP/M02900X/1.
Acknowledgements
The authors wish to thank the BikeArlington partnership for providing access to the count data.