
Abstract
The development of an accurate control system for shading devices, essentially motorised Venetian blinds, relies on the rational use of daylight in buildings. This study proposes a control strategy for building lighting components, both daylighting and artificial lighting, to automatically adjust the light level in an office building as required and to block direct sunlight from entering the office, when necessary. The proposed control strategy is based on a hybrid statecharts model mainly consisting of a supervisory control system that chooses appropriate control actions for a current sky condition depending on the sky ratio and clearness index. These control actions are implemented to automatically adjust the blind height and slat angle, and turn on the artificial lighting only when needed. Real experiments in a test-cell demonstrate the effectiveness and flexibility of the proposed control strategy.
1. Introduction
The 2003 European Union (EU) Directive on the Energy Performance of Buildings showed that, statistically, residential and tertiary buildings were the largest users of energy in 2000, accounting for more than 40% of total energy consumption within the EU. 1 Daylighting provides a major opportunity for energy savings, but it also poses several technical problems, including glare and heat. Several studies have been conducted on the development of intelligent control systems for sun-shading devices including Venetian blinds, awnings and shutters. These include self-adjusting control systems for indoor environments based on the integration of thermal comfort and visual comfort, 2 self-adaptive adjusting parameters for daylighting and solar control of buildings, 3 combining control systems for shading devices and electrical light savings, 4 and indoor lighting controls based on fuzzy logic, 5 Koster estimated that the application of advanced control systems for building lighting components could decrease energy costs for buildings by 30–50% in most situations by providing adequate quantity and quality of daylight in interior spaces. 6 In recent years, Koo et al. 7 have presented a control method for automated Venetian blinds to maximise occupant comfort and the benefits of daylight in buildings, and Chan and Tzempelikos 8 have described the development of Venetian blind control strategies based on some pre-defined illuminance and light distribution while considering daylight provision, lighting energy use and visual comfort. However, there is still a room of improvement for better control of daylighting and glare provided through windows equipped with motorised Venetian blinds and of rational artificial lighting use in buildings. Most studies have been principally devoted to theoretical considerations, and less to the modelling of the dynamics of control applications in real buildings. For this reason, this paper presents an efficient control strategy based on a hybrid statecharts model that mainly consists of a supervisory control system that chooses appropriate control actions for a current sky condition depending on the sky ratio and clearness index. These control actions are implemented to automatically adjust both the position of the blinds and the angle of the blades on the basis of the required indoor illuminances and the sun’s apparent movement and position throughout the day and seasons. These motorised Venetian blinds are controlled in order to provide the room with daylight and to shade its space from sunlight (from glare or direct sun) while maintaining the indoor daylight to the required illuminance and the glare to an acceptable level. Moreover, the control actions of both the position of the blinds and the angle of the blades are coordinated in order to avoid overheating and overcooling of the room while ensuring occupants’ visual well-being and increasing building energy efficiency.
This paper describes an experimental study on the control and monitoring of lighting components in a test-cell. The design of an advanced control system often requires a mathematical model of the controlled plant or process in the form of a transfer function or state-space representation. The control accuracy and reliability of an advanced control system strongly depends on the accuracy and reliability of the model. For this reason, this study also covers the mathematical analysis and modelling of lighting components within a building.
1.1. Objective
The main objective of this work was to design a control system that created a comfortable indoor lighting climate in an office building while taking full advantage of daylighting and minimising energy consumption. Visual comfort is the main determinant of lighting requirements: sufficient levels of light for occupant activities and tasks to ensure and enhance visibility and visual performance in building spaces. Other factors such as age and gender are important for satisfaction with indoor visual comfort, but they are not considered in this study.
Several different control system designs were tested in order to take maximum advantage of (a) natural resources while maintaining the indoor climate of an office building at the desired, comfortable working conditions and (b) weather conditions by using passive devices during the occupied and unoccupied period.
2. Experimental study
A test-cell at the Delft University of Technology, the Netherlands (52°N, 4.1°E), was employed to investigate the integration of advanced control systems into building performance applications, especially in real time. The objective of this integration is to accomplish a comfortable indoor climate at the lowest energy consumption. The test-cell was of thermally light construction, had a double skin facade (DSF) oriented about 30° east, as shown in Figure 1(a) and (b). The internal size of the test-cell was 3.1 m × 1.9 m × 2.68 m, with a window of 3.1 m × 1.9 m placed 0.8 m above the floor. Next to the test-cell was the monitoring room, as shown in Figure 1(d).
Test-cell facility: (a) outside view, (b) orientation, (c) inside view, and (d) the monitoring room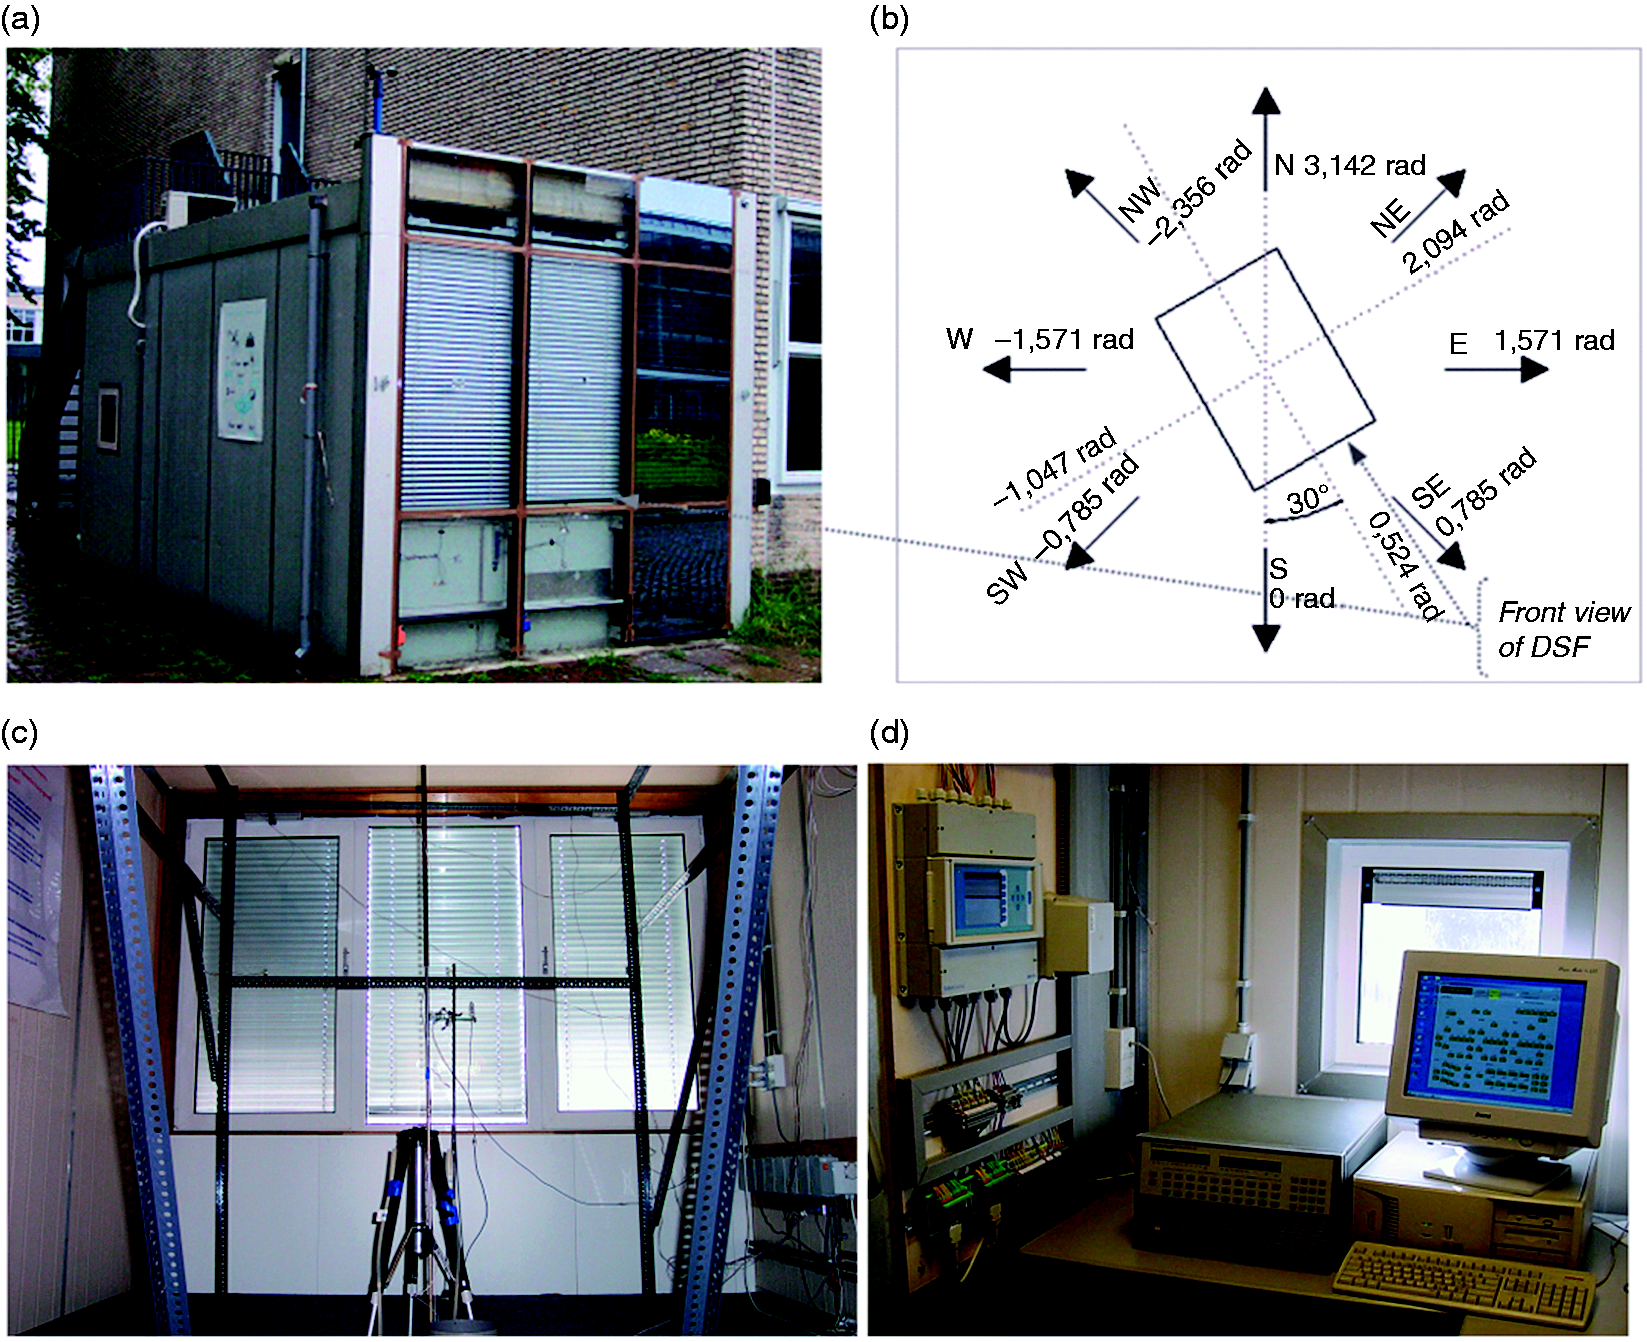
Next to the first skin facade was the cavity where the shading device (Venetian blinds) is placed. The shades served as blinds when the device is unrolled vertically along the first skin facade and as blades (i.e. blind slats) when the shading device rotates horizontally to face the first skin facade. Dampers (or valves) are placed at the bottom of the cavity to control the airflow through the cavity. Next to the cavity is the second skin facade, which is composed of transparent glazing panels on the right and middle sides of the facade, and opaque glazing panels on the left side of the facade. Figure 2 illustrates the section view of the test-cell, its monitoring room, and the devices that were remotely monitored and controlled from the monitoring room.
Section view illustration of the test-cell and its monitoring room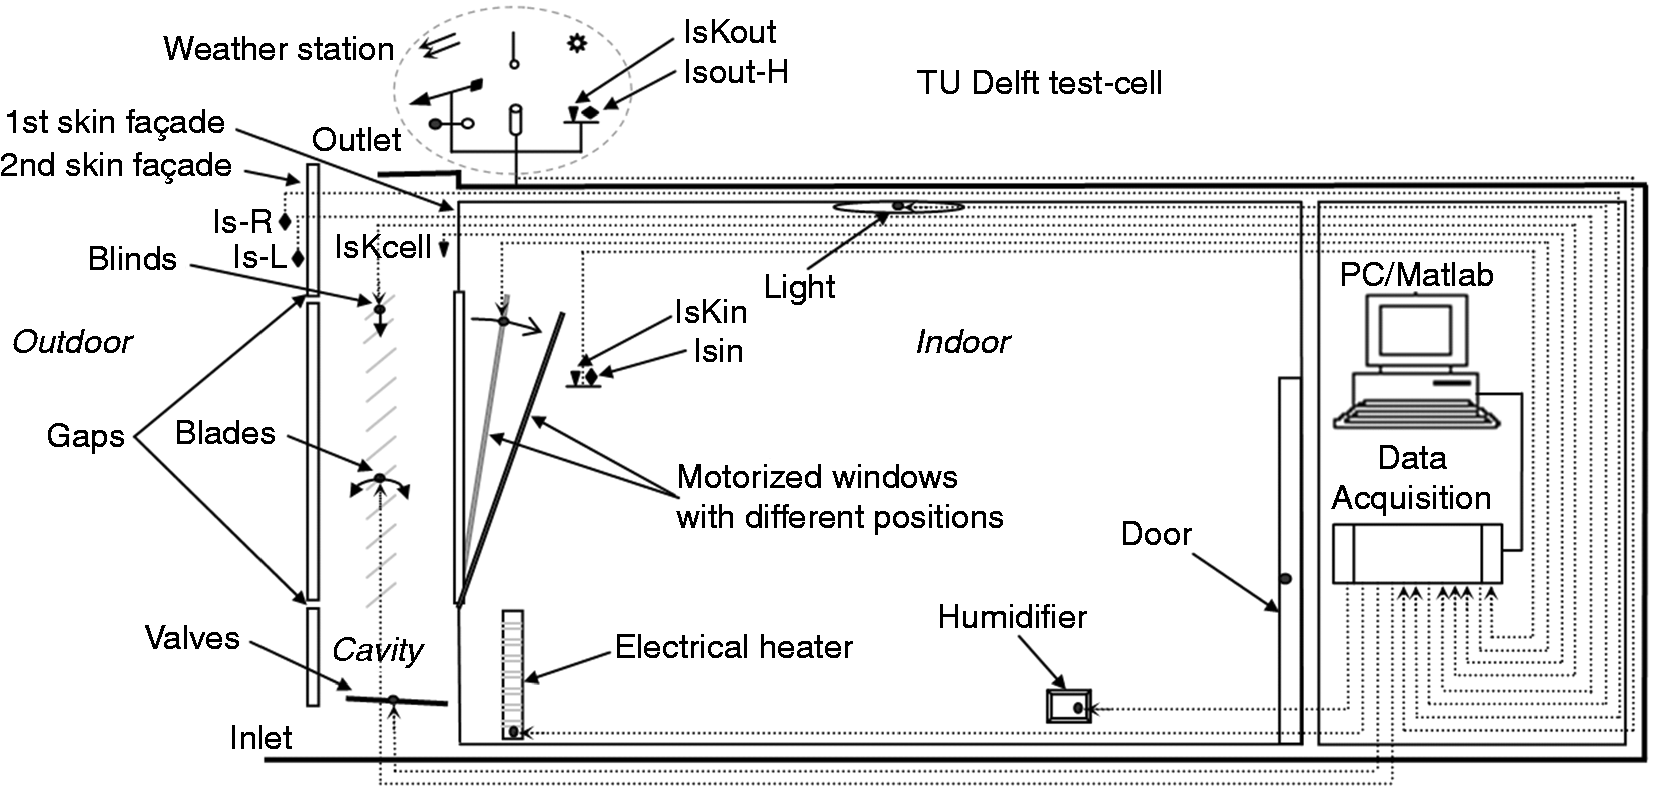
As shown in Figure 2, the test-cell was equipped with a number of sensors including the lighting sensors where: IsKout is the solar radiation sensor placed outside the test-cell; Isout-H is the light-intensity (or illuminance) sensor placed outside the test-cell and oriented horizontally; IsKin is the solar radiation sensor placed inside the test-cell; Isin is the light-intensity sensor placed inside the test-cell; IsKcell is the solar radiation sensor placed on a vertical position to the wall of the test-cell; Is-R is the light-intensity sensor placed on a vertical position to the right side of the test-cell window facade; and Is-L is the light-intensity sensor placed on a vertical position to the left side of the test-cell window facade. This test-cell was also equipped with several actuators including electrical heater, air-conditioner, humidifier, motorised windows, dampers, Venetian blinds, artificial lighting, and mechanical ventilation (fan for exhaust or air supply). Matlab/Simulink was installed on the computer located in the monitoring room to control different actuators placed in the test-cell. The control systems regulating the devices in the test-cell were developed, implemented and called by the TestPoint program, which was developed to display and record all data from all sensors and actuators.
2.2. Components of the test-cell
2.2.1. Double skin facade
The DSF consists of the outer (or second skin) facade, the cavity, and the inner (or first skin) facade. The second skin facade is generally used to provide protection against the weather and external noises. It also contains openings at the bottom and top of the facade for ventilation of the cavity and the test-cell. While the opening at the bottom of the facade can be subjected to the effects of the wind, the opening at the top is not. Therefore, the airflow in the cavity is activated by solar inducted thermal buoyancy, the effects of the wind, and mechanical ventilation.
9
The two panels of the window surface were remotely controlled from the computer and were operated by electric motors that were hinged on the top frames of windows, as shown in Figure 3. The total surface area of the window opening in the test-cell was (0.18 m * 1.86 m) + (0.18 m * 0.973 m). Each window could open up to ∼0.51 m2.
Window opening in the test-cell (left) and its equivalence in surface area (right)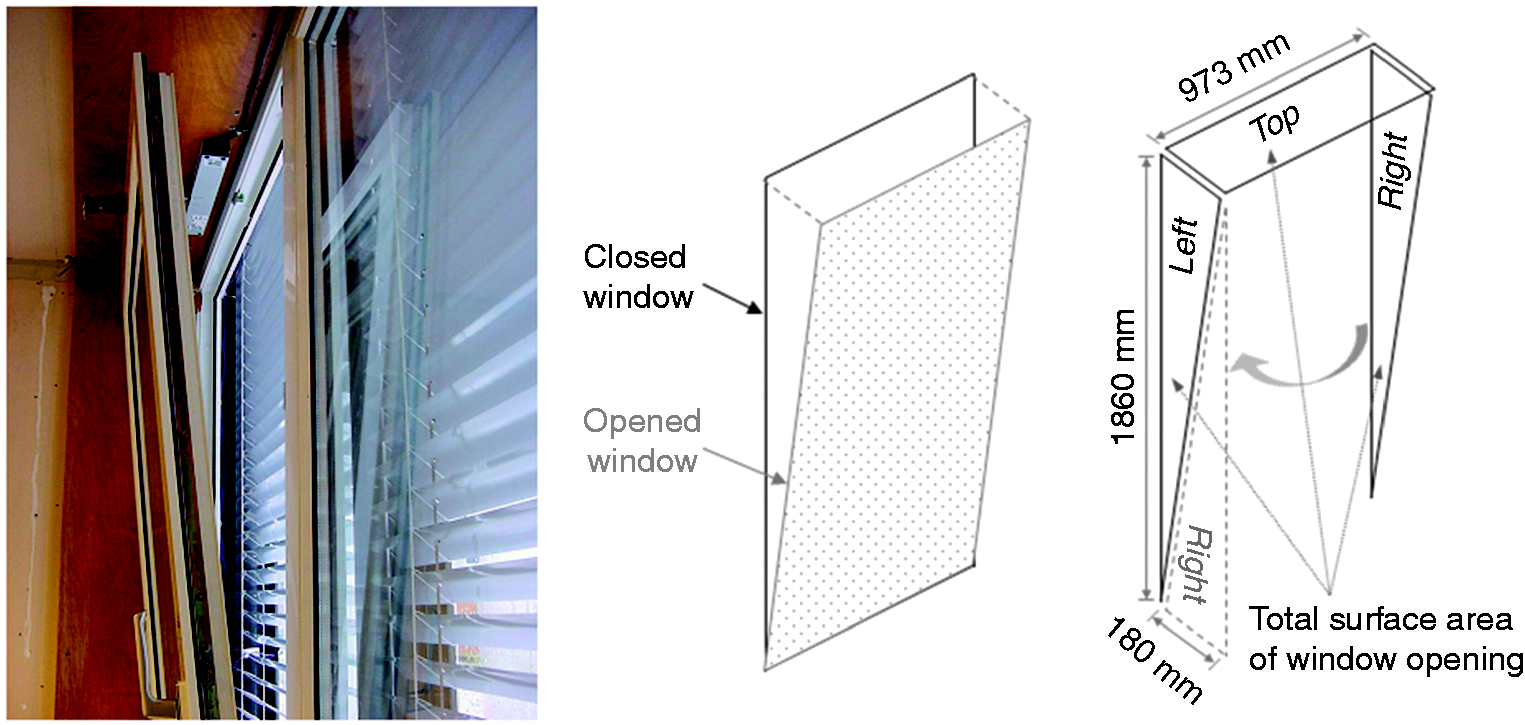
The Venetian blinds were mounted in the cavity between the first skin and the second skin facades. The distance between the total window surface and the Venetian blinds was around 50 mm. The Venetian blinds were equipped with electric motors performing two types of movement: (a) the rolling up or down of the blinds and (b) the rotation of the blades (slats). It was possible to adjust both the height of the blinds and the angle of the blades to any position. When the Venetian blinds are rolled down, the U-value of the window surface decreases from 2.7 W/m2 K to 1.9 W/m2 K.
2.2.2. Lighting, heating and air-conditioning components
The lighting components in the test-cell included a standard ceiling-mounted luminaire containing two 36 W fluorescent tubes. Both lamps were placed in the middle of the ceiling and regulated (i.e. switched on or off) from the computer.
An electric radiator was located in the middle of the test-cell near the northeast-facing wall to supply heat to the test-cell. The full power of the radiator was 1750 W. A Daikin Split-Sky indoor air conditioner was installed above the door of the test-cell for an air-cooling supply. The full power supply of the cooler was 700 W. All of the components used to control the indoor processes in the test-cell were monitored and operated from a computer.
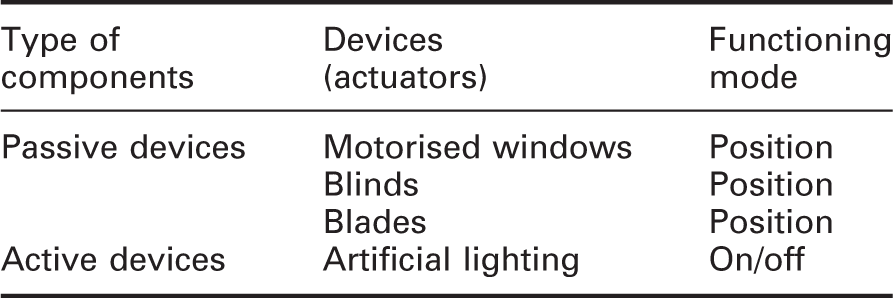
2.2.3. Functioning mode of test-cell components
Functioning mode of the passive and active components used in the test-cell
The visual comfort in the test-cell is principally determined by the artificial lighting from the luminaire and the glare from direct and indirect sunlight. According to the CIE, 10 the recommended illuminance for general office work should be around 500 lx. Two daylight levels (lower and upper) were used for the control systems in order to provide the room with sufficient daylight as much as possible. These daylight levels were determined through the estimation of the daylight factor, a percentage of the internal illuminance at the working plane to the external illuminance. The CIE recommends an average daylight factor of 5% and a minimum daylight factor of 2% for office work. 10
2.2.3.1. Artificial light mode
The artificial light mode is active when the indoor illuminance in the test-cell is lower than the set point. In principle, this mode was used to provide enough light into the room to complement the indoor daylight level when the indoor daylight level was lower than required during occupancy. The control systems were designed to use daylight as the primary source of indoor illumination and electric lighting as a supplementary source. Because the electric lighting used in the test-cell was not dimmable, the amount of light output supplied inside the room could not vary according to the sunlight. Hence, when the artificial light mode was active, the electric luminaire of the test-cell was switched on.
2.2.3.2. Natural light mode
The natural light mode was active when natural light was provided from the sun and/or sky. This possibility was valid only when the illuminance and solar radiation sensors located outside the test-cell indicate that there was sufficient daylight. To satisfy the requirements of visual comfort and good visibility, control systems for motorised Venetian blinds must be developed and designed in such a way as to exploit the daylight during the day and optimise it in terms of the required indoor light level and distribution in a building space without causing discomfort for the occupants.
The sun’s position can be calculated from the location of a building on Earth (longitudinal and latitudinal) and the position of the Earth towards the sun’s declination. According to de Jong and Brink,
11
the sun’s declination is approximately determined as follows:

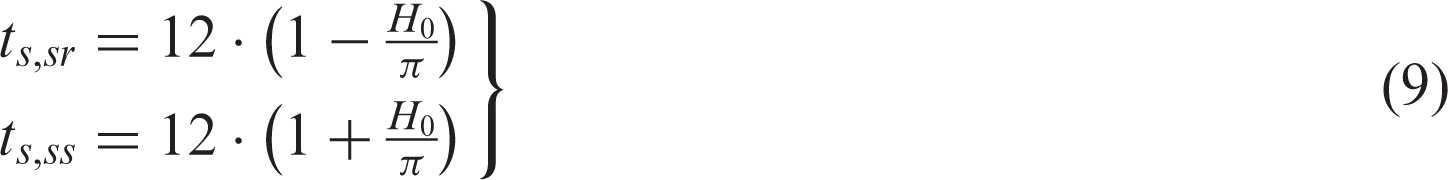
To determine the sun’s position in the sky from a position on Earth, two solar angles must be calculated throughout the day. The solar altitude angle β (°) is the angular distance between the sun and a horizontal plane at the location of the test-cell. The solar azimuth angle α (°) is the angular distance between the projections of the radiation beam on the horizontal surface from south to east. According to Duffie and Beckman,
12
solar time is the time used in the entire sun angle relationships, which can be related to the local time as follows:


Solar radiation falling on the facade of a building (or test-cell) located at a specific position on each is considered to consist of two parts: (a) deterministic, i.e. determined by the position of the sun towards the position of the building, and (b) stochastic, i.e. caused and characterised by clouds and other forms covering the facade of the building. This position is given by ψ, which is the angle between the normal to the facade and the direction towards the south, and αw, which is the angle between the normal to the facade and the vertical axis of the facade. The position of the facade towards the sun comprises the solar surface azimuth γ and the incidence angle of the direct solar radiation θ. The solar surface azimuth γ is defined as:
13

2.2.4. Visual comfort criteria
The visual comfort provided in the test-cell was based on the estimation of both the daylight level and glare occurrence. Whereas the daylight level is calculated by the daylight factor, the glare is quantified by the daylight glare index (DGI), which depends mainly on the window luminance and reflections within the room. The DGI equation is derived from experiments, which in particular provide guidelines and recommendations for choosing the type of shading devices and lighting installations. DGI is defined as follows:
17
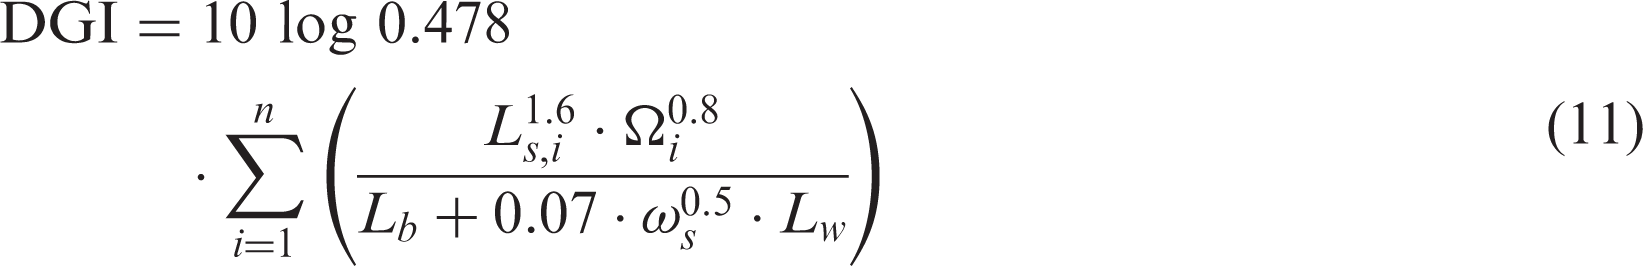
The control system should be designed in such a way that glare caused by a direct view of the sky is considered to be acceptable if the DGI in the test-cell does not exceed 22, which is the upper limit of comfortable glare perception.17,18
According to Aizlewood,
19
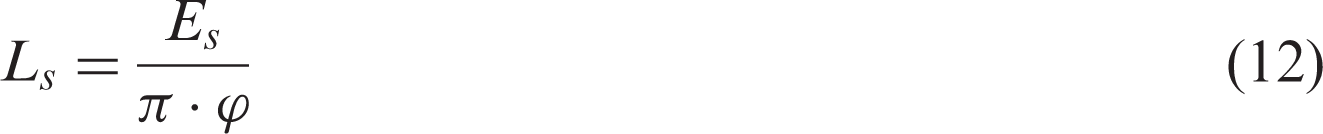
Ls, and Lb can be derived from shielded and unshielded vertical illuminance, respectively, and are thus determined as follows:

Note that the DGI was chosen to describe the glare, because it is mainly based on the perceived analysis of the sky viewed through the window and the average luminance of the area, although there are also other metrics such as daylight glare probability and degree of discomfort glare. Those other metrics are based on perception tests, which are complicated to set up for instantaneous use by control systems. Therefore, DGI is the appropriate indicator to use for the glare control.
For the illuminance, the CIE recommends a minimum value of 500 lx on the workplane in office spaces.
10
Because the illuminance sensors were placed vertically on the window surface, the required minimum illuminance on the window surface can be related to the value on the workplane as follows:

According to Iglesia, 20 the measurements of the illuminance sensors used in the test-cell are accurate only if the underlying data are recalibrated using a linear regression equation of 800 Ew + 4300 (lx), which implies Ew,min is approximately equal to 5.2 klx. As the CIE 10 also recommended a maximum illuminance of 1000 lx on the workplane, the maximum illuminance on the window surface (Ew,max) is approximately equal to 6.1 klx. Therefore, the control system for visual comfort in the test-cell was designed to maintain the window illuminance between the lower and upper levels of 5.2 klx and 6.1 klx. It also monitored the light falling onto the horizontal workplane in the test-cell with the least possible obstruction, by automatically adjusting the position of the blinds and the angle of the blades.
3. Design method and control
3.1. Hybrid statechart model
The concept of hybrid statecharts is based on a mathematical formalism derived from hybrid (or dynamic) systems theory that emphasises the integration of continuous-time dynamics and finite-state automata into the same formalism.
21
A hybrid statechart may have multiple concurrent states, which are expressed as recognisable situations, and may be accompanied by (a) conditions that are optional Boolean expressions but that must be true when a transition occurs, (b) events that cause a transition from one state to another, (c) actions that result from a state change and (d) default transitions that are used to specify which states are initially active. In addition to states and transitions, a set of differential and algebraic equations can be associated with a simple or composite state of the hybrid statechart, for which a condition is specified over continuously changing variables as a trigger for a transition. This set of equations and triggers is defined by the simple state and all its containers. Figure 4 shows a typical example of a hybrid automata chart that describes the evolution in time of the values of a set of discrete and continuous-state variables. Consequently, by using hybrid statecharts, it is possible to model and represent a wide range of phenomena present in building processes and dynamic plant models where Q is a set of discrete states, X is a set of continuous variables, Hybrid automaton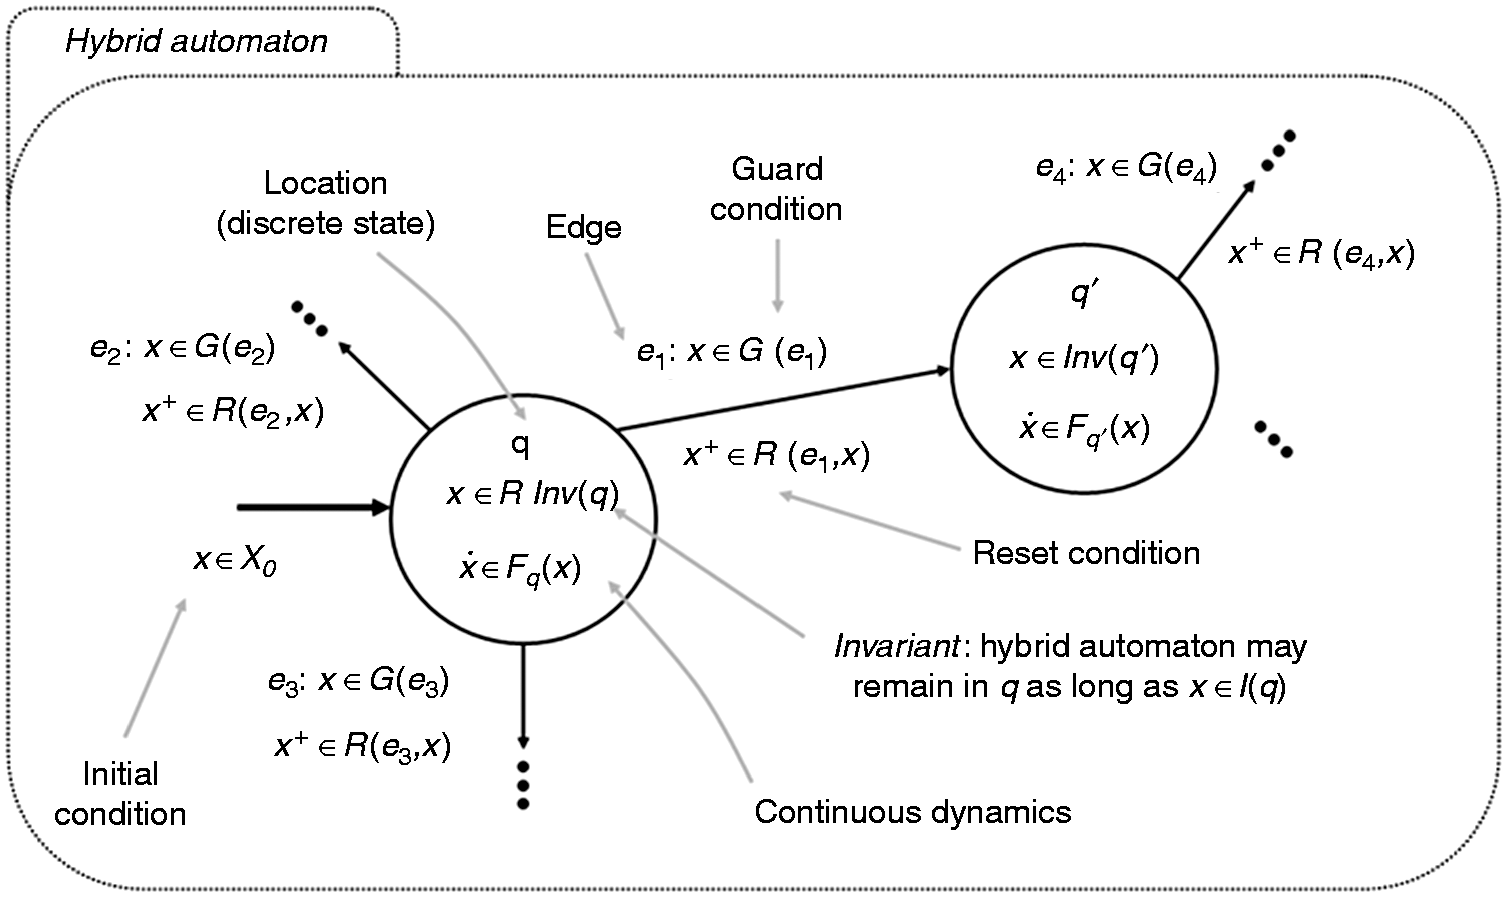
3.2. Active control strategy
Glare is mainly caused by the reflection of direct sunlight and can be controlled by correctly operating the shading devices, especially the Venetian blinds. Control of glare is typically achieved by adjusting the position of the blinds and the angle of the blades. However, the adjustment of the position of the blinds and/or the angle of the blades when the sky is overcast or completely full of clouds may be unnecessary as it may obstruct the occupants’ view of the outside world. In addition such adjustments may make noises and disturb the occupants. For this reason, a control strategy was developed to automatically operate the Venetian blinds in the test-cell, taking into account sky conditions during the working hours.
Classification of sky condition
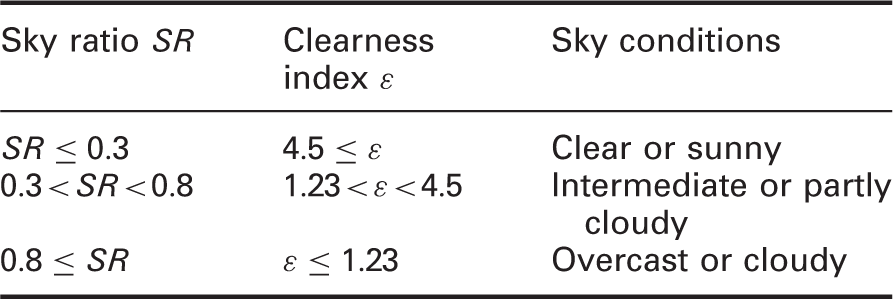
The sky ratio SR is expressed as follows:
The clearness index ɛ is defined as:

The application of a hierarchical control system to daylighting and solar-shading devices calls for the design of a continuous control system for every sky condition and a supervisory control system switching between the three control systems, depending on the sky ratio and clearness index. Figure 5 illustrates a two-level hierarchical control system for daylighting applications.
Proposed control strategy for artificial lighting and natural daylighting applications in the test-cell – using a hierarchical control system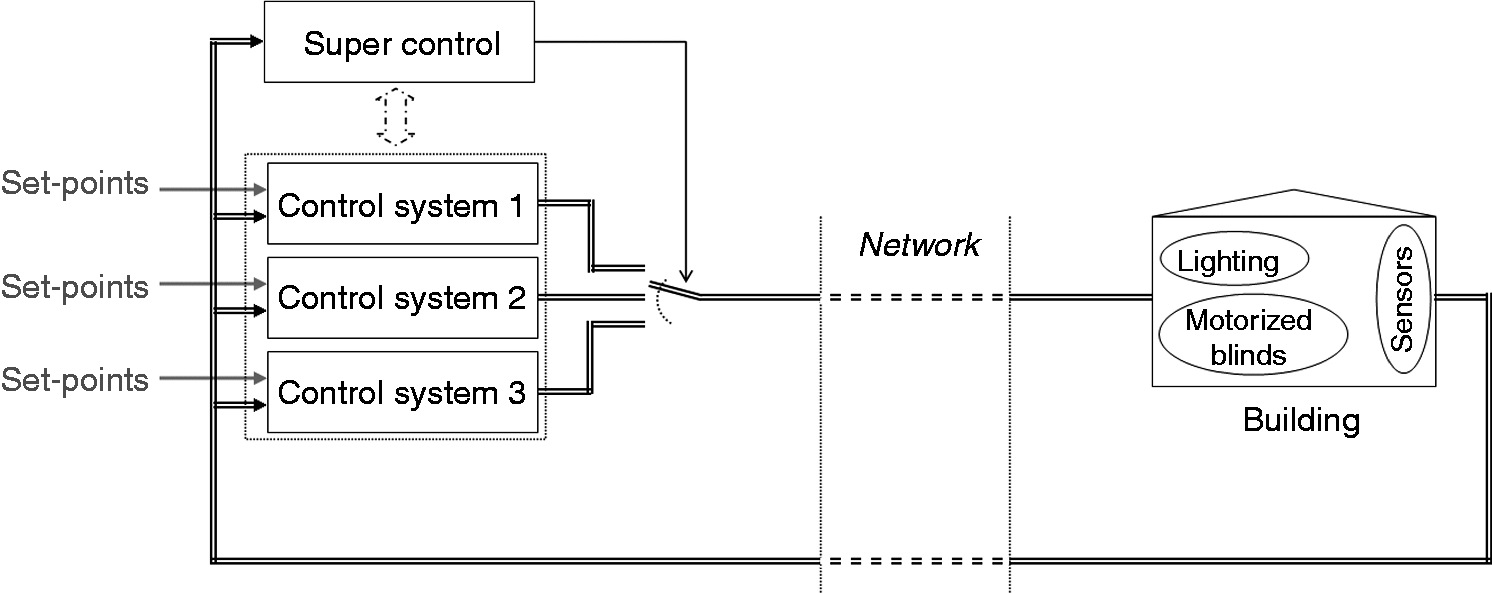
A supervisory control system (or supervisor) decides which of the three control systems should be active at any instant depending on the availability of daylight. The purpose of this supervisor is to choose between the three control systems as to which one is best able to maintain the indoor illuminance at the set point or between the set points so as to provide the room with daylight as long as possible during working hours and to stabilise the illuminance.
When the first control system is active it retracts the Venetian blinds, and if necessary switches on the artificial lighting, to bring the indoor illuminance provided by daylighting up to the set point, in which this can be expressed as:
28


The second control system automatically adjusts the position of the blinds, and if necessary the angle of the blind slats to provide the room with sufficient daylight. As the system is active only when Ein > Est,up and when the sky is intermediate to partly cloudy, glare control is often unnecessary. The third control system automatically adjusted both the blind positions and the blade angle.
For buildings equipped with a DSF, solar radiation is influenced by the first and second skin facades, as well as the Venetian blinds. In the test-cell, the Venetian blinds are placed externally between the first and second skin facades. To quantify the impact of solar thermal heat, a simple thermal model of a DSF equipped with a Venetian blind was defined. The power balance of heat brought into the room per square metre of windows can be expressed as follows:
30


Equation (19) was developed for application to different weather conditions to describe the responses of thermal and visual aspects under situations with the blinds closed or open, which is possible by simply introducing the Venetian blind occlusion levels, which can be categorised in ten or more steps. One way to determine whether opened or closed blinds have a large impact on the power balance of windows is to add a weighting factor to the calculated position of the blinds. This factor can be obtained from the derivative of Pw versus fc. For example, Guillemin 29 used equation (19) to compare visual and thermal optimisation to determine the heat/power balance of a window, by choosing defined blind positions for various cases (summer, winter, sunny and cloudy). However, the desired value of Pw sometimes cannot be achieved during daytime in the summer (i.e. to have Pw less than zero). Therefore, a new control method was developed to automatically adjust both the blind’s position and the blade’s angle, according to the current sky conditions, the workplane illuminance, and the sun’s apparent movement according to the season and time of day.
3.2.1. Position of blinds
For a control system to maintain the work plane illuminance with skylight and sunlight at the reference point i, the position of the blinds must be determined based on the basic geometry of the building’s location relative to the sun’s position. The control system must prevent direct sunlight penetration into the room while maximising the daylight benefit. Therefore, a mathematical model was developed for use by the control system to determine the position of the blinds according to the sun’s position. Figure 6 illustrates an example of the basic geometry of the position of the lower end of the blinds, where lb is the position of the blinds, Hc is the height of the blind cover, Hb is the height of the blinds, Hd is the height of the workplane, Hw is the height of the window wall, Db is the distance between the blind placement and the y-axis and Dy is the distance from the y-axis to the workplane illuminance at the reference point i.
Main components to determine the position of the Venetian blinds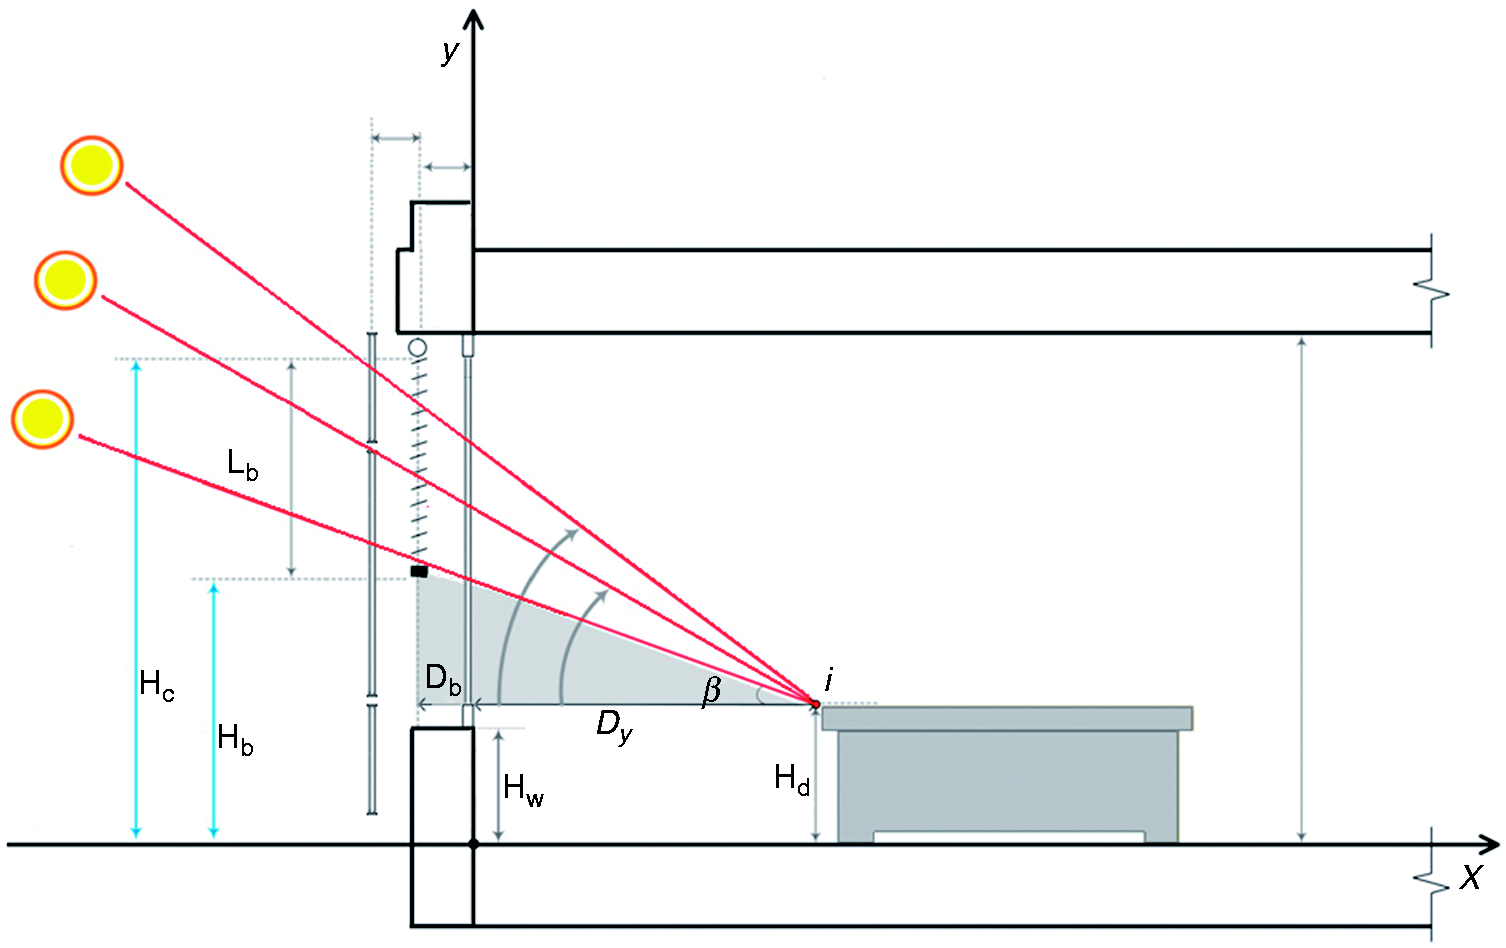
A mathematical model for the position of the blinds as a function of the distance from the blinds to the workplane illuminance reference point i, the sun’s position, and the hour of the day can be expressed as:

Because the position of the blinds should be expressed as a percentage from 0% to 100%, a mathematical relation was developed to obtain the percentage equivalent of lb:

3.2.2. Angle of blades
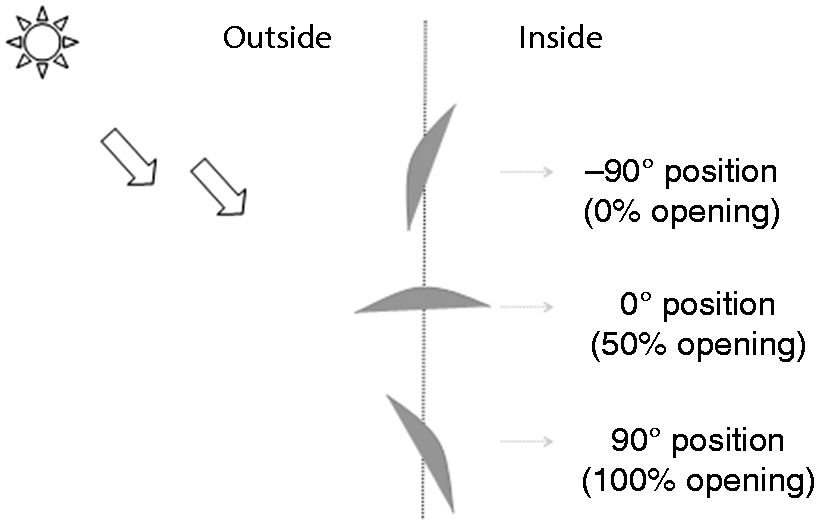
For a control system to prevent direct sunlight penetrating through the window by automatically adjusting the angle of the blades, the angle must be determined in terms of the current sky condition and the sun’s apparent position. Therefore, a mathematical model was developed to appropriately tilt the blades. The blade angle can be set to the horizontal position (i.e. tilted at 0°) or rotated either in the negative direction (anticlockwise) or in the positive direction (clockwise). Due to the fact that the position of the blades can change from 0% to 100% in step increments of 6° as their angle varies from −90° to 90°, the motorised blades can be swivelled into three different situations (see Figure 7):
Blades are tilted downward (−90° to 0°), the range of percentage opening is between 0% and 50%. Blades are tilted to a horizontal position (0°), the percentage opening is 50%. Blades are tilted upward (0° to 90°), the range of percentage opening is between 50% and 100%. Example of different positions of the blades opening
A mathematical relation has been developed between the position and angle of the motorised blades and is expressed as follows:

3.3. Daylight illuminance calculation
The indoor illuminance provided by daylight through window blinds consists of a component of illuminance received directly from the window (i.e. the part of the window not covered by the Venetian blinds) and other internally reflected components (i.e. from the part of a window covered by the Venetian blinds). To calculate the indoor illuminance provided by daylight through a window blind, the total window blind surface of the test-cell should be divided into two parts: covered and uncovered.
Figure 8 illustrates a situation in which the sun filters through a window partly covered by Venetian blinds and sunlight from the sky patches da1 and da2 contributes to the illuminance at a point i on a horizontal plane. The luminances of the sky patches are a function of the relative positions of the sun and the sky patch, the angular distance between the sun and the sky patch, and the blind’s position. Sky patch da2 is allocated to the covered part of the total window surface and positioned following h2, d2 and w2, whereas sky patch da1 is allocated to the uncovered part of the total window surface and is positioned following h1, d1 and w1. The distance from reference point i to the window surface is D, and the coordinates of the lower-left and lower-right corners of the window with respect to the reference point are WL and WR, respectively. Given that β is the solar altitude angle, then β1 = β2 and WW is the window width, HW is the window height and lb is the covered part of the total window surface.
Configuration of luminous flux from the sun and sky patches da1 and da2 passing through the covered and uncovered parts of the window and reaching the point i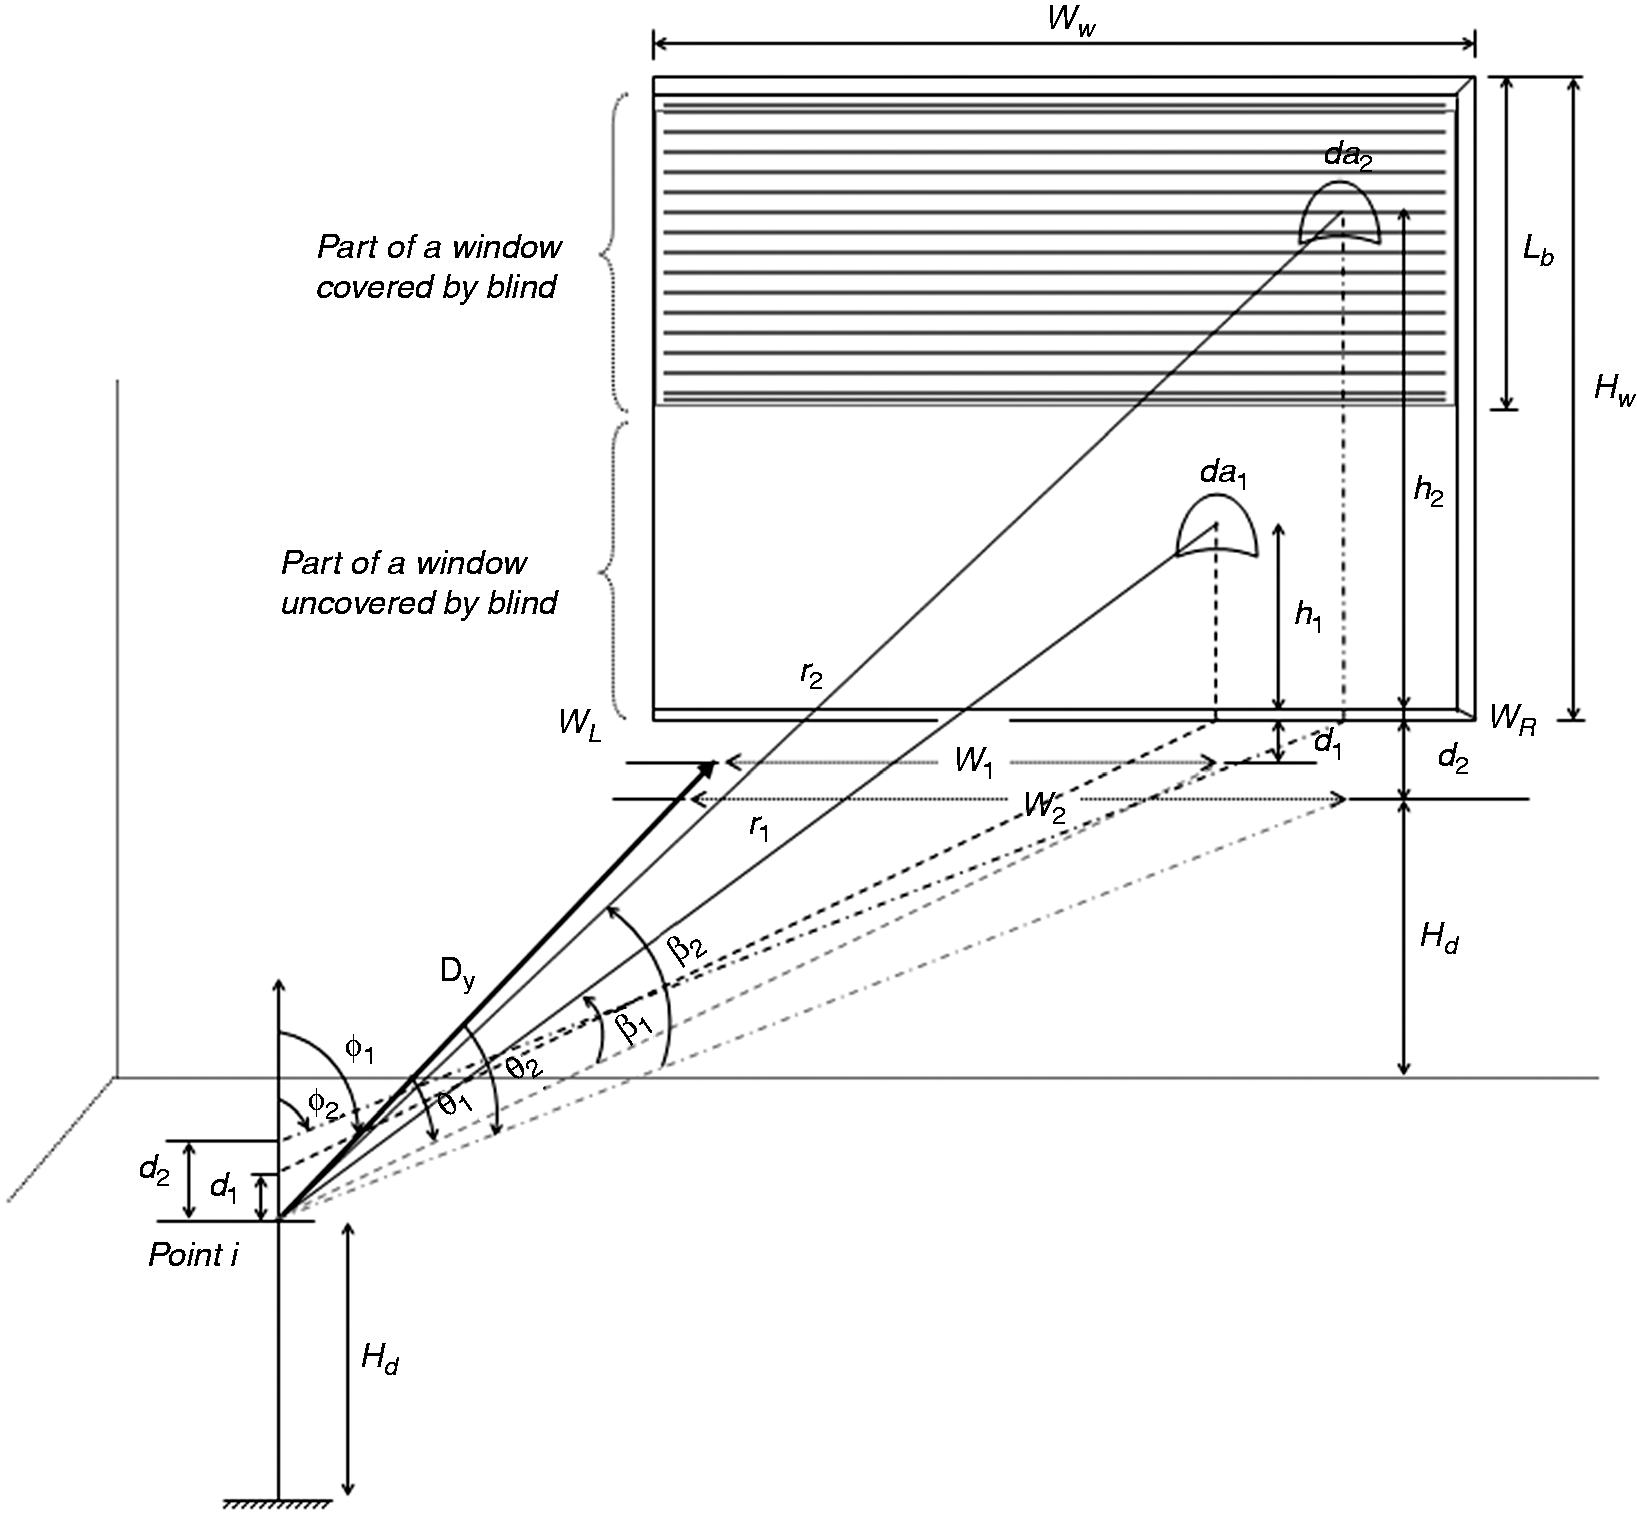
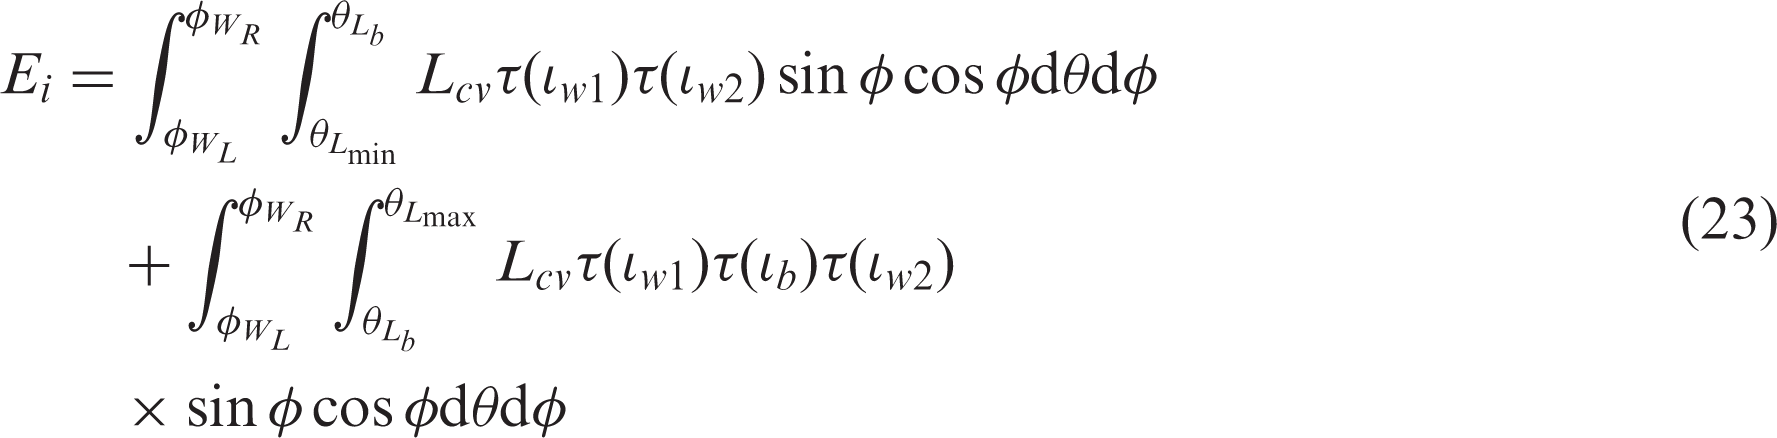
The configuration shown in Figure 8 is constructed in such a way that when the Venetian blinds are completely open and reveal the total window surface, only the luminous flux from sky patch da1 contributes to the illuminance at point i. When the Venetian blinds are completely closed and cover the total window surface, only the luminous flux from sky patch da2 contributes to the illuminance at point i. Therefore, the total average indoor illuminance contributed from skylight and sunlight can be determined as follows:
A hybrid statecharts formalism was applied to model the motorised functions of the Venetian blind. Because the motorised functions controlled the position of the blinds and the angle of the blades, the hybrid statecharts model consisted of two sub-hybrid statechart models. Whereas the first model contained four discrete states – up, deployment, retraction and down – and was applied to control the blind’s position, the second sub-hybrid statecharts model covered three discrete states – downward movement, horizontal position and upward movement – and was applied to control the blade’s angle. In addition, the hybrid statecharts model was designed in such a way as to take full advantage of daylight when the sky conditions appear clear or sunny. Both models contained several states, which could be accessed from other states only when a transition linked them. The states of the second sub-hybrid statecharts model used for control of the blade’s angle were only active when the blinds was not entirely up, as there was no control action for the blades at this position.
3.4. Modelling and synthesis
This section deals with the modelling and synthesis of automated control systems for test-cell performance applications, including the lighting components. These automated control systems are modelled on Matlab/Simulink so that a Matlab programme is written to read data inputs from the test-cell sensors and write data outputs to the test-cell actuators in real time through the TestPoint data acquisition software. This Matlab programme should also exchange all necessary data with a Simulink model, as illustrated in Figure 9.
A Simulink model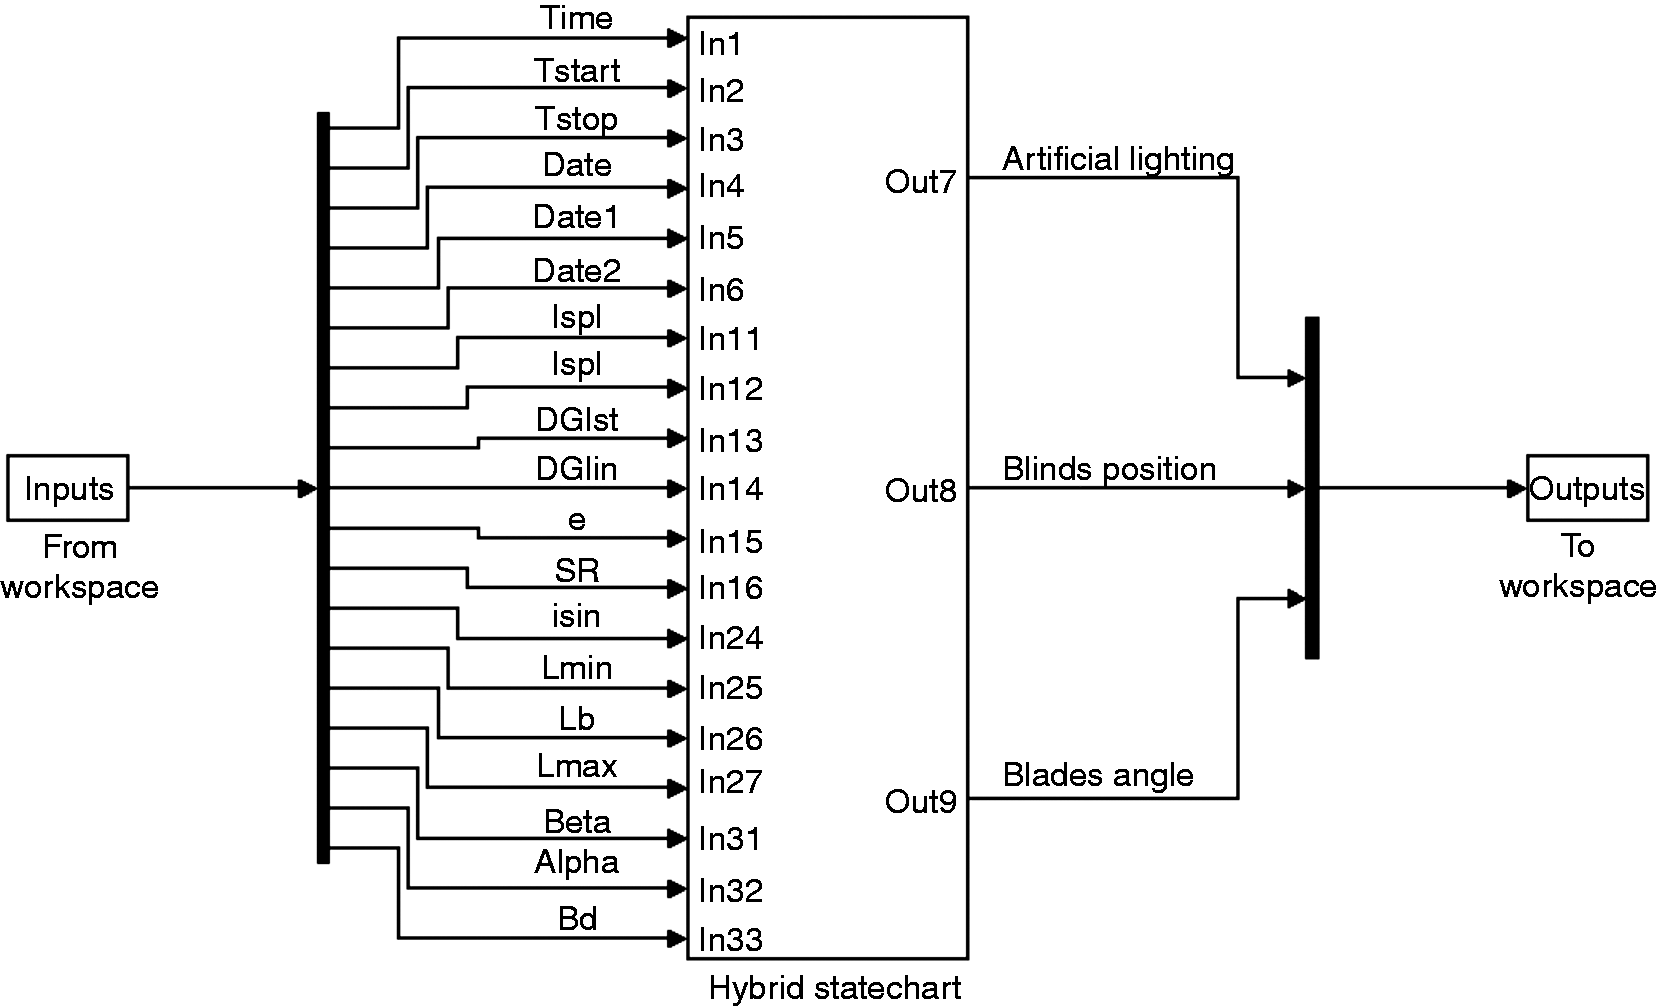
The development of the Simulink model is generally simple, since it contains only inputs that must be read from a Matlab programme, outputs that must be written back to the same Matlab programme, and a single block of the designed control system. The inputs consist of data read from the test-cell sensors and other required variables, i.e. results obtained from analyses and numerical calculations, to be used by the control system. The outputs consist of data outputs that a Matlab programme must send to the test-cell actuators. The control system at the high level of design appears simple and straightforward, although there is much complexity at the lower level of the design, as shown in Figure 9. As a result, this control system is modelled in the form of a hybrid statechart. Figure 10 illustrates the modelling of hybrid statechart.
A hybrid statechart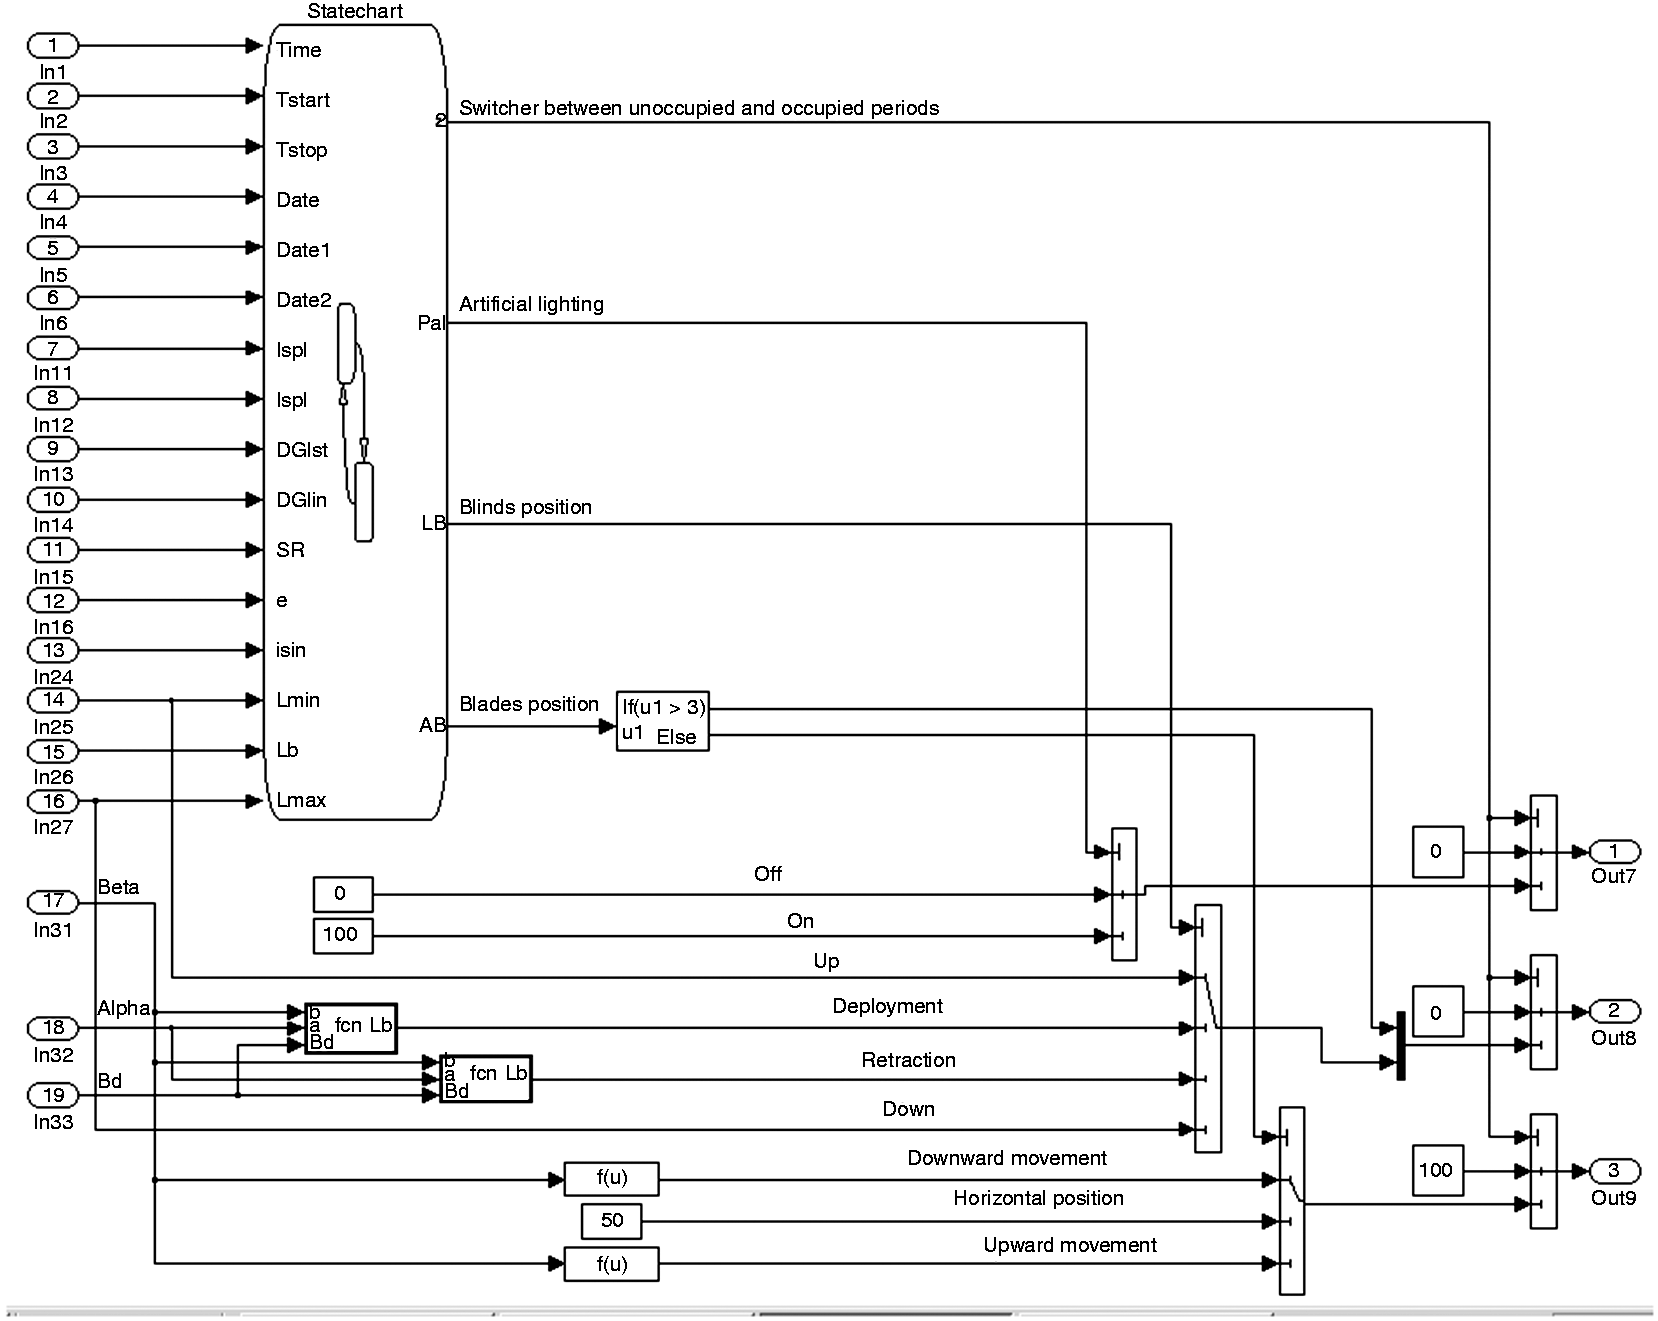
The lower level of design of the Simulink model (i.e. the sub-Simulink model) appears to be more complex because it provides modelling for the hybrid statechart by mixing continuous-time equations with discrete outputs delivered by the statechart model. Both continuous-time equations and discrete-state events were modelled on Simulink. However, discrete-state events were modelled as a single Simulink block using the Stateflow tool book. This single Simulink block is called the Stateflow model, which is a composed model at the lower level of design.
This statechart model is composed of two discrete states: unoccupied and occupied. By default, the unoccupied state was set to be active, but once the current date and time coincide with those indicating that the test-cell was occupied, a transition occurred to the occupied state. When the test-cell is unoccupied, all of the actuators are set to their default positions, but when the test-cell was occupied, the positions of the actuators were automatically adjusted according to the occupants’ references and the current situation in and around the test-cell. At this level of design, the occupied state appears to be single, but at the lower level of design, it is complex and contains several substates and sub-substates, as shown in Figure 11.
Occupied state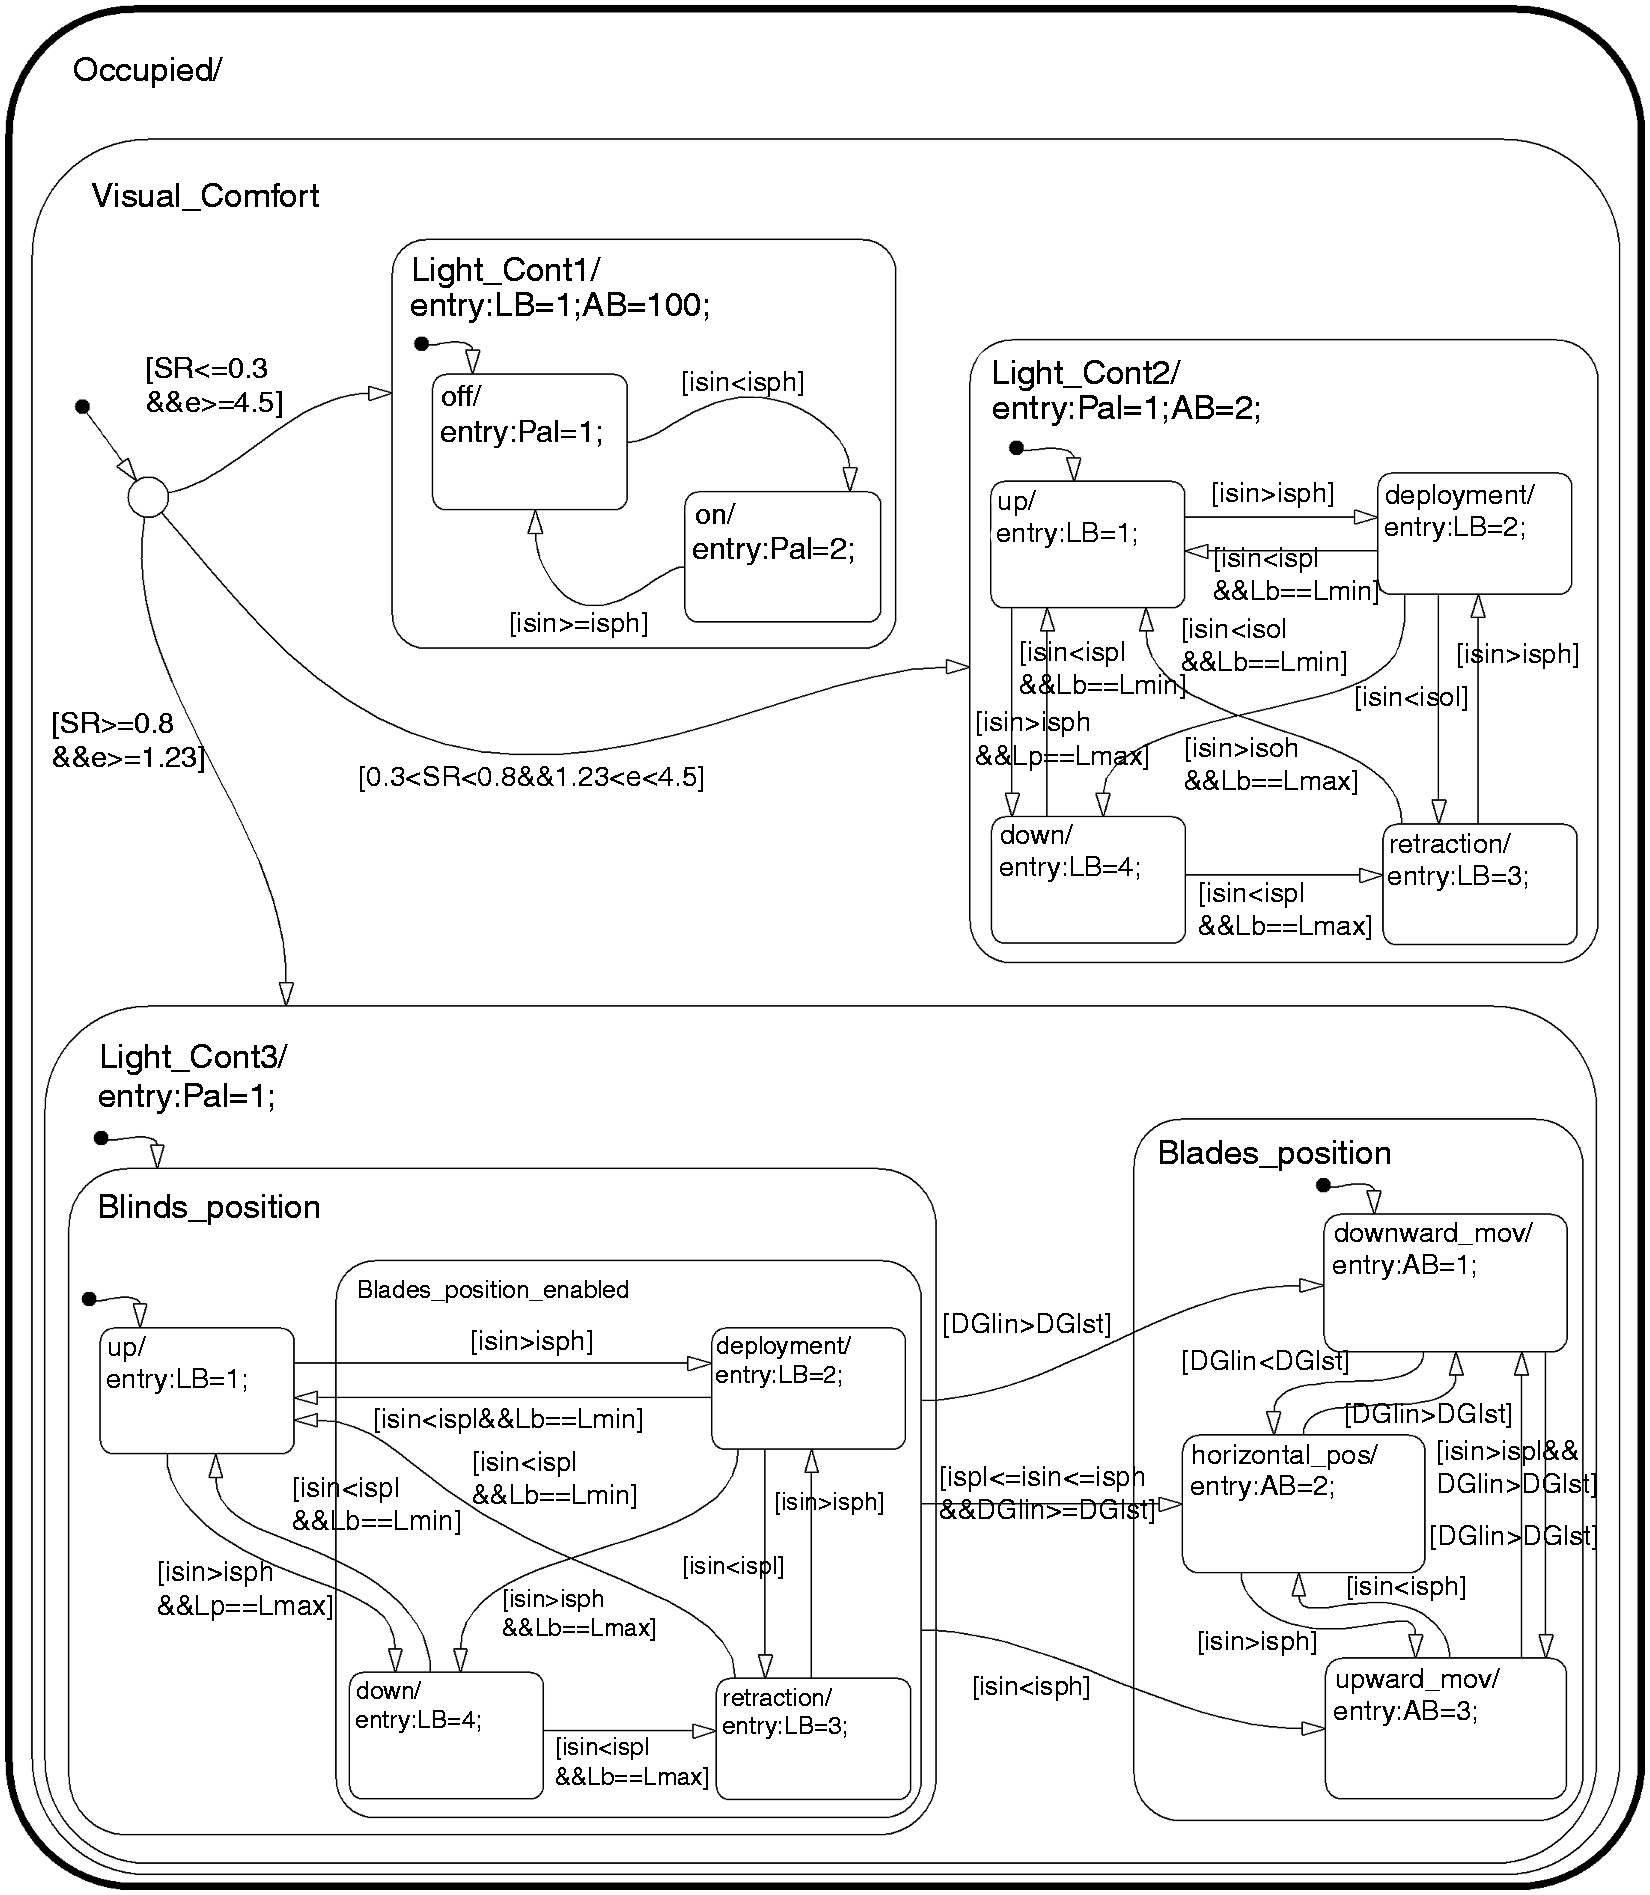
Inside the occupied state, there were three main states: thermal comfort, visual comfort and indoor air quality. In each main state, there were a number of substates that characterise the functioning of different modes in the test-cell. In this case, the mode could refer to lighting control strategies, in which there were several sub-substates characterising the functioning of the motorised windows, dampers, Venetian blinds and artificial lighting. All actuators were modelled at different levels of abstraction, in which their models were a composition of several modules that operate concurrently. Consequently, the way to model the functioning of different actuators in the test-cell was based on a hierarchical concept to deliver and assure scalable, modular, and flexible automation.
The following gives a brief description of the most frequent variables (inputs, outputs and additional variables) used by the hybrid statechart model:
The inputs are data read from TestPoint data acquisition, taking into account the current time and date, the low lighting level set point, the high lighting level set point, the current indoor light intensity, and the current outdoor light level. The outputs are data written to the TestPoint data acquisition, taking into account the position of artificial lighting, the adjusted position of the motorised blinds and the adjusted angle of the motorised blind slats. Additional variables are data read from a Matlab problem, taking into account the start and ending time of the occupied period, the date, the DGI set point, the actual estimated DGI, the actual estimated sky ratio, the actual estimated clearness, the signal switching between unoccupied and occupied periods, the minimum, maximum, and actual position and angle of the motorised blinds and blades. Most of these additional variables are used as internal inputs.
The continuous dynamics were modelled in Simulink, and the discrete-state events were modelled in Stateflow. No control actions were taken during the unoccupied state. By default, all actuators in the occupied state were set to the default position (off, closed, up and downward). When a transition occurs, an actuator was automatically switched from one state to another, and its output was adjusted as appropriate to meet the set point.
For visual comfort, a control system automatically first switches between the three lighting control strategies based on the estimated sky ratio and clearness, and then regulates the artificial lighting and the position of both the motorised blinds and blades to meet the desired DGI and indoor illuminance.
In summary, Matlab together with Simulink and Stateflow provided excellent modelling capabilities for large-scale building control applications, particularly for applications mixing continuous-time and discrete-state domains. A Simulink model interfaces very well with the Matlab environment, while allowing the use of a high-level interpreted language primarily intended for numerical computations.
4. Results
A series of experiments was carried out in the test-cell, particularly in the winter and summer periods, to assess the application of the automated control strategies, and to evaluate the control response in real-time throughout the occupied period. The experiments were performed using a different number of time steps for the winter and summer periods, which were 30 seconds and 60 seconds, respectively. The same automated control strategies were applied.
Figure 12 shows the sun course during the day (3 July) on which the experiments were performed in the summer period.
Calculation results of the sun position and height for 3 July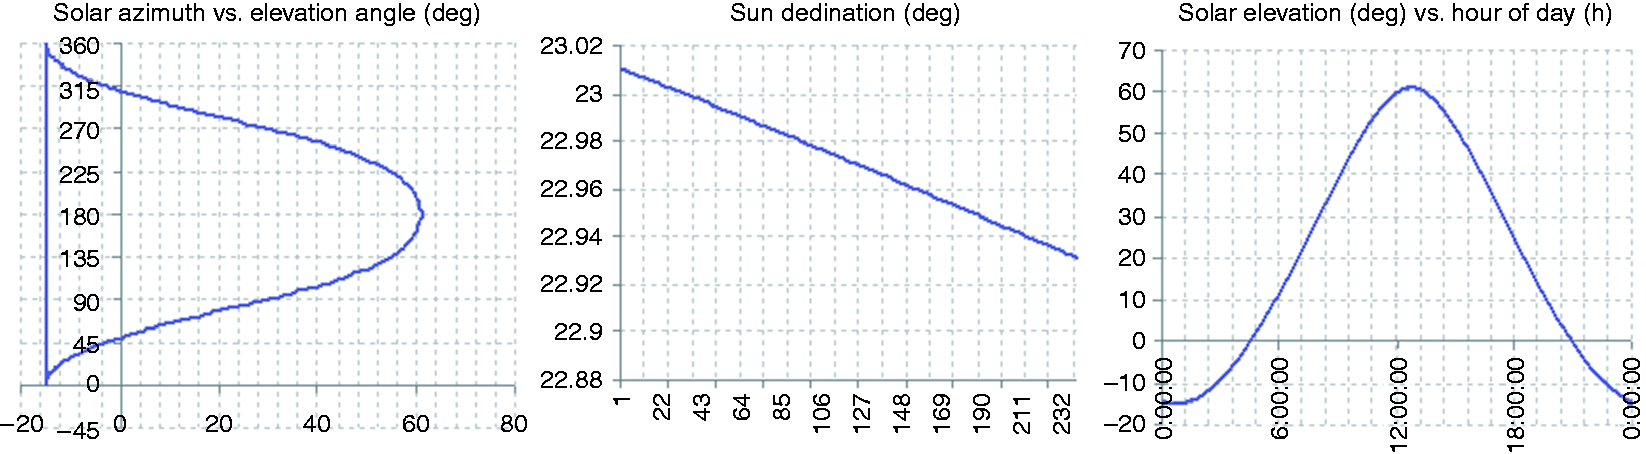
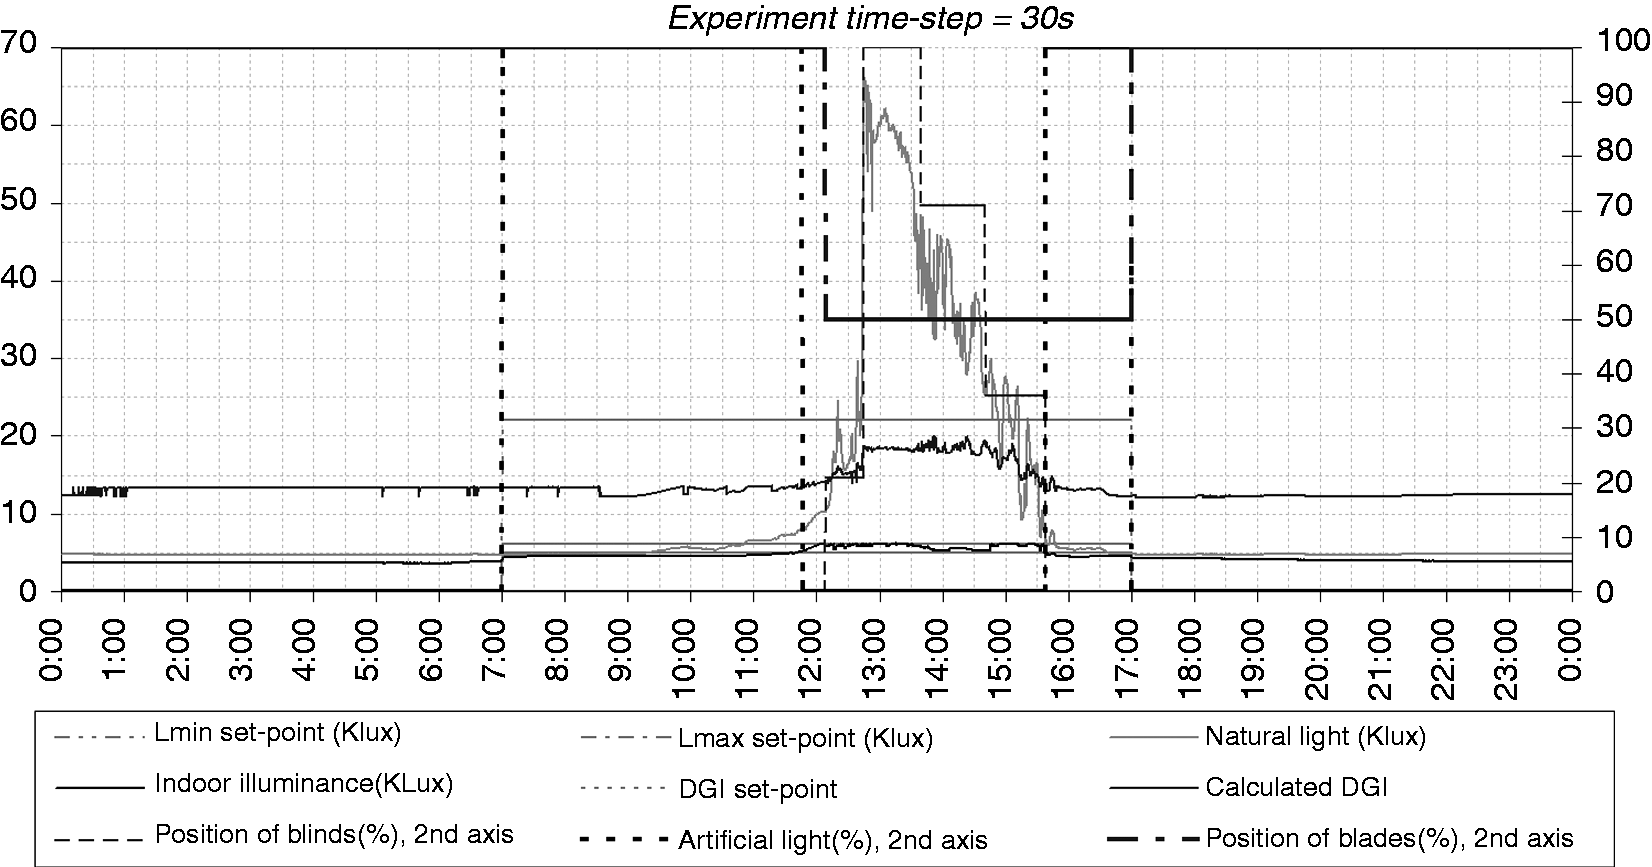
Figures 13 and 14, respectively, show the experimental results of the indoor lighting condition in the summer and in the winter, as obtained by automatically switching on the artificial lighting when necessary and adjusting the position of the blinds and the angle of the blades, using, respectively, 60-seconds and 30-seconds time steps.
Experimental results in the summer, obtained using 60-seconds time steps Experimental results in the winter, obtained using 30-seconds time steps.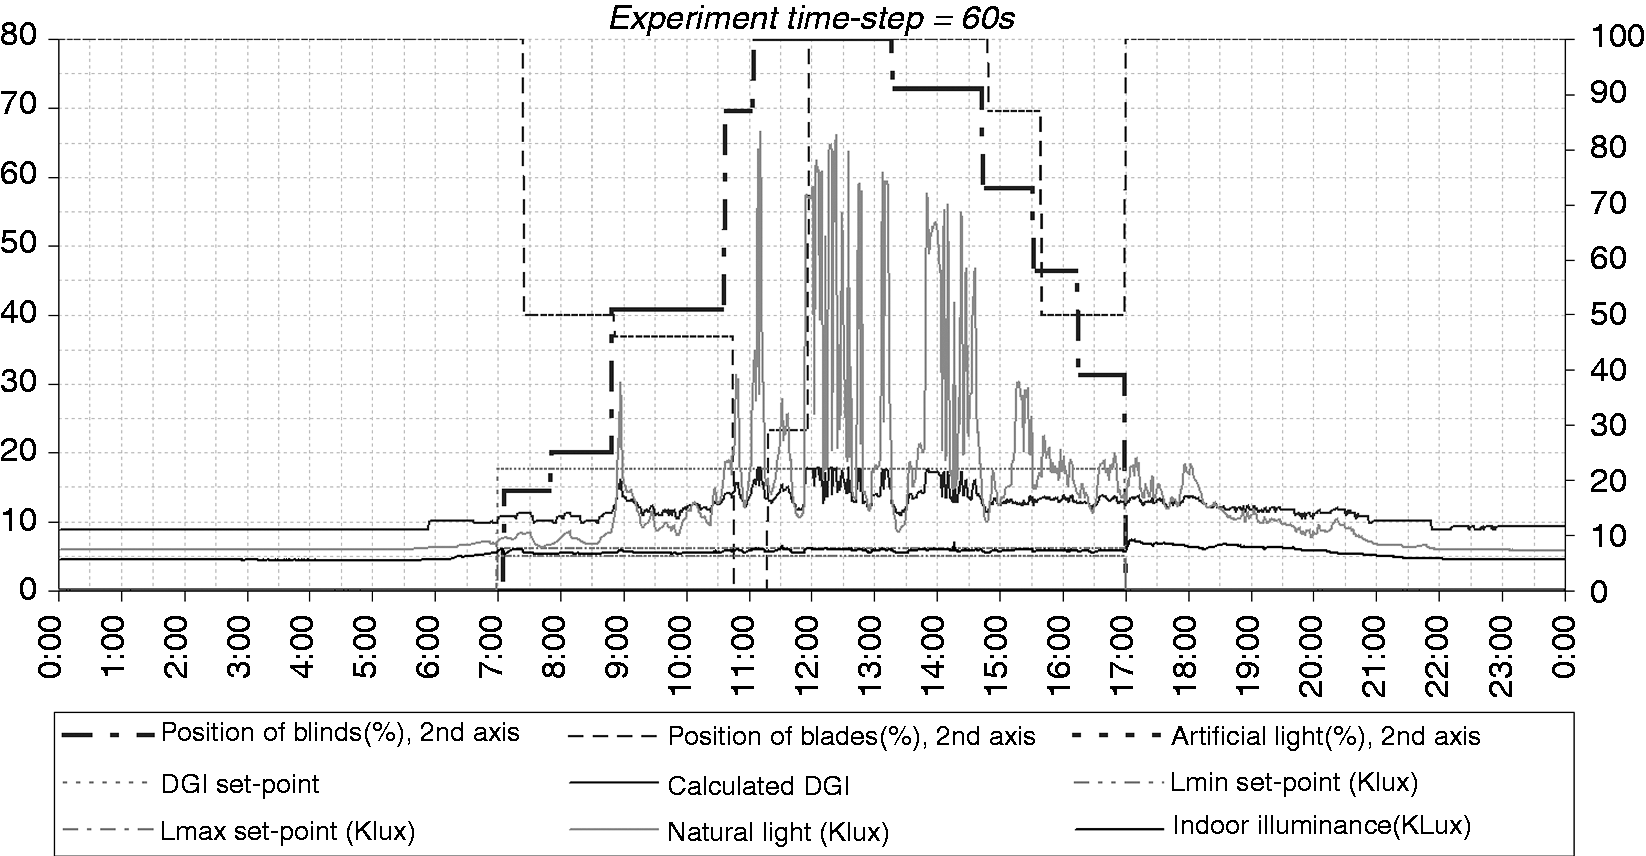
When the artificial light was on, the indoor illuminance was below the lower set point as the sensor was located near the windows. But when the artificial light was off, the indoor illuminance was perfectly maintained between the lower and upper lighting set points (i.e. 5.2 klx and 6.1 klx). In addition, during this particular period, the indoor illuminance was maintained between the two desired set points by automatically adjusting the position of the blinds according to the ambient daylighting present on the front of the facade and following the sun’s apparent movement during the occupied period. The blade’s angle was set to the horizontal position during the entire occupied period to provide a direct view to the outside, because the DGI never reached the set point of 22. In this situation, the level of discomfort glare was acceptable during the occupied period and was satisfied.
The indoor illuminance was perfectly maintained between the lower and upper lighting set points by automatically regulating the position of the blinds and the angle of the blades during the occupied period. Moreover, the indoor illuminance was provided only by daylight and maintained between the desired lighting set points by automatically adjusting the blinds position and the blades angle. Finally, the DGI was maintained below the control set point of 22 during the entire occupied period.
5. Discussion
The control system used for the test-cell case study was developed and designed to fulfil occupants’ comfort needs, i.e. visual comfort in this case, by maintaining the controlled indoor processes between the desired set points during the occupied period. In this experimental study, the control actions became active only during the occupied period. The results show that the energy was used only when necessary during the occupied period, which helped reduce energy consumption and greenhouse gas emissions. As shown in Figures 13 and 14, the automated control system behaved properly and was able to use the available natural light to maintain the visual comfort at the desired control set points. In addition, the artificial lighting and the motorised Venetian blinds were properly controlled during the occupied period. The control responses of the motorised windows, dampers, and Venetian blinds were more or less stable as they were subjected to few changes during the occupied period. One of the reasons for this was the use of a timer (or time delay) in the sub-control systems to avoid control actions at every time step and to maintain the activity at a specific time step.
As a result, the control systems were successfully implemented and tested for the case study of the test-cell. The indoor visual comfort criteria were fulfilled in accordance to the standard norms by meeting the control set points during the occupied period. In addition, the number of control actions for critical devices such as the motorised windows and Venetian blinds was minimised during the occupied period to avoid discomfort due to the generated noise.
Note that experiments using a different number of time steps, i.e. 30 seconds and 60 seconds, were conducted for different periods of the year, but no significant differences in the operational period were found, due to the small mass of the test-cell, which require a low heating/cooling capacity. New ideas regarding the practical approach to integration of the automated control systems based on the anticipation of control actions has been tested and perceived to be effective in reducing the energy consumption of buildings.
6. Conclusion
This paper describes an experimental setup for the application of real-time automated control systems of lighting components, to maximise the use of daylighting in a test-cell in Delft, the Netherlands. The study explores the design of control systems based on a hierarchical concept and the synthesis of advanced control systems for building performance, by means of hybrid statecharts. Control algorithms were designed for each lighting component based on an original object-oriented modelling formalism. The automated control system was implemented on Matlab/Simulink, and all of its input and output data were handled via the data acquisition system using the TestPoint programme.
The implemented model was successfully tested in the test-cell using different numbers of time steps and under different weather conditions (particular to the Netherlands). The lighting components of the test-cell behaved as expected during the occupied period, and all of the controlled parameters were maintained at or between the desired control set points. The following conclusions can be drawn from the experiments:
The indoor illuminances could be properly controlled and maintained between the desired set points. Most of the test-cell actuators operated over a smaller time step, although the sensitive actuators, such as the motorised windows and Venetian blinds, were active over a larger time step by means of a time delay in their functioning in order to reduce noise during the occupied period. Priorities in controlling the passive and active actuators of the test-cell were significant because they played an important role in reducing energy consumption by taking maximum advantage of the natural light during the occupied period.
The feasibility of using hybrid statecharts for modelling lighting components in the test-cell has been shown as the preferred means of reducing the complexity of representation. In effect, hybrid statecharts enable the modelling of autonomous functions such as the coordination of certain control actions and activities to provide a better indoor environment and energy savings. Room for improvement and future research would involve developing a better control strategy during the unoccupied period; passive processes such as night cooling can be integrated to achieve a more significant reduction in the energy consumption.
Footnotes
Acknowledgements
The author is grateful for the significant experimental support to this study supplied by Rob Stall, member at Delft University of Technology and would like to thank Jan Hensen, Professor at Eindhoven University of Technology for his critical help in this research, Dr Peter Boyce for his great help in publishing this manuscript, and the anonymous reviewers for their valuable feedback to the manuscript.
Declaration of conflicting interests
The author declared no potential conflicts of interest with respect to the research, authorship, and/or publication of this article.
Funding
The author received no financial support for the research, authorship, and/or publication of this article.