
Abstract
An experiment was carried out to investigate how contrast threshold for target detection is affected by the presence of glare and by extraneous light sources using the method of ascending limits. The target was located at either a foveal or a peripheral (10° right) location, glare was adjacent to the foveal location, simulating the headlamps of an oncoming vehicle, and extraneous light sources were at either foveal or peripheral (10° right or left) locations. Contrast threshold for a foveal target without glare was affected mainly by the surrounding local luminance distribution. However, in the presence of glare and also for the peripheral target (both with and without glare) the global luminance distribution matters. Glare increased the contrast needed for detection of the foveal target, but this effect was reduced by the presence of extraneous light sources that were peripheral to the target. For peripheral targets, contrast threshold was also reduced by the presence of extraneous light at a non-target location and this effect was increased in the presence of glare. Glare equations tend to be based on tests using uniform, homogenous fields: these data indicate that, in the presence of extraneous light sources, the influence of glare is overestimated.
1. Introduction
For the application of mesopic luminances according to the CIE recommended system for mesopic photometry, 1 Joint Technical Committee 1 of the Commission Internationale de l’Eclairage (CIE JTC-1) has requested proposals on how to estimate the adaptation state of a typical observer depending on the task. For this paper, the task is driving a motor vehicle. Adaptation is the process of adjusting to the quantity and quality of light: if the eye is exposed for a sufficient time to a uniform condition every part of the retina reaches an equilibrium state and the eye can be said to be adapted to that level of light. 2 In laboratory settings, the luminance of a homogeneous background is used to control the adaptation luminance of the retina. Many of the experiments, which provided the basic research for CIE recommended system, 1 were carried out in laboratories with a homogeneous background,3–5 although some data were gathered in field studies. 6
Foveal eye movements for a car driver after dark tend to fall within a 10° circle centred either on the lane ahead or slightly to the near side, depending on the type of road and hence anticipated hazards. 7 The typical field of view for a city motorist therefore comprises the road surface, which may be considered as near-homogeneous (assuming the light distribution meets the minimum uniformity of CIE 1158), but also inhomogeneous parts such as areas illuminated by the car head lamps, shop lighting and advertisements on the near side and glare sources such as the lamps of approaching vehicles or the luminaires of the fixed road lighting installation. Estimating the adaptation state under such circumstances is less straightforward. It is possible to predict the influence of glare with a homogeneous background,9–11 and the influence of luminance on adaptation under a homogeneous background. 12 Moon and Spencer 2 found that under a homogeneous background the size of an extraneous light source has only a small effect and concluded that adaptation is mostly influenced by local luminance surrounding the target position. It is, however, unknown how all three findings work together under non-homogeneous circumstances such as those of a real traffic scene with simultaneous inhomogeneities and glare.
The influence of glare on foveal adaptation has been investigated13,14 and has led to the scattering theory. 15 This theory states that disability glare introduces scattered light within the eye of the observer, which causes a homogeneous overlay of a veiling luminance throughout the retina, thereby increasing the adaptation state within the eye and leaving it under-adjusted for the actually lower luminances of the observed scene. This effect depends on the angle between the glare source and the task position, decreasing with an increase between the two. This effect decreases visual performance 13 and to estimate the effect an equivalent veiling luminance can be calculated.16,17 This is a theoretical luminance superimposed on the actual scene used to estimate the increase of adaptation within the eye of an observer that causes the same decrease in visual performance as a glare source. Stiles 9 augmented this formula for peripheral vision, which has recently been confirmed 10 and slightly updated. 11
Adaptation is influenced by the pattern of surrounding luminances, and that influence is apparently stronger for the luminance of the local surroundings (i.e. luminances of the area within the visual field that immediately surrounds a task point) than for the luminances of points further away.2,18,19 This is the local luminance hypothesis. Indeed, road lighting design standards (e.g. ANSI IESNA RP-8-1420) determine adaptation using a local background luminance along with a veiling luminance to account for glare. This is a foveal approach. Mesopic luminances, however, represent non-foveal visual performance, for which the adaptation state needs to be calculated for one or several peripheral task point(s). This paper reports a laboratory experiment in which contrast threshold was measured for the detection of foveal and peripheral targets for a background of constant luminance but with glare and extraneous light sources at foveal and peripheral locations.
2. Method
An experiment was carried out in the context of the driver of a motor vehicle and their need to see approaching objects. As a driver approaches an object it becomes visually larger (subtends an increased visual size): after dark, and when headlamps are being used, its luminance is also likely to increase (due to the headlamps of the vehicle). This experiment considers variations in target luminance but not size, measuring contrast threshold using the method of ascending limits as used in recent studies.3,21,22 The independent variables were target position, position of an extraneous light source and glare; the dependent variable was contrast threshold.
2.1. Apparatus
The experiment was carried out using a homogeneous hemisphere (radius = 0.31 m; white plastic interior surface) and four light sources (Figure 1). Test participants sat at the front of the hemisphere, facing the centre, with their position stabilised using a chin rest. The characteristics of the four light sources are shown in Table 1. One source illuminated the sphere from above through a translucent diffuser, this providing the background (adapting) luminance. The adaptation luminance used was 1.0 cd/m2, this being the road surface luminance defined by the M 3 lighting class.
8
A second source provided the targets and this was delivered via a Texas Instruments LightCrafter pico-projector. The target was a 1° square, which was projected to either a foveal (on-axis) or peripheral (off-axis) location, this being 10° to the right of the fixation point. The background and target light sources were Optronics OL-490 spectrally programmable light sources, having xenon lamps, which permit replication of a wide range of spectra in the range from 380 to 780 nm. To provide extraneous light patches in the visual field, i.e. inhomogeneity in the visual field, a third light source (a light-emitting diode (LED)) projected a 5° circular patch of 5 cd/m2 at one of three possible positions, either superimposed on the foveal target, or located 10 degrees to either the left or right hand side of the foveal position. This increased the background luminance of the sphere surface by approximately 1.6%.
Vertical section (left) and plan section (right) of the apparatus Characteristics of the four light sources used in this experiment Note: Ev = vertical illuminance at the observer’s eye.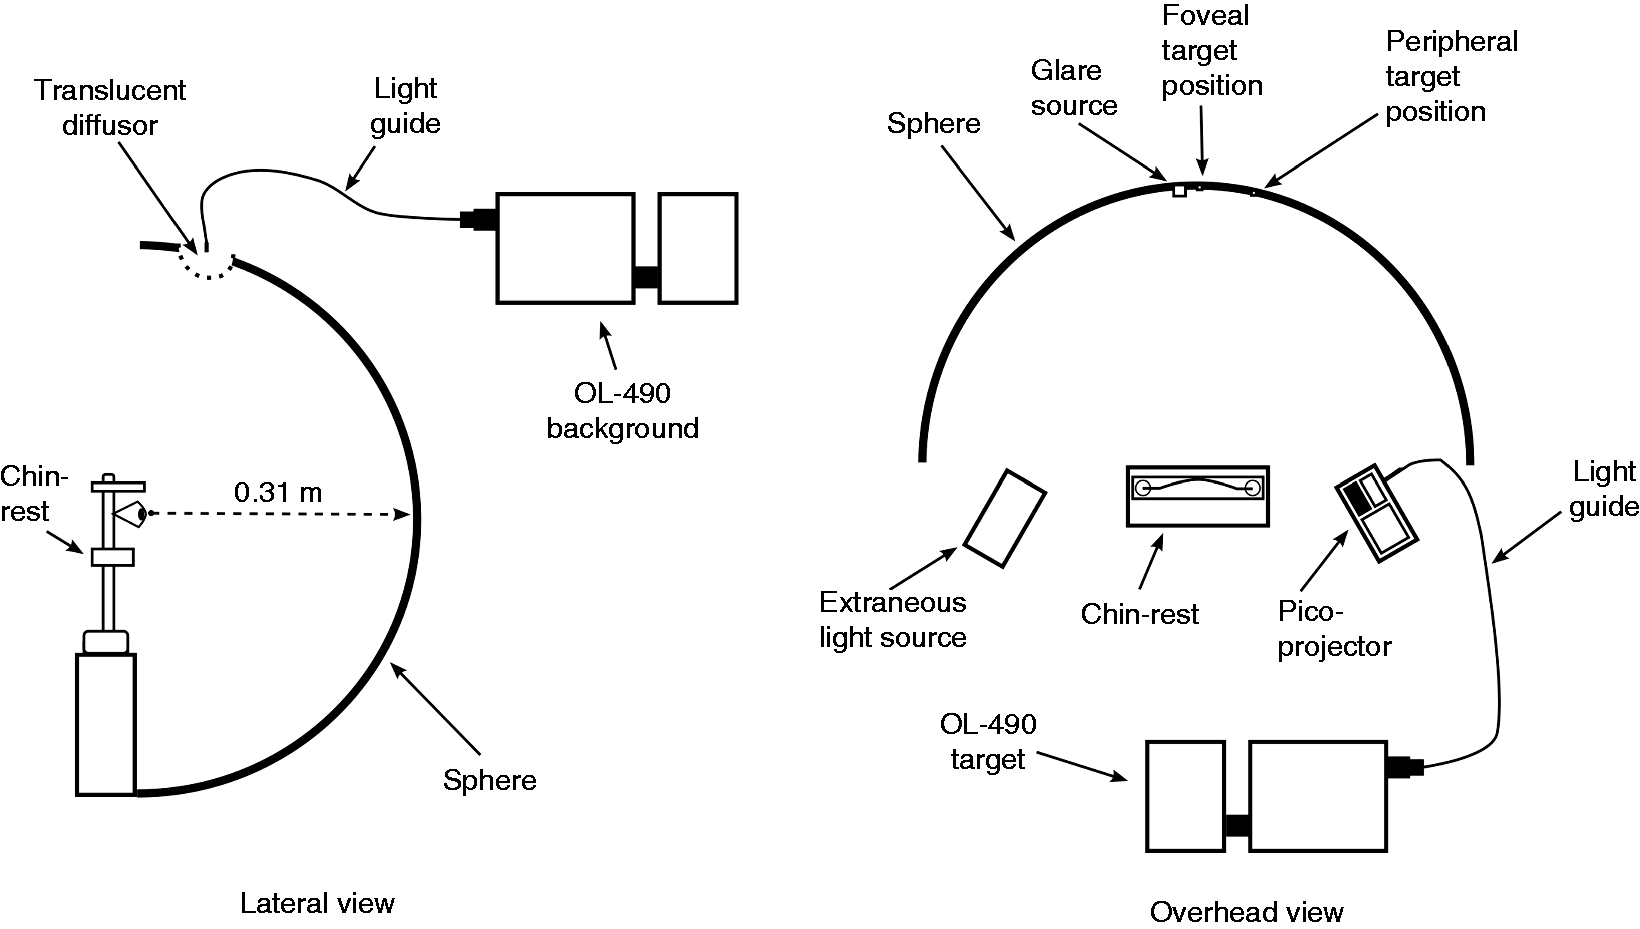
A single spectral power distribution (SPD) was used for the target, background and extraneous light sources, this being a white light (S/P ratio = 1.71, CCT = 4322 K). The SPDs were measured directly using a Konica-Minolta CS-2000 spectroradiometer placed at the observer’s position, and this was measured after each test session to ensure it was consistent. The luminous flux of the xenon lamps (background and target light source) deteriorated by approximately 0.5 % per hour during use, and to monitor and correct for this a correction was applied daily.
The final light source was used to simulate the discomfort glare caused by an oncoming vehicle at 50 m distance. This was set to produce a vertical illuminance of 1 lux at the observer’s eye, close to the maximum value used by Theeuwes et al.
23
The glare source comprised two white LEDs (S/P = 2.7, CCT = 13,665 K) located at 2.88° and 4.87° to the left of the foveal fixation point. The left-hand and right-hand LEDs had luminances of 70 kcd/m2 and 40 kcd/m2 respectively, each contributing 0.5 lux of the illuminance at the observer’s eye. This provided estimated veiling luminances of 0.81 and 0.10 cd/m2 for targets at the foveal and peripheral positions, respectively, as calculated according to the methods described in Uchida and Ohno and CIE 31.
16
In trials, the glare source was switched on 2 s before the target was presented and remained on until the test participant pressed the button to indicate detection of the target. Results from Boynton and Miller
24
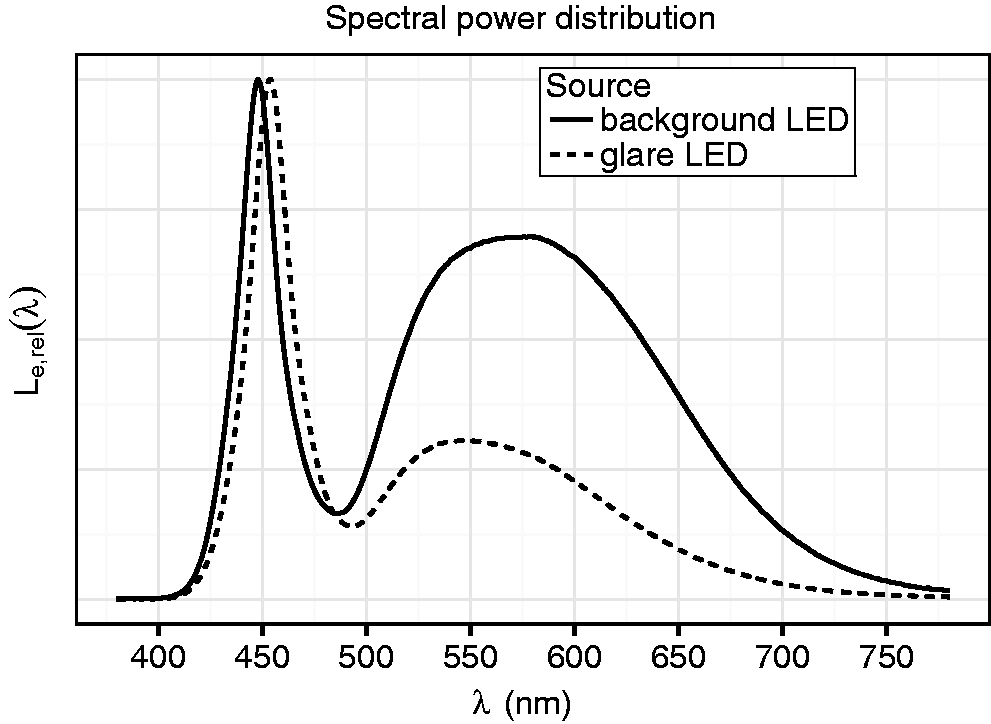
suggest that visual performance becomes stable after approximately 300 ms adaptation when background luminance changes from a lower to a higher value. Figure 2 shows the locations of the target, glare and extraneous light sources within the field of view and Figure 3 shows their SPDs.
Photograph of the field of view for observers with all light sources presented simultaneously (i.e. background, target, glare and extraneous) Spectral power distributions of the light sources used. Note: the SPDs of the target and extraneous light source are the same as the background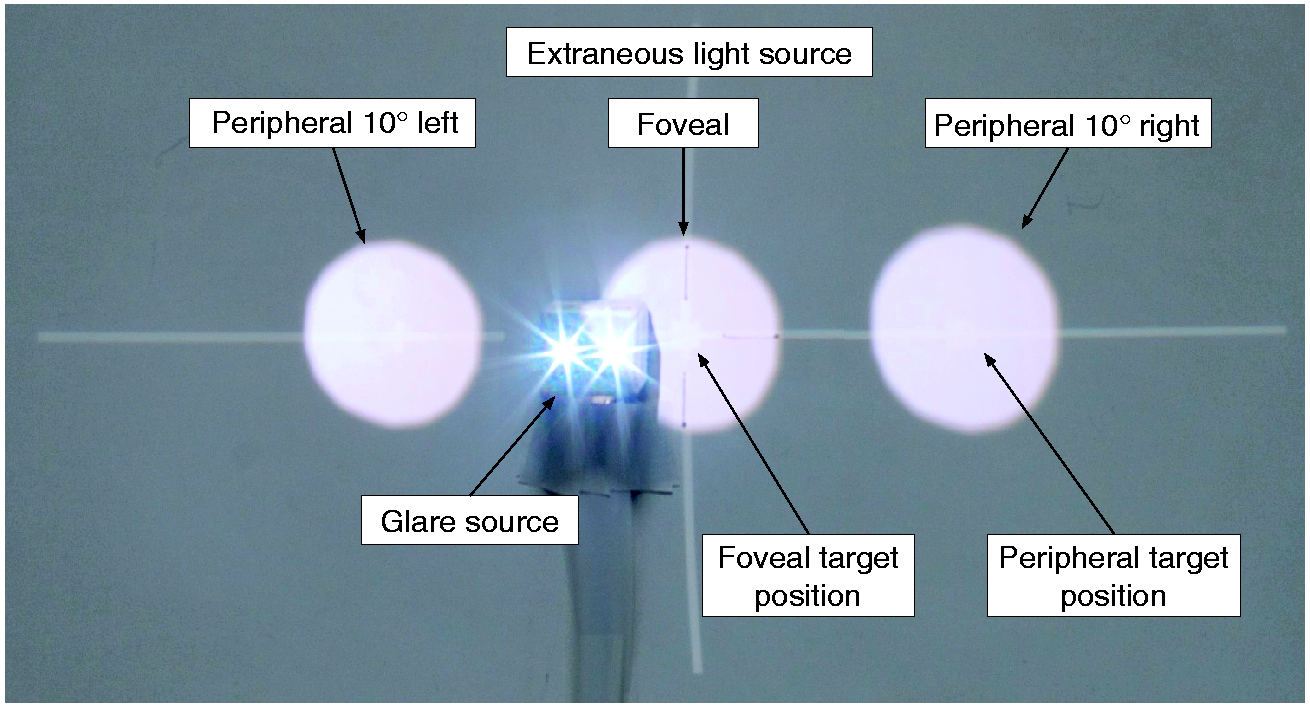
2.2. Procedure
Contrast threshold was measured as the dependent variable using the method of ascending limits. The target luminance was initially low, at which level it could not be detected, and was gradually increased under automatic control until it was detected by the test participant. Observers used binocular vision during trials and indicated target detection by pressing a button.
Combinations of glare, extraneous light and target location used in trials as independent variables
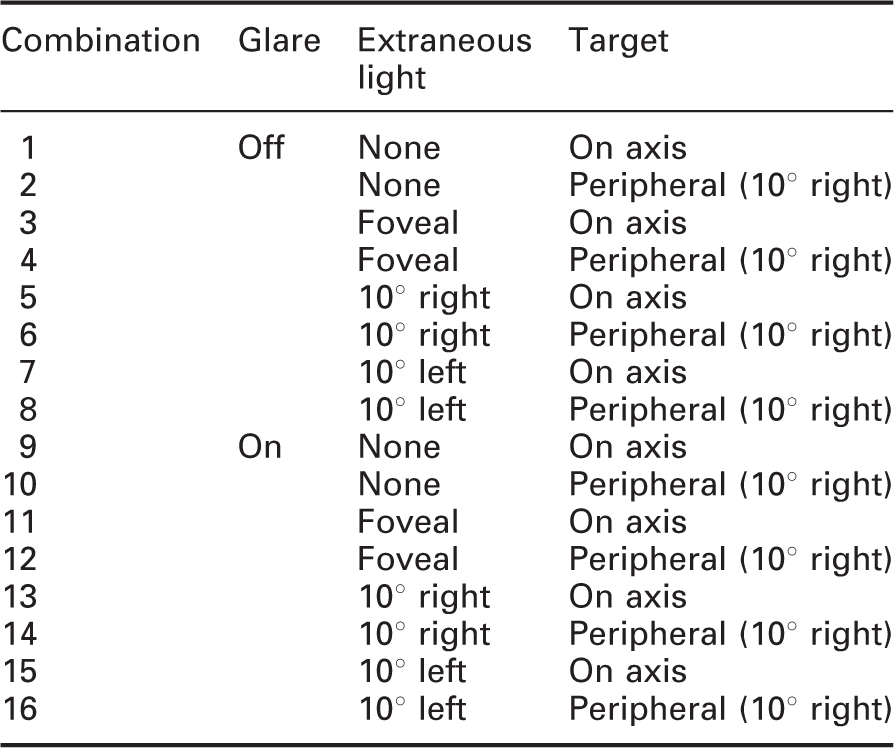
With a target expected to appear in a known location there is a risk that test participants may look in that direction, specifically, they may look towards the direction of a target expected to appear in the periphery rather than towards a fixation mark. Hence, the target was presented to the on-axis or peripheral locations in a random order. In essence, light source combinations 1 and 2 (and 3 and 4,… 15 and 16) were run in pairs.
The effectiveness of this order randomisation would be somewhat limited if there were only one target presentation at each location, as after having seen the on-axis target then it would be known that the next stimulus was at the peripheral location. To overcome this, the target was presented at each location for either two, three or four trials, this number being a part of the randomisation process. Repeated trials give rise to potential practice effects, such as practice or adaptation. Hence, it was planned that analyses would be carried out using the second trial for each light source combination, as suggested by Collie et al. 25 and Poulton. 26 Practice effects in these data are discussed below.
Range of target luminances used within each local luminance
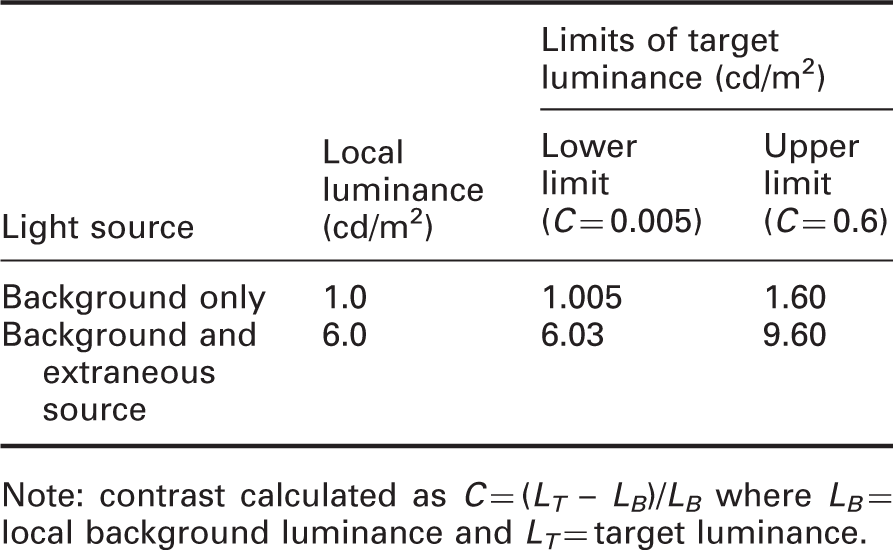
Note: contrast calculated as C = (LT – LB)/LB where LB =local background luminance and LT = target luminance.
At the start of a test session, 10 minutes was allowed for adaption to the background luminance of 1.0 cd/m2. After switching on the extraneous light source, a further 30 s period was allowed for re-adaptation. The test participant was instructed to focus on the fixation point (a dark cross mark) and to press the response button when a target was detected either at the foveal or the peripheral 10° off-axis target location. To check for guessing they were also required to say whether the target appeared in the foveal or peripheral position. The wrong location was reported in less than 1% of trials and when this occurred the results were omitted and the trial repeated.
2.3. Participants
There were 24 test participants, and they received a remuneration for their participation. This sample comprised 6 females and 18 males and they were aged between 20 and 36 years (mean = 27 years, SD = 4 years). Participants’ vision was tested prior to trials with an Oculus Binoptometer 4P. All test participants were found to have at least normal visual acuity (i.e. ≥ 6/6), which was tested using a Landolt ring chart at photopic (300 cd/m2) and mesopic (0.032 cd/m2) luminances under standard illuminant D65, and normal colour vision, which was tested using the Ishihara test charts under a D55 light source. None of the subjects required visual aids.
3. Results
3.1. Practice effect
There were two, three or four trials per light source combination, this being done to reduce cues as to expected target location, but these repeats may give rise to a practice effect. Figure 4 shows the mean contrast threshold for each trial averaged across all stimulus combinations and shows a slight reduction in contrast for the second, third and fourth trials compared with the first. The Pearson product-moment correlation between trials was positive (r > = 0.67, p < 0.001) suggesting a tendency to give a similar response on successive trials. A two-way analysis of variance (ANOVA) for repeated measures was carried out for repetitions 1 and 2 (as described above, trials 3 and 4 were not used in all cases, according to the randomised presentation, and were omitted here to permit a balanced ANOVA design). This indicated a significant difference between repetitions (p = 0.016 Contrast threshold determined for the trial repetitions. The left-hand graph shows all conditions merged, with the number of data for each repetition. The right-hand graph shows the repetitions by condition, referenced via numbers as in Table 2. Error bars show ± 95% confidence interval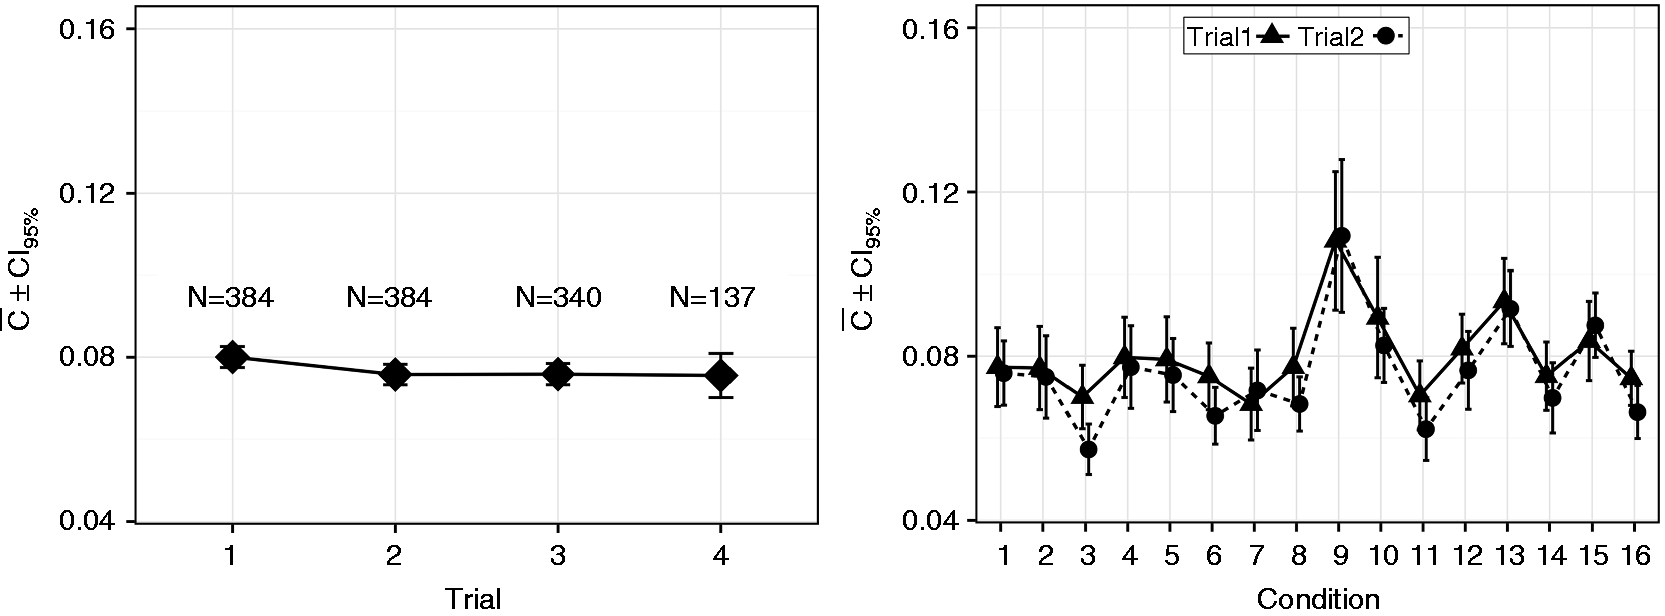
3.2. Threshold contrasts
The results presented here are the mean threshold contrasts ( Results measured as local contrast at the foveal (left) and 10° off-axis peripheral (right) target positions for N = 24 test participants. Error bars show ± 95% confidence interval (CI). Note: the x-axis label marked in bold font indicates the location of the extraneous light source that overlaps the target position. (The connecting lines were added for clarity, to aid recognition of the glare and no-glare trials)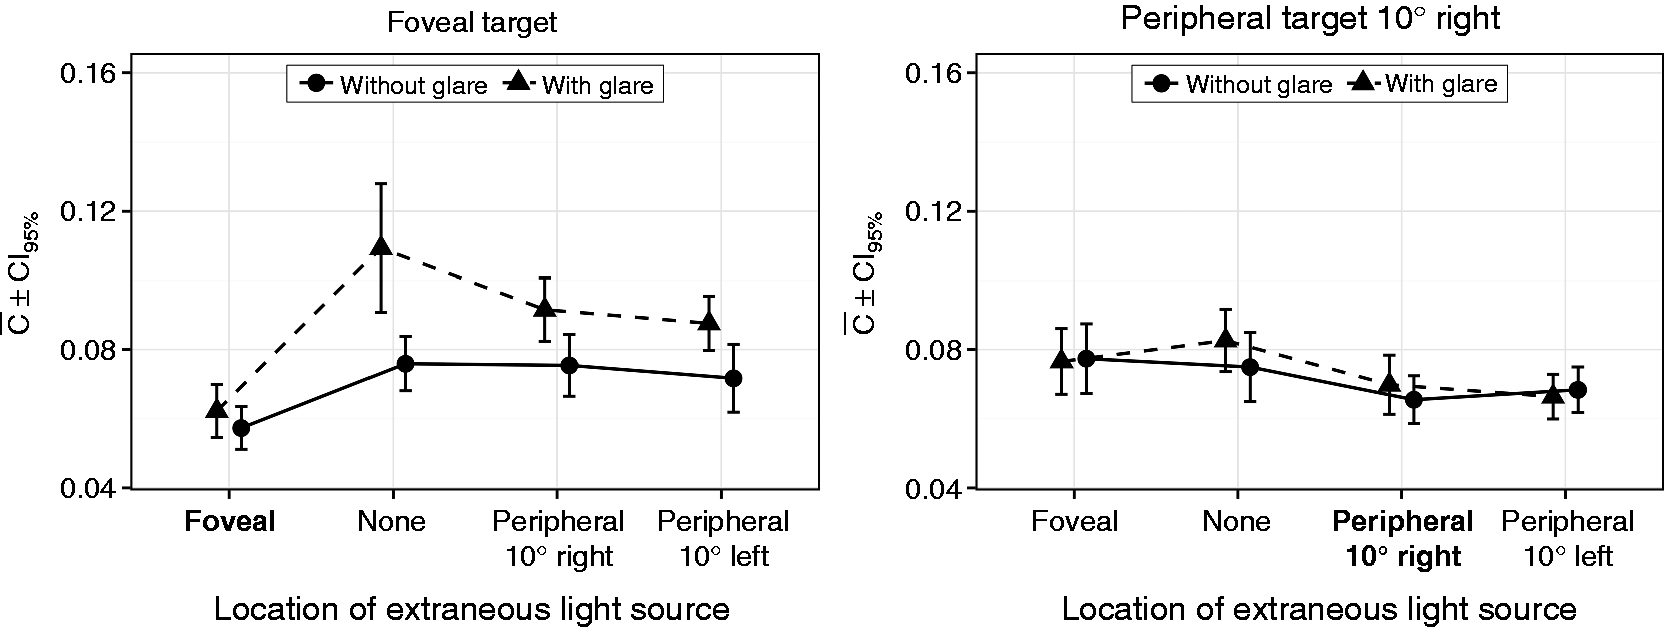
The reference condition for this analysis is those trials carried out without glare and without an extraneous light source. First, consider trials when the target was presented at the foveal location. It can be seen that without glare, extraneous light at the peripheral locations results in a similar threshold contrast to that obtained in the reference condition. Superimposing extraneous light onto the target in the foveal location reduces the threshold contrast, which is consistent with the local luminance hypothesis. 19 When the glare source was added the threshold contrast increased; this increase is larger for trials with no extraneous light, and smaller for trials when extraneous light was superimposed onto the target.
The confidence interval for one condition (foveal target, with glare, without extraneous light) is larger than for other conditions. In that condition, the response gained from one observer was extreme compared with the responses from other observers (i.e. their result was greater than two standard deviations from the mean). Removing the results of that particular observer did not, however, significantly change the confidence interval: the variability in this condition is generally high so this observer’s responses were retained in all analyses.
Consider next the trials when the target was presented at the peripheral location. These results do not indicate a strong effect of glare or extraneous light on contrast threshold for target detection.
The foveal target results are consistent with the local luminance hypothesis as found by others,2,18,19,22 when no glare is present. The negative influence of glare seems to be reduced by the distribution of the surrounding luminances, i.e. the extraneous light source presented at non-target locations.
Levene’s test confirms the assumption of equality of variance at both the foveal and peripheral target positions (p ≥ 0.19). Distribution normality was examined using a Shapiro–Wilk test and this suggested data from 11 of the 16 light source combinations were drawn from a normally distributed population. The cases not suggested to be normally distributed were four with the foveal target position (with glare no extraneous light source, with glare peripheral 10° right, without glare peripheral 10° left and without glare peripheral 10° right) and one case for the peripheral target (with glare foveal offset). Type I error rate of the F-test is, however, suggested to be robust to violation of normality
27
and, hence, a two-way ANOVA for repeated measures was used for inferential statistics. Reported effect sizes are generalised eta squares (
For the foveal target position a two-way ANOVA for repeated measures with within factors showed that both glare (
3.3. Foveal target position
Because the ANOVA was significant on both factors and their interaction a series of pairwise paired t-tests were carried out to investigate the significant interaction between glare and the extraneous light source for the foveal target position. Reported effect sizes for these comparisons are Cohen’s d for independent means.29,30 As suggested31,32 these results are not corrected for multiple comparisons but conclusions drawn instead by considering the overall pattern of findings.
Comparisons were made between the reference condition (no glare, no extraneous light source) and the seven combinations of glare and/or extraneous light. In the absence of glare, extraneous light sources at the non-target positions did not have a significant effect (peripheral 10° right, p = 0.92, negligible effect; peripheral 10° left, p = 0.37, negligible effect). Moon and Spencer 2 also found that contrast threshold was mainly influenced by the local luminances around of the task point and therefore the current results support their local luminance theory. Glare led to a significant increase in contrast threshold when extraneous light was absent (p < 0.001, large effect size) or if extraneous light was located at non-target positions (peripheral 10° right p < 0.001, large effect size; peripheral 10° left p = 0.003, medium effect size). Extraneous light located at the target location led to a significant decrease in the mean contrast, both with glare (p = 0.001, medium effect size) and without glare (p < 0.001, large effect size). This confirms the above assumed agreement with the local luminance hypothesis for the foveal target position. However, when glare is within the visual field the distribution of the surrounding luminances matters, i.e. it makes a difference whether or not the luminance of the surrounding visual field is homogeneous.
Glare was found to be a significant effect, but reduced in size (decreasing the required contrasts) when the extraneous light source was presented at non-target positions (peripheral 10° left p = 0.026, medium effect size; peripheral 10° right, near significant p = 0.057, medium effect size). Glare was not suggested to be significant when the extraneous light source was presented at the target location (p = 0.11, small effect size). These results are visualised in Figure 6.
Results of trials with the foveal target illustrating significant differences (p < 0.05) in threshold contrast between different conditions. Solid line = significant differences; dashed line = differences which are close to significant; effect size indicated as l (large), m (medium) or s (small). Note: the x-axis label marked in bold font indicates the location of the extraneous light source that overlaps the target position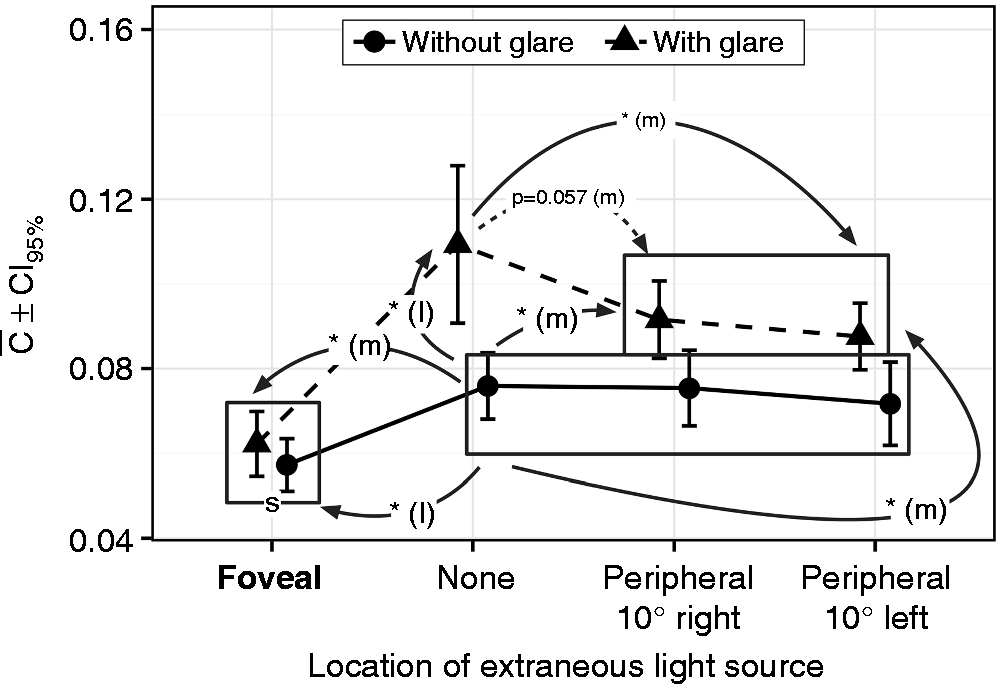
3.4. Peripheral target position
For trials where the target was presented at the peripheral position, the ANOVA showed a significant effect of extraneous light source position but did not suggest that glare was significant. It would, therefore, have been possible to continue with the post hoc test with results from both glare conditions merged. However, since glare has an influence on visual performance,9,10,11 even if not found to be significant under these conditions, the further analyses of extraneous light source location were carried out using paired t-tests and this was done for the with and without-glare trials separately.
Without glare it was found that, compared to the reference condition with no extraneous light source, illuminating the target location improves visual performance significantly (p = 0.037, small effect size), illuminating the visual field with additional 5 cd/m2 10° left of the peripheral target position (the foveal position) has no significant influence (p = 0.58, negligible effect size), both findings supporting the local luminance hypothesis. However, illuminating the visual field 20° left of the peripheral target position (peripheral 10° left) reduces contrast threshold to an extent that is close to significant (p < 0.052, small effect size). Comparing the two positions of the extraneous light source within the visual field but not at the target position, the left peripheral position of the extraneous light source has a lower contrast than the foveal position (p = 0.031, small effect size). Peripheral 10° left and peripheral 10° right show no difference in means (p = 0.4, negligible effect size). Presence of glare affirmed these findings, increasing the effect sizes, as visualised in Figure 7.
Illustration of significant differences (p < 0.05) in threshold contrast between different conditions with the peripheral target. Solid line = significant differences; dashed line = differences which are close to significant; effect size indicated as l (large), m (medium) or s (small). Note: the x-axis label marked in bold font indicates the location of the extraneous light source that overlaps the target position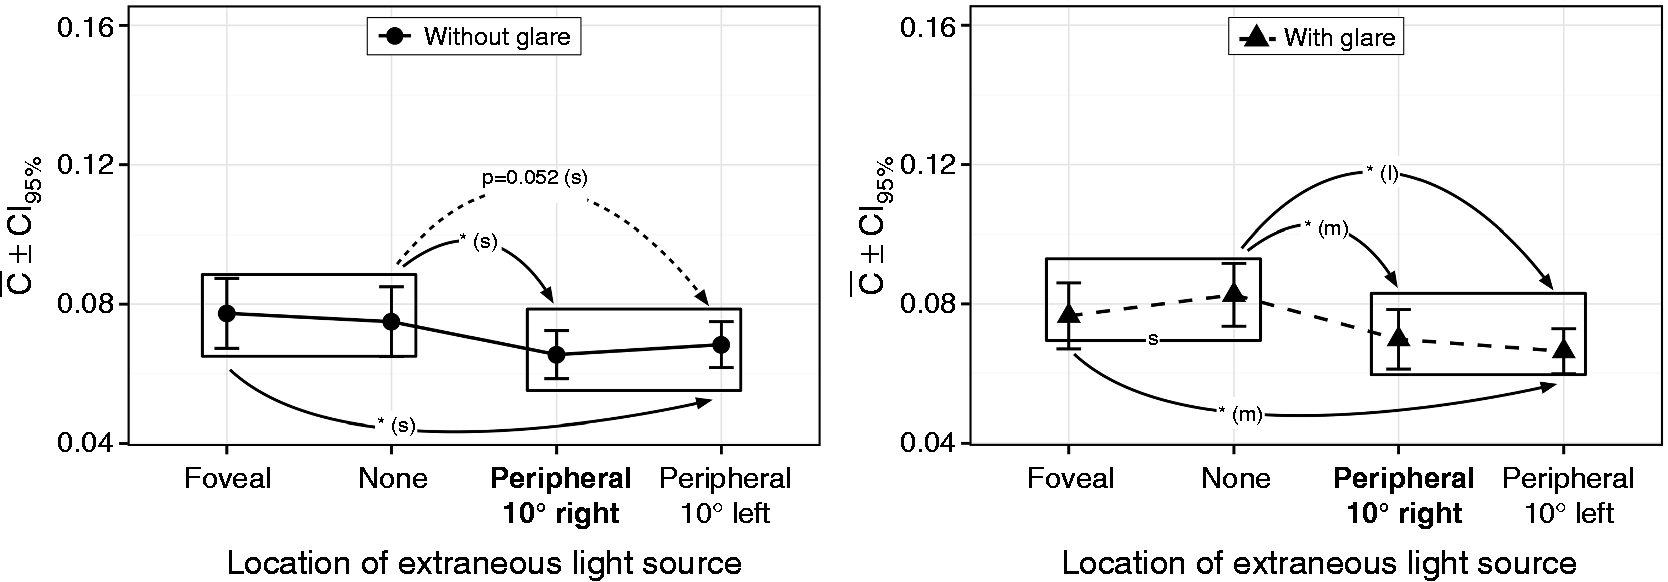
The findings for the peripheral target position partially support the local luminance theory: the distribution of the surrounding luminances does not matter for peripheral visual performance if altered in the region of the fovea, but matters if the inhomogeneity occurs in the periphery. That effect is increased under the presence of glare.
4. Discussion
This experiment shows that the effect of glare on contrast needed to detect a foveal or peripheral target is affected by the presence of extraneous light sources. The uniform fields typically used in glare evaluations16,17 may therefore give an incomplete picture of the impact of glare.
4.1. Method of ascending limits
Following previous work3,21,22 the procedure used here was ascending limits. This means that the target luminance was gradually increased until the required task could be carried out, i.e. the target could be detected3,22 or a specified level of perceived intensity was reached. 21 It is known that the starting point for such an experiment forms an anchor to the response and that if different starting points are used, different results may be obtained.33,34 If, instead, the luminance had been gradually decreased (i.e. descending limits), and observers instructed to state when the target was no longer visible, this is likely to have resulted in a different estimate of threshold luminance.
Two errors are anticipated – habituation and/or expectation. 35 The error of habituation is a tendency to repeat the same response on subsequent trials, leading to higher thresholds; the error of expectation is a tendency to falsely anticipate the arrival of a stimulus at threshold and may lead to deceptively low thresholds on ascending trials. The magnitudes of habituation and expectation are unlikely to be equal, and the stronger error will lead the direction of bias. One approach to countering this anticipated bias is to use both ascending and descending variations in luminance on separate trials and use the mean of the two responses as an estimate of threshold luminance. 35 If an absolute threshold is required, the method of ascending limits alone may be insufficient. Assuming that the effect of bias is consistent across conditions, then ascending limits are sufficient to investigate relative effects across conditions, which is the focus of the current work.
4.2. Practice effect
This experiment employed repeated trials (up to four) with the same condition and planned to analyse results of the second trial to overcome a possible practise effect. Analysis above (Section 3.1) suggests that the difference between the first and second trials was significant, but the effect size was negligible. Omitting the first trial would not have been required based on the statistics, but still can be considered good practice as proposed by Collie et al. 25
Previous studies have used alternative approaches. Cengiz et al.22,36 discarded exceptionally low results (i.e. less than the mean minus two standard deviations) to eliminate those trials where the test participants may have been anticipating the results. Similarly, Walkey et al. 4 discarded unusually long or short reaction times (mean ± 2 SD) to eliminate anticipatory and delayed responses. Freiding et al. 3 monitored performance by repeating trials with a standard stimulus throughout a test. Kent et al. 21 investigated whether time of day affected glare evaluations. Since responses at the four times of day were always recorded in the same order, this confounds the suggestion that the gradual increase in tolerance was associated with time of day and may have instead been a gradual adaptation to glare regardless of absolute time of day.
4.3. Comparison to existing models
Comparison of some of the results to predictions of existing models
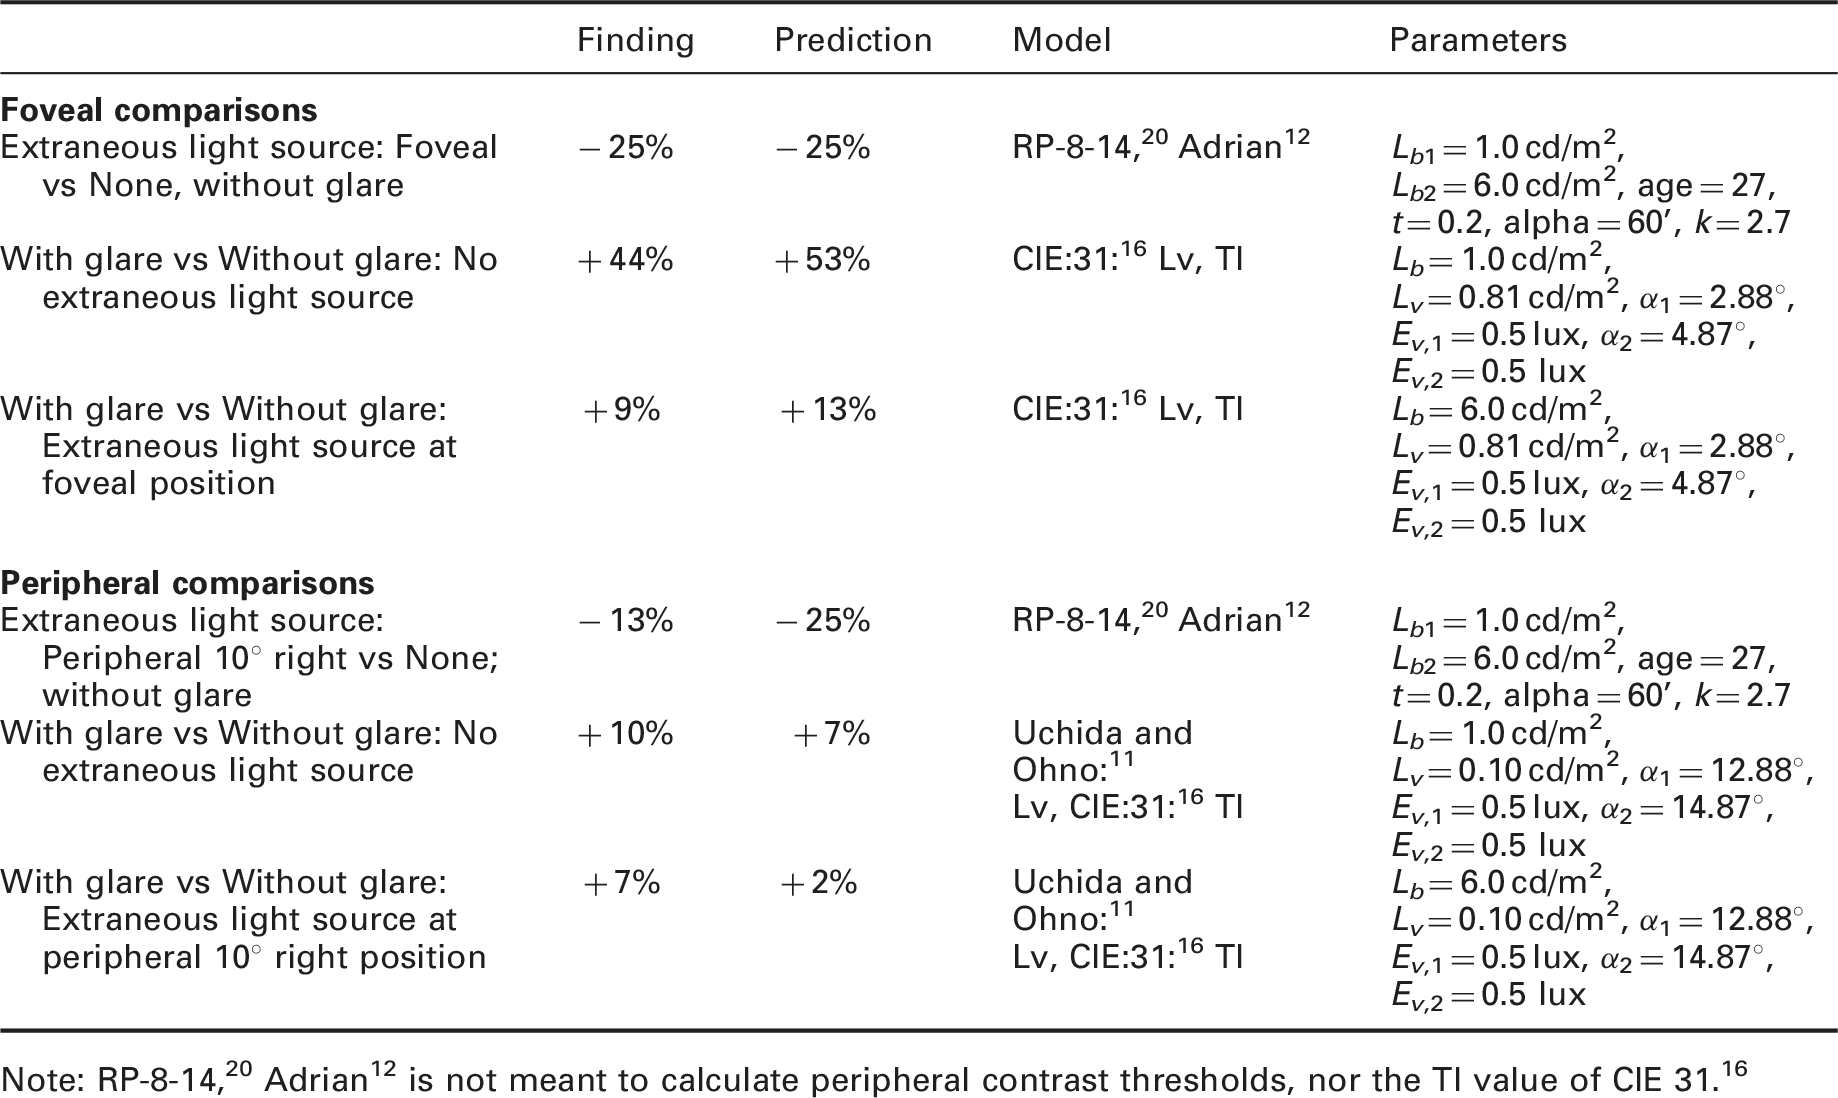
Based on the veiling luminance introduced by the glare source it is possible to predict the negative influence of glare with the threshold increment (TI) value. 16 At the foveal target position for both adaptation states the finding and the prediction match rather well. At the peripheral target position the TI value underestimates the negative influence of glare, note that the TI model was also not meant to predict the decrease of peripheral visual performance.
5. Conclusion
The influences of glare and extraneous light sources within the visual field were investigated by comparing contrast detection threshold for targets presented at foveal and off-axis (peripheral 10° right) locations.
The local luminance hypothesis as suggested by others2,19,36 was again found to be applicable for the foveal target position, i.e. visual performance is influenced mostly by the luminances directly surrounding the target position and it is assumed, that this is applicable to adaptation as well. However, this was found to be valid for conditions without glare. Under the presence of glare visual performance was better if an extraneous light source provided additional illumination within the periphery of the visual field, which indicates a global influence of the surrounding luminances.
At the peripheral target position the local luminance hypothesis was only valid if the additional illumination of the extraneous light source was centred around the fovea. Under both the presence and absence of glare, visual performance was better if an extraneous light source provided additional illumination within the periphery of the visual field. The effect size increased under the presence of glare, where illuminating the fovea slightly improved visual performance.
This paper reveals a global influence of the surrounding luminance. One interesting result is that, for the peripheral target (10° right) the extraneous light at 10° left reduced the contrast threshold while the foveal extraneous light, which is closer to the task point than the 10° left, did not.
As current equations for assessing glare tend to be more conservative than is potentially required in a less homogeneous surrounding such as an illuminated street at night, these equations favour safety, rather than exact predictions. For the calculation for the mesopic luminances based on estimation of the adaptation state, Maksimainen et al. 37 found that the influence of glare on adaptation and, therefore, on the calculated mesopic luminance is rather low and the bias introduced by neglecting the influence of glare is trivial. However, as the glare of approaching cars increases rapidly temporal adaptation changes might create more extreme values than have been reviewed in this experiment or that were considered by Maksimainen et al.
Footnotes
Acknowledgements
The authors thank Sandy Buschmann and Robert Franke, students of Fachgebiet Lichttechnik, for acquiring the subjects and conducting most of the automated experiment and automated measurements. The authors thank Dr Michael Böhm of Fachgebiet Lichttechnik for continuously answering statistical questions.
Declaration of conflicting interests
The authors declared no potential conflicts of interest with respect to the research, authorship, and/or publication of this article.
Funding
The authors disclosed receipt of the following financial support for the research, authorship, and/or publication of this article: This work was funded by the Federal Ministry of Education and Research of Germany (13N10815).