
Abstract
Facial emotion recognition has been used as a representative pedestrian activity in studies examining the effect of changes in road lighting. Past studies have drawn conclusions using results averaged across performance with the six universally recognised expressions. This paper asks whether expression choice matters. A reanalysis of past data for each unique expression does not suggest a change in the conclusion that facial emotion recognition is not significantly affected by the spectral power distribution of the lighting.
1. Introduction
Making a judgement about the intentions of other people is an assumed critical visual task for pedestrians.1–3 There is support for this assumption in studies using eye tracking. When looking at static images, observers will tend to look at the people in a scene with a frequency significantly greater than chance. 4 In natural outdoor settings, there is a probability of over 80% that another person in the field of view will be fixated at least once5,6 and fixations on other people can be sufficiently important to demand significant cognitive attention. 7 The assumed reason for observing others is that a pedestrian ‘need[s] to be able to take a “good look” at the other users of streets – identification of persons or of intentions …’, 2 that is whether they are friendly, aggressive or indifferent 8 and thus whether it is safe to approach them or if avoiding action is required. After dark, on roads where significant pedestrian activity is expected, road lighting should be designed to enhance the performance of such interpersonal judgements.
Facial emotion recognition is the identification of a person’s emotional state from their facial expression. Facial emotions have been linked with the approach–avoid response
9
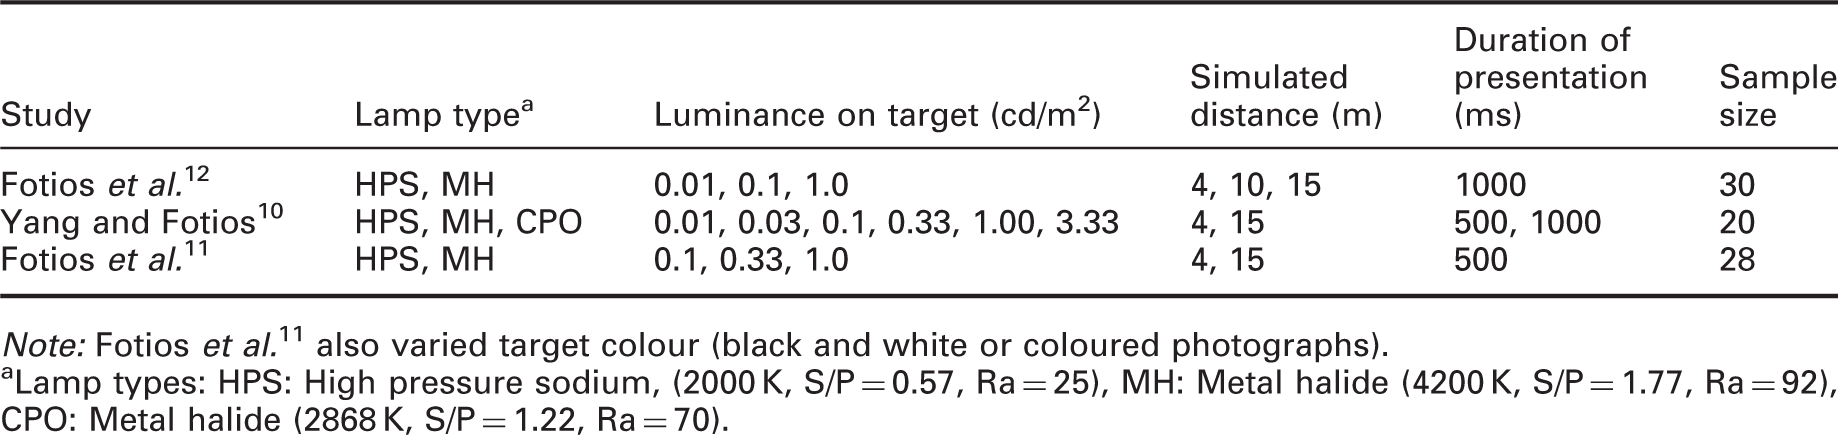
and thus three experiments have been carried out to investigate how this task is affected by changes in road lighting.10–12 These studies used photographs from the FACES database of actors portraying the six universally recognised facial expressions of emotion: anger, disgust, fear, happiness, neutrality and sadness.13,14 A photograph was presented for a brief (0.5 or 1.0 s) observation and a six-alternative forced choice of expression was sought. These studies used the faces of four actors (a young male, a young female, an old male and an old female) each portraying all six expressions giving 24 target images in total. An example of the target images is shown in Figure 1. The targets were observed under lighting of different spectral power distribution (SPD), luminance and viewing distance as simulated by manipulation of image size (Table 1). In two studies,10,12 the photographs were presented on a non-self-luminous screen with the surrounding environment being lit by the test lighting. In the third study,
11
the photographs were projected onto a screen, with the projector light and surrounding field providing similar SPD and luminance.
Sample of facial expressions from the FACES database.
13
These are a younger female with expressions (from left to right) of angry, disgust, fear, happy, neutral and sadness. Website for image database: http://faces.mpdl.mpg.de/faces/. Experimental conditions used in past studies of facial emotion recognition. Note: Fotios et al.
11
also varied target colour (black and white or coloured photographs). Lamp types: HPS: High pressure sodium, (2000 K, S/P = 0.57, Ra = 25), MH: Metal halide (4200 K, S/P = 1.77, Ra = 92), CPO: Metal halide (2868 K, S/P = 1.22, Ra = 70).
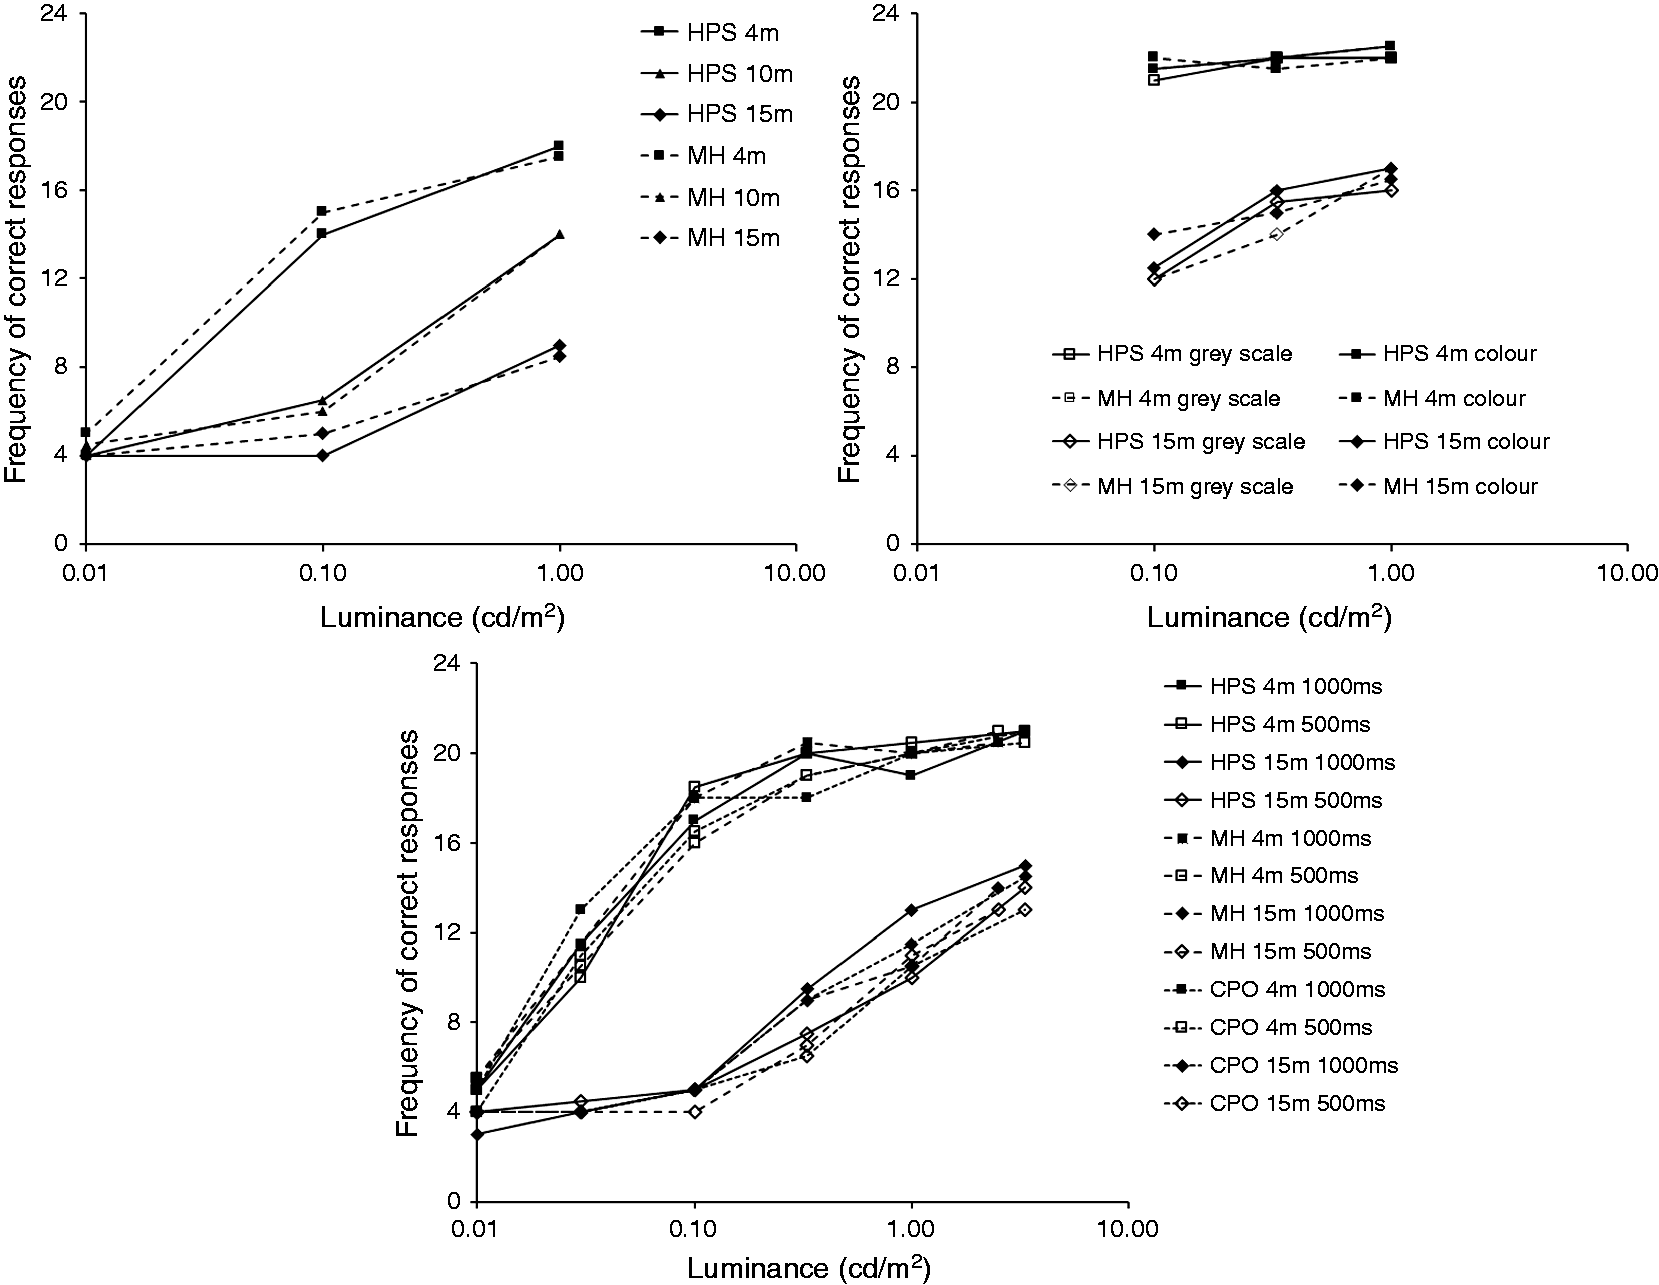
The results from the three experiments are shown in Figure 2. Analyses of these data confirmed that luminance and distance were significant factors in correct recognition frequency. At low luminance (0.01 cd/m2) performance is at chance level, increasing towards a plateau of maximum performance with higher luminance. Closer (i.e. larger) targets were correctly identified with a significantly higher frequency than targets further away (i.e. smaller). In neither study, however, was SPD suggested to be a significant effect. In Figure 2, different SPDs (i.e. lamp types) are given different line types, and these graphs do not indicate any significant or consistent trends.
These conclusions were drawn from consideration of expression recognition performance averaged across all six expressions. The peer reviewer of one study 10 commented that some facial expressions may be easier to detect than others and therefore that the analysis of lighting effects should be repeated but for individual expressions. It may also be the case that recognition of some expressions is more important than others for a pedestrian’s reassurance, or more difficult to discriminate, and hence that particular expressions are differently affected by changes in lighting. This paper therefore presents a further analysis of the results of the facial emotion recognition experiments of Yang and Fotios 10 and Fotios et al. 11 with emotion recognition evaluated for individual expressions.
2. Choice of facial expression
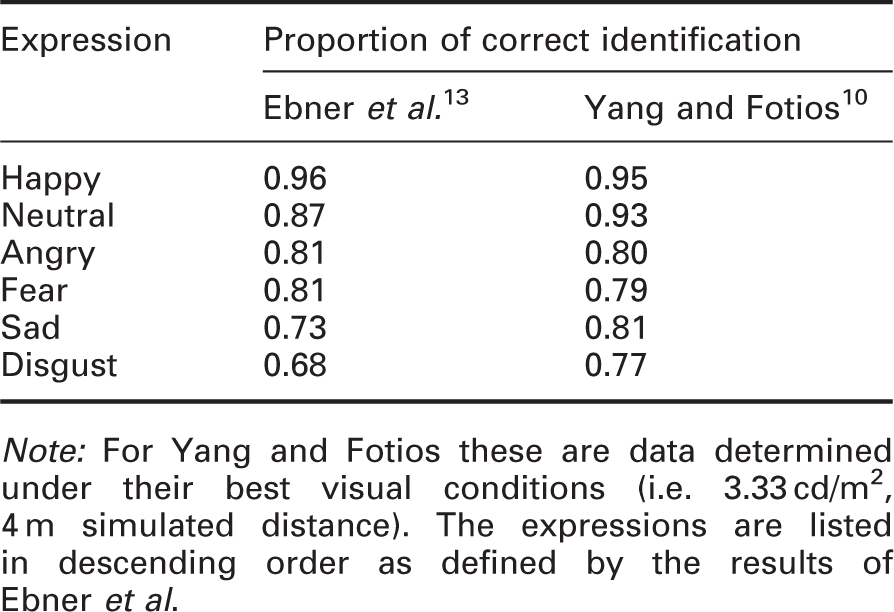
Note: For Yang and Fotios these are data determined under their best visual conditions (i.e. 3.33 cd/m2, 4 m simulated distance). The expressions are listed in descending order as defined by the results of Ebner et al.
Of these six facial expressions, four might be considered negative emotions (angry, disgust, fear and sad) 16 one to be a positive emotion (happy), and one to be ambivalent (neutral). This negativity is recognised by observers; Willis et al. 17 found that happy faces were judged more positively than all other emotions, while neutral faces were judged more favourably than faces displaying negative emotions. Angry and disgusted faces were given the most negative ratings, significantly more so than sad and fearful faces. It might therefore be pertinent to ask whether it is appropriate in investigations of road lighting to use all six expressions, or whether it might be interesting to pick the most salient expressions for interpersonal evaluations (which is not yet known) or to balance the number of positive and negative emotions presented during trials.
Facial expressions used in past studies
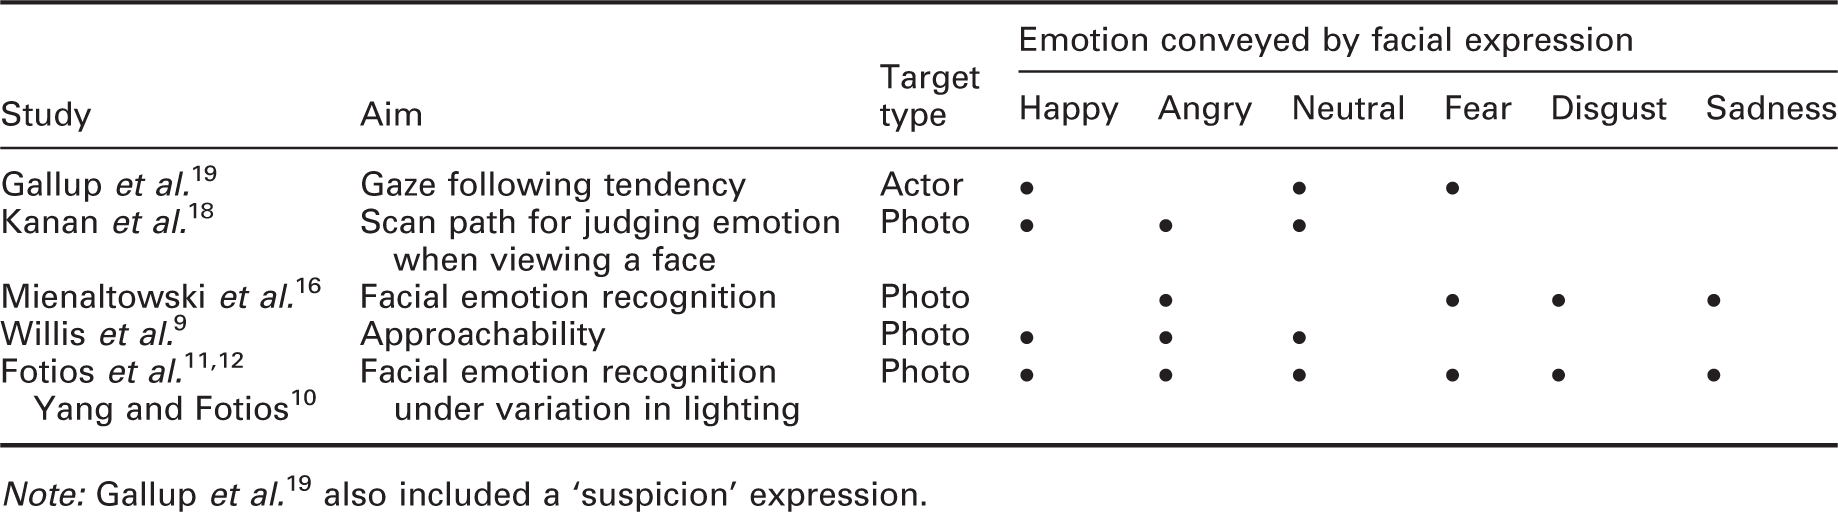
Note: Gallup et al. 19 also included a ‘suspicion’ expression.
3. Analysis with individual expressions
For this paper, the data from two studies of facial emotion recognition were re-analysed.10,11 In the original analyses, a participants’ probability of correctly identifying the target expression was determined as a proportion of the sample of 24 expressions observed (4 actors, 6 expressions) under each combination of luminance, lamp type, target colour and simulated distance. For the current analyses, conclusions regarding the effect of SPD were drawn from separate analyses of the six expressions.
Median frequencies of correct emotion discrimination for each expression, after Yang and Fotios 10
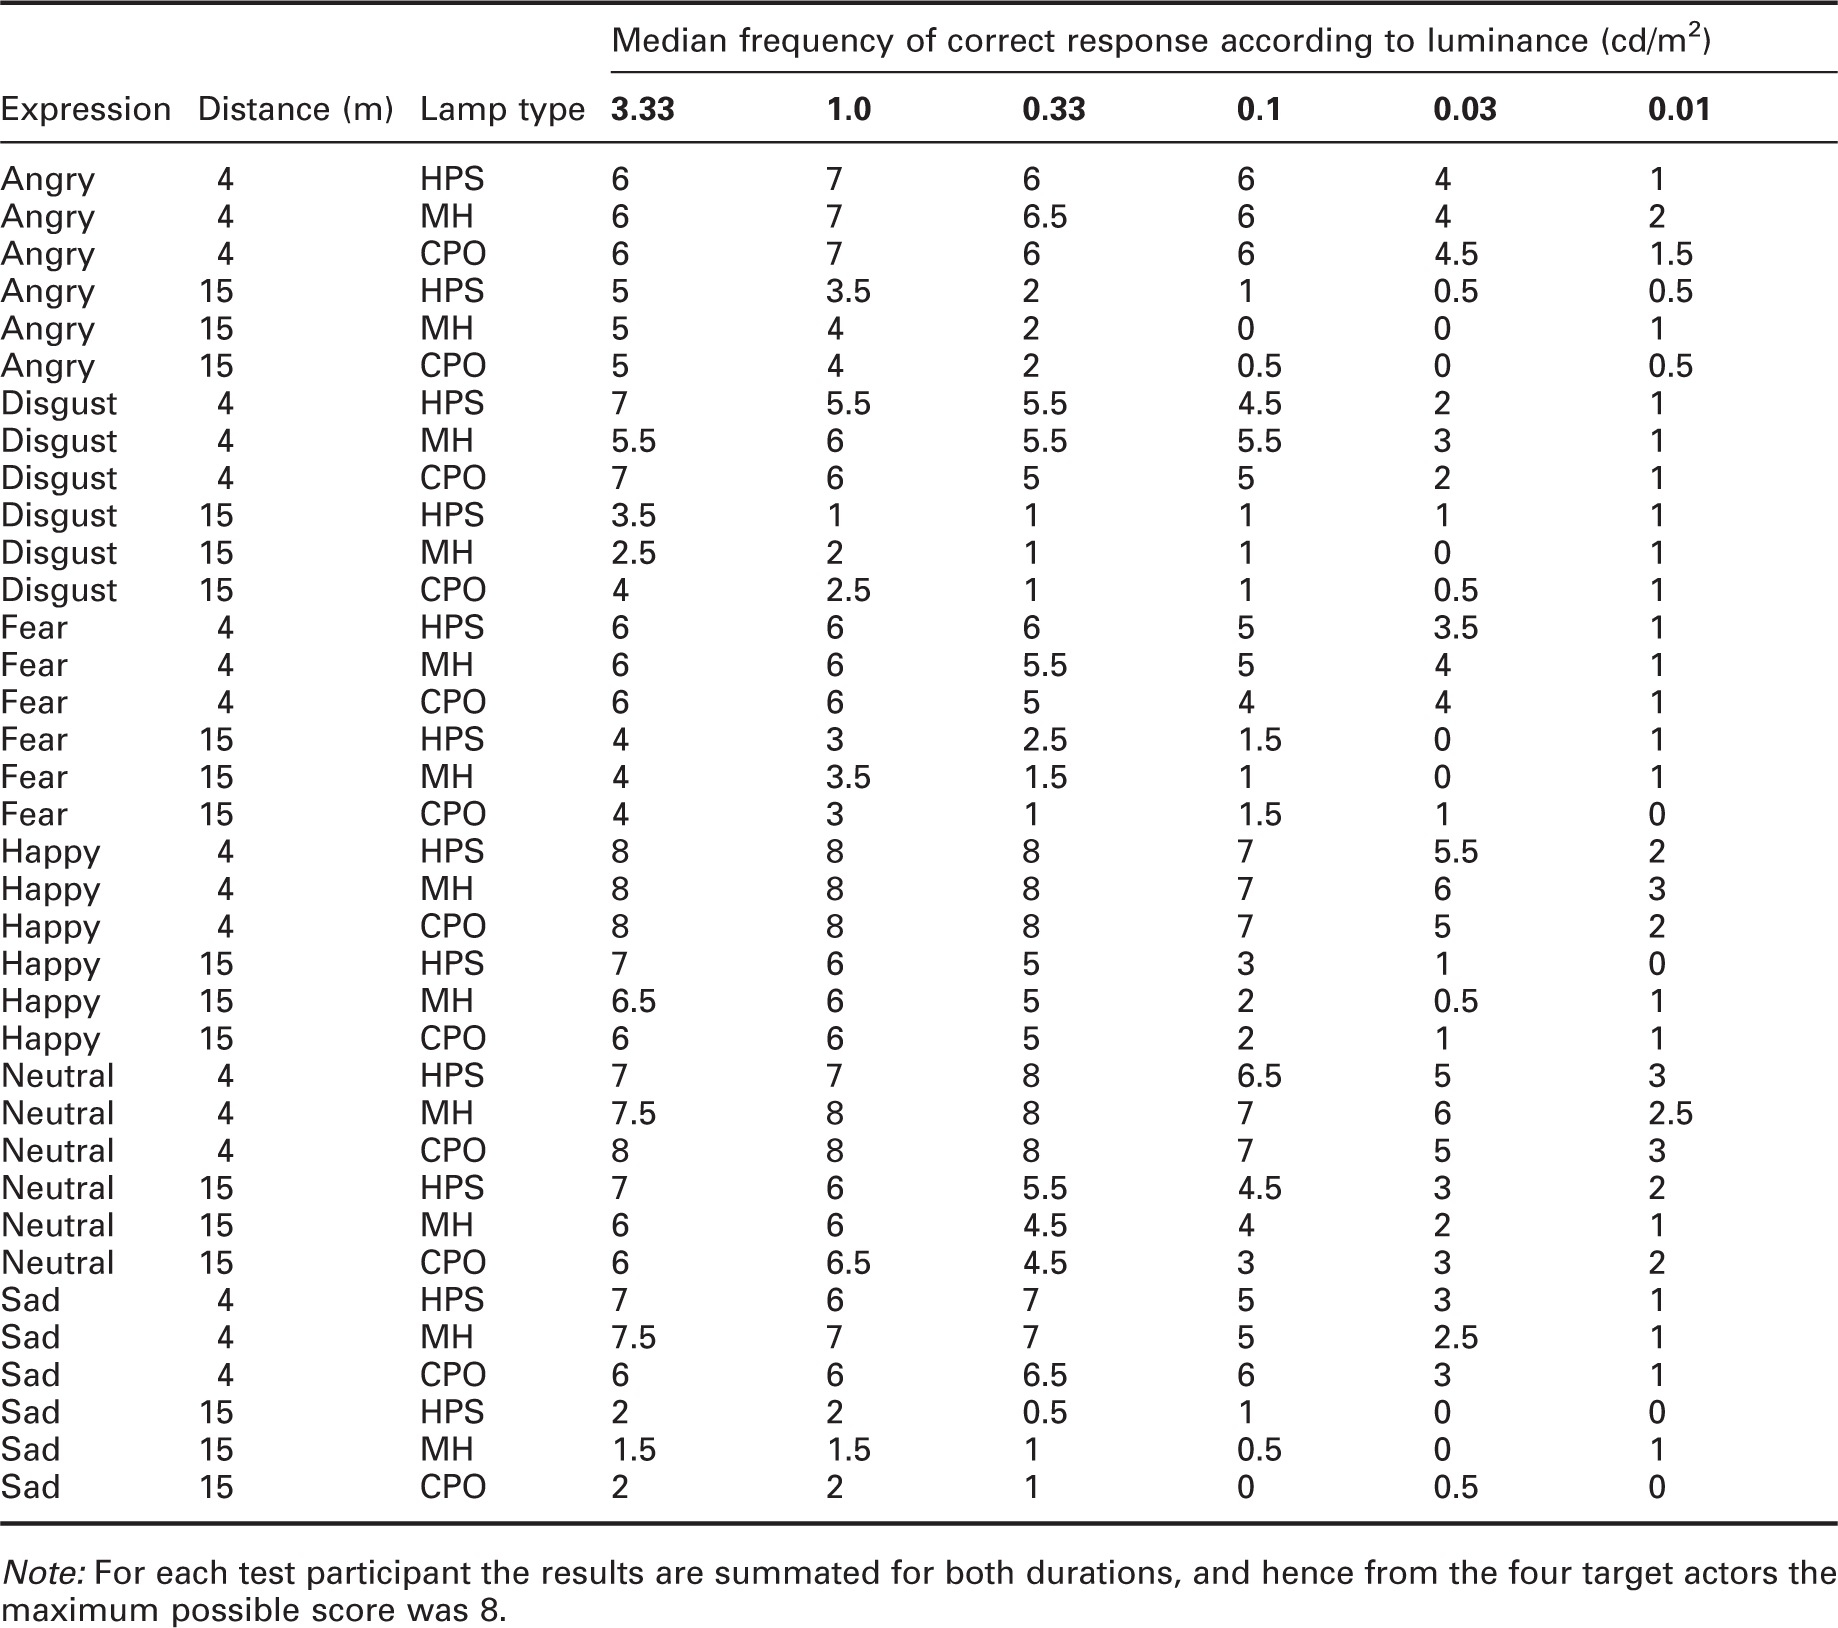
Note: For each test participant the results are summated for both durations, and hence from the four target actors the maximum possible score was 8.
Median frequencies of correct emotion discrimination for each expression, after Fotios et al. 11
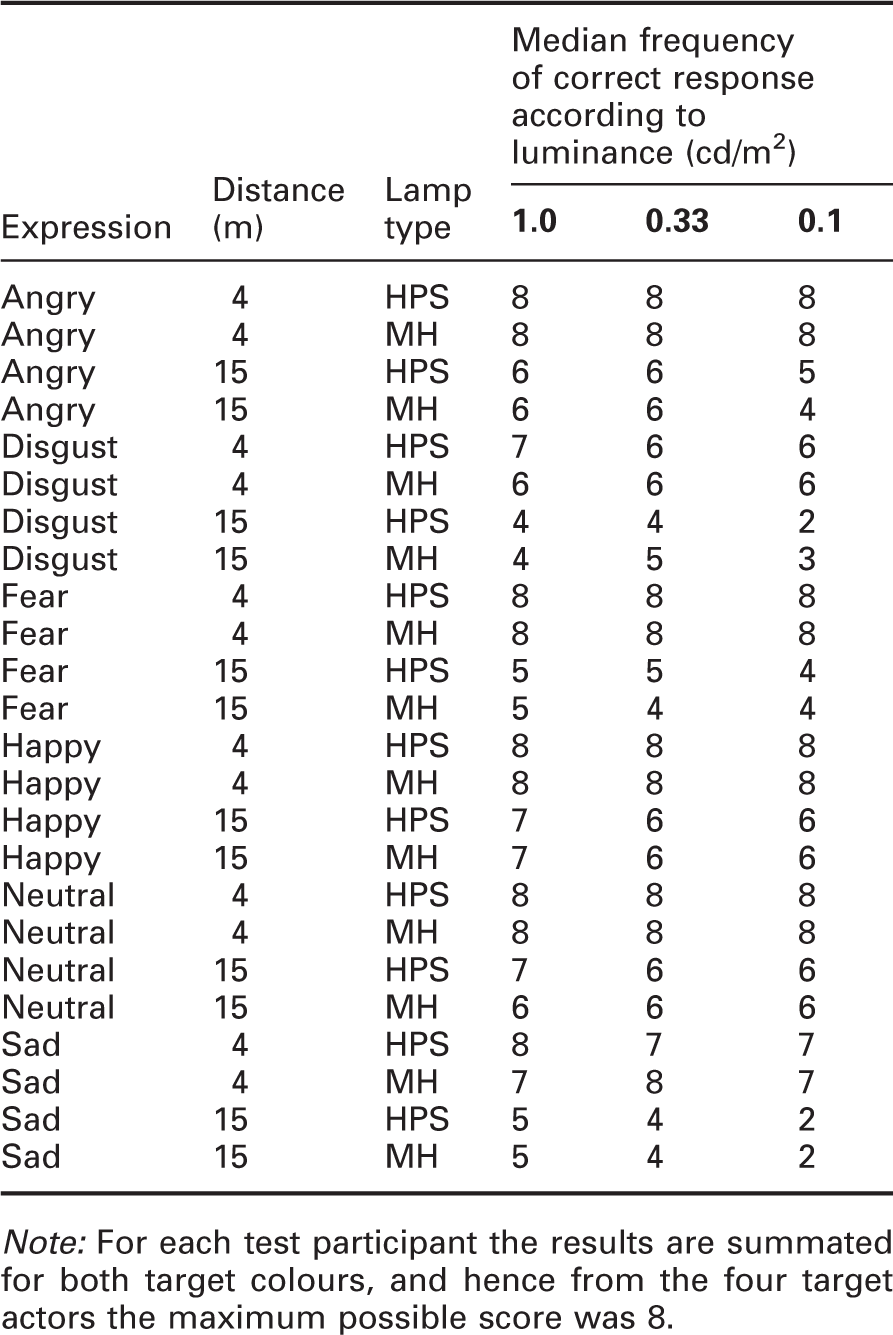
Note: For each test participant the results are summated for both target colours, and hence from the four target actors the maximum possible score was 8.
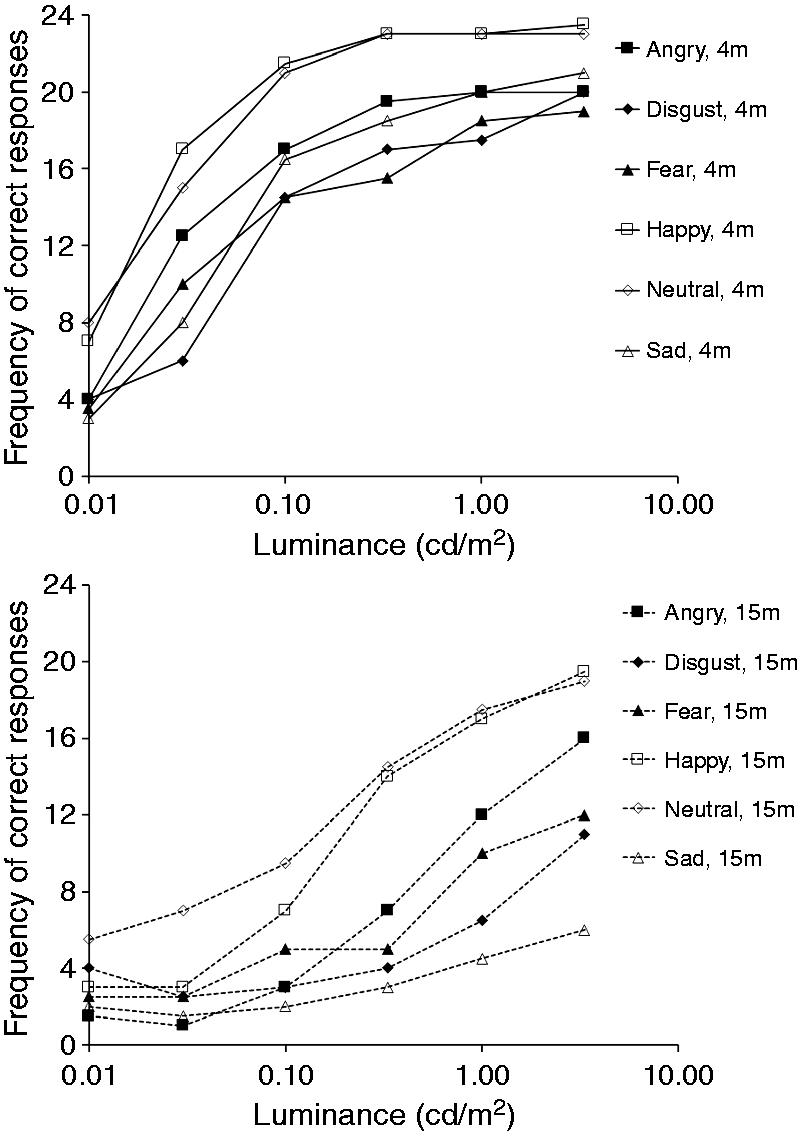
Figures 3 and 4 show these data further summated across lamp type to show separately the expression recognition rate for each expression. The maximum number of correct responses in these data are therefore 24 for Yang and Fotios
10
who used three lamps and 16 for Fotios et al.
11
who used two types of lamp. It can be seen that trials with different expressions led to different frequencies of correct responses. The happy and neutral expressions tended to be identified more frequently than were the other expressions across all luminances, consistent with Table 2.
Median frequencies for correct identification of emotion from facial expression for the six expressions at the two test distances (as identified in the legend) after Yang and Fotios
10
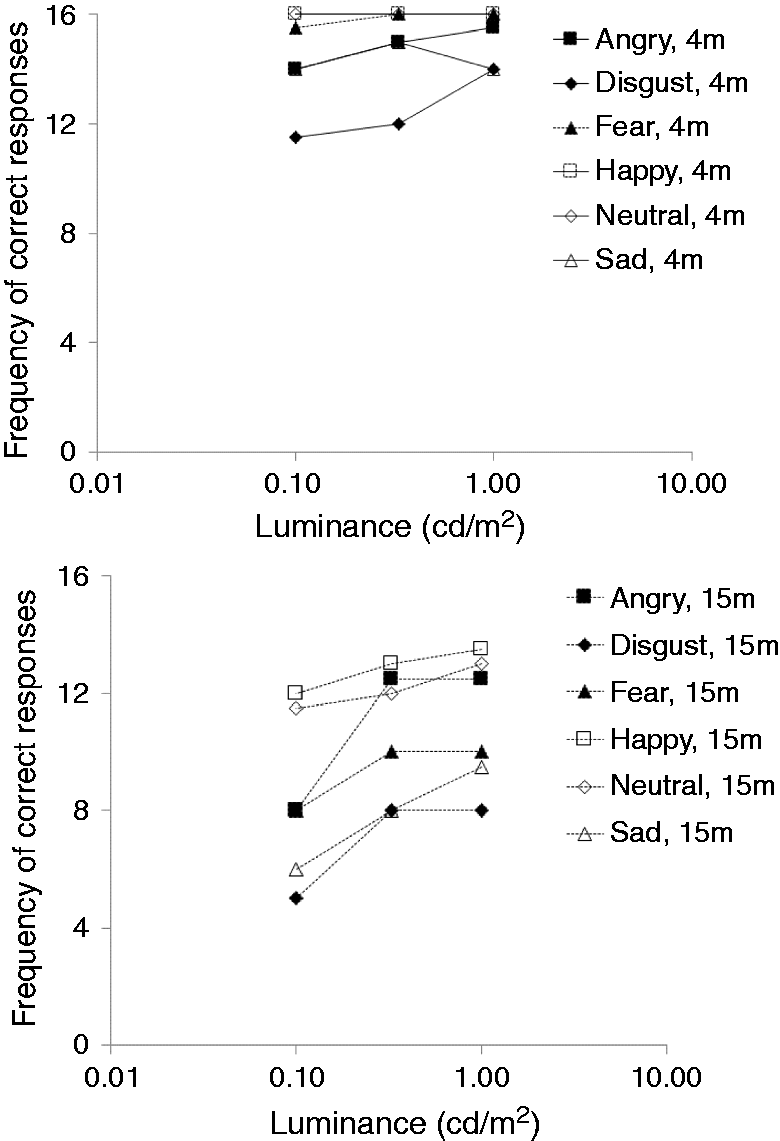
Median frequencies for correct identification of emotion from facial expression for the six expressions at the two test distances (as identified in the legend) after Fotios et al.
11
These data were not drawn from a normally distributed population and hence analyses of differences were done using non-parametric statistical tests for repeated measures, the Wilcoxon test (two samples) and the Friedman test (k samples). While repeated application of such tests raises the risk of falsely indicating a significant effect (a type I error), adjusting the threshold p-value to compensate raises the risk of failing to identify a significant effect (a type II error): Rothman 20 recommends that we do not make adjustment for multiple comparisons. Following the example of previous work, 21 we retained the standard threshold of p < 0.05 and planned to draw conclusions by consideration of the overall pattern of results rather than by placing emphasis on any one result.
p-Values determined using the Friedman test to compare facial expression discrimination performance under three lamps
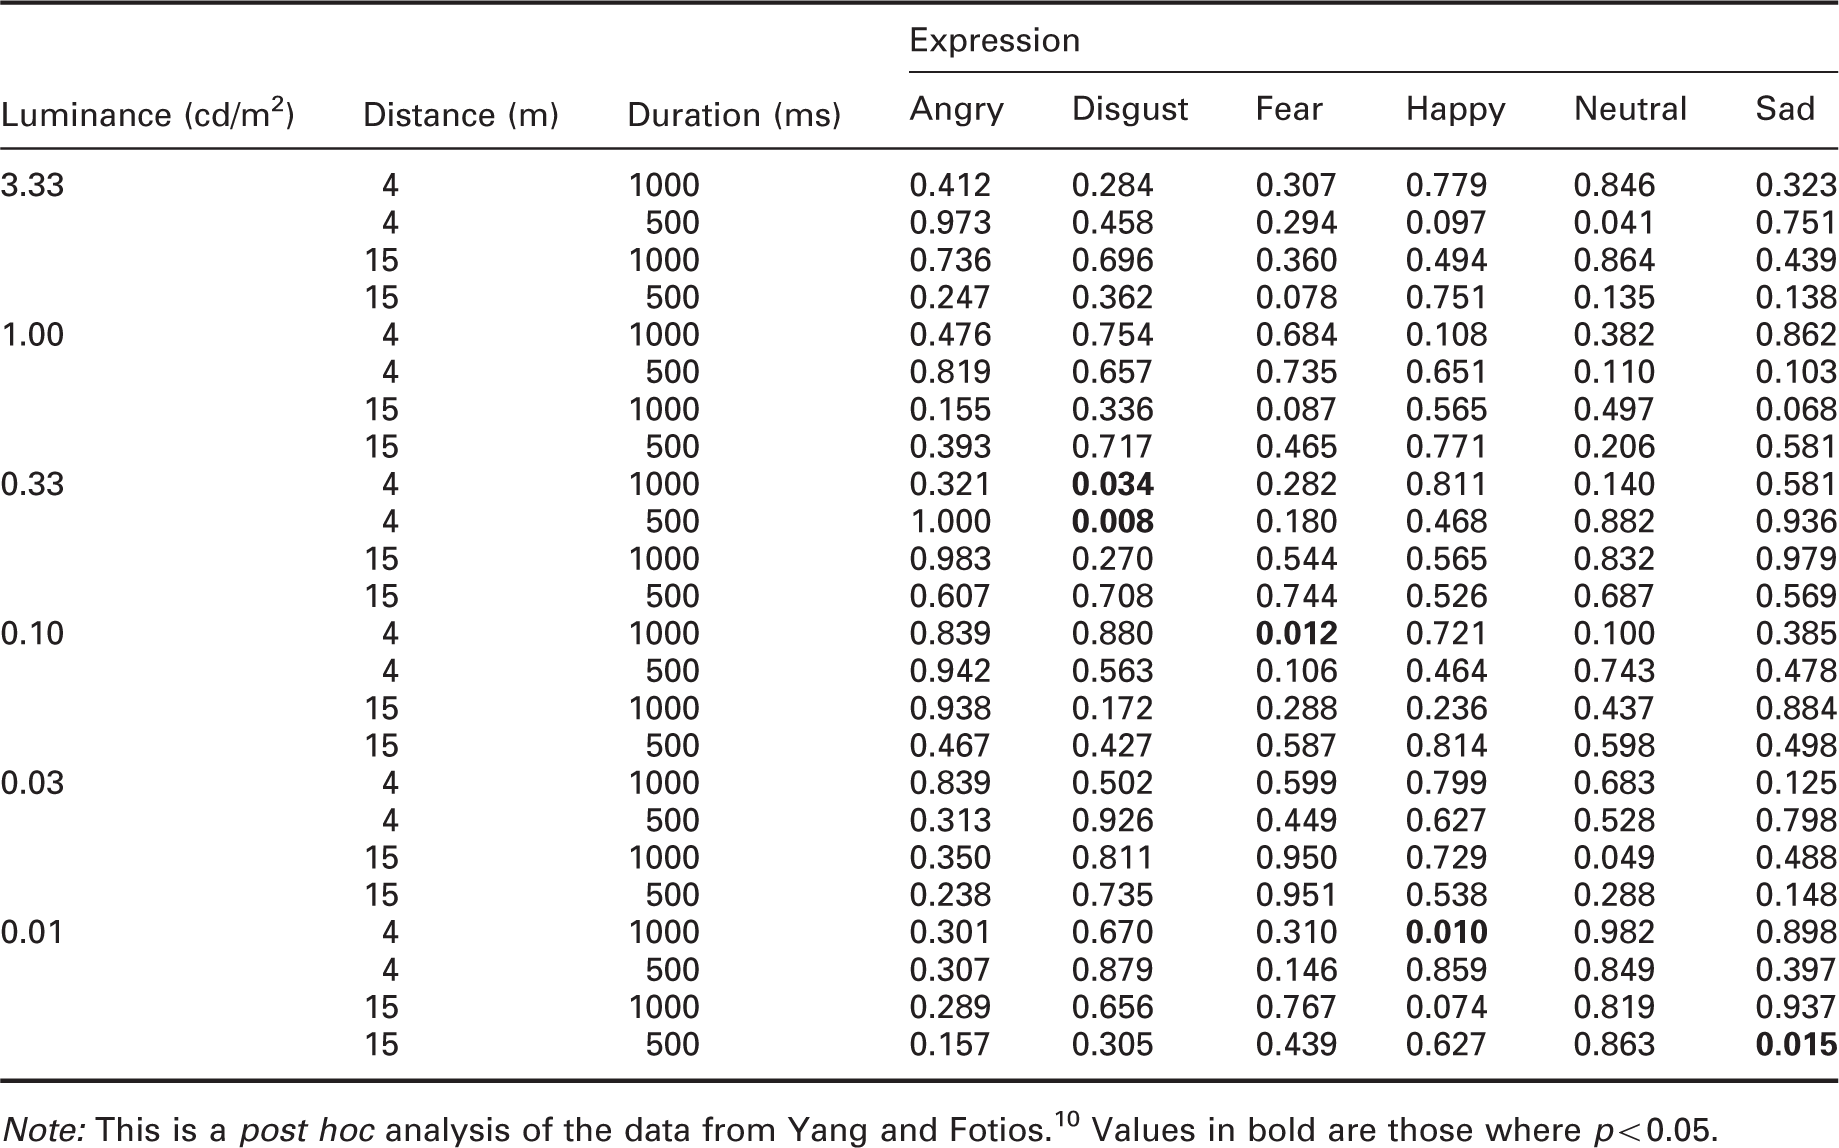
Note: This is a post hoc analysis of the data from Yang and Fotios. 10 Values in bold are those where p < 0.05.
p-Values determined using the Wilcoxon test to compare facial expression discrimination performance under two lamps
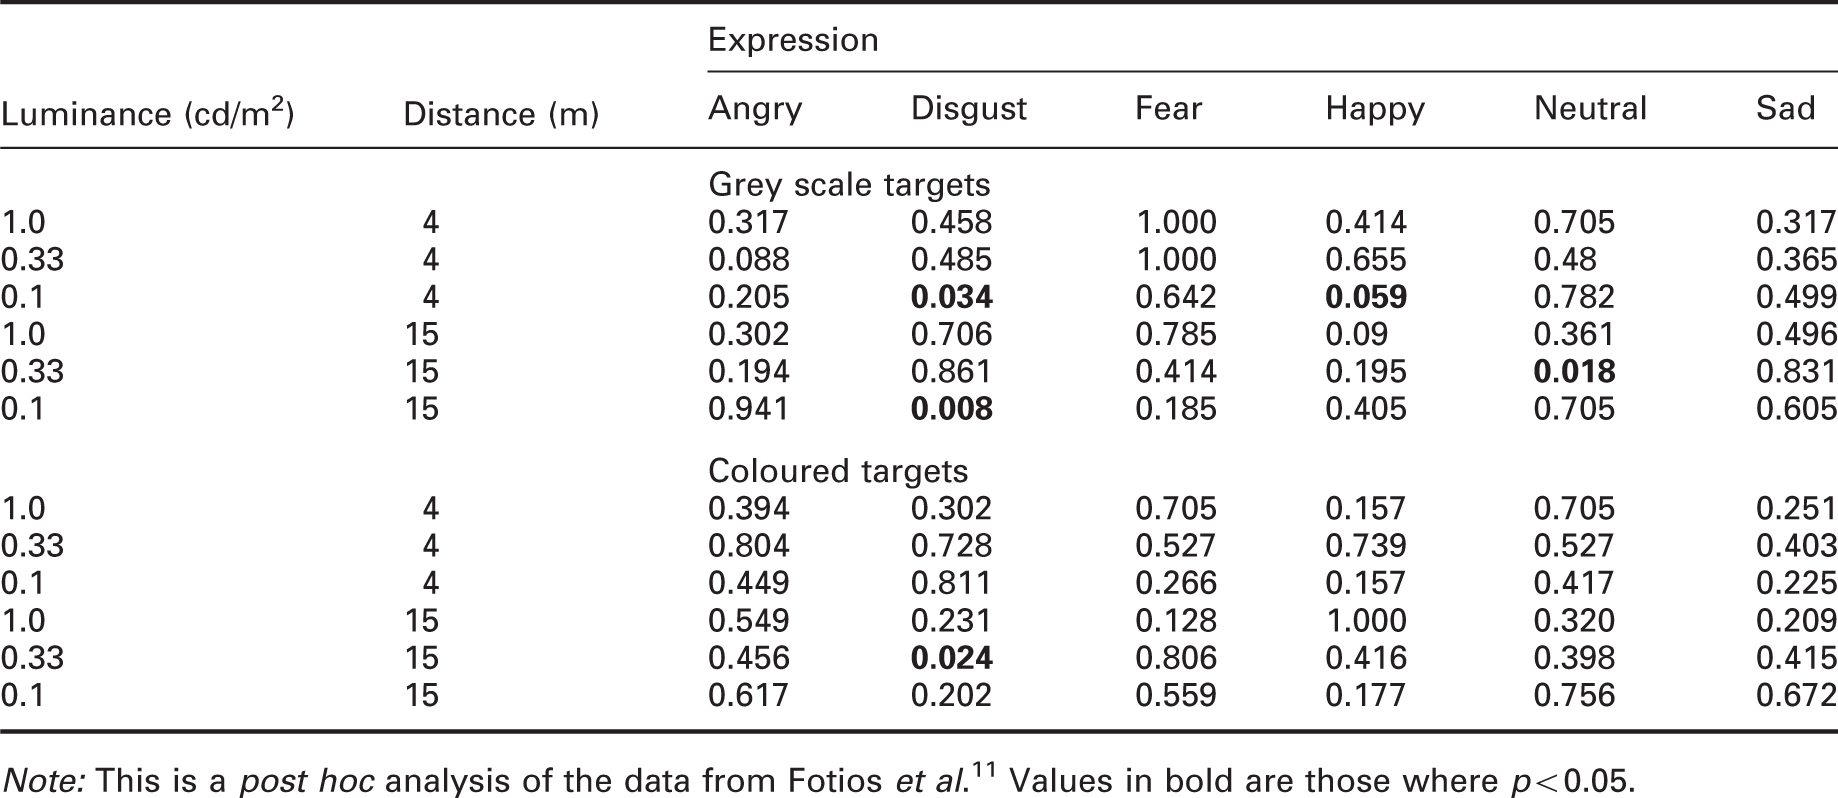
Note: This is a post hoc analysis of the data from Fotios et al. 11 Values in bold are those where p < 0.05.
According to Table 2, a happy expression tends to receive the highest probability of correct identification and disgust the least probability, suggesting disgust to be the more difficult expression to recognise. With tasks of greater difficulty, it appears that SPD is more likely to have an effect 22 and thus the disgust expression is more likely to suggest significant effects of SPD. In Tables 6 and 7, the disgust expression has the most cases where a significant effect of SPD is indicated (5/36), while the happy expression has only two such cases. This suggests that the higher difficulty involved in recognising the disgust expression did lead to higher likelihood of indicating an effect of SPD, but this is not, however, significant nor consistent trend in these data.
The effects of further independent variables were also examined within the individual expressions. Fotios et al. 11 also considered the target colour, using coloured and grey scale versions of the target photographs. Analysis of these data using the Wilcoxon test suggested a significant effect in only 9/72 cases. Effects of luminance and distance were also re-analysed. In these tests luminances ranged from 0.01 cd/m2 to 3.33 cd/m2 (Yang and Fotios 10 ) and 0.10 cd/m2 to 1.0 cd/m2 (Fotios et al. 11 ). It was confirmed that there is a significant effect of luminance for targets seen at 15 m, suggested to be the critical distance, 23 with higher luminances enabling a greater probability of correct identification. This effect of luminance is less prevalent with the targets simulating a distance of 4 m. It was confirmed that there is a significant effect of distance, with a greater probability of correctly identifying expression at 4 m than at 15 m.
4. Conclusion
Previous studies suggested that facial emotion recognition is significantly affected by luminance and observation distance but not by lamp spectrum. These conclusions were confirmed in the current analysis which considered each expression in isolation rather than considering the combined results of all six expressions. This conclusion therefore does not suggest the decision to employ the full range of facial expressions rather than a specific selection in previous work10–12 was erroneous.
Footnotes
Declaration of conflicting interests
The authors declared no potential conflicts of interest with respect to the research, authorship, and/or publication of this article.
Funding
The authors disclosed receipt of the following financial support for the research, authorship, and/or publication of this article: This work was supported by the Engineering and Physical Sciences Research Council (EPSRC) grant numbers EP/H050817 and EP/M02900X/1.
Acknowledgement
Images used in the original trials were taken, with permission, from the FACES database developed by the Max Planck Institute for Human Development.