
Abstract
This paper investigates the critical visual tasks of pedestrians, the first step in a review of design guidance for lighting in residential roads. Eye tracking was used to record pedestrians’ visual fixations when walking outdoors in daytime and after dark with a concurrent dual task to better understand which fixations were critical. Fixations at critical instances, these being shown by slow reactions to the secondary task, were categorised into one of eight groups. Of these, the path and other people were the most frequent items, with people more likely to be fixated at a far distance and the path at a near distance. After dark the path was more likely to be fixated and other people less likely to be fixated compared with daylight.
1. Introduction
Recommended illuminances for road lighting in the UK are given in BS EN13201-2:2003. 1 The target average illuminances for subsidiary roads (which includes residential roads) range between 2 lux and 15 lux in six classes, chosen according to environmental zone and traffic flow. 2 However, these illuminances appear to be based on inappropriate empirical evidence and a desire to maintain current national practices and thus are in need of review. 3
An example of inappropriate evidence can be seen in the data used to establish light levels in the 1992 version of the British Standard 4 which in-turn informed subsequent guidance. 5 The basis comes from a study by Simons et al. 6 which used rating scales to measure lighting quality in a range of roads, but the conclusions drawn in this study were possibly flawed due to stimulus range bias.3,7 This bias results in judgements about a physical variable such as illuminance being anchored on the range of the variable being presented, rather than any objective and consistent assessment. Stimulus range bias has been demonstrated in other lighting contexts.8–10
Without appropriate evidence to inform recommended illuminances on residential roads we may be providing insufficient light for pedestrians to carry out essential visual tasks, or we may be providing too much light and wasting energy. One approach to providing evidence of suitable illuminances is to identify what the important visual tasks are that pedestrians have to perform, and then assessing what is required from the lighting to satisfactorily facilitate these tasks. Previous discussion 11 has suggested the critical tasks are obstacle detection, facial recognition of other pedestrians, and visual orientation, but this proposal has not been validated nor has there been investigation of the relative importance of these tasks.
One way to determine the relative importance of different tasks for pedestrians is to assess what pedestrians look at when walking down a street. While several studies have used eye tracking to record fixations, few, if any, have examined natural environments, after dark, or distinguished between critical and non-critical fixations. This article presents the findings of a study carried out using eye tracking, but with a dual task in order to better identify pedestrians’ critical visual fixations.
2. Eye tracking
Eye-tracking involves monitoring the eye movements of a test participant. Usually, a camera records an image of the eye and the position of where the eye is looking is determined from the positions of the pupil and corneal reflex (for dark-pupil tracking systems). This is overlaid on a video image of the scene facing the participant, captured by a second camera.
To date most eye-tracking research has been carried out in controlled laboratory settings.12–16 For example, in an investigation of gait and locomotion, Patla and Vickers 15 had participants walk three 10 m paths in a laboratory. For two of the paths participants had to place their feet on regularly- or irregularly-spaced footprints on the floor, while on the third path the footprints were absent. They found that travel gaze fixation (where the gaze is held on the near path at a fixed distance slightly ahead of the pedestrian and is carried along at the speed of locomotion) occurred for 59% of total fixation time, with fixations on the footprints accounting for 16%. Vansteenkiste et al. 16 asked cyclists to ride a 15 m path in an internal environment with three lane widths and at three different speeds and concluded that more demanding situations (e.g. narrower path and higher speed) resulted in a more restricted visual search pattern and fewer task-irrelevant fixations. Laboratory-based eye-tracking studies can provide useful information in terms of gaze behaviour but their results can be inconsistent, as demonstrated by the large variation in travel gaze fixations, ranging from 59% reported by Patla and Vickers 15 to 0.27% in Marigold and Patla. 13 It may also be inappropriate to generalise findings from laboratory eye-tracking studies to real-world situations. Marigold and Patla 13 found that test participants looked predominantly at the artificially irregular section of their 8.5 m path but this was perhaps because it was an unusual surface and there was nothing else of interest or distracting in the test laboratory. Other laboratory studies also lack the distracting features that would be present in the real world, such as other pedestrians, buildings and eye-catching objects, and do not account for any influence feelings of safety or reassurance may have on gaze behaviour. 17
The development of mobile eye-tracking systems has enabled eye-tracking to be carried out in natural and dynamic situations. Few studies have been carried out in real outdoor environments where these distractors would be present. Foulsham et al. 18 recorded visual fixations during a 5–10 minute walk to a café and found that 21% of fixation time was directed towards people, 37% towards the path, and 37% towards other objects. A second study carried out in a real environment is that of Davoudian and Raynham 19 who found that 40–50% of fixations were directed towards the path: of relevance to road lighting, this study examined fixations when walking after dark. As with laboratory-based eye-tracking studies, these real-world studies record where the test participants were looking. They do not identify whether these observation points were of importance for the task of safe walking. Walking along a street is not a cognitively taxing task and it is unlikely that all of a pedestrian’s fixations relate to this task. Furthermore, the object or area that a person fixates does not always reflect where their attention is focused, or in other words, gaze location does not uniquely specify the information being extracted 20 : it is possible to attend to areas in our peripheral vision as well as to things unrelated to the visual environment.
There is, however, reason to have some confidence that the distribution of gaze and cognitive process are related.21–23 Land et al. 24 asked subjects to perform a simple everyday task (making a cup of tea) and found that very few fixations were irrelevant to this task. Rothkopf et al. 20 also found that gaze direction was determined by current task requirements during a simulated walking study in which subjects were given different task instructions, e.g. to pick up litter or avoid obstacles.
Eye-tracking is thought to be a useful method in the psychological sciences as a way of studying cognitive processes, largely because of the assumed link between attention and where we look. 20 Our eyes may be unconsciously drawn towards something of interest and our attention follows, or we may choose to look at something in order to direct our attention towards it. A variety of research supports this idea that changes in fixations reflect changes in where our attention is focused. 25 Attention may even be directed towards an object in our visual field immediately before a saccade and fixation is made to that location. 26 However, the connection between eye movements and attention is not clear cut. For example, it is possible for an object to be fixated without it being cognitively processed or entering working memory. 27 The direction of attention can differ from the direction of gaze, and allocation of such covert attention demonstrates we cannot assume what is currently fixated is also what is currently of cognitive relevance. 28 For example, in an eye-tracking study involving observation of driving videos, participants were able to recall 20% of objects that were not fixated while only 50% of objects that were fixated were recalled. 29 It is also possible for our cognitive spotlight, attention, to be directed internally and not focused on anything in the visual environment. This occurs when we are caught up in our own thoughts or when our mind wanders. Our fixations during these instances are not connected with the focus of our attention, and this has been demonstrated particularly in eye-tracking studies of reading, where the comprehension of text is reduced during instances of mind-wandering despite fixating on words. 30 Finally, fixations may not always be relevant to the primary task being undertaken, particularly if that task is routine and requires little cognitive resources. For example, although Davoudian and Raynham 19 found that 40–50% of the fixations of a pedestrian walking down a street were on the pavement, they suggested that for part of this time the pedestrians “were not performing visual tasks that were important to them walking along the road.”
In summary, fixations do not necessarily indicate attention is being directed towards the fixated object, or that the fixated object is important and relevant to the current task. If the important visual tasks performed by pedestrians when walking along a street are to be determined using eye-tracking, a method is required to identify fixations that are critical to the task of walking.
An attempt to identify critical fixations is reported in this paper, and this was achieved through use of a secondary cognitive task running concurrently with the task of walking. Research related to the subject of attention has shown that a secondary task uses up attentional resources, reducing the attention that can be directed towards the primary task. Boot et al. 31 found that a concurrent auditory task affected the allocation of cognitive resources to a visual search task. Performance on a secondary task can indicate the cognitive resources allocated to that task and as a result the resources allocated to the primary task, assuming they are both using the same pool of cognitive resources. 32 Reductions in performance on the secondary task may reflect a diversion of cognitive resources or attention to the primary task. This concept was tested and confirmed during a pilot study. 33 Nine participants viewed a computer screen which was either blank or showed distracting images. During the viewing participants had to perform a reaction time task by pressing a mouse button in response to a frequent but randomly-spaced auditory stimulus. Reaction times were significantly slower when distracting images were presented compared to a blank screen, suggesting visual distractions reduce performance in a response-to-auditory-stimulus task.
The experiment described in this paper used a similar auditory response task to indicate instances of diverted attention to something important in the visual environment. This task was carried out whilst participants also walked an outside route wearing eye-tracking equipment. Analysis of the eye-tracking output at instances of increased reaction time would indicate what objects and items in the visual environment were significant to a pedestrian.
Slower reaction times may be caused by something other than a significant item in the external environment, for example in instances of daydreaming (when attention is focused on internal thoughts). However, daydreaming is likely to be reduced by the introduction of the secondary task, as it increases perceptual load. This has been shown to reduce processing of task-irrelevant stimuli, 34 including task-unrelated thoughts, i.e. daydreaming. 35 Fixations on non-critical items are also likely to be reduced by the reduction in available processing resources caused by the secondary task.
3. Method
3.1. Participants
Forty participants took part in the experiment (53% male; 58% in the 18–29 age group, 35% in the 30–49 age group and 7% in the 50+ age group). Participants were screened for having normal or corrected-to-normal vision using a Landolt ring acuity test and the Ishihara colour perception test. In all, 40% of participants wore glasses or contact lenses for viewing short- or long-distance objects. All participants reported having normal or good hearing.
3.2. Equipment
The eye-tracking system used in this experiment was the iView X HED made by SensoMotoric Instruments (Figure 1). Two cameras are mounted on a cycle helmet worn by the participant. One camera records the scene facing the participant, the other camera captures an image of the right eye. A five-point calibration procedure was used to create a reliable track of the participants’ gaze position. The calibration took place outside and at a distance of 2 m, following the manufacturer’s guidance. The eye-tracking helmet was connected to a laptop carried in a rucksack by the participant. The eye-tracking system provides a video output showing the gaze position as a cursor overlay on the video of the scene facing the participant. In addition, a data file is created with details of the eye-tracking samples recorded by the system, including coordinates of the gaze position. This can be used to detect fixations, saccades and blinks using software provided with the system. Gaze position accuracy is reported by the manufacturer to be typically between 0.5° and 1.0°.
iView X HED mobile eye tracking system (left) and screenshot from a recorded video (right). White cursor shows current gaze location, amplified for this image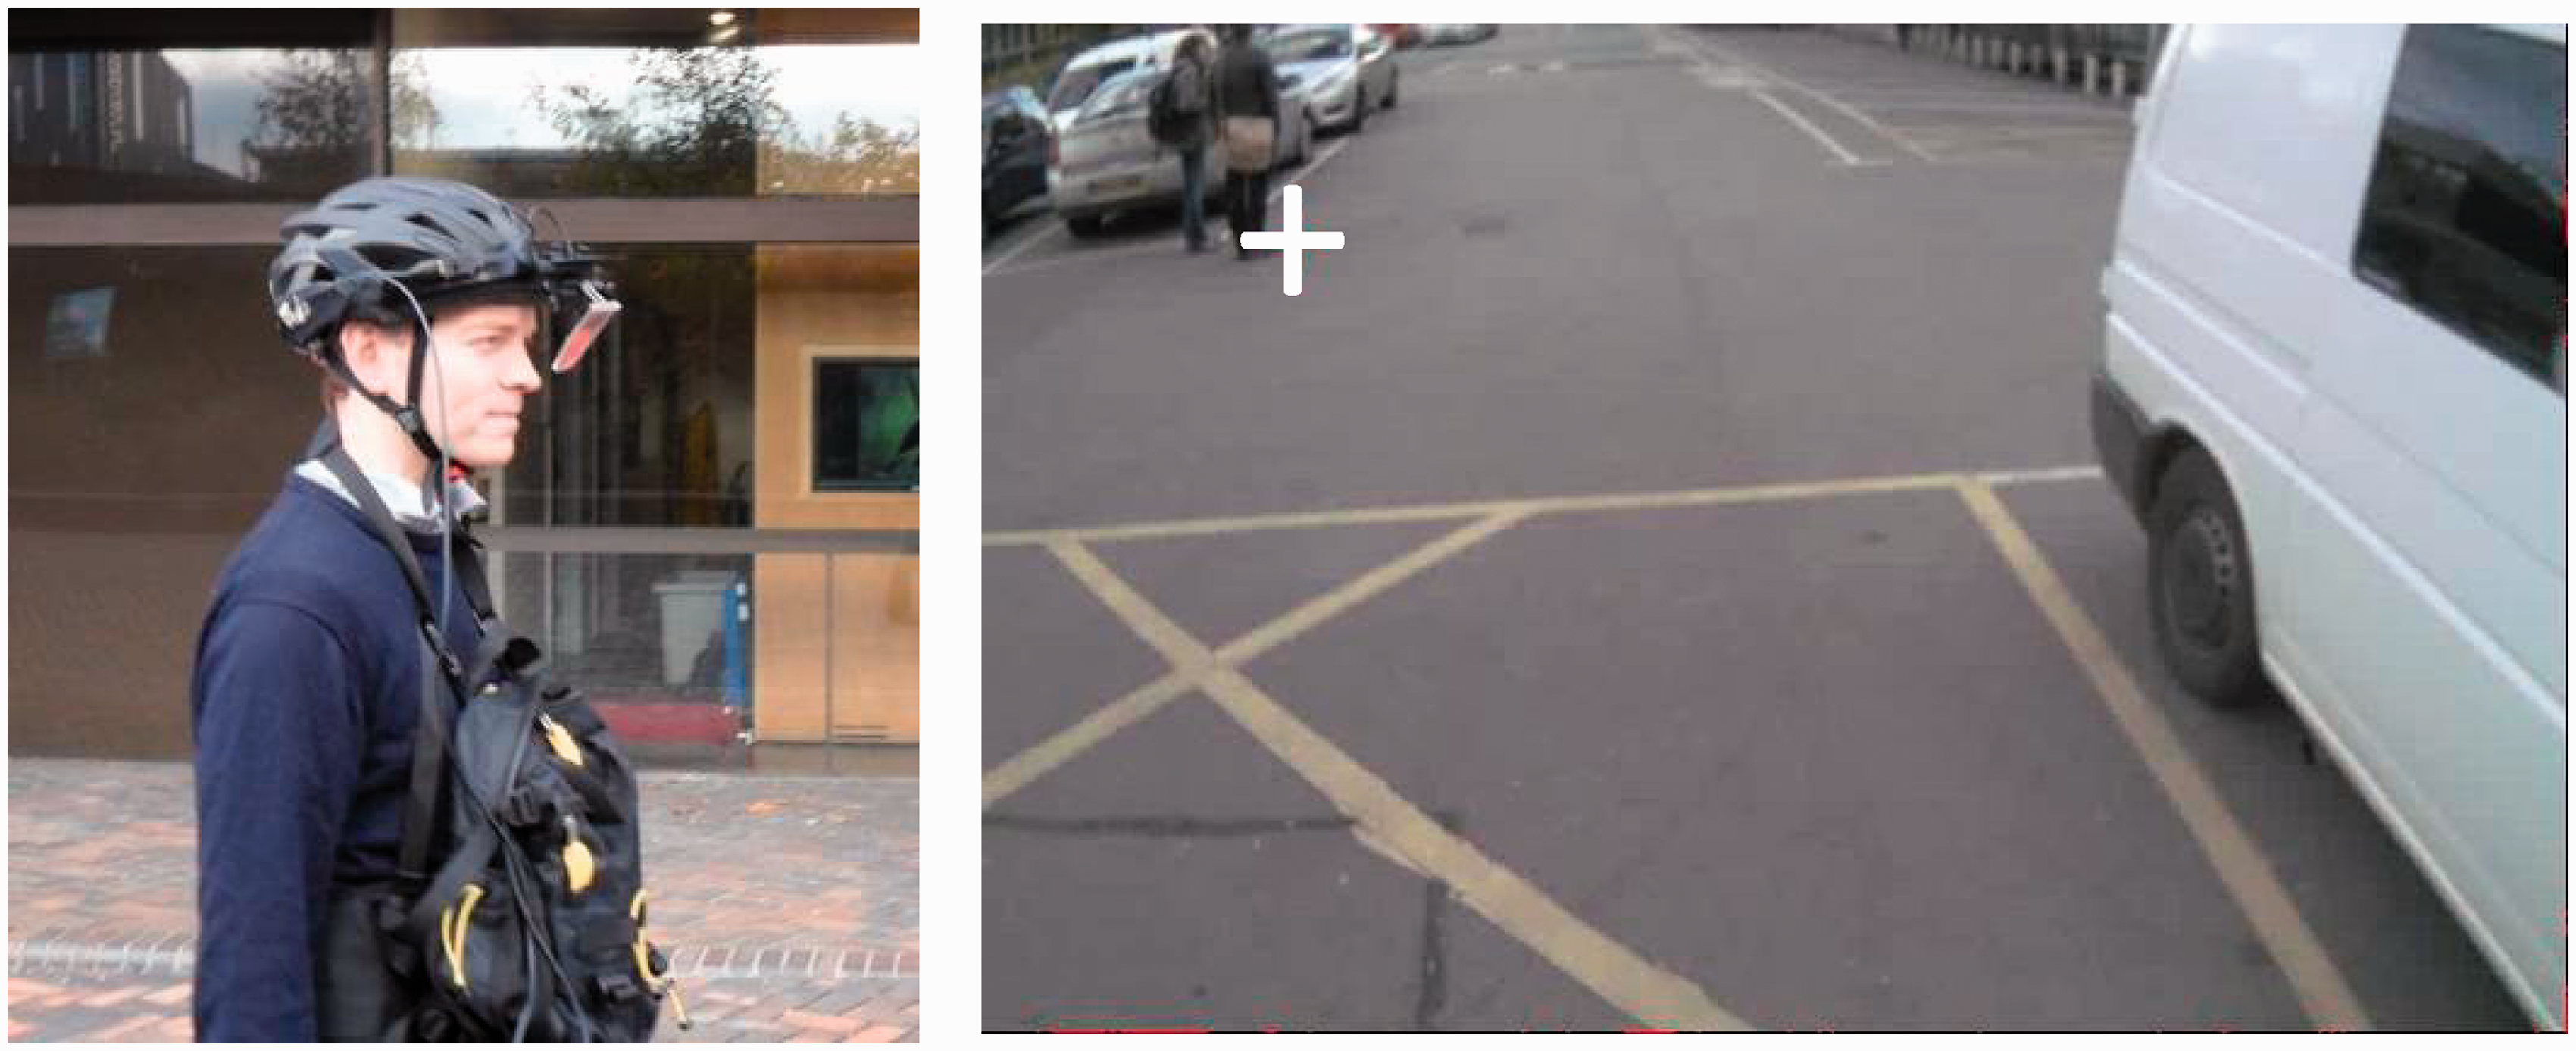
An Arduino microcontroller with connected mini-speaker and response button was used to provide the concurrent dual task. The speaker was attached to the underside of the eye-tracking helmet, close to the left ear. The speaker begins emitting an audible beep when power is supplied (by connecting to the eye-tracking laptop). These beeps were programmed to occur at random intervals between 1 s and 3 s. The timing of each beep and each press on the response button was recorded.
3.3. Procedure
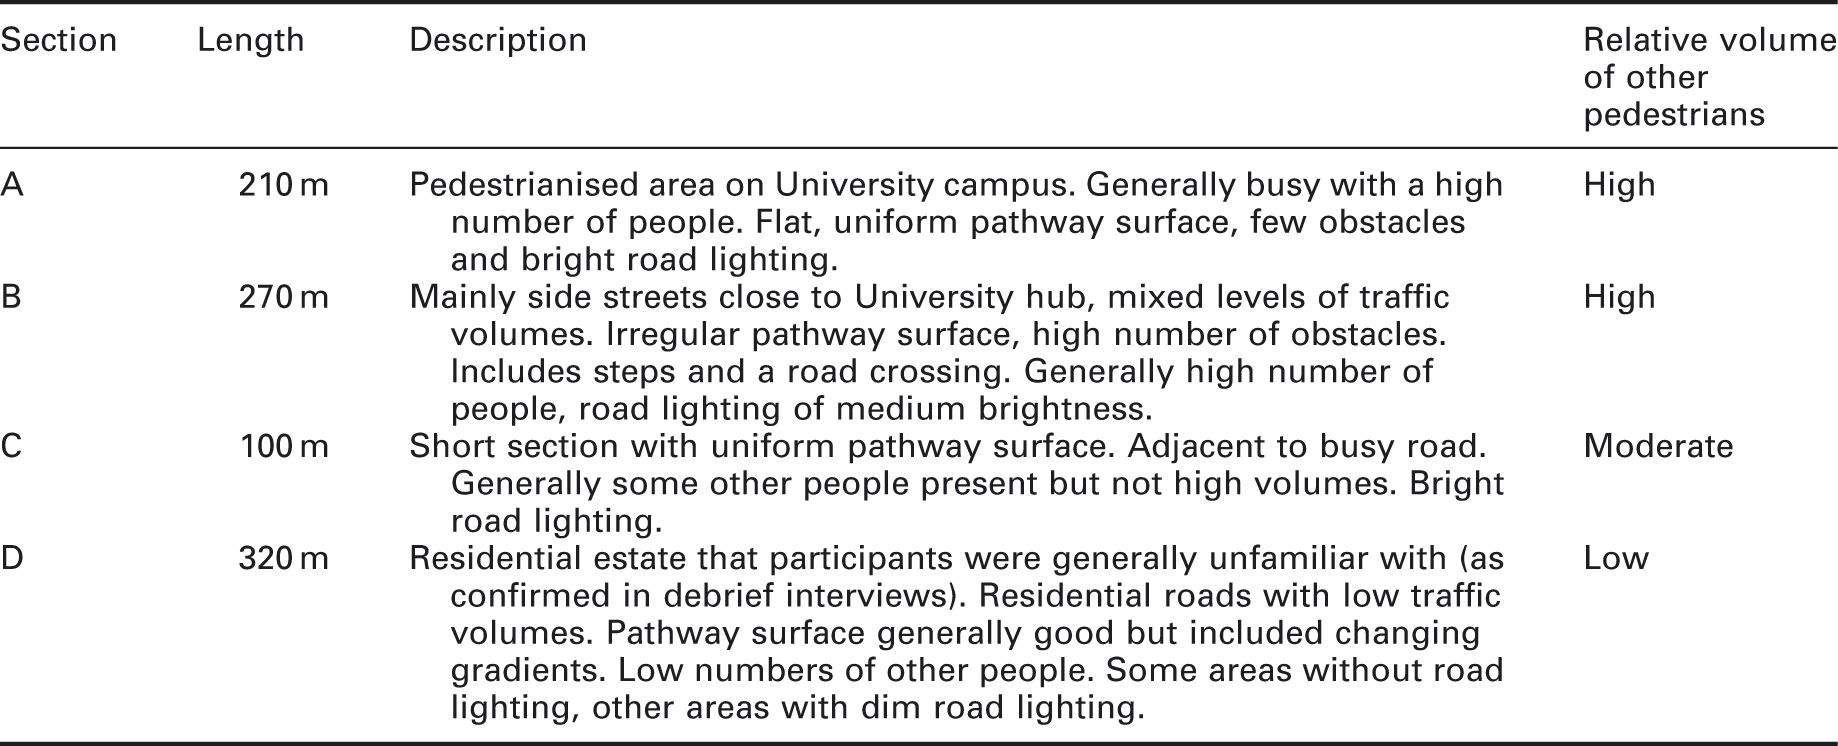
Participants were asked to walk a short route circumnavigating the University of Sheffield campus whilst wearing the eye-tracking equipment and carrying out the dual task by pressing the button after every auditory stimulus. The route was approximately 900 m in length and comprised four sections. Each section was chosen to provide different characteristics, such as road crossings or uneven terrain, as described in Table 1 and shown in Figure 2. Each participant carried out the walk twice, once during hours of daylight and once during hours of darkness. Trials during hours of daylight occurred between 08:00 and 16:00, whilst after-dark trials occurred between 17:00 and 20:00.
Photographs of the four route sections. Clockwise from top-left: route section A, B, C and D. Descriptions of the four route sections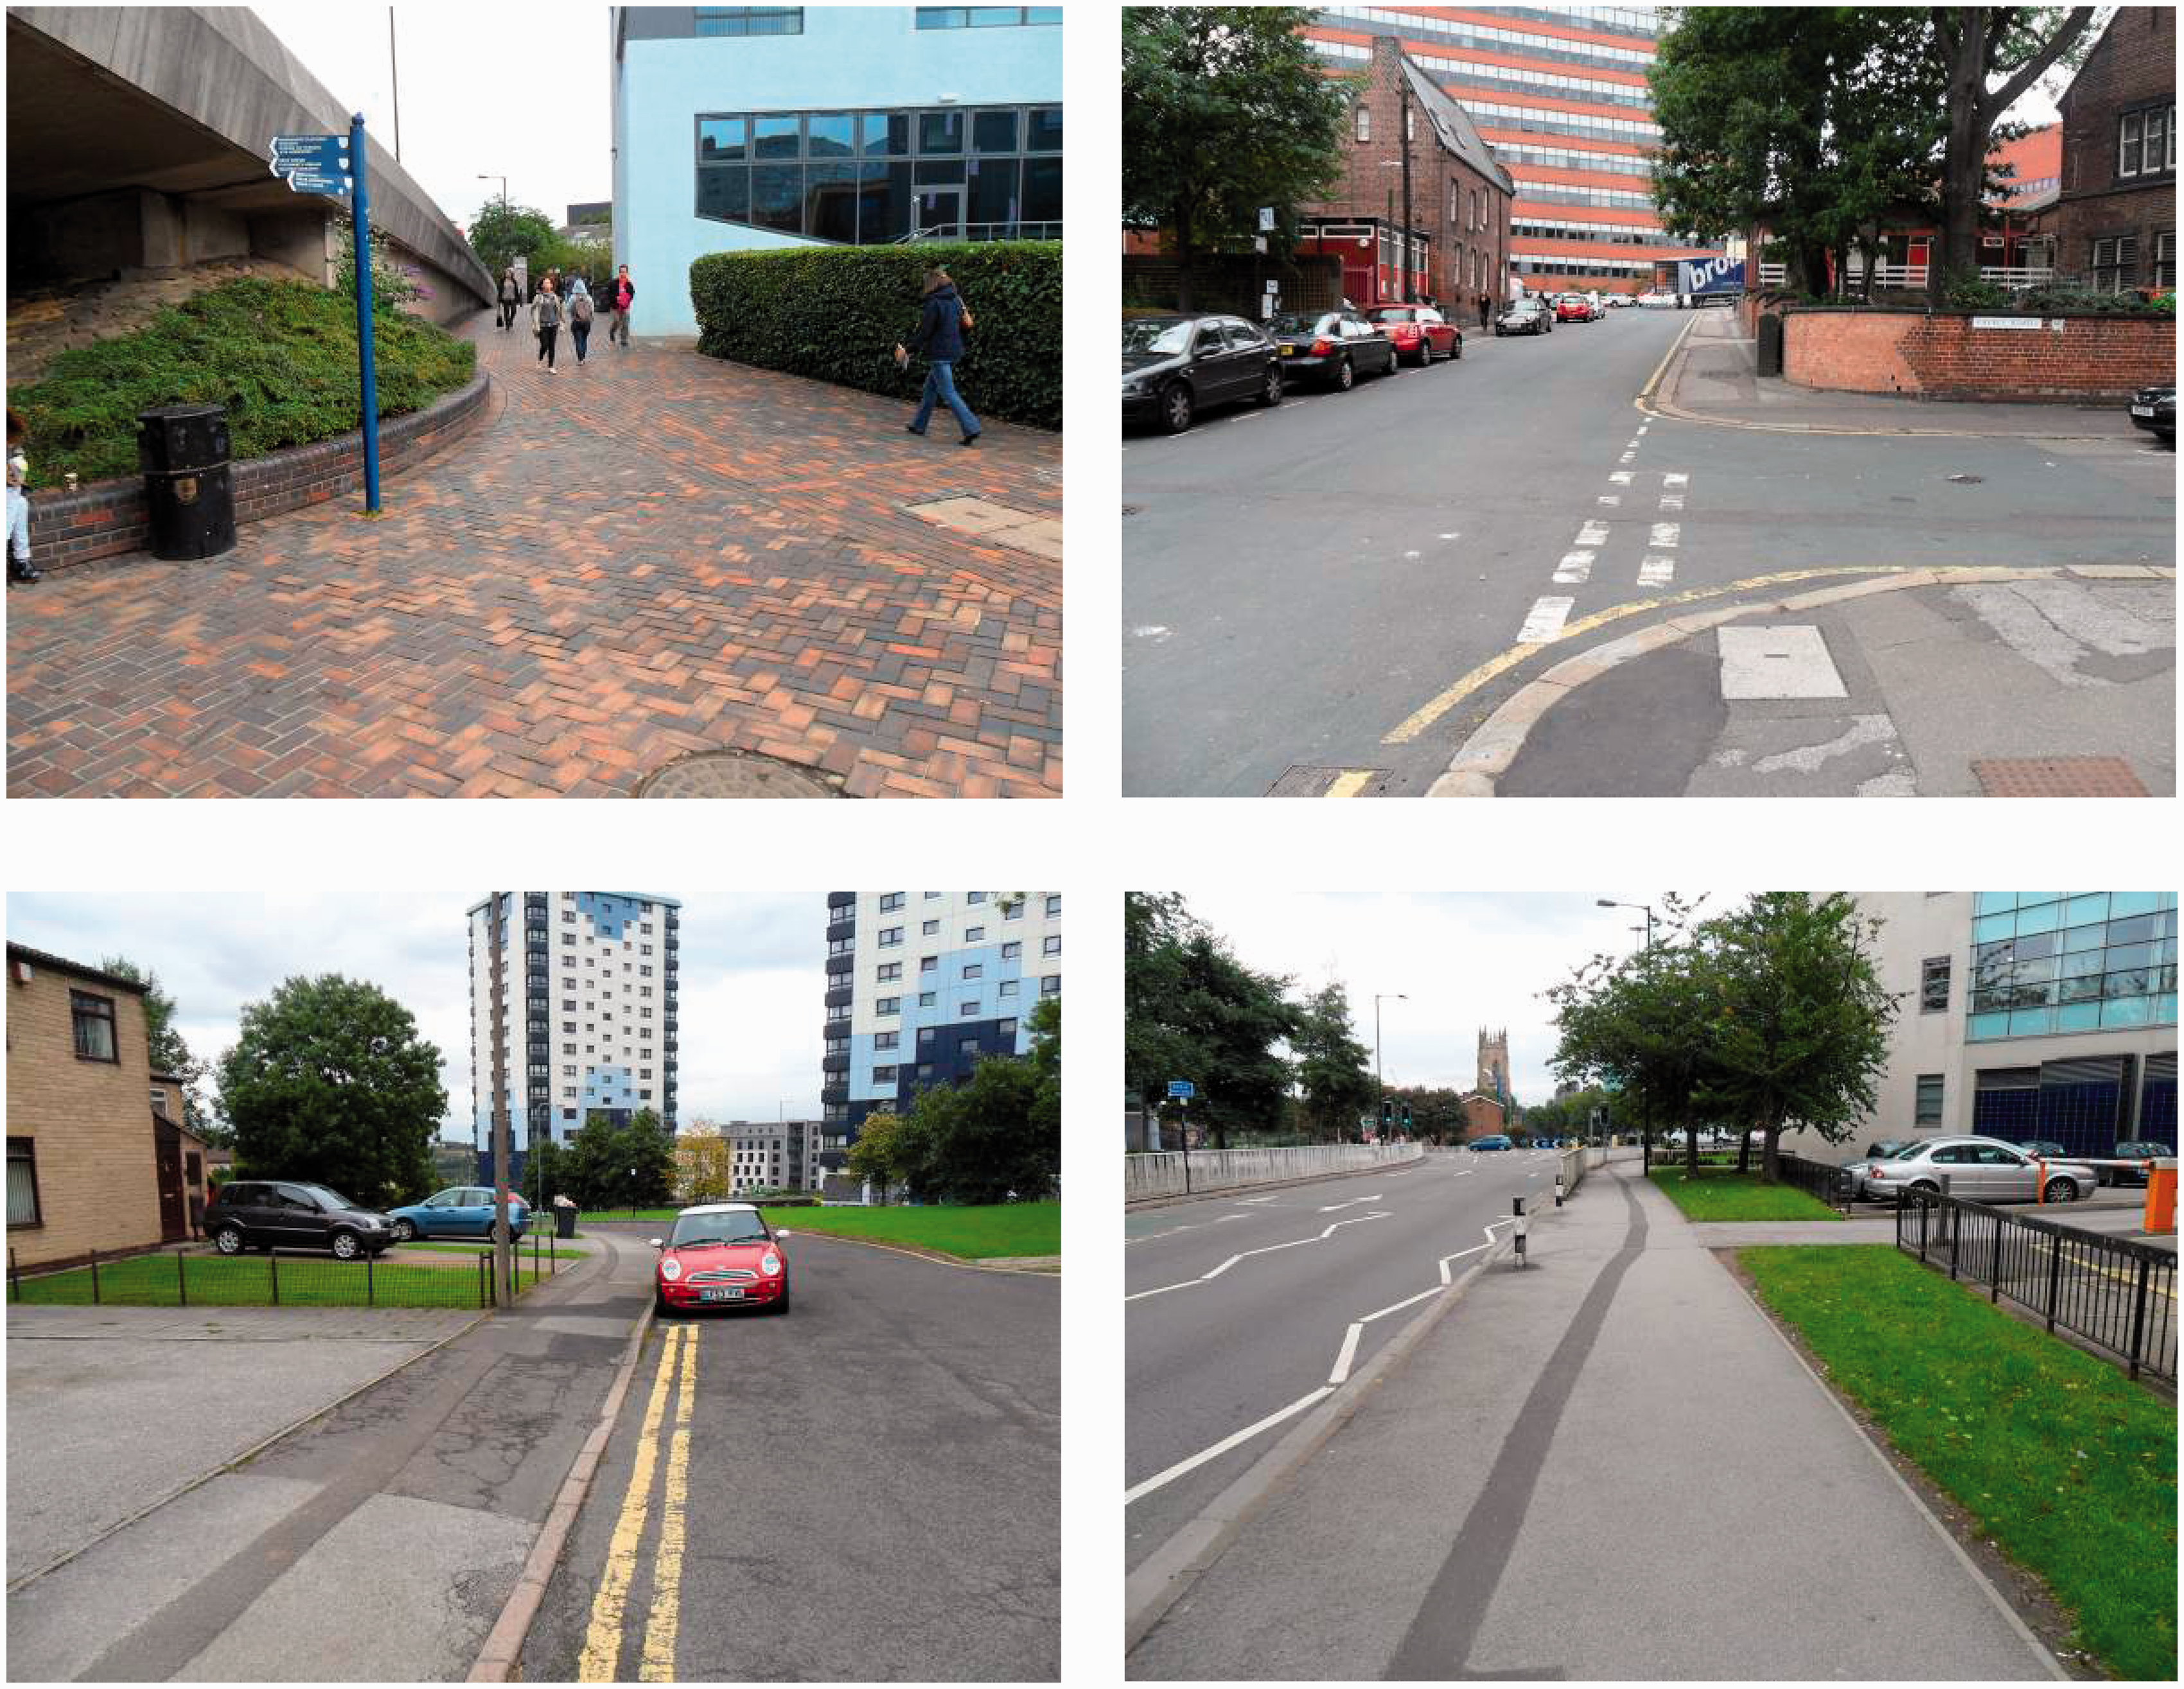
For each trial, participants attended the lighting laboratory at the University of Sheffield. On attending the first trial participants completed a Landolt ring acuity test and an Ishihara colour perception test under normal office lighting conditions. They were then set up with the eye-tracking and dual-task equipment and were given an opportunity to practice responding to the auditory stimuli. They were instructed to press the button in response to every beep as quickly as possible when they began walking the route. When participants were comfortable with the dual task they were taken outside to complete the eye-tracking calibration procedure, and then taken to the start of the route. Task instructions have been shown to focus attention allocation in a dual task setting, 36 and aimed to reduce instances of mind-wandering. At the beginning of each route section participants were given a description of where to walk for that section and were shown a schematic map of the route. Immediately before participants began walking the section they were asked to hold the response button in front of the forward-facing camera on the helmet and give five rapid button presses. This was to provide a timestamp in the dual-task data for the start of the section, and a point in the recorded video that could be synchronised with the dual-task data. A researcher followed the participant a short distance behind (approximately 5 m) as they walked each section. The same procedure (but without the initial vision tests) was carried out for the second session. The order of the light condition (daylight or after dark) and route direction (clockwise or anti-clockwise) was counterbalanced.
4. Results
4.1. Reaction times
Reaction times were recorded for each response to the auditory stimulus. The overall mean reaction time (MRT) across both sessions was 347 ms (s.d. = 83 ms). No difference in MRT was suggested between the day and after-dark conditions (347 ms for both conditions), or between route directions (346 ms vs 347 ms), and this was confirmed by paired-samples t-tests (t(38) = −0.015, p > 0.05 and t(38) = 0.126, p > 0.05, respectively). The MRT for male participants was lower than for female participants (male MRT = 333 ms, female MRT = 358 ms) but an independent-samples t-test did not suggest this difference to be statistically significant (t(38) = 0.952, p > 0.05). MRTs appeared to be different across the four sections and this was confirmed by a one-way repeated-measures ANOVA (F(3, 117) = 6.74, p < 0.001). Post-hoc tests suggested the MRT on section C (323 ms) was significantly shorter than on sections A and D (349 ms on both sections), but did not differ from section B (340 ms).
Delayed reaction times to the auditory stimuli were used to identify critical times – instances when the participant’s attention may have been diverted towards something important in the visual environment. A delayed response was defined as being two standard deviations greater than the participant’s MRT for that session, based on the procedure for identifying outlying values in data. 37 In addition, failure to respond to an auditory stimulus was also classed as a critical time.
4.2. Fixation categories
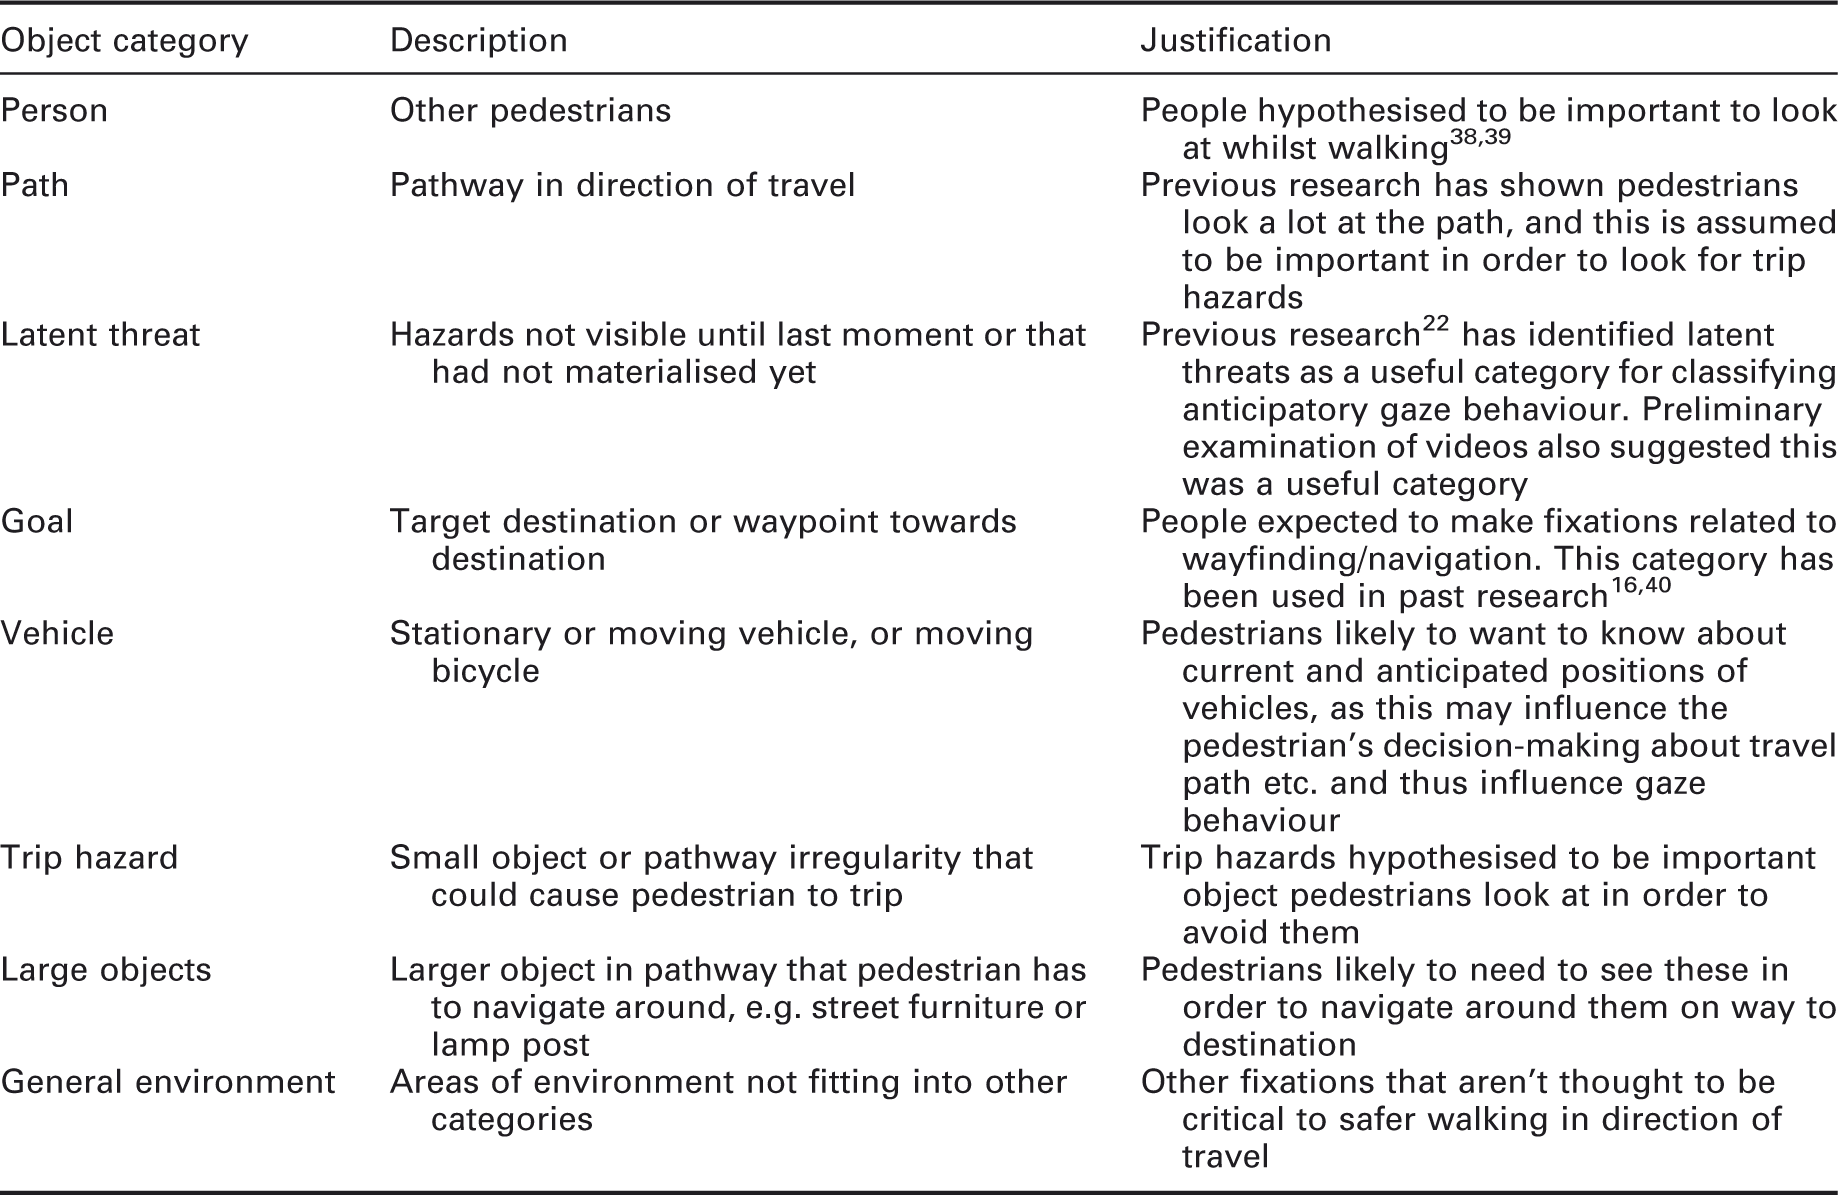
Description of groups used to categorise significant items looked at during critical times
4.3. Critical observations
At an instant suggested to be critical (as noted by a delayed response to the reaction time test) the experimenter inspected the video record to establish the object of visual fixation at that instant. This judgement was made by observing a 2-second period of the eye-tracking video starting 1 second before the critical time, and the categorisation was based on what the researcher judged to be the most significant thing being observed at the time. These decisions were supported by the records of interviews carried out with participants after the experiment discussing participants’ views about their eye movements.
A second coder was used to categorise trials from 10 participants (25% of the original sample of 40 participants), to determine coding validity and consistency. Categorisations between the first and second coder agreed for 63% of critical observations. Some eye-tracking studies do not report methods to check coding validity 19 or do not report validity data. 13 Other eye-tracking studies report validity measures of 85% and above.16,18 One reason why the coding agreement in the current study is lower than in previous studies is that a greater number of categories were used for coding: if instead the fixations were placed into only the three categories as used by Foulsham et al. (i.e. person, path and other), then coding agreement is >90%. Thus, coding of fixation on people and path were satisfactory, the uncertainty lies within the remaining categories which tend to be grouped in past studies into an ‘other’ category.
Each instance identified as a critical time was placed into one of nine categories (including the unknown category), based on an assessment of what the significant object or area was that was being observed at the time. These are referred to here as the critical observation. The median frequency of critical observations in each category is shown in Figure 3. In a small number of critical times more than one category of object was apparent. In these cases the vote of critical object was divided equally between the possible objects. For example, if three objects were likely candidates for fixation at a critical time then a frequency of 1/3 was recorded for each.
Median frequencies of critical observations in each category of fixated item, across both day and after-dark trials. Error bars show the interquartile range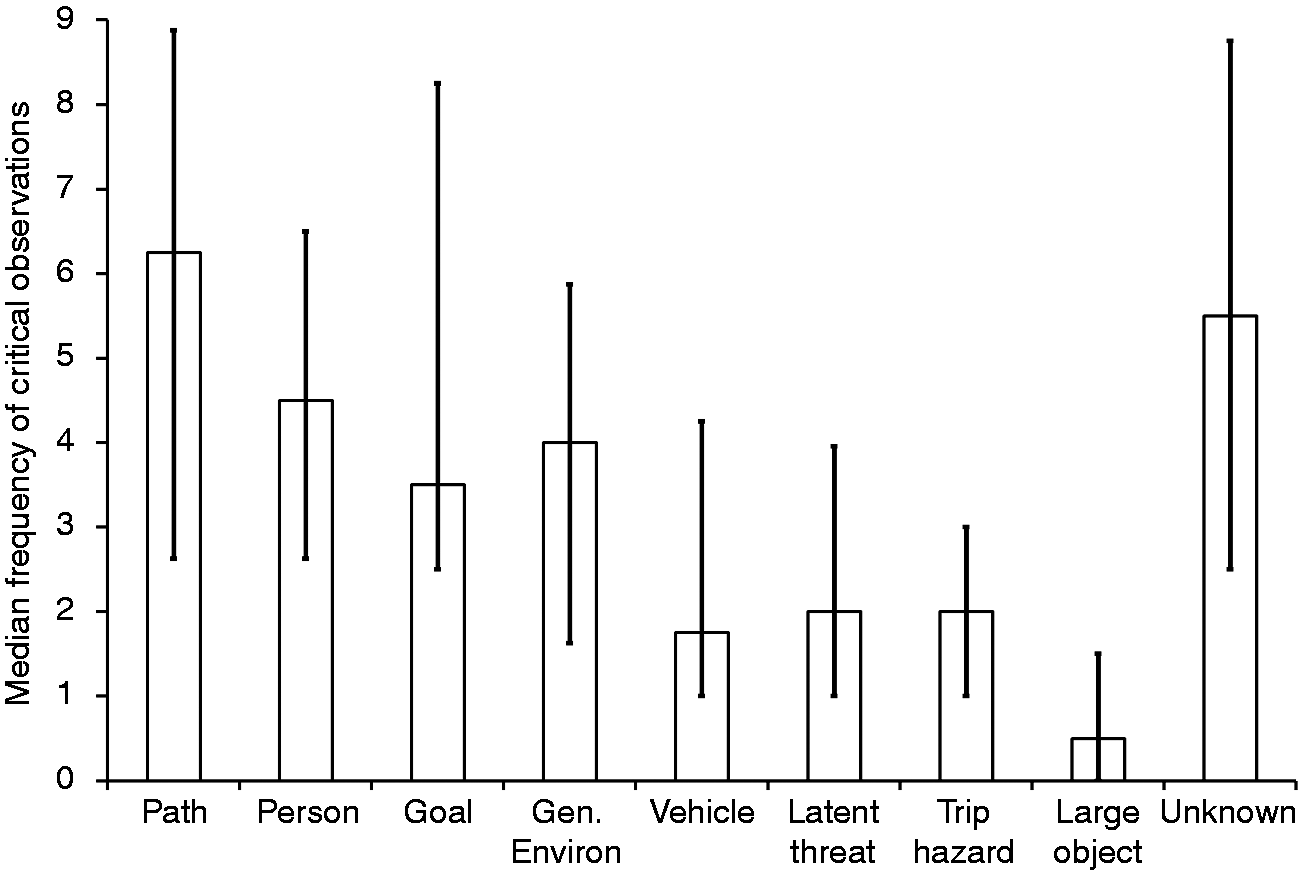
Participants varied in terms of the number of critical observations made during their trials (range = 7 to 40), and thus frequency counts were converted to proportions to make each participant comparable. For example, if a participant provided 20 critical observations during a trial and 5 of these were categorised as ‘Path’, the Path category contained 25% of all critical observations for that trial. The Unknown category was excluded when calculating this proportion.
The proportion of critical observations for each category were analysed by four independent variables: Route direction (clockwise vs. anti-clockwise), light condition (daytime vs. after dark), participant gender (male vs female) and route section (A, B, C and D). The frequencies of object fixation were not found to be normally distributed and hence non-parametric statistical tests have been used and median values are reported.
Some participants had relatively high numbers of critical observations in the Unknown category, due to poor eye-tracking quality (the eye-tracking system did not identify gaze locations very successfully). This resulted in potentially inflated proportions in the other categories due to low frequencies in those categories. Therefore participants were only included in the analysis if they had a total of at least five critical observations in categories other than Unknown in both the daytime trial and after-dark trial. This criterion resulted in 12 participants being excluded.
The median proportions of critical observations in each category for the remaining 28 participants (across both day and night trials) are shown in Figure 4. This shows that some categories have higher proportions than others, in particular the path and person categories, while the Large object category appears low. One notable change from Figure 3 is that the person category now appears to indicate a higher importance compared with the goal and general environment categories.
Median proportion of critical observations in each category, combined across both trials. Note: Error bars show interquartile range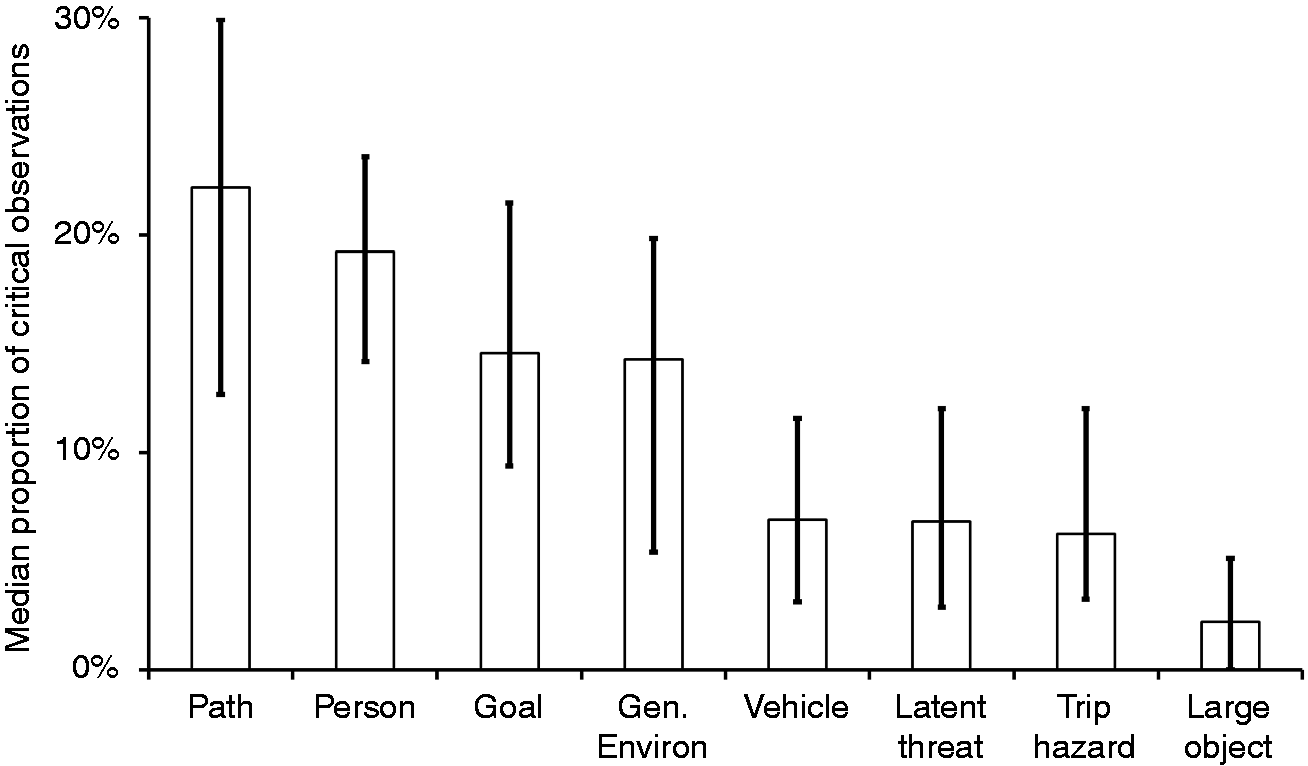
Figure 5 shows the proportion of critical observations in each category during the day and after-dark trials. Possible differences between the light conditions are suggested and a series of Wilcoxon signed-rank tests were used to test the significance of these apparent differences. For the person and path categories, the Wilcoxon test suggested day and after-dark differences to be significant at levels of p = 0.034 and p = 0.067, respectively, hinting at a difference, a greater proportion of path fixations and a smaller proportion of person fixations after dark than during day time. This may reflect behaviour to fixate less frequently on people after dark, but it may also reflect that fewer people were present after dark. For the other six categories the differences were not close to significance (p values of 0.143 to 0.849), suggesting a clear difference between the path and person groups and the other groups.
Median proportion of critical observations in each category by day and after-dark conditions. Note: Error bars show interquartile range. Median value = 0% for Large object day and after-dark conditions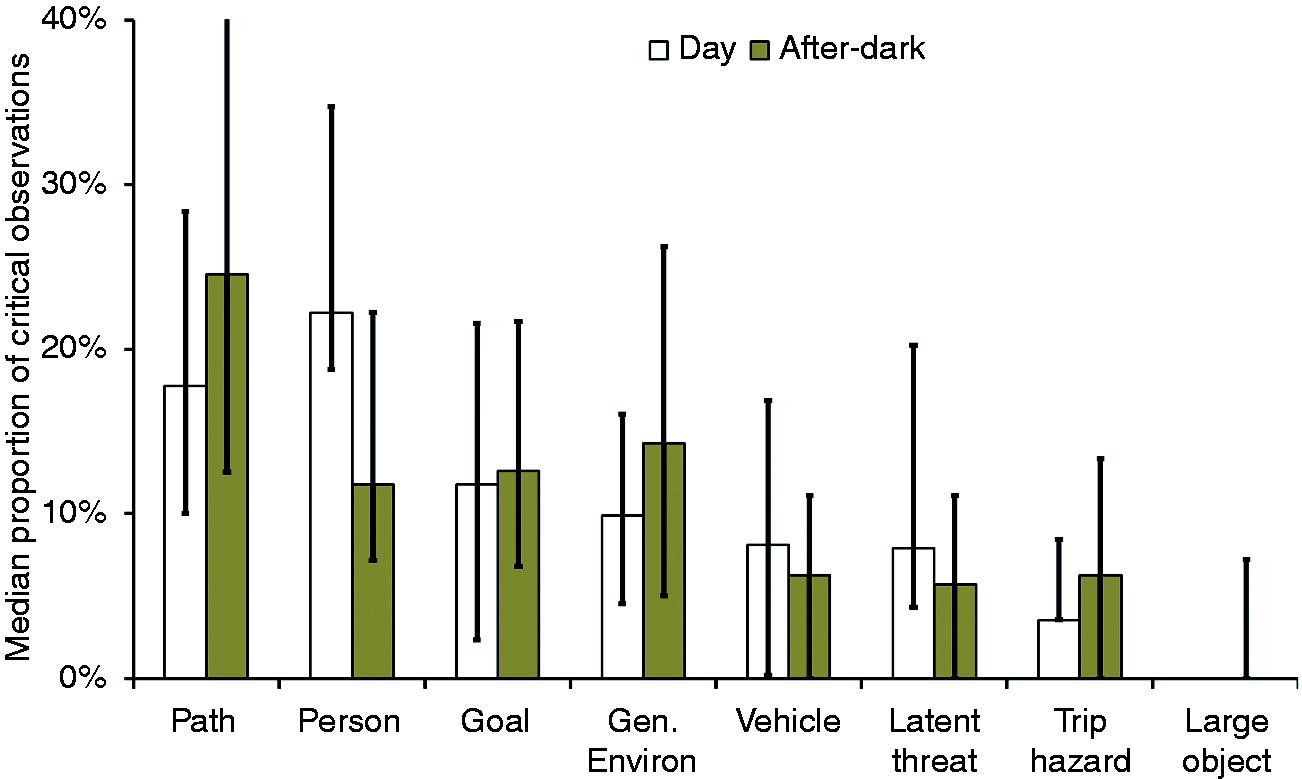
A series of Wilcoxon signed-rank tests compared critical observation proportions between the clockwise and anti-clockwise routes. This suggests possible differences with route direction for the goal category, with a higher proportion of goal observations on the clockwise route (median = 17.5%) compared with the anti-clockwise route (median = 9.7%, p = 0.016) but not for the other categories of critical observations.
The proportions of critical observations in each category were compared across sections A, B and D, as shown in Figure 6. Section C was excluded from this part of the analysis as it produced a very low number of critical observations (section C median = 1, section A, B and D medians were 7, 8 and 12, respectively). Figure 6 suggests there may have been differences between route sections in terms of the distribution of critical observations, as was anticipated due to the variations in section characteristics (see Table 1). For example, section D appears to have a higher proportion of observations at the path and a lower proportion at people compared with sections A and B. A series of Friedman’s ANOVAs suggested there were significant differences between the sections for the Person category (p < 0.001), Path category (p < 0.001), Trip hazard category (p = 0.001), Large object category (p = 0.004) and Goal category (p = 0.008). Post hoc tests showed that section D had a lower proportion of critical observations in the Person and Large object categories but a higher proportion in the Path category compared with sections A and B. Also, section A had a lower proportion of observations in the Trip hazard category compared with sections B and D. Section B had a lower proportion of observations in the Goal category compared with sections B and D. These data suggest that different routes lead to different estimates of critical fixations, while for a given route there are little differences between route directions. Clearly, one possible reason for differences between routes is that the apparently critical objects appear with different frequencies in the visual environment, and indeed the routes used in the current study were chosen to present different visual tasks (Table 1).
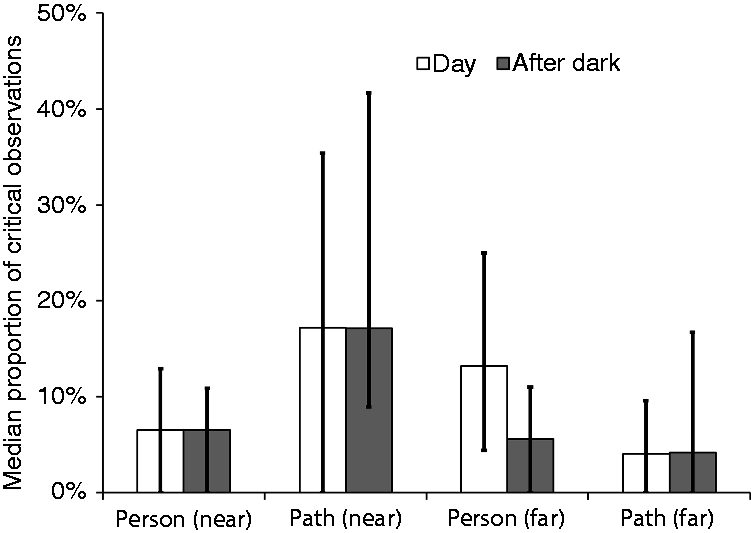
Median proportions of critical observations in object categories for sections A, B and D. Note: Section C data not displayed due to low frequencies of critical observations on this section. Error bars show interquartile range. Median value = 0% for Person (section D), Latent threat (sections A and B), Trip hazard (section A) and Large Object (sections A, B and D) Median proportions of critical observations for Person, Path and other categories during day and after dark conditions, grouped by near and far distance. Note: Error bars show interquartile range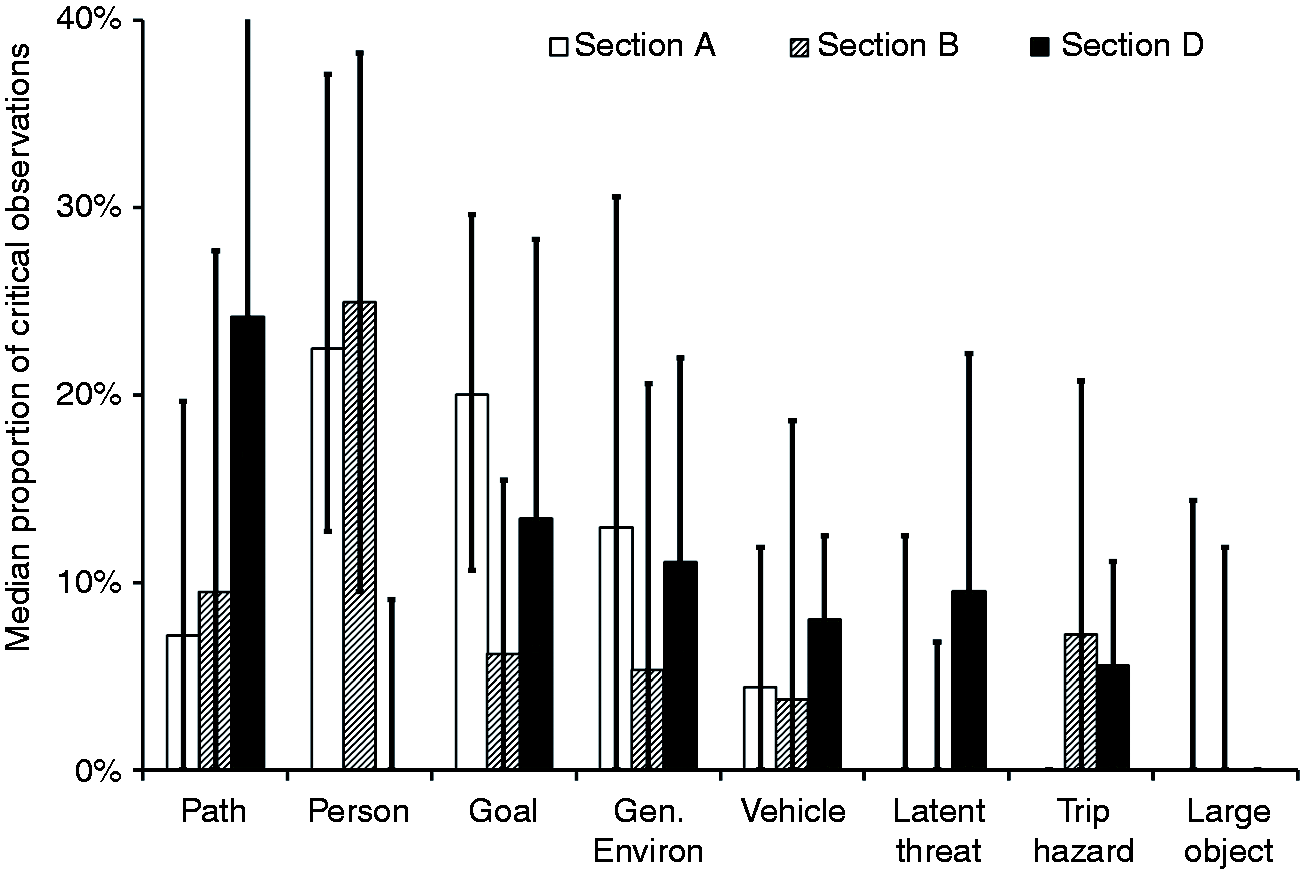
A series of Wilcoxon signed-rank tests also compared critical observation proportions for male and female participants. A possible difference was suggested for the general environment category, with males having a higher proportion (median = 17.1%) than females (median = 6.5%, p = 0.036). No other category comparisons came close to significance (p values between 0.209 and 1.00).
4.4. Path and Person – analysis by distance
The Path and Person categories have the highest proportions of critical observations (Figure 4). This suggests people and the path are important things for pedestrians to look at. Further analysis was carried out on these categories, examining whether critical observations were performed at a near or far distance, as has been done in past work. 18
Near items were those judged to be fixated within 4 m of the participant; 4 m is used as the threshold for near and far as work by Hall 41 suggests this is an important interpersonal distance, at which distance pedestrians could take action in response to what they see. Accurate physical measurements were not possible however, and the coder was instructed to make their own judgement, following the approach taken in previous research. 18 Distance could generally be inferred from the position of the gaze cursor in the screen, with a near item usually located in the lower half. For this analysis the Trip hazard category has been included in the Path category, since trip hazards were located on the path. As with the previous analyses, the 12 participants who had less than five critical observations in categories other than Unknown, in either trial, were excluded. The remaining 28 participants were included.
The proportions of critical observations made at the Path and Person categories at near and far distances are shown in Figure 7. Some possible differences are suggested; for example a higher proportion of observations appear to be made at the near path compared with the far path. There is a tendency to look at other pedestrians when far away than when they are near. A Wilcoxon signed-rank test suggested the proportion of observations made at the near path was significantly higher than at the far path, when day and after-dark trials were combined (near median = 19.5%, far median = 6.3%, T = 8, p < 0.001). The proportion of observations at far people was also significantly higher than at near people (far median = 12.1%, near median = 6.6%, T = 14.1, p = .04).
A series of Wilcoxon signed-rank tests compared critical observation proportions during the day and after-dark trials, across the near and far categories. The only difference that was suggested was the proportion of observations at far persons was higher during the day compared with after-dark (day median = 13.2%, after-dark median = 5.6%, T = 9.5, p = 0.006). Comparisons between day and after-dark for the other near and far categories did not reach statistical significance.
5. Discussion
This experiment was carried out to identify pedestrians’ critical visual tasks when walking after dark, thus to permit assessment of how lighting characteristics such as illuminance and spectrum affect these tasks. Past studies using eye-tracking have not tended to discriminate between critical and non-critical fixations. In the current study a dual-task approach was used, reaction time to an auditory stimulus, using delayed reactions to identify moments where attention was distracted.
The results suggest that the path and other people are the more frequently critical observations, with a tendency for other people to be fixated at far distances and the path to be fixated at near distances. After dark, there is a lower frequency to fixate on other people than during daytime, which may be because there are fewer people present as potential fixation targets. For the path, there is a higher fixation frequency after dark than during daytime, which may indicate the increased need for identifying pavement irregularities after dark.
Comparison of proportions of observations for three studies a
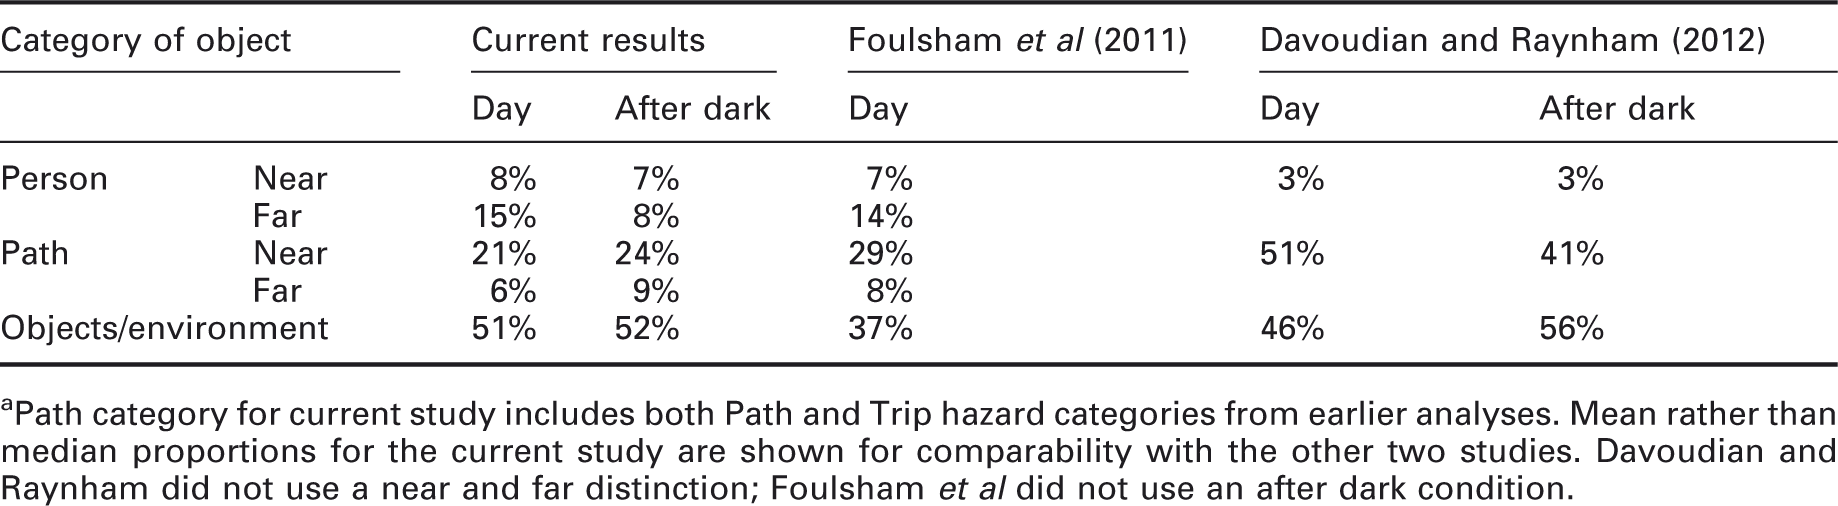
Path category for current study includes both Path and Trip hazard categories from earlier analyses. Mean rather than median proportions for the current study are shown for comparability with the other two studies. Davoudian and Raynham did not use a near and far distinction; Foulsham et al did not use an after dark condition.
The current study and Foulsham et al. show similar results in terms of the proportion of observations made towards other pedestrians at both a near and far distances. They also show a similar trend for looking more at the near path than the far path. Davoudian and Raynham however found a lower proportion of observations at other pedestrians and a higher proportion at the path compared with the current study and Foulsham et al. This may reflect a reduced presence of other pedestrians in Davoudian and Raynham’s study, or other variations in the routes used.
In the current study different sections of route were chosen to present different visual tasks (Table 1) and analysis of the results suggested a significant difference between sections of the test route. For example section A was chosen to present a relatively smooth terrain with a high number of other pedestrians, and the results suggest significantly higher proportion of critical observations at people and significantly lower at the path compared with other sections. These potential differences between sections suggest a pedestrian’s critical visual tasks are likely to vary if they are walking a route that has changing environmental features and characteristics. For example, in certain areas it may be important to watch the path carefully. In other areas, pedestrians may feel it is important to observe any other pedestrians. Other objects or areas may become important to the pedestrian as they walk through different areas.
6. Conclusion
An experiment was carried out to identify pedestrians’ critical visual tasks when walking after dark using a novel dual task to identify moments where attention was distracted and thus potentially critical visual fixations. The results suggest that it is important for lighting design to consider the visibility of people and the path. For the path, there was a tendency to fixate at the near path (less than approximately 4 m) rather than the far path: for people, there was a tendency to fixate distant people rather than near people. Looking at the near path might indicate inspection of the surface to guide foot placement and thus avoid trip hazards. Looking at other people might indicate interpersonal evaluation of their intent thus to inform route direction, which is clearly more beneficial if done at some distance. These tasks provide a clue as to the critical tasks of pedestrians that should be next examined to understand how road lighting can best facilitate them. Fixation on the path for obstacle detection may already be accounted for in current design guidance which tends to specify horizontal illuminance on the path: fixation on faces suggests a need to specify also a measure of light quantity in the vertical plane.
The dependent variable used in this paper is the frequency of fixations with which test participants fixated upon particular categories of object at times when their response to the dual task was delayed. This measure depends on the frequencies of the different types of object in the visual environment and their potency in drawing attention during a given task. A common approach to coding visual fixations is to count all items apparently fixated, an assumption of equal importance. We suggest that the dual task is a step towards identifying the potency of the object, in that those objects of greater importance for safe walking are revealed, and also a reduction in inattentive fixations (daydreaming). However, because the frequency of objects in the real environment is unknown we cannot assume that conclusions regarding the frequency of fixations are robust. An alternative approach to interpretation of critical fixations is presented in a second article. 42
Footnotes
Funding
This work was carried out through support from EPSRC (EP/H050817) as part of the MERLIN project, a collaboration with University College London (UCL) and City University London, the EPSRC-funded E-Futures Doctoral Training Centre for Interdisciplinary Energy Research, University of Sheffield and Kansai University’s Overseas Research Program for the year of 2012.
Acknowledgement
The eye tracking apparatus used in this work was borrowed from Peter Raynham, The Bartlett School of Graduate Studies, UCL.