
Abstract
Although managers’ perceptions are core to the Performance Feedback Theory, few empirical studies measure managerial perceptions of their organization’s performance and theorize on the (in)consistency between perceptual and objective performance feedback. Based on longitudinal survey data of Canadian organizations, we examine how this (in)consistency affects the propensity for innovation in organizations. Our analysis broadly validates that inconsistency between the two types of feedback dampens innovation. Second, positive perceptions strengthen the relationship between positive objective performance feedback and innovation, leading to increased innovation, whereas negative perceptions strengthen the relationship between negative performance feedback and innovation, echoing the problemistic search hypothesis. We also find that perceptions moderate the effect of objective performance feedback differently in the social and historical dimensions as well above and below the aspiration thresholds.
Keywords
Introduction
According to the Performance Feedback Theory (PFT) (Cyert and March, 1992; Greve, 2003a), managers perceive and learn from performance feedback and thereby critically shape organizational responses. Managers’ perceptions are important because even the key performance goals which may be grounded in purportedly unambiguous financial metrics, such as cost, revenue and profit, are interpreted subjectively by managers, as suggested by Cyert and March: “all the relevant magnitudes involved—cost, revenue, profit- are subjective—that is, perceived or fancied by men whose decisions or actions are to be explained” (Cyert and March, 1992: 14). March (2010: 17) further emphasizes that the cognitive complications involved in this adaptive process have often been ignored.
Despite the important role of managers’ perceptions for learning from performance feedback (Ahn et al., 2021; Posen et al., 2018; Shinkle and Kriauciunas, 2012), most PFT studies do not include perceptual measures that account for such cognitive complications; rather, they rely on objective metrics (e.g. profitability) (Kotiloglu et al., 2021). The (often implicit) assumption underlying these proxy measures is that objectively measured performance feedback is associated with organizational responses (Greve, 1998a). This ignores the fact that how managers perceive and learn from performance feedback is at the core of the PFT (Greve, 2003a; Cyert and March, 1992; Starbuck, 1963). Since most PFT studies do not include managers’ perceptions, they cannot assess important differences in learning from performance feedback. Thus, without integrating differences in perception, scholars will not be able to fully understand the process of learning from performance feedback. In this article, we examine managers’ perceptions, and hence gain deeper insights into the learning process that is at the core of the PFT.
It should be noted that several PFT studies (Audia et al., 2000; Ben-Oz and Greve, 2015; Osiyevskyy and Dewald, 2015; Shinkle and Kriauciunas, 2012; Villagrasa et al., 2018) include perceptual measures into their models and have advanced our understanding of how managers interpret performance feedback. Yet, the authors of those studies acknowledge that the effect of managerial perceptions on how organizations respond strategically to performance feedback is not understood fully.
In this article, we theorize on managers’ perceptions in the PFT and integrate empirical measures of perceived performance into the performance feedback model. We ask a critical question: how does performance feedback affect innovation, especially when managerial perceptions of performance feedback deviate from objective performance feedback? We argue that using objective performance feedback, whether as proxy or direct measure, 1 as is traditionally done, does not account for the tension between what managers perceive of their own organization’s performance and what the objective performance metrics convey. While there are valid reasons why objective measures may be somewhat correlated with managers’ perceptions of performance, these alternative proxies can also diverge.
To address this research question, we examine how managerial perceptions of performance feedback moderate the relationship between objective performance feedback and organizational response (i.e. innovation). We differentiate situations where the perceptual and the objective measures are consistent with each other, from situations where they are inconsistent. For empirical testing, we use a rich, longitudinal dataset constructed from the Workplace and Employee Survey (WES), a statistically representative, cross-industry sample of Canadian workplaces. In addition to objective performance measures (annual revenue and profitability), the dataset includes measures of managerial perception of performance, as well as the measure of innovations undertaken.
We contribute to the PFT in several ways. First, ours is among the first PFT studies to include a perceptual measure of performance feedback provided by a key informant within organizations beyond the objective measure of overall firm performance. 2 This addresses the concern (Blettner et al., 2015) that most PFT studies do not include factors related to the process of interpreting and learning from feedback. This is important because we expect that the inclusion of perceptions can help us explain the heterogeneity in organizational responses to performance feedback (Kotiloglu et al., 2021; Posen et al., 2018). Second, we theorize on how managerial perceptions affect innovation when performance feedback is below as well as above aspirations (i.e. a satisfactory level of performance). The findings are rich and offer novel understanding in terms of the interactions between objective performance feedback and perception. While the PFT explains how negative objective performance feedback (Greve, 1998a, 2003a) triggers problemistic search, our findings suggest that negative managerial perceptions of performance can further strengthen problemistic search. And conversely, positive perceptions can dampen problemistic search. Similarly, above-aspiration performance leads to risk aversion, but then positive perceptions can overcome this effect, resulting in increased innovation. Thus, our study explains how managerial perceptions moderate organizational responses to performance below and above aspirations.
Finally, by studying the (in)consistency of perceived and objective performance feedback, we contribute to a stream of research within the PFT that is concerned with different types of (in)consistency of performance feedback components (Joseph and Gaba, 2015; Lucas et al., 2018).
Theory development
PFT
PFT proposes problemistic search as an urgent organizational response to solve the problem of performance below aspirations (henceforth, negative performance feedback) (Greve, 2003a). However, recent meta-analyses of the empirical PFT literature (Kotiloglu et al., 2021; Verver et al., 2018) indicate diverging empirical results. An alternative response to negative performance feedback is self-enhancement (Audia et al., 2015; Jordan and Audia, 2012) inhibiting the propensity to search for better solutions (e.g. through innovation). Thus, despite the majority of PFT studies showing evidence of problemistic search, Posen et al. (2018) conclude that our knowledge about problemistic search remains incomplete and suggest “advancement of the literature must be premised on a more central role of cognition than suggested in the traditional conceptualization of the theory” (Posen et al., 2018: 209).
The evidence of organizational responses to performance above aspirations (henceforth, positive performance feedback) is even more ambiguous (Blettner et al., 2019; Ref and Shapira, 2017). While some papers suggest that managers decrease search when performance feedback is positive (Chen and Miller, 2007), others show that managers continue or even increase search in response to positive performance feedback (Greve, 2003a). Since the literature refers to psychological processes such as increased risk aversion (Chen and Miller, 2007; Labianca et al., 2009), we suggest that, similar to the case of negative performance feedback, a closer examination of perception and cognition can lead to deeper insights of this process of learning from performance feedback.
Perception in performance feedback studies
Few PFT studies (Audia et al., 2000; Ben-Oz and Greve, 2015; Shinkle and Kriauciunas, 2012 Villagrasa et al., 2018) measure managers’ perception. Audia et al. (2000) and Villagrasa et al. (2018), for instance, showed that managers’ satisfaction with performance was related to reliance on past strategies (Audia et al., 2000) and fewer strategic changes (Villagrasa et al., 2018). Audia and Brion (2007) include self-enhancement, a trait-based cognitive measure, to explain why decision-makers, to shine in a brighter light, emphasize goals that they outperform. Other studies include cognitive measures of ambiguity tolerance (Wangrow et al., 2019) or ambivalence (Plambeck and Weber, 2009). Some other studies examine how proxies of managerial cognition (e.g. experience, Greve and Zhang, 2016) affect organizational responses to performance feedback. Rhee et al. (2019) examine the role of cognitive accessibility, that is, the ease of retrieval of information from memory, on organizational responses to PFT. Ahn et al. (2021) study regulatory focus as a cognitive frame in performance feedback interpretation. Nigam et al. (2016) illustrated how strategic framing can be used to focus attention on new goals to create change.
These cognitive and perceptual mechanisms are relevant for explaining how decision-makers prioritize among different reference points (e.g. Blettner et al., 2015) and even multiple goals (e.g. Audia and Brion, 2007). Thereby, studies that include perception and cognition have substantial bearing on the recent research that focuses squarely on the (in)consistency between multiple sources of performance feedback, as discussed next.
(In)consistent performance feedback
A key implication of recent PFT work is that managers need to make sense of different components of performance feedback which can be consistent or inconsistent with each other. The organizational response to (in)consistent performance feedback is far from clear and has attracted increasing interest from researchers in recent years (Blagoeva et al., 2019; Lucas et al., 2018). While some papers examine (in)consistent goals (Greve, 2008; Hu and Bettis, 2018; Salvato and Rerup, 2018), others focus on (in)consistent (and ambiguous) reference points (Blettner et al., 2015; Joseph and Gaba, 2015). Irrespective of their focus, the central idea of these studies is that (in)consistency between reference points/goals affects organizational responses. In the current article, we propose a slightly different notion of (in)consistency of performance feedback. That is, we consider that managers selectively attend to different elements in their environment which are idiosyncratic to their personalities and organizational processes, and it manifests in their perceptions of performance possibly diverging from objective performance feedback. Since this perception subsumes the different processes and mechanisms of how managers interpret performance feedback, it is also likely to be somewhat correlated with, yet different from, objective performance feedback. While the information contained in both (the perceptual and the objective) reference points is relevant, the (in)consistency between them is important when it comes to organizational responses.
Perceived and objective performance as inconsistent reference points
Managers differ from one another, as well from the rest of the stakeholders, in the way they perceive and interpret information (Daft and Weick, 1984; Kaplan, 2011; Stubbart, 1989; Walsh, 1988). These idiosyncrasies also manifest in how managers perceive the performance of their organizations relative to their own past performance (historical performance feedback) and relative to their peers (social performance feedback). Furthermore, their perceptions in these two dimensions (historical and social) may even deviate substantially from objective performance. Indeed, the literature offers multiple rationales why perceptions may not match objective performance metrics, although empirical evidence in the context of performance feedback falls short in this respect.
First, managers differ in their personality traits leading them to interpret performance feedback positively or negatively, and to varying degrees. For instance, researchers have associated optimism (Lant et al., 1992), overconfidence (Galasso and Simcoe, 2011; Moore and Healy, 2007), and narcissism (Campbell et al., 2000; Jordan and Audia, 2012) with positive perception of performance feedback. Cyert and March (1992) and Lant et al. (1992) pointed out that managers are optimistic when adapting to performance feedback. By contrast, due to personality traits such as pessimism (Helton et al., 1999) or low confidence (Moore and Cain, 2007), or high prevention focus which increases the downside risk of loss and therefore triggers pessimistic views (Gamache et al., 2015; Higgins, 1998), managers may perceive performance feedback as more negatively than it objectively is.
Second, the idiosyncratic competitive environment may also affect managers’ perceptions and lead to inconsistency with objective performance feedback. For instance, managers may differ in the set of industry peers or historical benchmarks (Gary and Wood, 2011; Porac and Thomas, 1990) they aspire to. Furthermore, possibly aided by private information, managers may use a different set of benchmarks that are meaningful in the context of their internal firm capabilities (Schwenk, 1984).
Third, managers typically operate as members of a dominant coalition. Membership within such coalitions or groups will affect how managers perceive, generate, and assimilate feedback (Greve and Gaba, 2017; Tarakci et al., 2014). A substantial body of literature examines how political motivations can serve to distort the perceptions of the organization’s historical and social performance (Cyert and March, 1992; Eisenhardt and Bourgeois, 1988; March, 1962). For instance, managers may present performance feedback in a brighter light to attract future resources (Hu et al., 2017). Such politically motivated processes can affect how managers interpret performance.
Finally, organizational routines, rules, and operating procedures also interact with managers’ cognitive representations and hence affects search in response to performance feedback (Gavetti, 2005; Gavetti et al., 2012; Gavetti and Levinthal, 2000). Gavetti (2005) further suggests that the position of managers in the organizational hierarchy and the degree to which they are removed from business operations also influence managers’ interpretations.
Despite these various sources of managers’ idiosyncratic perceptions being well recognized in the managerial cognition literature, the PFT literature has yet to fully integrate these ideas (Greve and Zhang, 2016). An obstacle to a more nuanced understanding of the (in)consistency between perceived and objective performance feedback, and its role in the PFT, is the separate empirical measurement of such perceptions, and the empirical evidence of their divergence from objective performance feedback. Perhaps due to the limitations in such nuanced empirical measurement, PFT studies have assumed that (unmeasured) perceptions of performance feedback match objective performance. In this article, we have a rare opportunity to be able to address this gap theoretically and empirically using measures of both, perceived performance feedback as well as objective performance feedback. This allows us to study the effects that are triggered by their consistency versus their inconsistency. In the following, we theorize on organizational responses (in terms of innovation) to conditions when perceived and objective performance feedback are consistent versus inconsistent with each other.
Hypotheses development
Baseline hypothesis for negative objective performance feedback
According to the PFT (Greve, 2003b; Cyert and March, 1992), negative performance triggers problemistic search, as the organization enters a problem-solving mode upon sensing a performance problem. The performance is visible not just to the manager but to the entire set of stakeholders such as employees, investors, unions, governments, and so on (Cyert and March, 1992). Thus, managers receive a mandate to take more risk from the broader group of stakeholders, resulting in greater risk-taking propensity in terms of new product launches, market expansions, and other types of risky decisions such as engaging in innovation. In line with received PFT (Greve, 2003a), we formulate the following baseline hypothesis:
Hypothesis 1 Baseline. For negative objective performance feedback, the probability of innovation increases.
Perceived performance feedback and negative objective performance feedback
We now consider how problemistic search should be affected (augmented or dampened) in the case when managers’ perceptions are positive but objective performance is negative. Notwithstanding the impetus for change from negative objective performance, managers also have significant discretion over the realized action, such as enabling or dampening it. Considering the significant effort required to shift organizational activity from production to search, managers’ negative perception, by itself may or may not be effective in garnering resources and the wider support to engage in innovation. However, negative perceptions can make managers more responsive to the problemistic search mode that the organization as-a-whole is poised for. Thus, an organization will only engage in innovation if managers too have “judged that the organization faces a problem that is so important that resources are best spent searching for solutions” (Greve, 2003b: 55). The negative perceptions of managers thus catalyze the mandate arising from the wider stakeholder group to engage in problemistic search. Thus, it is not only the intensity of problemistic search, but also its direction of risk preferences (i.e. more or less risk) that can change due to the moderating influence of managerial perceptions.
Conversely, we argue that if managers’ perceptions of performance feedback are more favorable, it will dampen problemistic search. This is because positive managerial perceptions pose a cognitive barrier for perceiving and imbibing the urgency of the wider stakeholder group faced with negative objective performance feedback. 3 This inconsistency between perceived and objective performance fails to sufficiently validate the urgency and the threat experienced by the rest of the organization arising from negative objective performance. As a result, the impetus to engage in innovation will be lower. This role of managerial perception and interpretation in moderating problemistic search has been mostly unaddressed by most empirical studies including even the recent studies on (in)consistency in performance feedback metrics (Joseph and Gaba, 2015; Lucas et al., 2018). This leads us to suggest our first hypothesis:
Hypothesis 1. Positive (inconsistent) managerial perceptions will reduce problemistic search in response to negative objective performance feedback, such that it will lower the probability of innovation.
Baseline hypothesis for positive objective performance feedback
The PFT suggests that organizations decrease innovation when performance is above aspirations (Greve, 2003b). Financial returns that are above aspirations lead the stakeholders, and the leadership as a whole, to assess returns from innovation as less beneficial than the risk of failure (since the performance would fall below the aspiration level). This influences decision-makers to become risk averse (Wehrung, 1989), resulting in organizations becoming more inert (Greve, 2003a) which manifests in lower degree of innovation (Chen, 2008; Chen and Miller, 2007; Iyer and Miller, 2008; Leonard-Barton, 1992).
In contrast, other work (Baum et al., 2005; Greve, 2003b; Salvato and Rerup, 2018) has found organizations innovate more if performance is positive, suggesting that organizations are not subject to risk aversion and inertia as predicted by the PFT. Despite the heterogeneity of empirical results for performance above aspirations (Blettner et al., 2019; Posen et al., 2018), we state our baseline hypothesis in line with received PFT as outlined by Greve (2003a):
Hypothesis 2 Baseline. For positive objective performance, the probability of innovation decreases.
Perceived performance feedback and positive objective performance feedback
Next, managers may also perceive performance feedback as lower and less favorable than it objectively is. That is, when objective performance rises above aspirations and as managers’ perceptions become more negative, this feedback configuration becomes more inconsistent. If managers’ perceptions of performance are negative, they are amenable to problemistic search. Typically, problemistic search is low for positive objective performance (Greve, 2003a) but when managers’ perceived feedback is negative, there is reason for managers to increase problemistic search, even for positive objective performance feedback. However, when we consider this inconsistent feedback configuration as a whole, we suggest that the ambiguity that arises from this feedback configuration should dampen innovation (Lucas et al., 2018) because inconsistency makes the organization as-a-whole more circumspect. The lack of interpretive clarity dampens enthusiasm for engaging in strategically risky behavior.
Conversely, as managers’ perceptions of performance increase, the signal is unambiguous that the organization is doing well, and, thus, managers will become less risk averse. This means that managers’ fear of subsequent performance falling below aspirations if they were to engage in risky strategic actions (Greve, 2003a; Wehrung, 1989) is reduced because of the confidence-inducing unambiguous feedback configuration of positive perceived and positive objective performance feedback. Due to their decreased risk aversion, managers are more likely to accept the risk of experimentation, since “Slack and institutional search will feed solutions into the decision-making process, and some of these may have risk levels that are acceptable to the decision maker” (Greve, 2003a: 59). Hence, managers are more amenable to directing the additional organizational resources accruing from performance above aspirations to experimentation resulting in greater innovation.
The above reasoning suggests that the moderating role of positive perceived performance feedback changes qualitatively when objective performance is positive versus when it is negative. The essential qualitative difference being the consistency between perception and reality (i.e. objective performance feedback) in the former case. While consistency strengthens the propensity to innovate in both cases (above and below aspiration), in the previous case of negative performance feedback, consistency strengthens the oft-recognized problemistic search. Similarly, consistency in case of positive performance reduces risk aversion (Greve, 2003a; Wehrung, 1989). Notably, in both cases of inconsistency between objective and perceived performance feedback, propensity for innovation is reduced.
Hypothesis 2. Positive (consistent) managerial perceptions will reduce risk aversion in response to positive objective performance, such that it will increase the probability of innovation.
Method
Sample and data
We use establishment-level data from the WES which is a survey that was administered by Statistics Canada over the period 1999–2006. The objective of this survey was to collect organizational-level information from Canadian businesses. The survey provides researchers with the unique opportunity to study innovation, organizational change, competitiveness, and human resource management at the workplace level. Organizations were followed for four or more years with new workplaces being added each year to replace non-responding workplaces. In all, the dataset provides longitudinal data on workplaces over a maximum of 8 years. Thus, the data are not only representative of all workplaces in Canada, but also unique in terms of the scope and quality of the information collected.
The data-collection process for the WES consisted of two steps. First, Statistics Canada would send a copy of the survey to each workplace so that respondents had time to review their records and find all the information that this comprehensive survey requested. This allowed all respondents to provide financial information, even those whose organization’s accounting year did not coincide with the April to May cycle. In the second step, one manager from each workplace completed the questionnaire during a personal interview that was conducted by a staff member of Statistics Canada. The Statistics Act of Canada ensured strict confidentiality of these responses. The data from the survey were validated and verified, and then adjusted where necessary, and finally evaluated to ensure their quality. Statistics Canada applies various rules to prevent the release of any confidential information and (where necessary) suppresses the identifiable data. The response rates for this survey ranged from a low of 81.7% to a high of 95.4% during the period 1999 to 2006. In addition, a sampling weight is associated with all the sampling units to obtain estimates for the population.
We created the research sample from the panel of all workplace-level observations over the period from 1999 to 2006. The original dataset contained 6322 workplaces, and, in subsequent years, more workplaces were added while others dropped out. We dropped all observations that have missing information related to innovation and perceptions of performance. Following the Canadian Business and Labour Market Analysis (BLMA) definition of 20 employees as a threshold for very small firms, we used 20 as the threshold for sampling organizations. This is because larger organizations are more likely to have multiple stakeholders and a non-trivial organizational structure irrespective of the industry within which they operate. We also dropped organizations that do not fall within the various industry categories defined by Statistics Canada as well as those that are categorized as non-profit. Finally, as our study focuses on how performance and perceptions of performance affect future innovation behavior, we lagged several variables resulting in the dropping of a further number of observations (which will be discussed below). The final dataset consists of an unbalanced panel of 1946 workplaces for a total of 7535 observations.
Measures
Dependent variable
Degree of business innovation (INNOV)
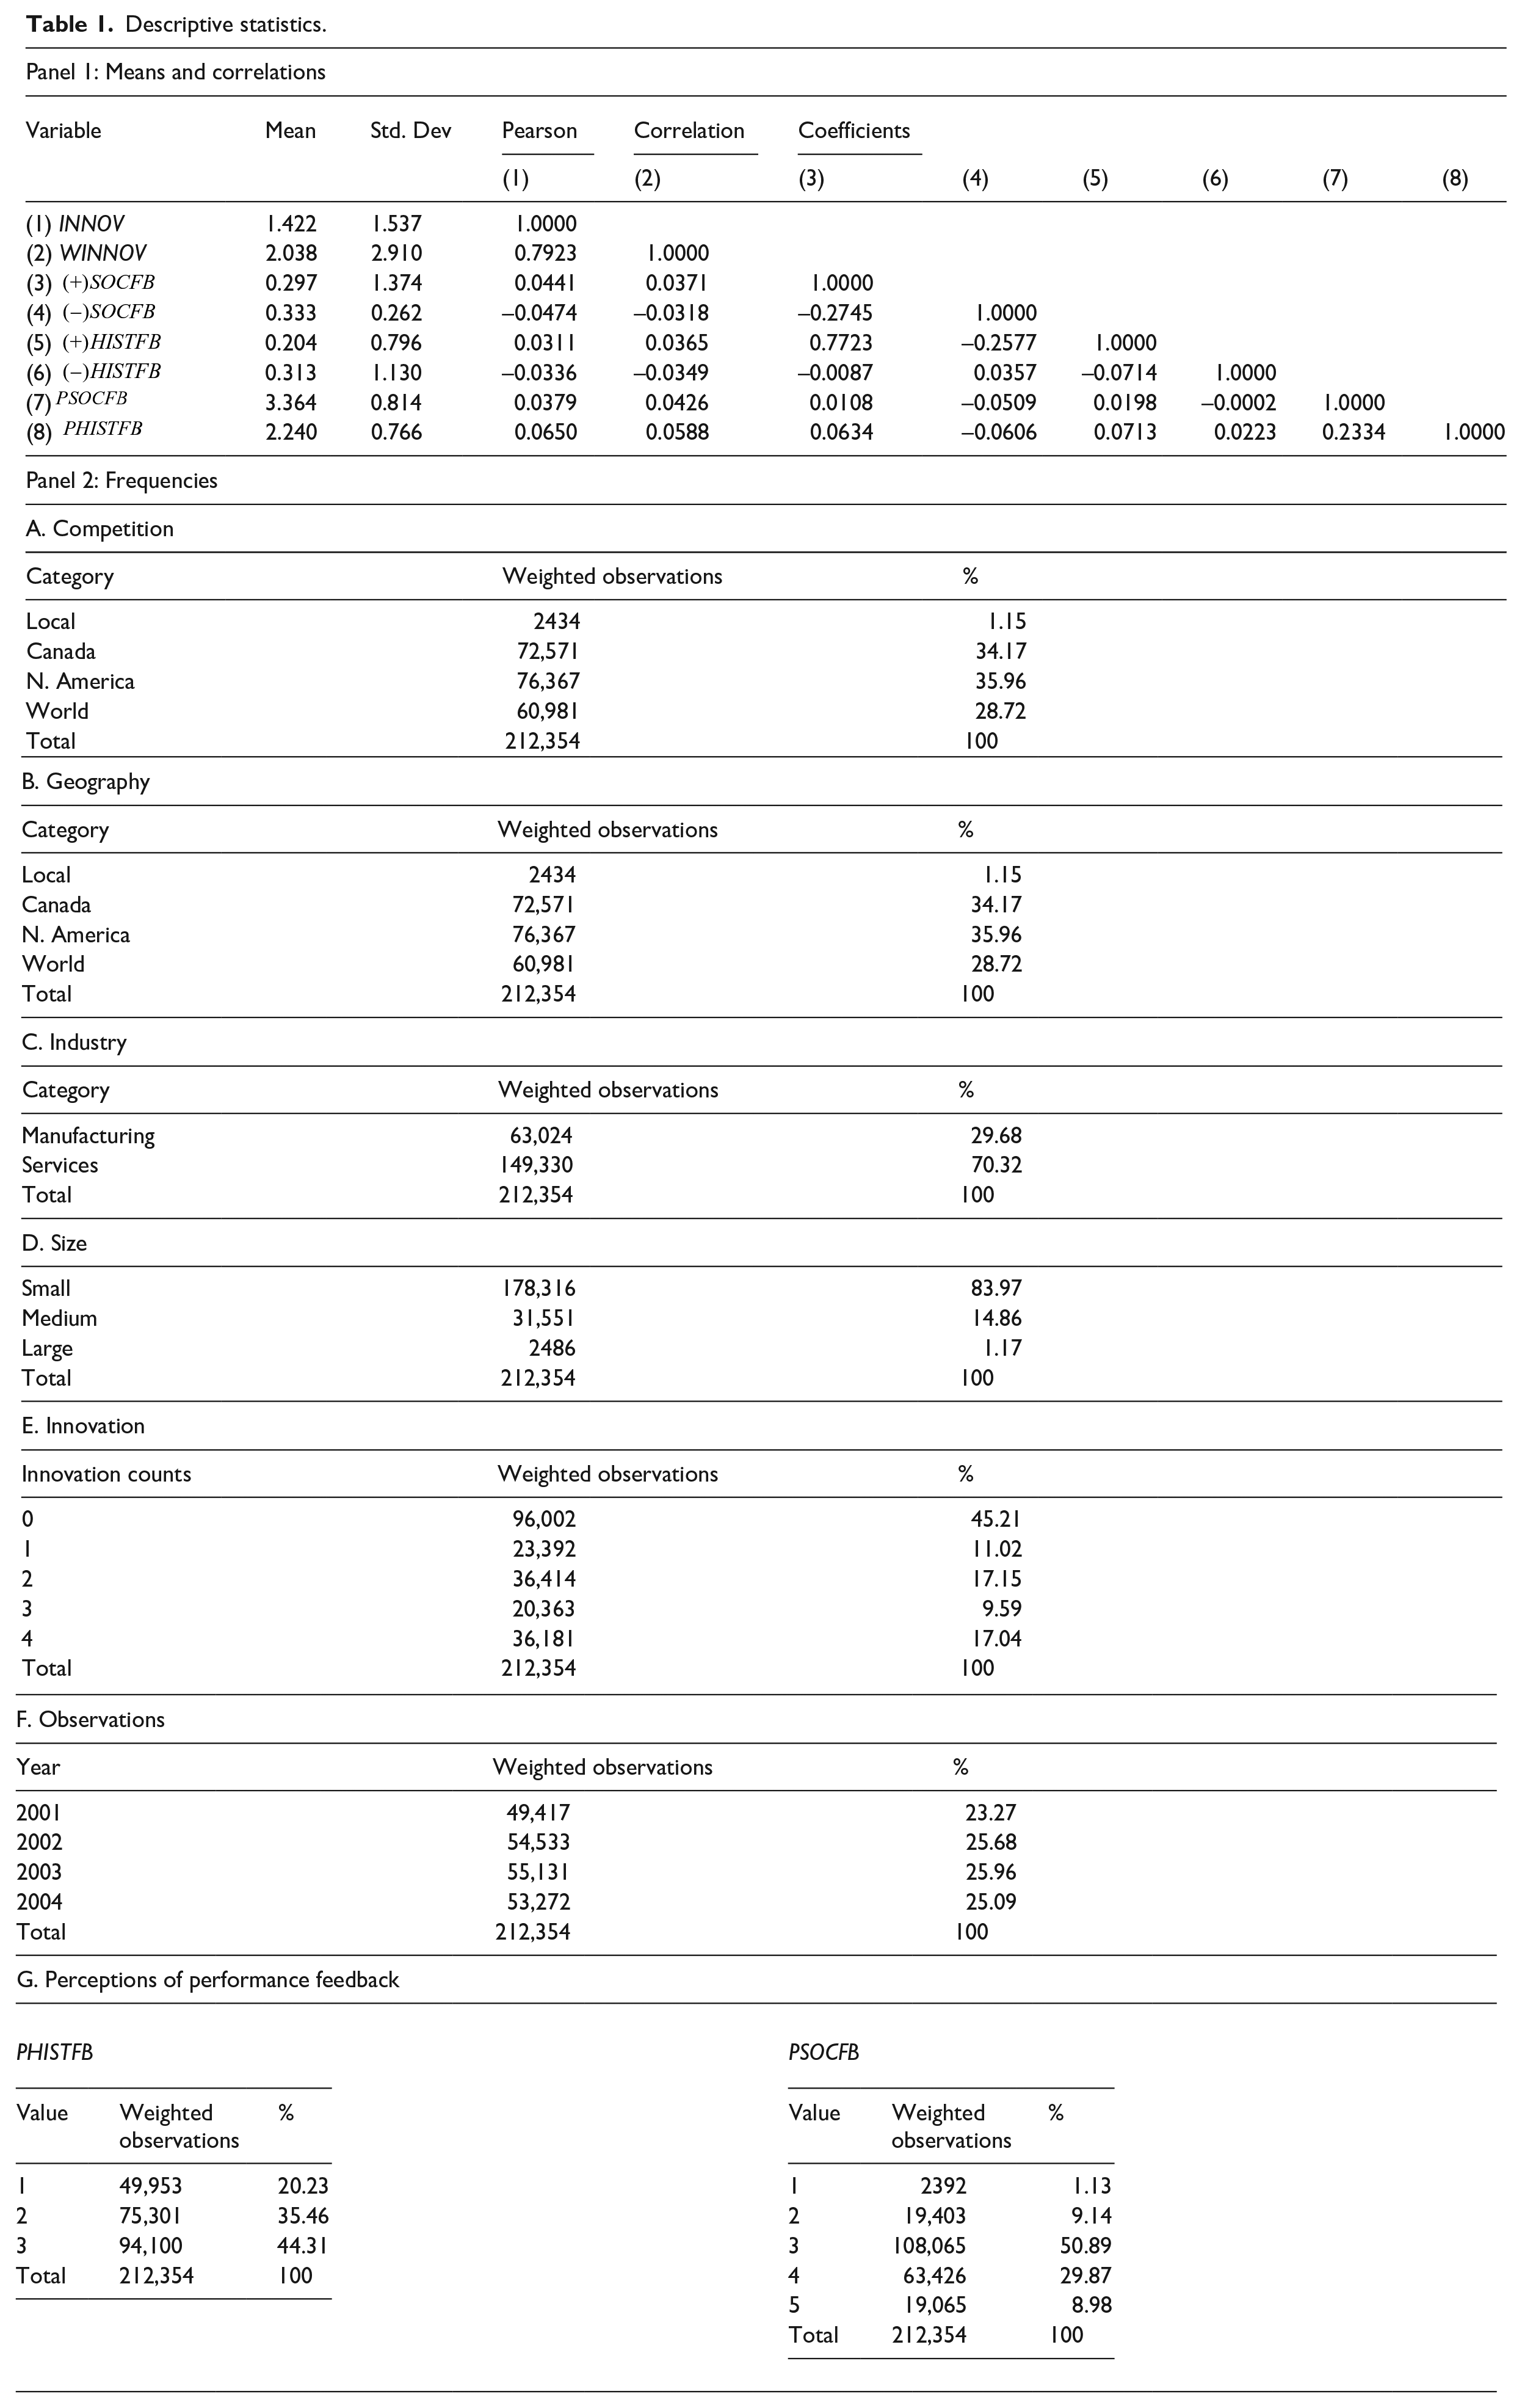
The WES dataset includes four questions with binary responses (yes/no), each of which captures a distinct, but related category of innovative activity: within the financial year, has the workplace introduced (a) new processes, (b) new products, (c) improved processes, and (d) improved products or services (1 = “yes,” 0 = “no”). While prior work has differentiated between product and process innovations (Berchicci et al., 2014; McElheran, 2015; Weiss, 2003) to develop innovation-specific theory, we aggregated the four responses into a single variable (INNOV) to represent the degree of innovation. The value of this variable thus ranges from a maximum of four (yes to all categories of innovation) to a minimum of zero (no innovative activity of any type). We also created a more nuanced version of INNOV, by weighting it by a measure capturing the “importance of the innovation(s).” 4 Importance is measured by the question “Was this innovation (a) a world first (= 4), (b) a Canadian first (= 3), (c) a first in the local market (= 2), and (d) none of the above (= 1).” Thus, a higher value indicates a higher degree of innovativeness. The value of this weighted variable (WINNOV) can thus range from a low of 0 to a high of 16, and therefore is near-continuous. A drawback of this measure is that the importance of an innovation is only available for the innovation that the workplace considers the most significant. As a result, WINNOV is not a full representation of the importance of all the innovations that a workplace may have engaged in at that time. However, the data indicate that INNOV (Table 1) is skewed toward one, which means that most workplaces engaged in one innovation per period. As a result, for most of the workplaces in our dataset, WINNOV adequately represents the quantity and quality of the innovative activity.
Descriptive statistics.
We also considered a model where we converted the dependent variable (INNOV) into a binary variable (BINNOV) where 1 represents any kind of product or process innovation, 0 indicating none. Prior studies have used binary measures from establishment level data (Banbury and Mitchell, 1995; Roper and Hewitt- Dundas, 2008), while others have used ordinal measures, such as the count of product or process innovations, process innovations, and new product introductions (Damanpour, 1987). While this transformation results in a loss of information, our purpose is, as a robustness check, to see whether the results from various specifications are consistent.
Independent variables
The literature defines various performance measures in models of adaptive aspirations such as the profitability measure return on asset (ROA) (Greve, 2003a), return on equity (ROE) (Audia and Greve, 2006), sales (Washburn and Bromiley, 2014), and market share (Greve, 1998b; Joseph and Gaba, 2015). Given the importance of operational efficiency at the establishment level and its more direct connection with product and process innovation, which are the focus of this study, we chose profitability as a suitable measure. We computed profitability as

where
Objective Historical Performance Feedback

where i refers to the workplace and t refers to the current period. The updating parameters,
The discrepancy between current performance as defined in equation (3) and historical aspirations as defined in equation (2) acts as a feedback mechanism that influences decision-making in subsequent periods. We termed this feedback mechanism for the current year, t, as historical performance feedback which is computed according to the equation

where
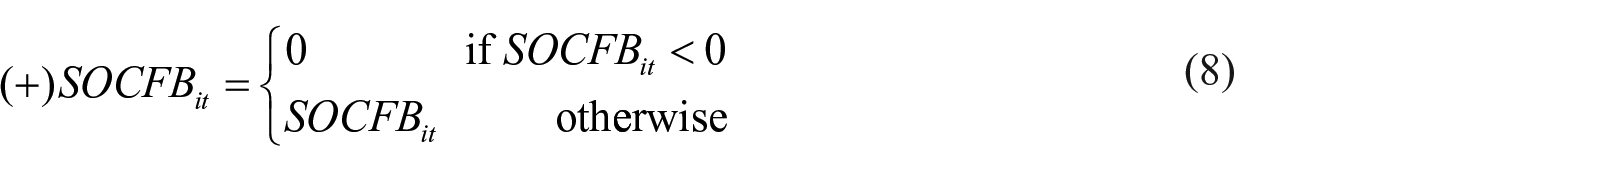
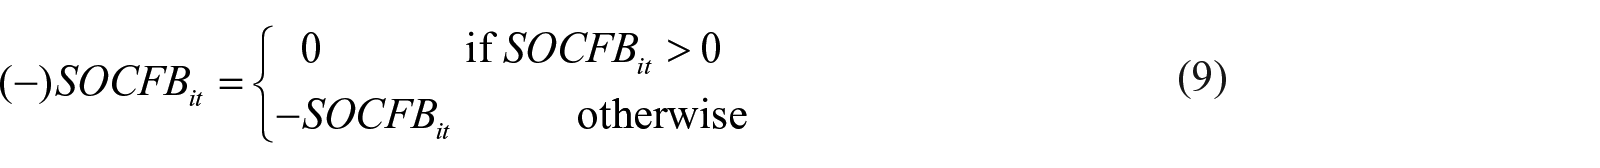
According to the literature, the response to performance feedback in terms of innovation may differ depending on whether the feedback is positive or negative. To capture this effect in our analysis, following Baum et al. (2005), we implemented a spline function that allows us to compare the slopes above and below aspiration-level point (Greene, 2000). We did this by splitting each historical performance feedback variable into two variables

Thus, positive historical performance feedback, which we denote as

which assumes the value for 0 in all cases that performance feedback is positive. For ease of interpretation, we reverse coded
Objective Social Performance Feedback

where N is the total number of workplaces in the peer group, including workplace i. Similar to historical performance feedback, the discrepancy between the workplace’s performance and its peer group, that is, social performance feedback, in the previous period serves as feedback in the current period. Thus, in period t, social performance feedback

For our analysis, we implement the spline function as we did in the case of historical performance feedback. Thus, we define
and
Perceived Historical Performance Feedback
Perceived Social Performance Feedback
Control variables
We included the following control variables.
Organizational size
Firm size is known to affect the relationship between performance feedback and strategic actions (Audia and Greve, 2006). Hence, we controlled for a workplace’s size with the variable
Competition
As previous studies indicate competition plays an important part in responses to performance feedback (Greve, 2002). To operationalize the intensity of competition, we included from the survey a 4-point scale asking respondents for the number of directly competing firms in the market that is most relevant to the workplace (1 = 0, 2 = 1–5, 3 = 6–20, and 4 = over 20).
Industry
The survey allocates a workplace to either one of two categories of industry—manufacturing and services. Thus,
Lack of skilled personnel
We also controlled for the degree to which a workplace lacks skilled personnel as this can impede the adoption of innovations by organizations (Damanpour, 1987). We operationalized this variable as dichotomous, indicating whether the respondent perceives the scarcity of skilled employees as barrier to the implementation of new or improved technologies in the workplace or not.
Time effects
Finally, we controlled for time-specific effects by including year dummies. Since the period of analysis is from 2002 to 2006, after including 1-year lags for several variables, we accounted for time-effects with four dummies running from 2003 to 2006, 2002 being the base year.
Model and statistical procedure
Our primary dependent variable,
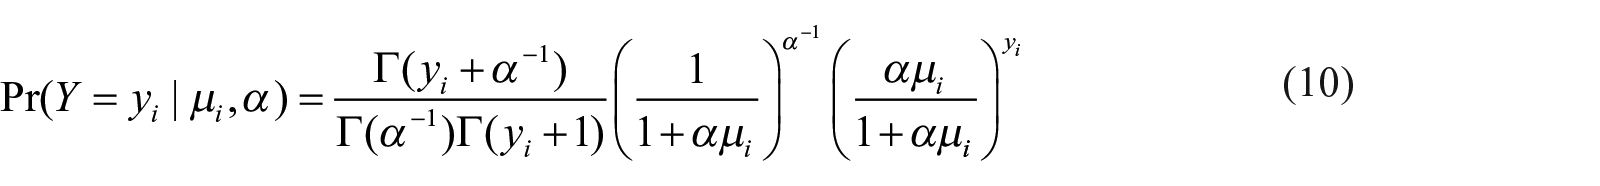
where the mean of y is determined by an exposure time, t, and a set of regressors consisting of

where
Alternative specifications
We present two alternative specifications. In the second set of models, our dependent variable is the weighted variable,

where
We also considered a third variant of our model 6 where the dependent variable is the binary variable BINNOV. For this model, due to the dichotomous nature of the variable, we used a binary probit model where the BINNOV is a random variable that takes on a value of 0 or 1 at time t, where 1 represents the decision that the workplace engages in any kind of innovation. Our model is represented by the equation

where F(.) is the cumulative distribution function (CDF). The probit model is derived by assuming the F(.) is the standard normal CDF.
Results and discussion
Table 1 shows descriptive statistics and correlations for the variables in the model as well as the various frequencies. The correlation between the two dependent variables,
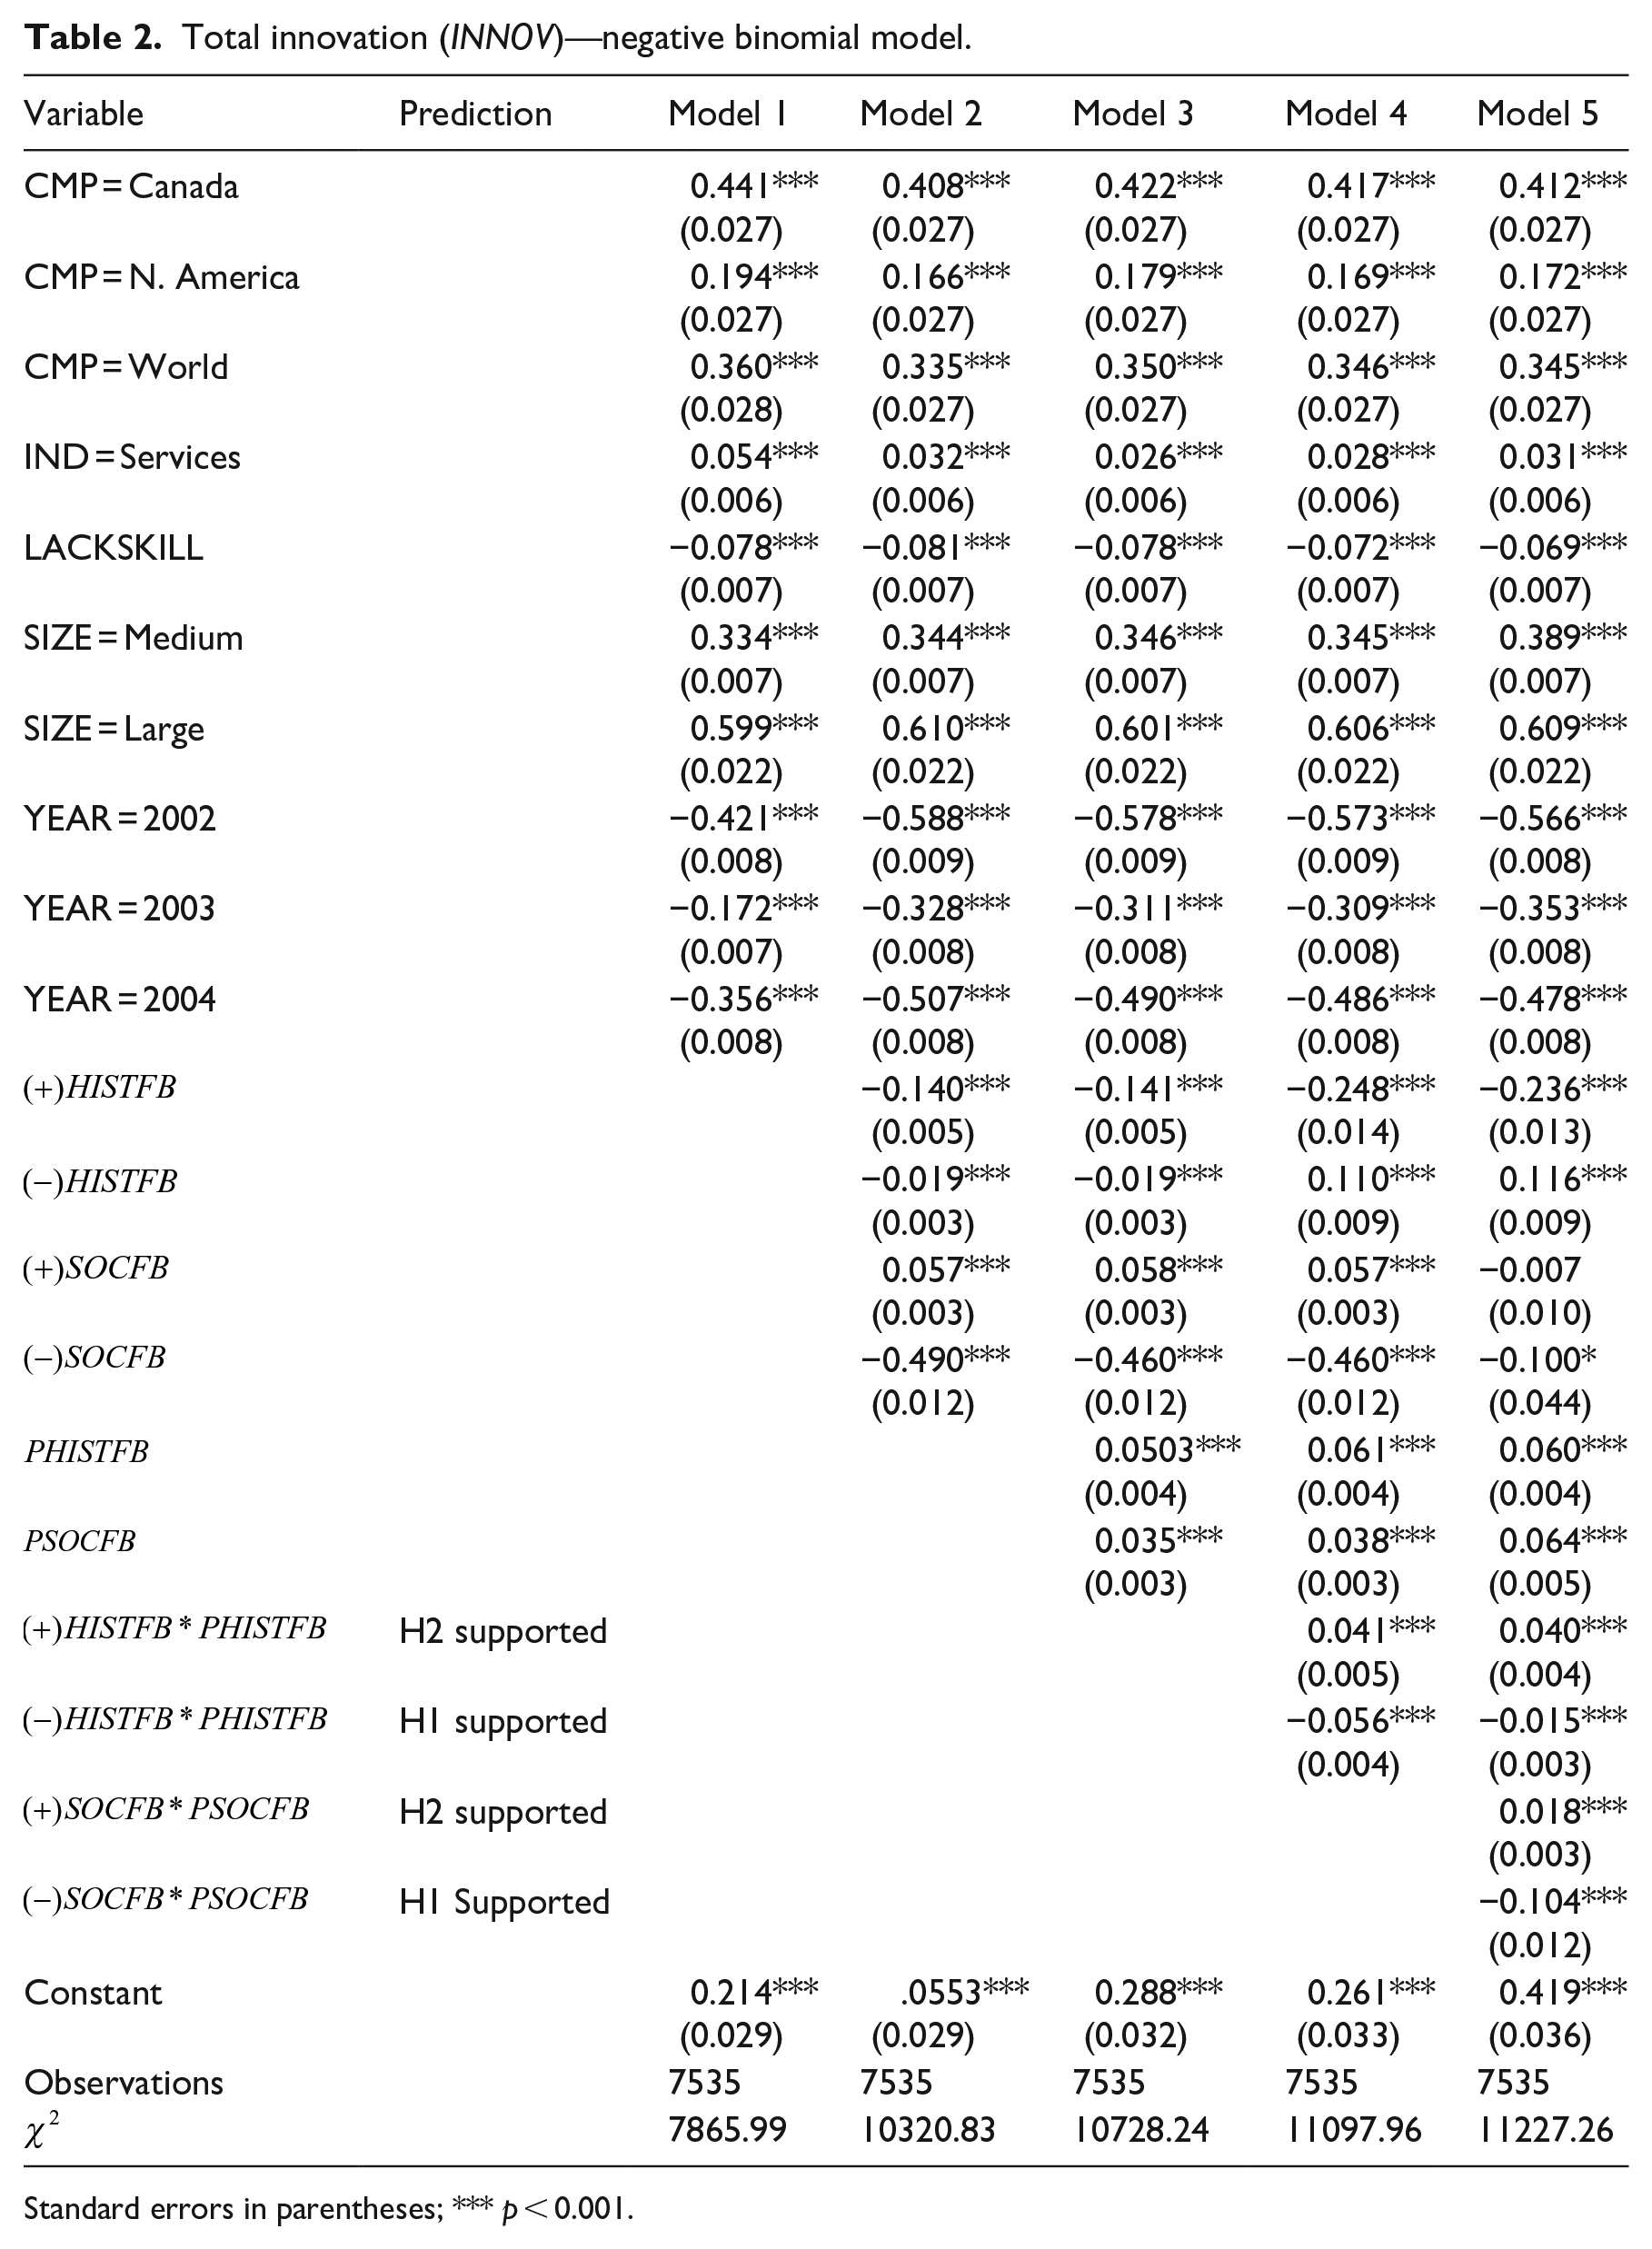
We discuss the results in Table 2. For our negative binomial model (equation (10)), we adopted a hierarchical approach which involves incrementally adding variables, including interaction terms. Therefore, Model 1 represents the base model where we included only the control variables (
Total innovation (INNOV)—negative binomial model.
Standard errors in parentheses; *** p < 0.001.
Main effects
Our results show that the expected counts of innovations is negatively and significantly related to positive objective performance feedback in the historical dimension (
Weighted innovation (WINNOV)—linear regression.
Standard errors in parentheses; *** p < 0.001.
While we find that historical objective performance feedback affects propensity to innovate differently than does the social dimension, it is not uncommon to observe such differences (see, for instance, (Kim et al., 2015) for a discussion of the differences between historical and social performance feedback). Our results for problemistic search are generally in line with Verver et al.’s (2018) meta-analysis where the authors found a significant effect for problemistic search only for historical performance feedback but not for social. Many factors such as the specificity or, more generally speaking, operationalization, of the social reference group (Blettner et al., 2019) can influence the effect of social reference group. While we carefully selected an empirically valid social reference group, it is difficult to directly compare results for social performance feedback across different studies due to the varying levels of specificity/different definitions of social reference groups across studies that affect the results (Hu et al., 2017).
Turning to the main effects of the perceptual variables, we find that both
Interaction effects
The interaction effects broadly support our hypotheses in both dimensions—historical and social. First, in Table 2, the negative coefficients of the two interaction terms (–0.015 and −0.104 in Model 5) each containing historical objective feedback(
With regard to performance above aspirations, that is,
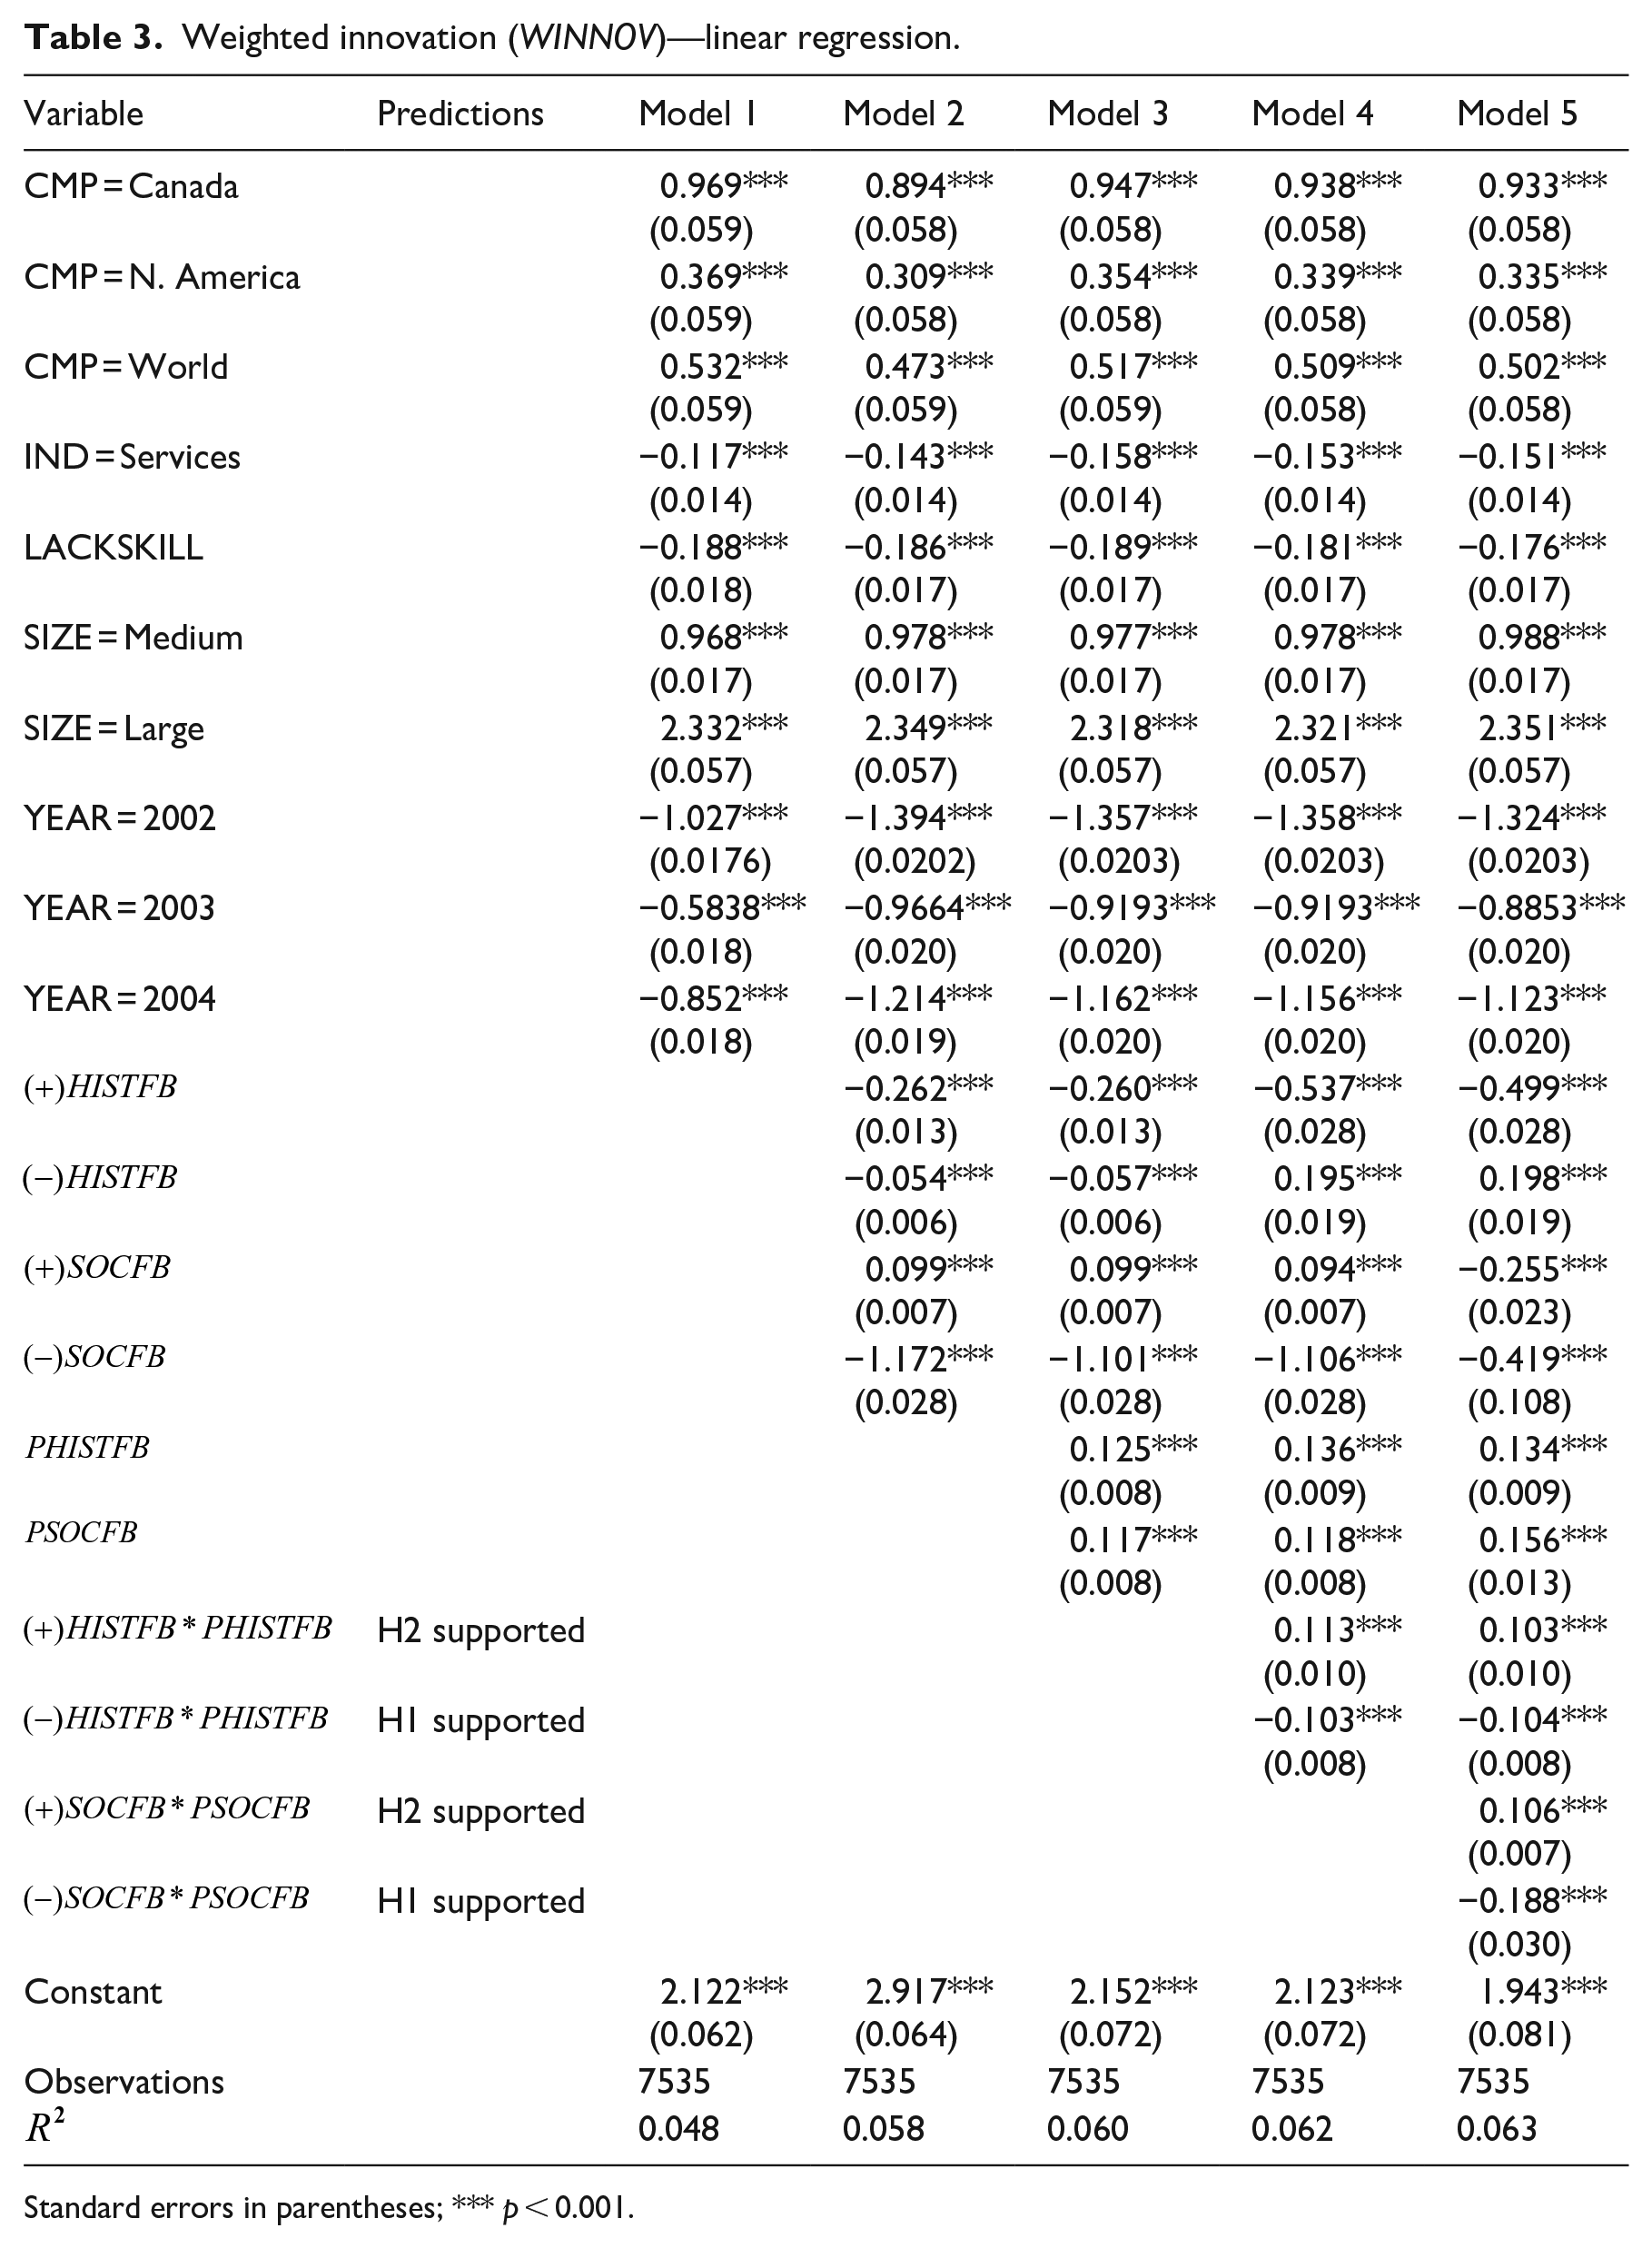
Similar to the five models considered for the negative binomial model (main model), we also adapted an incremental approach for our analysis of the weighted innovation variable (WINNOV) (equation (12)). The results from this analysis (Table 3) are consistent with that of the negative binomial in that the coefficients of the interaction terms are similar in direction and significance. Thus, both sets of results support our hypotheses. However, the coefficients for
Marginal effect analysis
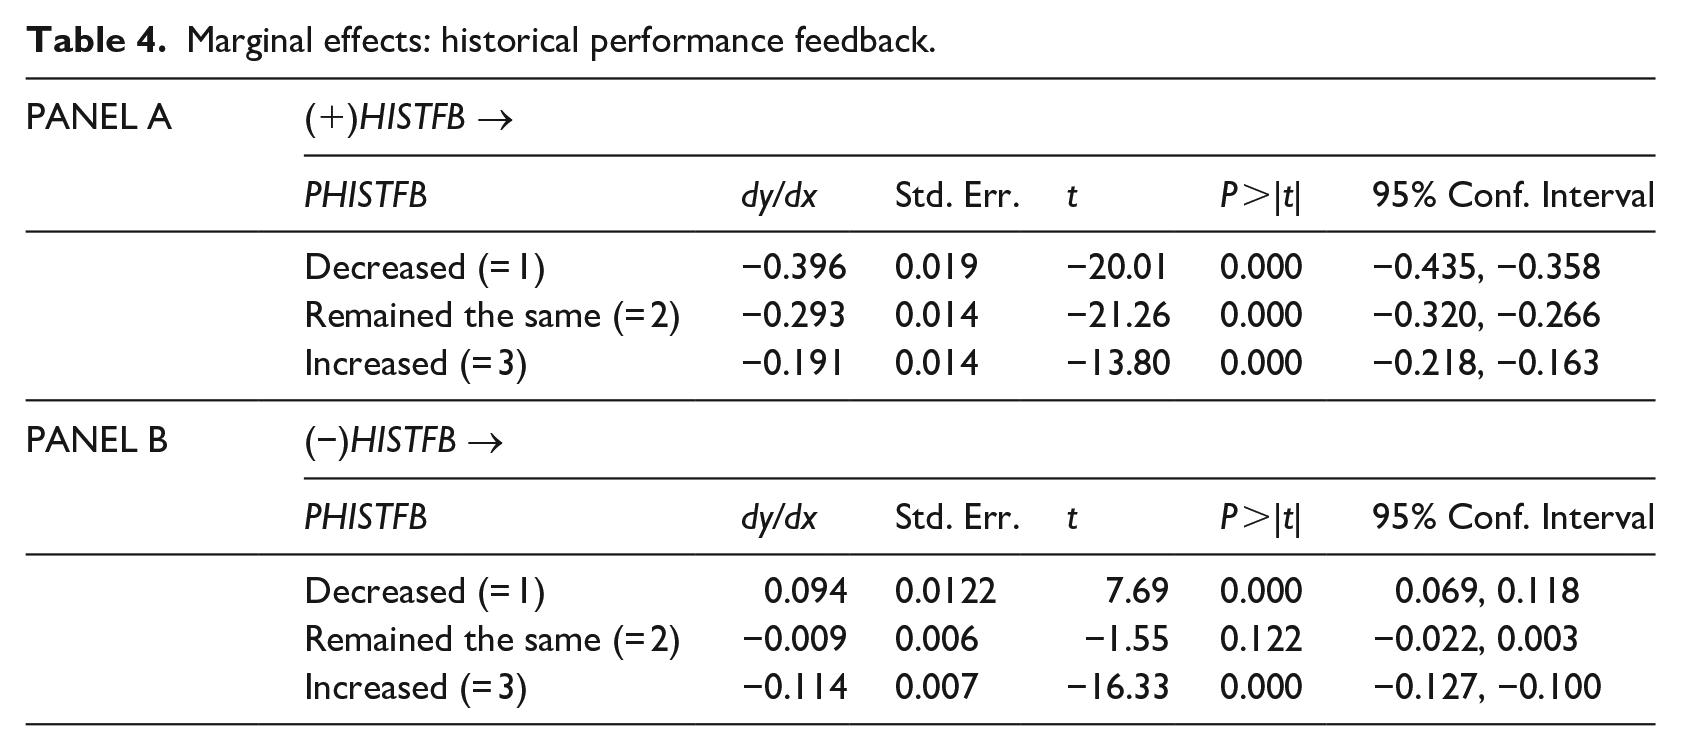
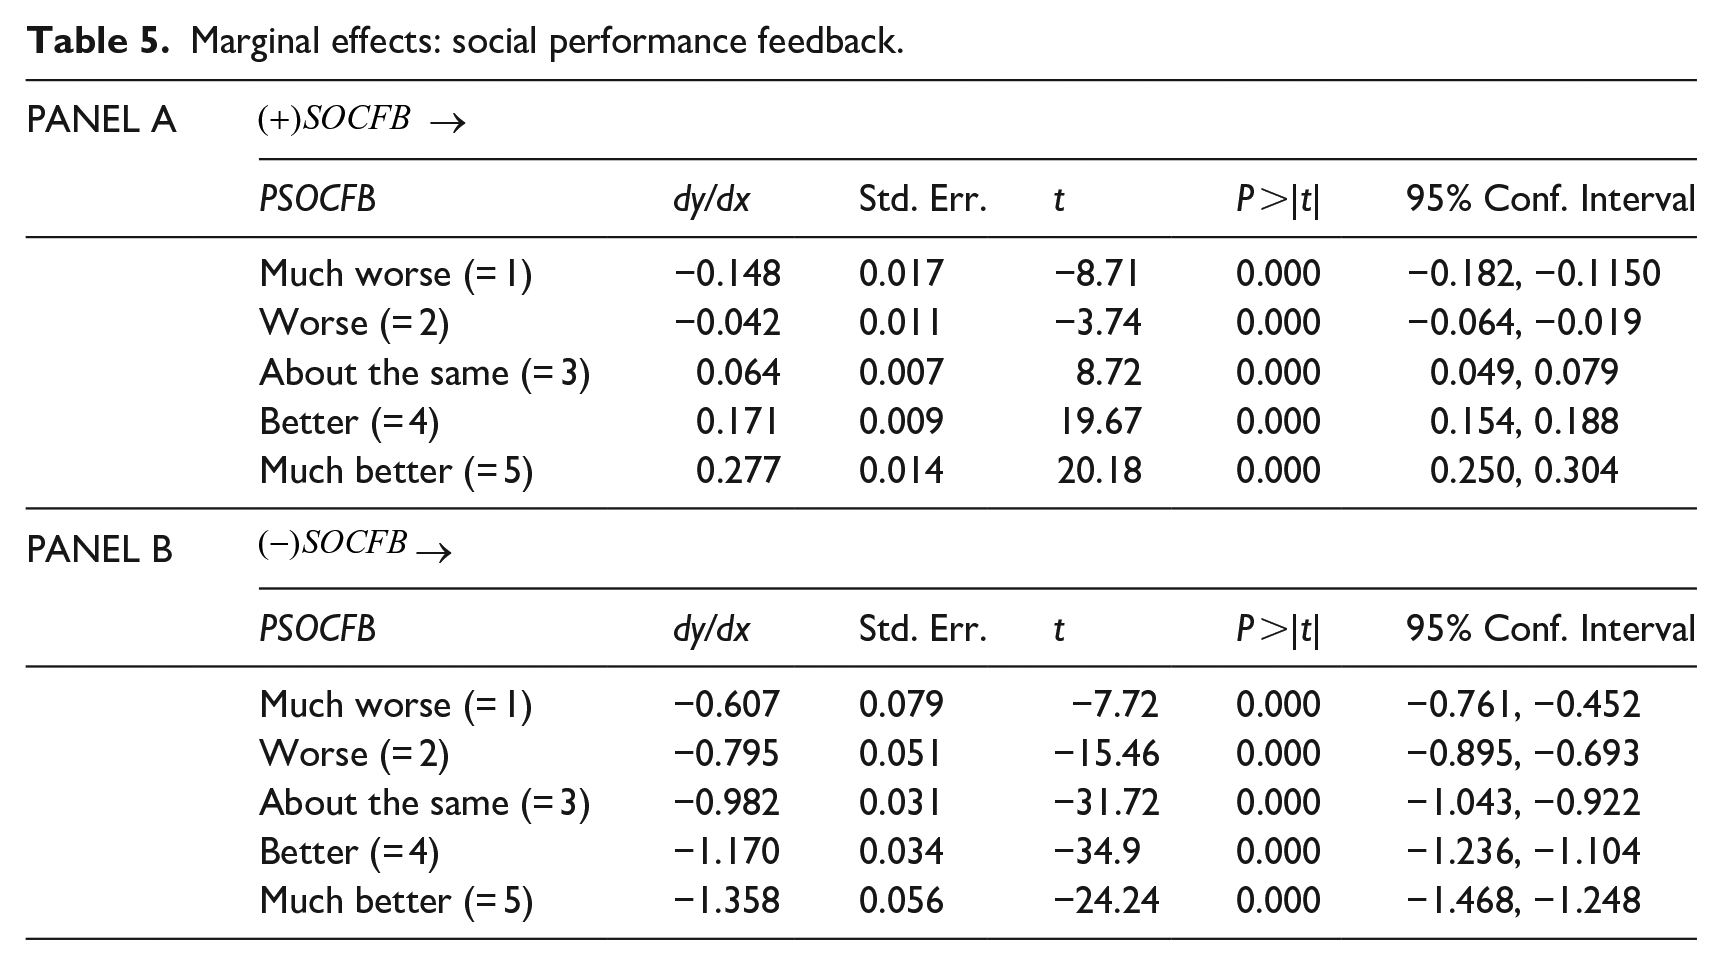
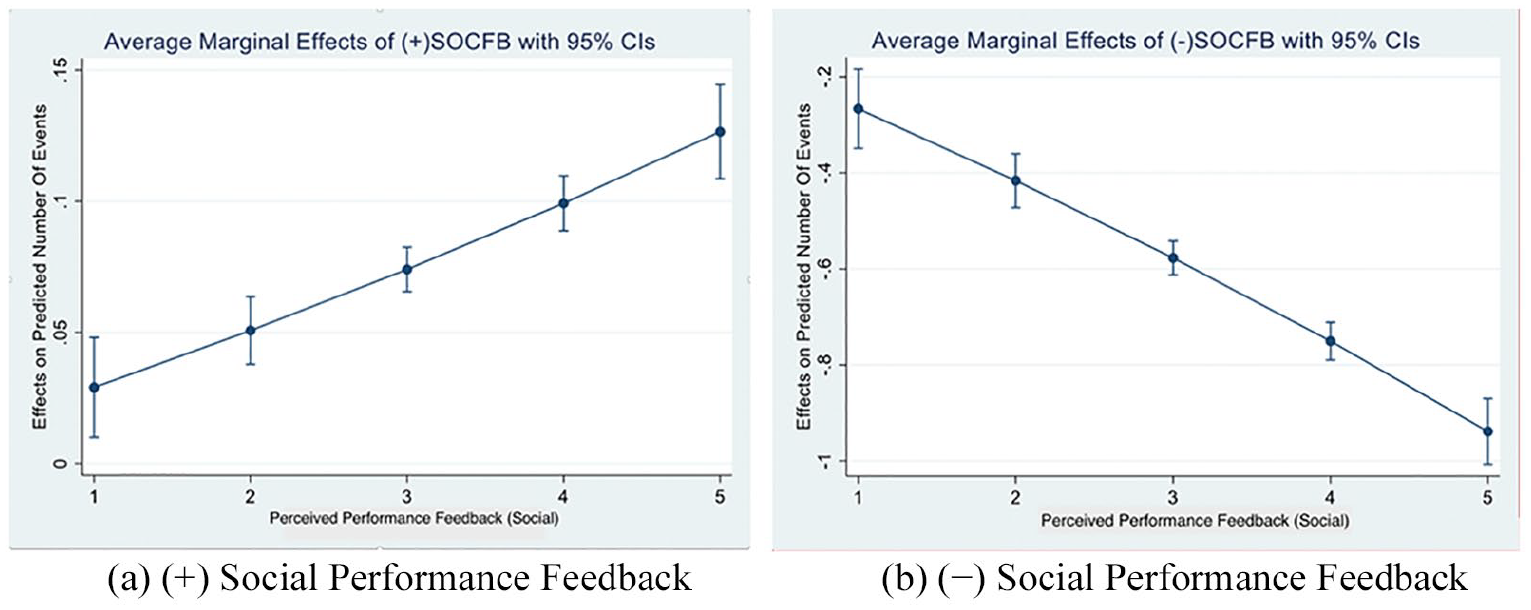
While our analyses provide support for our hypotheses, to further enhance our understanding of the interaction between perceived vis-à-vis objective performance feedback, we computed the marginal effects of positive and negative objective performance feedback for different levels of perceived performance feedback. The marginal effect essentially measures the effect of a unit change of a variable on the dependent variable. In our setting therefore, a marginal effect is the change in the (degree of) innovation resulting from a change in the objective performance feedback. Examining the marginal effects at different values of perceived performance feedback allows us to see how inconsistency between objective and perceived measures affect innovation decisions, in particular, at points where the inconsistencies are pronounced. For example, an explicit case where the inconsistency is qualitatively higher is when objective performance is negative and falling (
We begin by computing the marginal effects for the models in Table 3 where the dependent variable is the continuous innovation variable (WINNOV). We use WINNOV because marginal effects of continuous variables would be easier to interpret. In a linear regression model, marginal effects are point-estimates separately computed at each value of the perceptual variables ( PHISTFBit and PSOCFBit), as in our case. Thus, a marginal effect is calculated as the derivative of the probability relative to the objective measures, that is,
Marginal effects: historical performance feedback.
Marginal effects: social performance feedback.
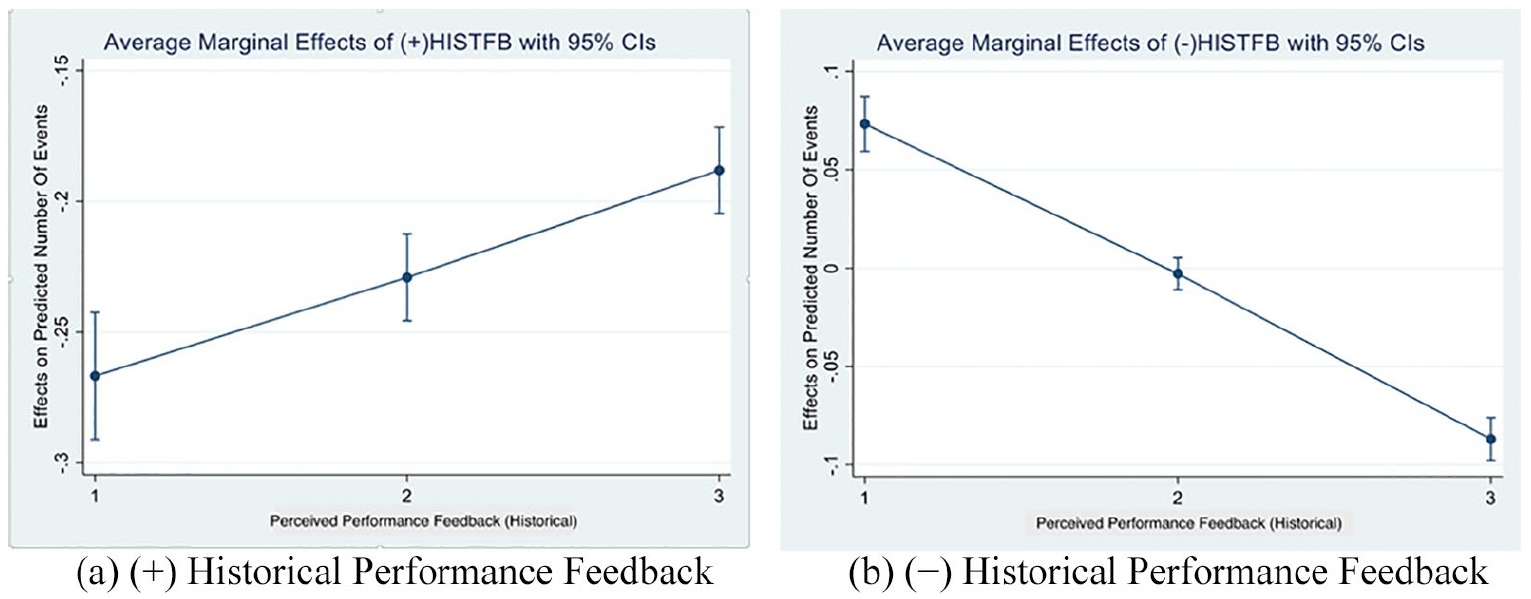
Considering Table 4 (Panel A), we see that the marginal effects for positive historical performance feedback (
In the case of negative performance feedback (
We find, for example, in Figure 1(a), when the discrepancy between objective and perceptual perceptions is the greatest, that is, PHISTFB = 1, the negative effect on innovation counts is most pronounced when PHISTFB = 1 (by roughly 2.7% points), but the decline is the least for when PHISTFB = 3 (by 1.9% points), that is, when the discrepancy is the least. Conversely, in Figure 2, the discrepancy between objective and subjective perceptions is the most pronounced when PHISTFB = 3 and that is where we see the largest impact on INNOV and the least when the discrepancy is the least, that is, when PHISTFB = 1. For
Marginal effects—historical performance feedback.
Marginal effects—social performance feedback.
Finally, we also analyzed a variant of our main model where we use a spline representation of the perceptual variables—in this model, we assume that positive and “no change” perceptions form part of a positive spline, while negative perceptions are part of the negative spline (Baum et al., 2005; Greve, 2003a). Results from this specification (Table 6) are interpreted in terms of the relative slopes in Figure 3 and, except for one condition, they are mostly similar to those from the previous specifications in that they show evidence of an increasing degree of innovation when perceptions are consistent with performance feedback (see Figure 3). The exception when the inconsistent feedback more strongly results in innovation run contrary to our hypothesis and parallels the interaction term
Weighted innovation (WINNOV)—linear regression with splined perceptual feedback.
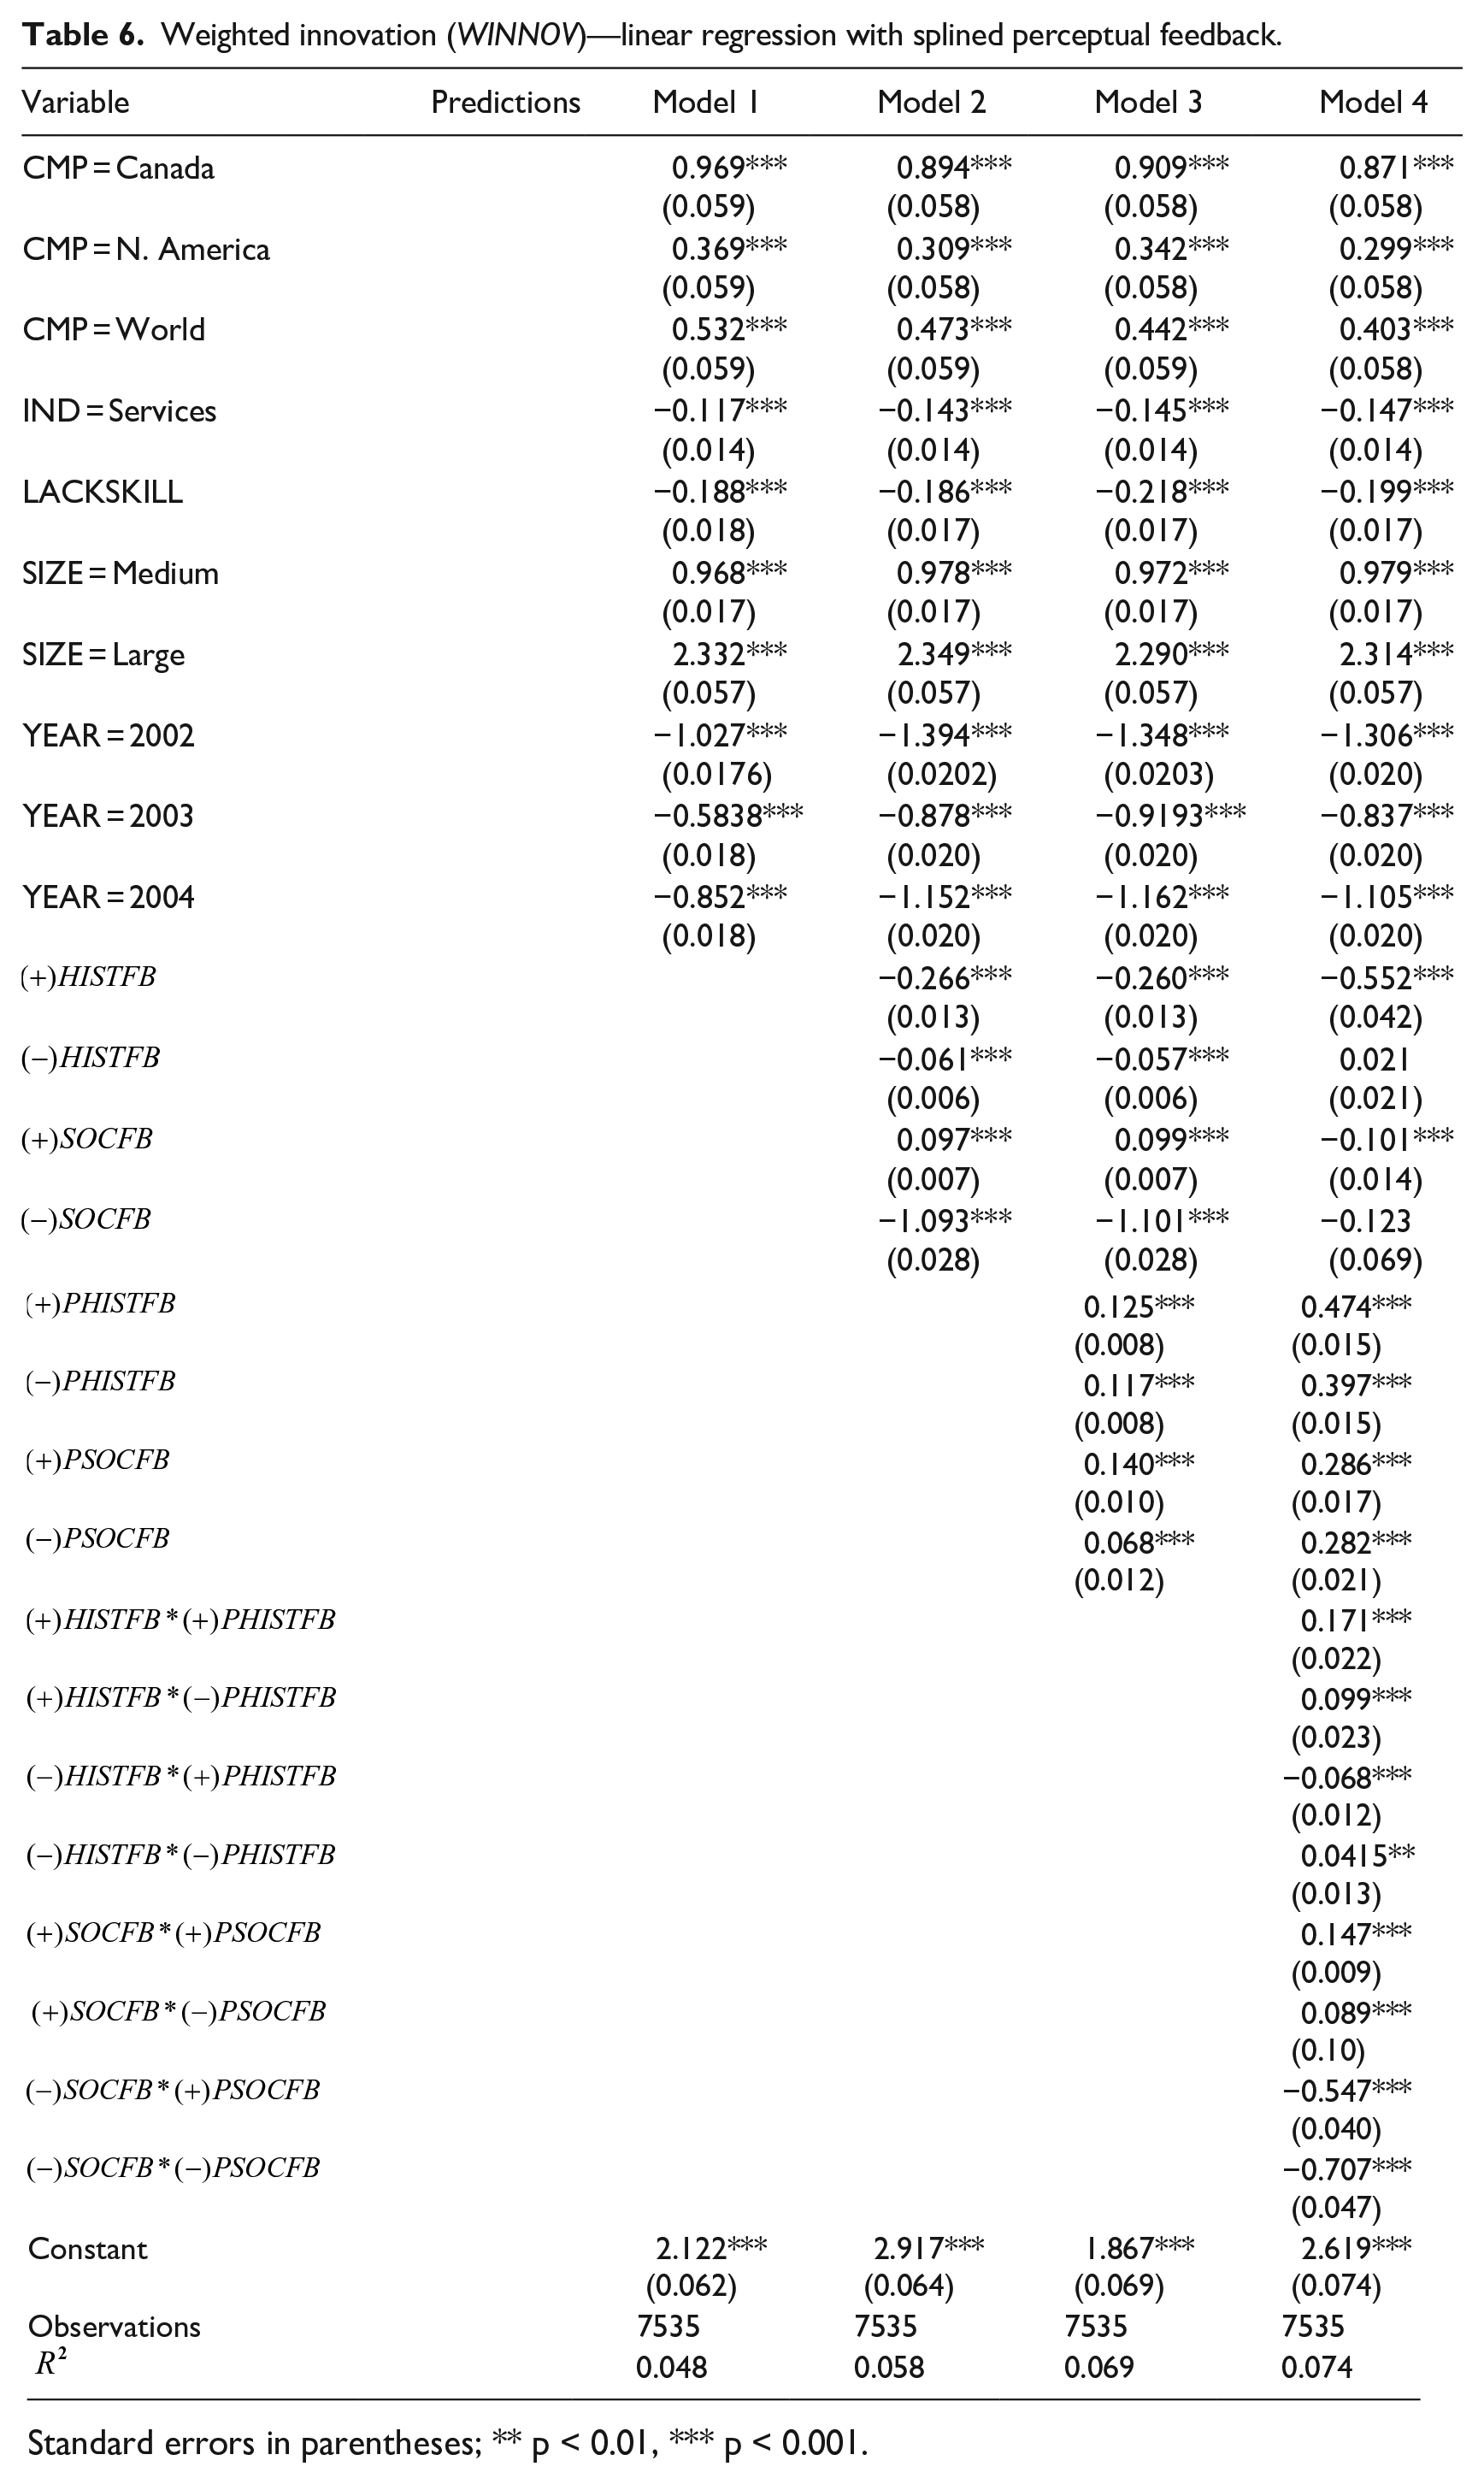
Standard errors in parentheses; ** p < 0.01, *** p < 0.001.
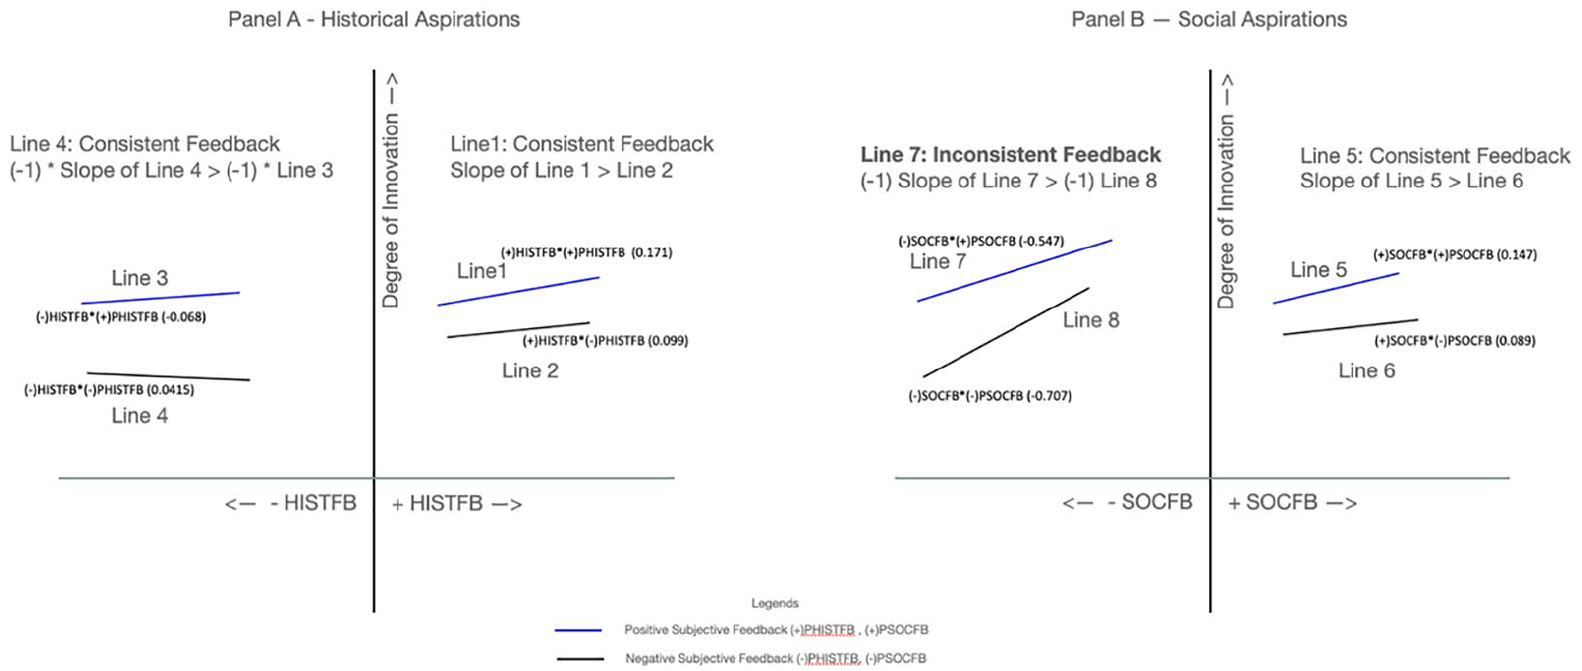
Interaction effects.
Conclusion
Contributions to research
Our research contributes to the PFT (Greve, 2003a) in several ways. First, ours is one of the first PFT studies to include an empirical measure of managers’ perceptions of performance feedback together with the conventionally used objective measure of performance feedback. Our approach was exceptional as it permitted us to determine the degree of (in)consistency between managers’ perceptions and objective performance feedback, but we were also able to assess perceptions and objective performance feedback each for historical and social reference points. Our study complements and extends the work of Audia et al.(2015) and Villagrasa et al.(2018). Both articles used a single measure of satisfaction with the outcomes, not differentiating satisfaction with historical and social reference points. Thus, we believe that our study is the first to systematically examine perceptual (historical and social) performance feedback as well as objective (historical and social) performance feedback. Our results are generalizable since our sample includes workplaces of many sizes and industries and is representative of the Canadian economy. Thus, bound to country and other context factors, our study allows us to draw conclusions on the effect of perceived performance feedback in combination with objective performance feedback. We also demonstrate the effects in the context of innovation (unlike that of “intended strategic changes” (Villagrasa et al., 2018)). Theoretically, this is relevant because innovation differs substantially from change (Verver et al., 2018). Given that we find an important effect of perceptual measures beyond the objective performance feedback has important methodological implications for PFT research that conventionally does not include perceptual variables but solely objective ones. This may also imply that future PFT studies may opt for different research designs such as surveys, scenarios, and experimental set-ups.
Second, our study advances theorizing on how managers’ perception and cognition shape organizational responses to performance feedback. Many authors suggest integrating aspects of managerial cognition into PFT studies (Posen et al., 2018; Powell et al., 2011). Our study responds to this call and offers promising insights into the role of perception and cognition in the performance feedback process that centers around managers’ interpretation and learning. Specifically, we investigate how perceptions moderate objective measures. Building on Andrews et al. (2006), we argue that measuring perceptions together with objective measures yields important insights into the learning from performance feedback. Our results form a basis for deeper investigation into the micro-psychological foundations of managerial behavior where distinct psychological processes can constitute the aggregate perceptions of performance that we measured (Plambeck and Weber, 2009).
Third, our study introduces a new form of (in)consistency of performance feedback (Audia and Brion, 2007; Blagoeva et al., 2019; Joseph and Gaba, 2015; Lucas et al., 2018; Lv et al., 2019). Building on this stream of research, we examined the (in)consistency between perceptual and objective performance feedback. Our significant results suggest that the (in)consistency between perceptual and objective performance must be part of a larger theory of (in)consistency within the PFT. This also partially explains why some studies on (in)consistent performance feedback such as (Lucas et al., 2018) had limited findings. We conclude that (in)consistent performance feedback is not only multi-dimensional but the different dimensions of (in)consistencies likely also have contradictory effects on organizational responses to performance feedback. Therefore, studies as ours that shed light on the (in)consistencies of performance feedback on the micro-level can further reconcile diverging empirical results (Kotiloglu et al., 2021), stimulate further conceptual refinement of the PFT and inform our understanding of how managers interpret and learn from performance feedback.
Limitations and future research
We highlight three key limitations of this research. First, while we were able to analyze the role of perceptions in performance feedback, our study is limited inasmuch as we cannot determine the origin of these perceptions (e.g. self-enhancement, Audia and Brion, 2007). Thus, it will be important for future research to explore different origins and engage in theorizing on different effects of perceptions of different origins. For instance, negative perceptions of performance may have a different effect if they originate from self-enhancement versus overconfidence. Second, while the data from the WES hosted by Statistics Canada is rich in terms of the sample size and its longitudinal design, the organizations in this survey are de-identified, preventing us from gaining any additional insights on the specifics of the organizations in our sample. This can help in several ways, for example, with more accurate and sharper definition of reference groups or more data on the specific competitive environment of each firm. Similarly, knowing the identity of the organizations will let researchers conduct surveys or interviews of managers to collect individual-level data. Finally, we hope that future research can perform a more comprehensive study of (in)consistencies in performance feedback along dimensions that we studied, for example, by simultaneously measuring multiple goals pursued by firms, along with managers’ perceptions of feedback on those goals.
Footnotes
Declaration of conflicting interests
The author(s) declared no potential conflicts of interest with respect to the research, authorship, and/or publication of this article.
Funding
The author(s) disclosed receipt of the following financial support for the research, authorship, and/or publication of this article: The authors gratefully acknowledge financial support from the Social Sciences and Humanities Research Council of Canada (Standard Research Grant 410-2010-2157).