
Abstract
Scholars have long debated the effect CEOs have on firm performance, including a focus on how their effect shifts across industries, national settings, and time. Unexplored, however, is the possibility that the CEO effect might differ in publicly traded versus privately held firms. Drawing on a unique longitudinal sample of both publicly traded and large, privately held Swedish firms from 1997 to 2013, we replicate and build upon prior CEO effects studies and find that private-firm CEOs have a greater effect on firm performance, for good or for ill, than do their public firm counterparts. Our results are strengthened after controlling for industry, firm profitability, and size in a matched-pair sample. We discuss the implications and potential future research stemming from these findings.
Keywords
Introduction
Strategic management scholars have engaged in considerable debate regarding the nature of executive influence. Beginning with Lieberson and O’Conner (1972), a long-running stream of research has attempted to quantify the effect CEOs have on firm performance and, while there has been extensive debate in recent years about its precise magnitude (Fitza, 2014; Hambrick and Quigley, 2014; Mackey, 2008; Quigley and Hambrick, 2015), there is growing evidence that the CEO effect—defined as the amount of variance in firm performance, positive or negative, explained by variance in CEOs and after accounting for contextual factors—is (1) meaningfully large (Quigley and Graffin, 2017); (2) contingent on national settings (Crossland and Hambrick, 2007, 2011); (3) increasing in magnitude over the past several decades (Quigley and Hambrick, 2015); (4) recognized by market participants as an important driver of a firm’s share price (Quigley et al., 2017); (5) and contingent on whether CEO succession is internal or external (Helfat and Bailey, 2005; Quigley et al., 2019).
Despite these findings, this research stream is somewhat limited by the fact that all of the studies on this topic have used samples of large, publicly traded firms, and generally from the United States (for international examples, see Crossland and Hambrick, 2007, 2011; Thomas, 1988). To the best of our knowledge, however, there have been no attempts to measure the CEO effect in privately held companies. This is a critical blind spot for two reasons. First, publicly traded firms make up just a small portion of the overall economy. In the United States, for instance, less than one-tenth of 1% of businesses are publicly traded and, even among larger firms with more than 500 employees, more than 85% are privately held (Asker et al., 2014). Private firms make up the majority of the worldwide corporate landscape as well (The World Bank, 2016). Furthermore, the number of publicly traded companies in developed economies, such as the United States, United Kingdom, and Eurozone countries is in decline (CFA Institute, 2018). As just one example, in 2015, the United States had approximately 3700 publicly traded firms, nearly half what existed in the mid-1990s and fewer than existed as recently as the mid-1970s (Doidge et al., 2015; Ritholtz, 2015).
Second, the CEO effect in private firms may well be significantly different than what is seen in publicly traded firms, yet the direction and magnitude of any difference is less clear. For example, several studies highlight ways in which the discretion, or latitude of action (Hambrick and Finkelstein, 1987) of private-firm CEOs, might be constrained. Specifically, private-firm CEOs frequently face resource constraints (George, 2005) and often have a mind-set focused on limiting risk (Boeker, 1997; Trostel and Nichols, 1982). Furthermore, even after controlling for firm size, CEOs of privately held firms are generally paid less than their public firm counterparts (Chief Executive Group, 2014). To the extent compensation is positively related to managerial discretion and the potential for executive impact (Crossland and Hambrick, 2011; Finkelstein and Boyd, 1998), this suggests that CEO effect might be lower in private firms. Finally, public firm CEOs are pressed to beat expectations of financial markets and maximize financial results by taking on risks (Lazonick and O’Sullivan, 2000; Useem, 1996). Although this pressure, and resulting risk, sometimes leads to large gains in performance, they can induce large losses as well. Conversely, private-firm CEOs often operate without the constant pressure to exceed prior levels of performance each reporting period. Instead, CEOs of private firms can approach risk taking with a measure of caution and with less pressure to act quickly. With less pressure to constantly adapt the firm in an effort to beat prior levels of performance, there might be a corresponding decrease in the CEO effect in private companies (Hambrick and Quigley, 2014).
On the contrary, some factors might enhance the latitude and relative impact of private-firm CEOs. Private firms tend to be nimble with CEOs often navigating them to compete in niche market segments (Cooper et al., 1986; Thornton, 1999) that can reduce the constraints imposed by industry and diminish the impact of competitive rivalry (Chen and Hambrick, 1995; Echols and Tsai, 2005) thus amplifying the impact of CEOs. In addition, when making the decision to go public or stay private, executives often struggle with tradeoffs between managerial control and access to resources (Boot et al., 2006). That is, the very idea of remaining private or going public is often tied to the notion of control and managerial discretion. Public firm CEOs, on the contrary, face a bevy of regulation and pressure to conform to norms, which is reinforced via scrutiny from government agencies, investors, and boards of directors. This could limit choice and inhibit flexibility of the CEO to move their firm in a desired direction which, by extension, might limit their potential for impact.
Because reliable financial statements and CEO employment data for private firms are not generally available, strategic management studies comparing phenomenon in public versus private firms are somewhat rare. In this article, we extend the work of prior “CEO effects” studies (Crossland and Hambrick, 2011; Lieberson and O’Connor, 1972; Mackey, 2008; Quigley and Hambrick, 2015; Wasserman et al., 2010; Weiner and Mahoney, 1981) with a unique sample of privately held firms and compare these results with a sample of publicly traded firms in the same setting. Our data come from unique datasets managed by the Swedish government. Statistics Sweden collects detailed corporate financial information (certified by a public accountant) for both publicly traded and privately held firms. These data were matched with employer–employee information (also obtained from government agencies) to form a dataset of 1501 private (25,517 firm-years and 5751 unique CEOs) and 178 public (3026 firm-years and 653 unique CEOs) Swedish firms over the period 1997–2013. We use this unique dataset to answer a straightforward but important research question: “Does the CEO effect on performance differ in privately held versus publicly traded firms?”
One can readily imagine that the population of private firms, on average, faces differing degrees of various forces that limit or expand the potential for an executive effect. Most notably, firm size is a substantial contributor to the inertial forces that often limit leader discretion (Audia and Greve, 2006; Fredrickson and Iaquinto, 1989; Hambrick and Finkelstein, 1987). Since private firms can range in size from a sole proprietorship and those with just a few employees to large entities with billions in revenue and tens of thousands of employees, it is important to note that our study focuses on the largest public and private firms that likely face similar conditions. That is, we compare Swedish publicly traded firms, such as Skanska and Electrolux with the largest, privately held firms like Vattenfall and Scania 1 while excluding smaller, privately held firms such as a local auto repair shop with just a few employees. Thus, the comparisons we make are among firms of reasonably similar magnitude.
Our results show that the CEO effect in privately held firms is substantially larger than in public firms. Furthermore, after controlling for industry membership, firm profitability, and firm size through a matched-pair design, our results remain consistent. Our study makes a number of important contributions. First, we empirically demonstrate that the private-firm CEO effect is larger than what is seen in public firms. Second, to the extent, our findings generalize to other settings, it highlights an interesting puzzle whereby public CEOs are generally paid larger sums while private-firm CEOs seem to be associated with higher variance. This is especially compelling given our findings remain when firms are matched for size and industry. Finally, by replicating classic CEO effects studies (Crossland and Hambrick, 2007, 2011; Lieberson and O’Connor, 1972; Quigley and Hambrick, 2015) in a non-US (Sweden) setting and with privately held firms, we show that important empirical relationships can differ in public versus private firms. To the extent, scholarly work informs practice, this calls attention to the need for greater research in alternative settings precisely because these settings might be important moderators of the underlying relationships. We discuss these issues in greater detail below.
Background
Since Lieberson and O’Connor’s (1972) initial study of the “CEO effect,” scholars have used variance partitioning methodologies to quantify the proportion of variance in firm performance explained by CEOs and contextual factors (Crossland and Hambrick, 2011; Mackey, 2008; Quigley and Hambrick, 2015). The typical study, using a panel dataset of a dozen or more years, allocates variance in performance across a series of categorical variables representing calendar years (accounting for general economic trends), industries, firms, and CEOs (for summaries of this research stream, see Fitza, 2014; Mackey, 2008; Quigley and Hambrick, 2015). The traditional method of analyzing the CEO effect was to use analysis of variance (ANOVA; Lieberson and O’Connor, 1972; Mackey, 2008) or other ordinary least square (OLS)-based methods (Thomas, 1988; Weiner and Mahoney, 1981) to compare a series of models. First, the performance outcome, most typically return on assets (ROA), is predicted with just calendar year effects (e.g. dummy variables) followed by a second model including year and industry effects, a third model that adds firm effects, and, finally, a fourth model that includes year, industry, firm, and CEO effects. The incremental variance explained, or R-squared, by each subsequent model was attributed to the categorical variable added at that stage. Recognizing the inherently nested nature of the underlying data (e.g. Raudenbush and Bryk, 2002), more contemporary efforts have adapted multi-level modeling to segment variance across these levels (Crossland and Hambrick, 2011; Quigley and Hambrick, 2015). However, the overall objective remains the same—apportioning variance across a number of categorical predictors. As just one example, in a US sample from 1990 to 2009 with ROA as the performance metric, Quigley and Hambrick (2015) found that yearly effects accounted for 2.3% of the variance in firm performance; industry effects—1.8%; firm effects—18.1%; and CEOs—22.9%. The remaining 54.9% of the variance was unexplained.
Recognizing that the potential for CEO impact can vary by context (Hambrick and Finkelstein, 1987), prior research has documented three broad contingencies for the CEO effect (Wangrow et al., 2015). In a pair of studies, Crossland and Hambrick (2007, 2011) showed that the CEO effect varied across national settings. In high discretion settings, like the United States, CEOs are associated with a larger proportion of the variance in firm outcomes than in lower discretion settings, such as Japan. Mackey (2008) used a unique sample of CEOs that headed multiple firms and found their effect to be larger than seen in the general population of CEOs that have typically led just a single firm. Finally, Quigley and Hambrick (2015) argued that the magnitude of the CEO effect has shifted, within the United States, over time. Namely, they argued that modern CEOs have (1) more legitimate actions to choose from; (2) compensation incentives that drive large and risky strategic moves; and (3) face shareholder pressures that demand the pursuit of strategic novelty rather than the status quo. Arguing these forces enhanced the potential for CEO impact, their results showed a considerable increase in the CEO effect over a period of six decades. Collectively, these studies show how the CEO effect varies in important ways across different subsets of leaders, firms, and contextual conditions.
It is important to note that a higher (lower) CEO effect does not imply that CEOs are better (worse) in a given setting. Rather, a “larger CEO effect arises when many individual CEOs deliver distinctive performance by deviating, positively or negatively, from the expectations driven by contextual factors” (Quigley and Graffin, 2017: 794) including firm trajectory, industry trends, and the general economic environment.
CEO effect in public and private firms
Missing entirely from the study of the CEO effect is a consideration of its magnitude in privately held firms. That is, to the best of our knowledge, all studies of the CEO effect have focused on publicly traded firms (however, see Salancik and Pfeffer, 1977: for a unique study of city mayors). This is problematic for two reasons. First, publicly traded firms make up just a small portion of all economic activity. In the United States, the “27 million privately held companies . . . account for 80 percent of new jobs and up to 70 percent of GDP” (Sageworks, 2016), while also accounting for more than half of capital expenditures on plant and equipment (Asker et al., 2014). Globally, there are approximately 40,000 publicly traded firms (The World Bank, 2016), but tens of millions that are privately held. In short, while important, publicly traded companies represent a relatively small portion of overall global economic activity. Moreover, the number of publicly traded firms is shrinking as well. In the United States, there are now less than half the number of publicly traded firms than existing in the 1990s and fewer than existed in the mid-1970s (Davis, 2009; The World Bank, 2016). That is, while much of the research is focused on public firms, the share of the economy of developed nations made up by these firms is somewhat small and shrinking (CFA Institute, 2018).
Second, there are reasons to believe the CEO effect may be quite different in private firms. Connelly et al. (2010), for example, recently cautioned against generalizing the dynamics of public firms to private ones. Furthermore, there is evidence that private firms exhibit substantially different strategic behavior and agency dynamics than public firms (Boot et al., 2006). Below, we address factors that could reduce or amplify the CEO effect in private versus public firms.
CEO effect in private firms may be lower
To the extent, CEOs maintain the status quo or enact incremental change, we would expect narrow performance deviations largely in line with industry trends and past firm performance. By extension, the CEO effect would be smaller in these cases. Several characteristics of private firms align with this logic.
In general, private firms are less risk-seeking (Boeker, 1997; Trostel and Nichols, 1982), relative to their public firm counterparts. Rather than making large bets and “swinging for the fences” as encouraged by compensation packages that are bulked up with stock options (Sanders and Hambrick, 2007) and the constant pressure of analysts and other market participants, private-firm CEOs tend to have large portions of their personal wealth concentrated in their firms resulting in more cautious decisions. This is often reflected in risk aversion (Gómez-Mejía et al., 2007), longer-term investment horizons, an eye toward stability (George, 2005; Trostel and Nichols, 1982), and a generally lower margin for error. As such, owners of private firms are likely to favor more detailed analysis, longer decision timelines, and “better safe than sorry” strategies over those that entail substantial risk and the potential for extreme positive or negative outcomes. All of this would generally mute the CEO effect. This stands in contrast to incentive arrangements in publicly traded firms that are often designed to induce more risk taking in otherwise risk-averse executives (Eisenhardt, 1989), typically through the extensive use stock options and stock grants. To the extent, private firms enact lower risk strategies that remain relatively stable, even across multiple CEOs, one would expect fewer substantial deviations from performance expectations. This, in turn, would mean a smaller overall CEO effect.
Hambrick and Finkelstein (1987) also argued that a lack of resources could constrain a leader’s discretion which would lower the CEO effect. Even after controlling for size, private firms are often undercapitalized (Fuller et al., 2002), face challenges gaining access to new capital, and, when successful, do so at higher interest rates (Easley and O’Hara, 2004) than public firms. The net result is higher leverage that limits strategic choices (Pagano et al., 1998). That is, even if a private CEO wants to make a bold move that might lead to larger deviations in performance (and a higher CEO effect), resource constraints might make a desired strategic move untenable, limiting the ultimate effect of these CEOs.
Concentrated ownership may also restrict the CEO effect in private firms. In publicly traded firms, ownership is spread widely often shielding managers from the demands of any individual shareowner (Jensen and Meckling, 1976). These CEOs often have extensive latitude over both objective outcomes and the means through which they pursue them (Shen and Cho, 2005) allowing for divergent strategies. This increases the likelihood of the distinct outcomes that lead to a heightened CEO effect. In contrast, ownership of privately held firms is often highly concentrated in the hands of a few owners who wield extensive influence over the paths chosen by a CEO. In this case, proposed actions by CEOs who run afoul of owner interests can be met with quick resistance unlikely to occur with more dispersed public firm ownership, thereby limiting the variance associated with those CEOs. Similarly, in comparing the effect of CEOs across national settings, for example, Crossland and Hambrick (2011) found a connection between ownership concentration and discretion. To the extent that ownership in privately held firms is generally more concentrated than in publicly traded firms, we would expect greater constraint, and a lower CEO effect, in private firms as well.
CEOs of private firms may also choose to limit their impact even though they may have extensive latitude. In describing an “unconstrained manager,” Hambrick and Finkelstein noted, In situations of low discretion, one can speak of “effects.” For example, if the chief executive has or sees no options, one can reliably predict that the organization’s strategy will be stable. However, in situations of high discretion, the opposite—the occurrence of shifting strategies—cannot be predicted reliably. For even in the face of multiple options on many fronts, the manager may still elect to pursue the status quo. Discretion allows change and variations but does not ensure it (1987: 394).
That is, while some of the factors noted above clearly limit the CEO effect in private firms (e.g. access to capital) others reflect a choice, by the CEO, not to exert their influence (lower risk, status quo, etc.). Thus, even if CEOs in private firms have substantial latitude, they may choose consistency and stability in their strategic actions which will tend to diminish their collective impact as measured by the CEO effect.
CEO effect in private firms may be higher
While a number of factors might limit the CEO effect in private firms, others likely enhance their potential for impact relative to their public firm counterparts. Perhaps the most basic is the idea that executives frequently wrestle with the inherent trade-off between access to resources afforded by publicly traded markets and control when deciding to go public (Boot et al., 2006). In a survey of CFOs, Brau and Fawcett (2006) noted the leading reason firms stay private is “to preserve decision-making control and ownership” (p. 425) and it seems likely that CEOs would share this opinion. That is, at the very core of a decision to remain private is a preference to have the flexibility to enact strategies that might face resistance from the board or shareholders in a publicly traded company (though, in line with our arguments above, one could counter that this desire for control might allow leaders to avoid financial market pressures for maximization in order to maintain a more stable set of strategies, thus reducing CEO impact).
Building on this, private companies—even larger ones—are often more agile than publicly traded firms. Despite the fact that private firms face resource constraints and high leverage, there is evidence that they can positively adapt to those constraints (George, 2005) by navigating their companies to compete in niche markets (Cooper et al., 1986; Thornton, 1999) with limited competition where industry forces may be reduced. Reduced industry constraint allows for the potential of a larger CEO effect. However, one should not equate these moves with guaranteed success, as some CEOs may choose to compete in less favorable settings or enact unique but ineffective strategies and, as a result, deliver distinctively poor performance. If, collectively, this maneuvering leads to a large number of private CEOs performing more distinctively, positive or negative, than public firm CEOs, then the CEO effect would be larger in private firms than in public firms.
Private-firm CEOs are also free from the burdens associated with the performance metric of share price and accompanying analyst ratings, quarterly earnings pressure, issuing and hitting earnings guidance metrics, and other efforts aimed at managing investor expectations. Rather than overthink how a plausible investment might impact the next quarter’s earnings and, by extension, the value of compensation that is so highly driven by stock options and grants in public firms, private-firm CEOs are free to make decisions based on the likelihood of success no matter the time horizon. This lack of constraint provides for the possibility of an enhanced CEO effect in private firms.
Perhaps the most salient difference between public and private firms is the level of regulation and oversight faced by each. In exchange for access to the capital available in publicly traded markets, public companies must comply with more regulation, especially in terms of public financial disclosures, board composition, structure, and oversight, than do private firms. Boards of publicly traded firms are obligated to monitor the actions of their firms and generally must approve major strategic initiatives (Zahra and Pearce, 1989). While private firms often have boards as well, there is less mandated oversight. This has the potential to dampen, or at least slow, strategic changes desired by a publicly traded firm’s CEO. Thus, this flexibility may drive up the CEO effect in private firms while differences in regulation and oversight may inhibit the CEO effect in public firms.
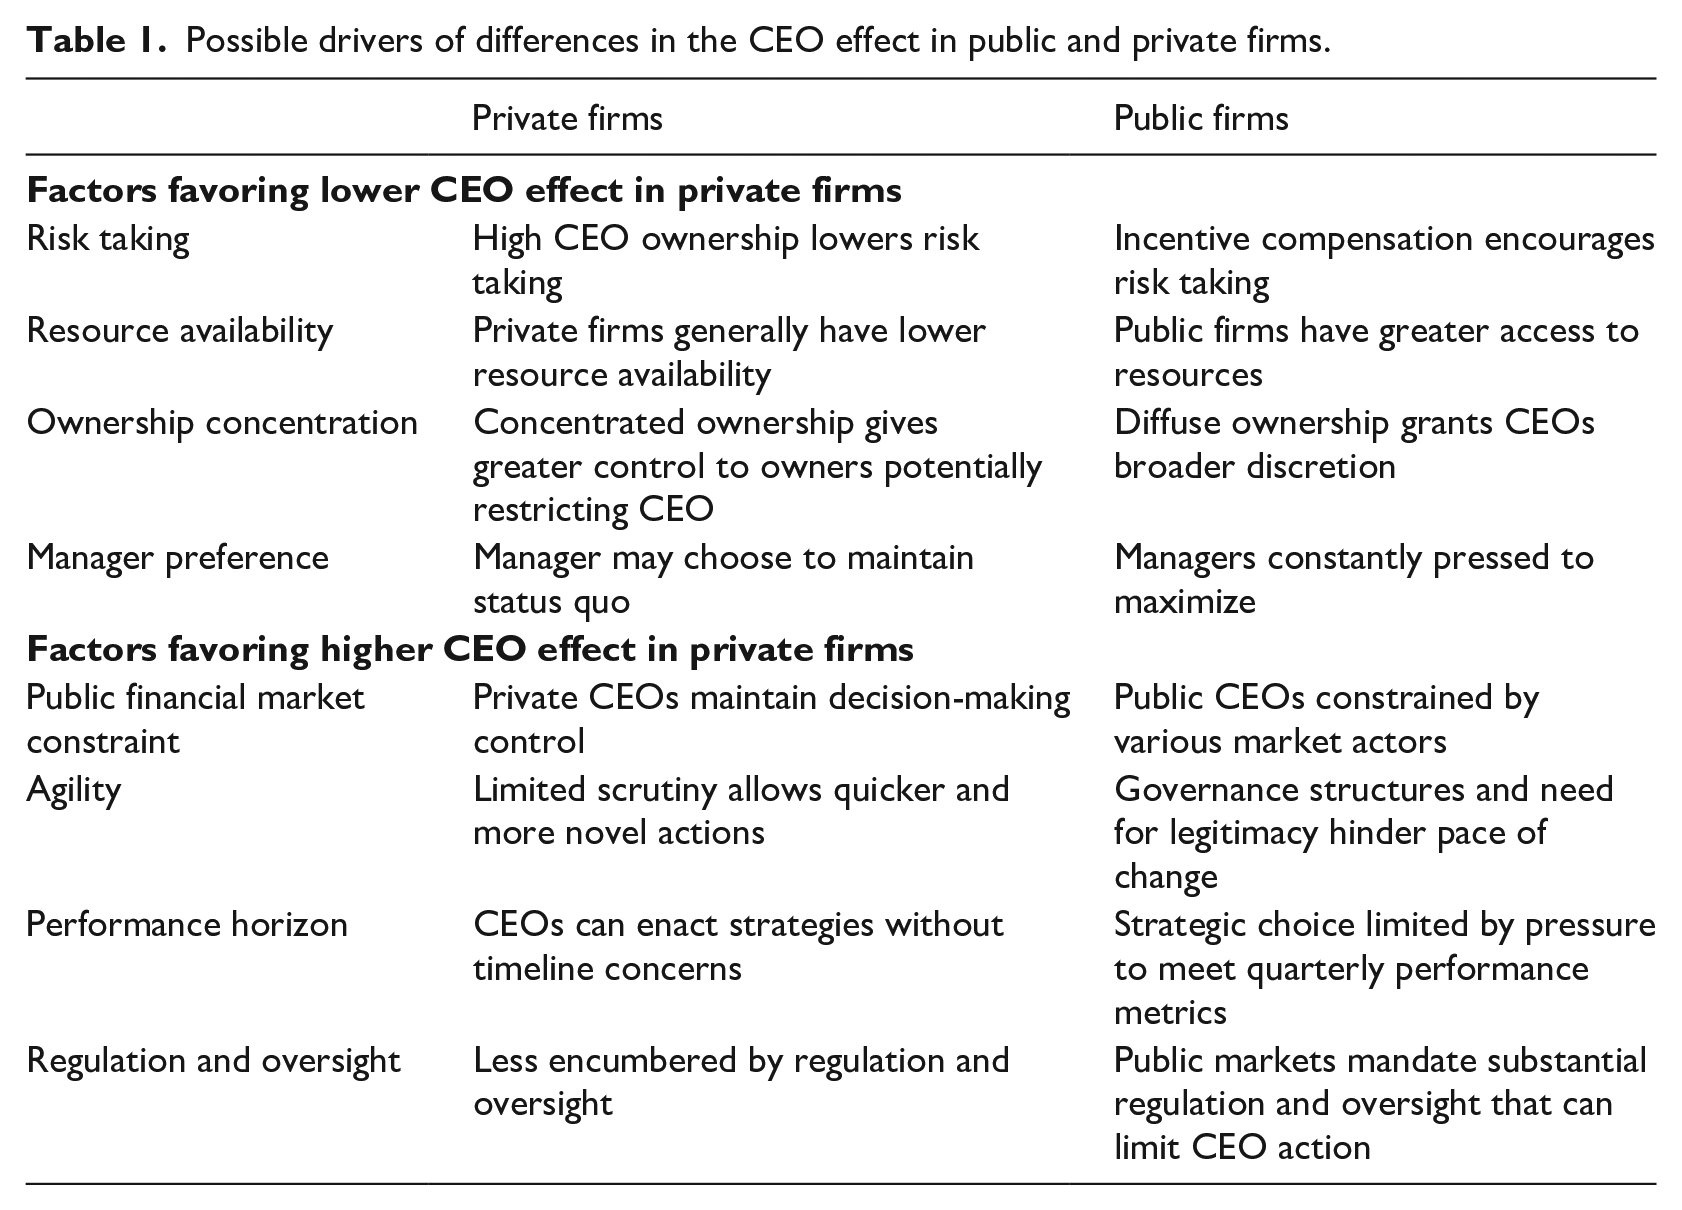
In short, we argue that the CEO effect in private firms may be larger or smaller than in publicly traded firms. Alternatively, if the forces discussed above neutralize each other, there may be no difference in the CEO effect at all, especially after controlling for factors such a firm size, industry, and relative performance. However, before turning to the empirical tests, it is important to note that our hypotheses are not meant to imply a causal relationship between ownership structure (publicly traded vs private) and the potential for CEO impact. Ownership forms, however, may be related to the existence of a number of important factors, discussed above, which might collectively change the nature of the CEO effect. The possible forces we outlined above are summarized in Table 1.
Possible drivers of differences in the CEO effect in public and private firms.
Furthermore, one must recall that the CEO effect grows in relation to the frequency and magnitude of performance outcomes across CEO tenures that deviate, positively or negatively, from expectations. We can readily point to examples of both publicly traded and privately held firms where individual CEOs held substantial sway over outcomes. For example, CEOs like Satya Nadella of Microsoft and Jack Welch of GE shepherded their publicly traded firms through radical change that transformed their firms and, in some ways, their respective industries as well. Among private firms, a notable founder CEO like Michael Bloomberg spearheaded an innovative business that continues to define the industry while others like Maureen Chiquet (Chanel) substantially reshaped and grew the luxury brand globally even in the face of becoming CEO just before the financial crisis of 2008. CEOs can be distinctive by delivering consistently negative outcomes as well. More pointedly, because the underlying models are all based on differences in group means, it is an empirical certainty that these studies place one-half of the weight of performance outcomes above and the other half below the mathematically calculated expectations established by contextual conditions. That is, mathematically speaking, one-half of CEOs will underperform expectations and the other half will exceed them (with many, of course, essentially falling just slightly one side or the other of expectations). Recognizing this, we can also point to a number of infamous executives, public and private, who oversaw distinctively poor performance and monumental destruction in firm value. In short, the distinctive performances needed to generate large CEO effects are possible in both public and private firms and they come from both positive and negative outcomes.
Methods
Sample
Information about private firm performance is not publicly available in most countries. In addition, secondary databases that provide information on private firms collect data through surveys (such as Dunn and Bradstreet). Since there are no uniform financial reporting requirements guiding which information private firms must reveal, any available data are limited and subject to error or omission. In Sweden, however, both public and private firms are required to report financial information to the government through Statistics Sweden for tax purposes. These official statistics, certified by accountants and reported to the government, are considered to be highly accurate and reliable. As such, they have been used in a number of prior studies (e.g. Bradley et al., 2011; Neffke and Henning, 2013). While the general approach to gathering the data is quite similar for both private and public firms and yields comparable high-level operational and profitability data (profits, number of employees, etc.), some data are only relevant for public firms (such as market value of equity).
To enable our comparison, we generated public and private samples by combining two longitudinal Swedish databases—registerbaserad arbetsmarknadsstatistik (RAMS) and longitudinell integrationsdatabas för sjukförsäkringsoch arbetsmarknadsstudier (LISA). RAMS provides yearly financial data (currently from 1997 to 2013) on all firms registered in Sweden while LISA provides yearly data on all Swedish inhabitants including employment information, allowing us to identify the CEO of each firm. While these datasets are publicly available (for a fee), data are anonymous at the firm level. Thus, we engaged with Statistics Sweden, at significant financial cost, to assist with the merging of these data sources while maintaining anonymity. The resulting dataset included performance metrics, descriptive information about each company (industry, size, etc.) and the anonymous identification codes representing CEOs and firms used in subsequent models to quantify the CEO effect in both public and private firms.
We applied several filters to the database to form our samples. Following prior CEO effects studies (Fitza, 2014; Mackey, 2008), we deleted financial and governmental institutions as well as unclassified industries. To allow examination of CEO effects, which requires multiple CEOs per firm, firms with just a single CEO during the period of observation were removed (Quigley and Graffin, 2017). To reasonably capture industry conditions, we included all two-digit Swedish Standard Industrial Classification (SNI) industries that had a minimum of four firms per year for at least 10 consecutive years (Quigley and Hambrick, 2015).
To ensure our results were not an artifact of differences in firm size between the samples, we limited the private firm sample to the largest companies. Specifically, we categorized RAMS data using the Organization for Economic Cooperation and Development’s firm size classification (OECD, 2005). Firms considered “small and medium sized enterprises” (SMEs), defined as those with less than 250 employees, were eliminated while those labeled “large enterprises,” or more than 250 employees, were retained. Our private-firm sample includes 1501 firms and 18,118 firm-years resulting in an average of 12.1, years per firm. The public firm sample includes 178 firms and 2,177 firm-years resulting in an average of 12.2 years per firm. While our samples do not allow for direct comparisons to the many prior studies using US public firm samples, our results based on Swedish firms are likely representative of what might be observed in other modern economies. First, Sweden’s market economy and private firm demography share many similarities with other western European and Anglo-American contexts. Sweden’s overall economic environment is quite favorable to business and features robust public and private equity investment resulting in publicly traded and privately held firms that are globally competitive. The World Economic Forum’s (2016) Global Competitiveness Index ranks Sweden in the top 10 (e.g. the United States is third, Sweden is ninth, and the United Kingdom is tenth) and Sweden has comparable ratings with the United States across most metrics including innovation and per-capita gross domestic product. Second, Crossland and Hambrick (2011) found the United States to have the highest discretion (among the 15 nations they studied) while Sweden ranked sixth and was characterized as having “moderate discretion” (p. 815). Assuming Sweden’s slightly lower discretion inhibits the impact of CEOs uniformly across public and private firms, we would expect a lower CEO effects in both groups and less pronounced differences between then as well. As such, our comparisons likely represent a conservative test versus what might be found in higher discretion settings.
Variables
Consistent with prior studies on CEO effects (Crossland and Hambrick, 2011; Mackey, 2008; Quigley and Hambrick, 2015), we used ROA (net income divided by total assets; ROA) as the dependent variable for our primary analysis. We also report results for three additional performance measures as the dependent variable: return on equity (ROE; net income divided by total equity),Altman’s Z-score, and earnings before interest and taxes (EBIT). Because outliers can have an undue influence on our results, we winsorized the dependent variables at the 1st and 99th percentile (Dixon and Yuen, 1974; Fitza, 2014). Our independent variables include categorical variables for calendar year (for period effects), industry (two-digit SNI code), firm, and CEO (using the unique identifier from the LISA database).
Analytical approach
Following recent studies on the CEO effect (Crossland and Hambrick, 2011; Quigley and Hambrick, 2015), we calculated effect sizes using multi-level modeling (MLM), which accounts for the nested data structure of CEOs observed over time within firms and firms within industries. Two separate models are used to calculate the proportion of variance attributable to general economic trends (calendar year), industry effects, firm effects, and CEOs. The first, or unconditional model (Quigley and Graffin, 2017) includes three levels with yearly CEO performance nested within firms and firms nested within industries. The second model adds calendar year effects. Effect sizes are calculated by dividing the variances explained by each level in model 2 by the total variance explained in the first or unconditional model. The variance explained by the addition of year dummies to the second model makes up the year effect. We used the command mixed in Stata 14, for the MLM analyses (see Quigley and Graffin, 2017, for an overview of the method).
Results
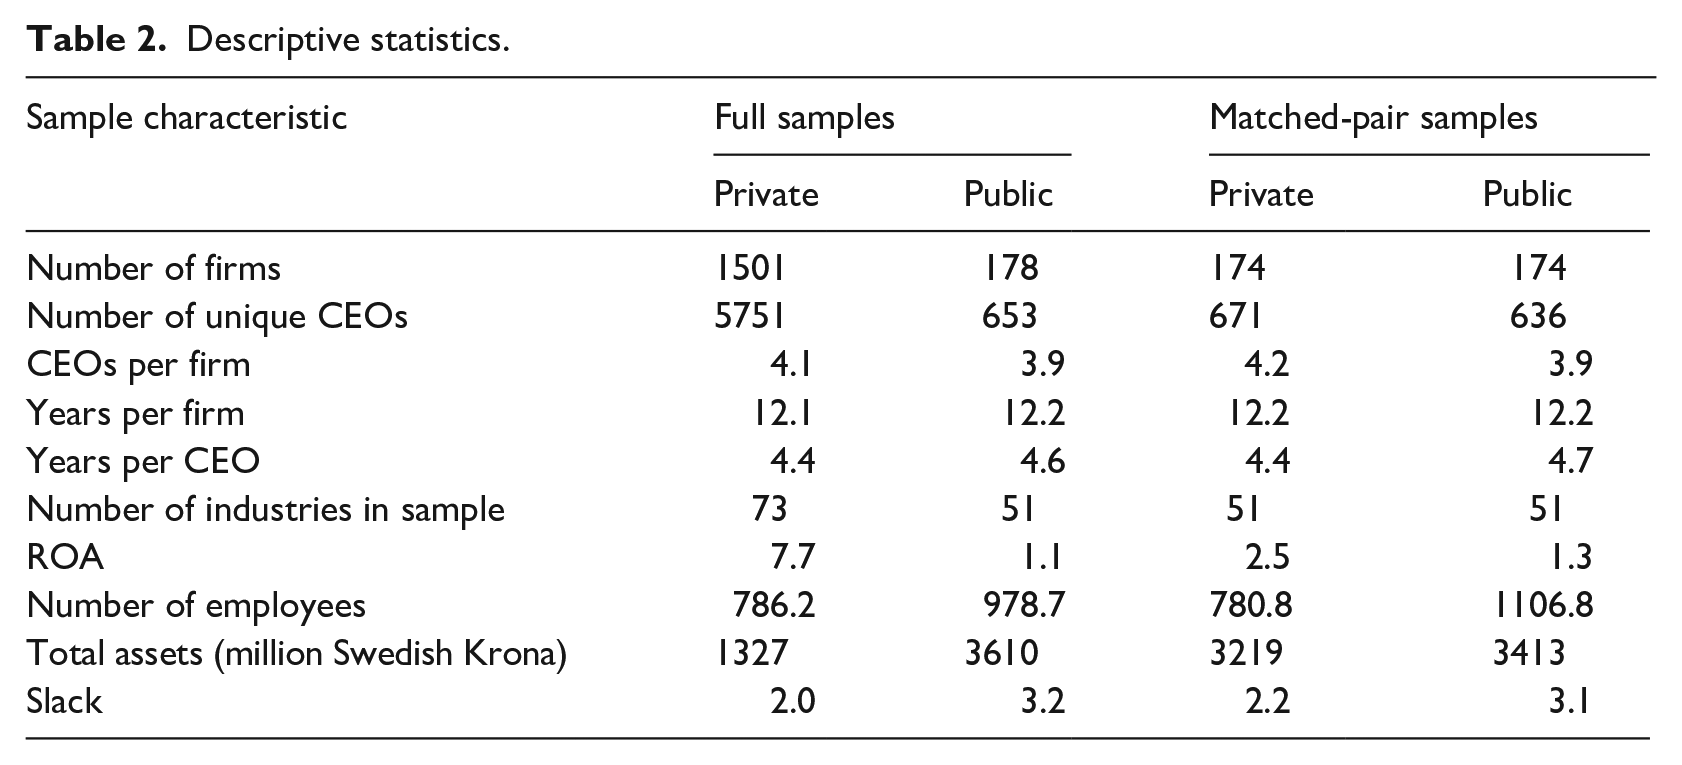
The first two columns of Table 2 provide descriptive statistics for our primary private and public firm samples. Of note, while the private firm sample contains a larger number of firms and firm-years, the samples have a similar number of industries. Most important, however, is the number of CEOs per firm and, by extension, the number of years observed for each CEO. Large differences in these metrics could unduly influence the CEO effect (Fitza, 2014). In both the private and public firm samples, we observed, on average, approximately four CEOs per firm and each CEO was observed for approximately 4.5 years. The samples are somewhat different, however, in terms of ROA and firm size. We address these differences below in a supplemental analysis.
Descriptive statistics.
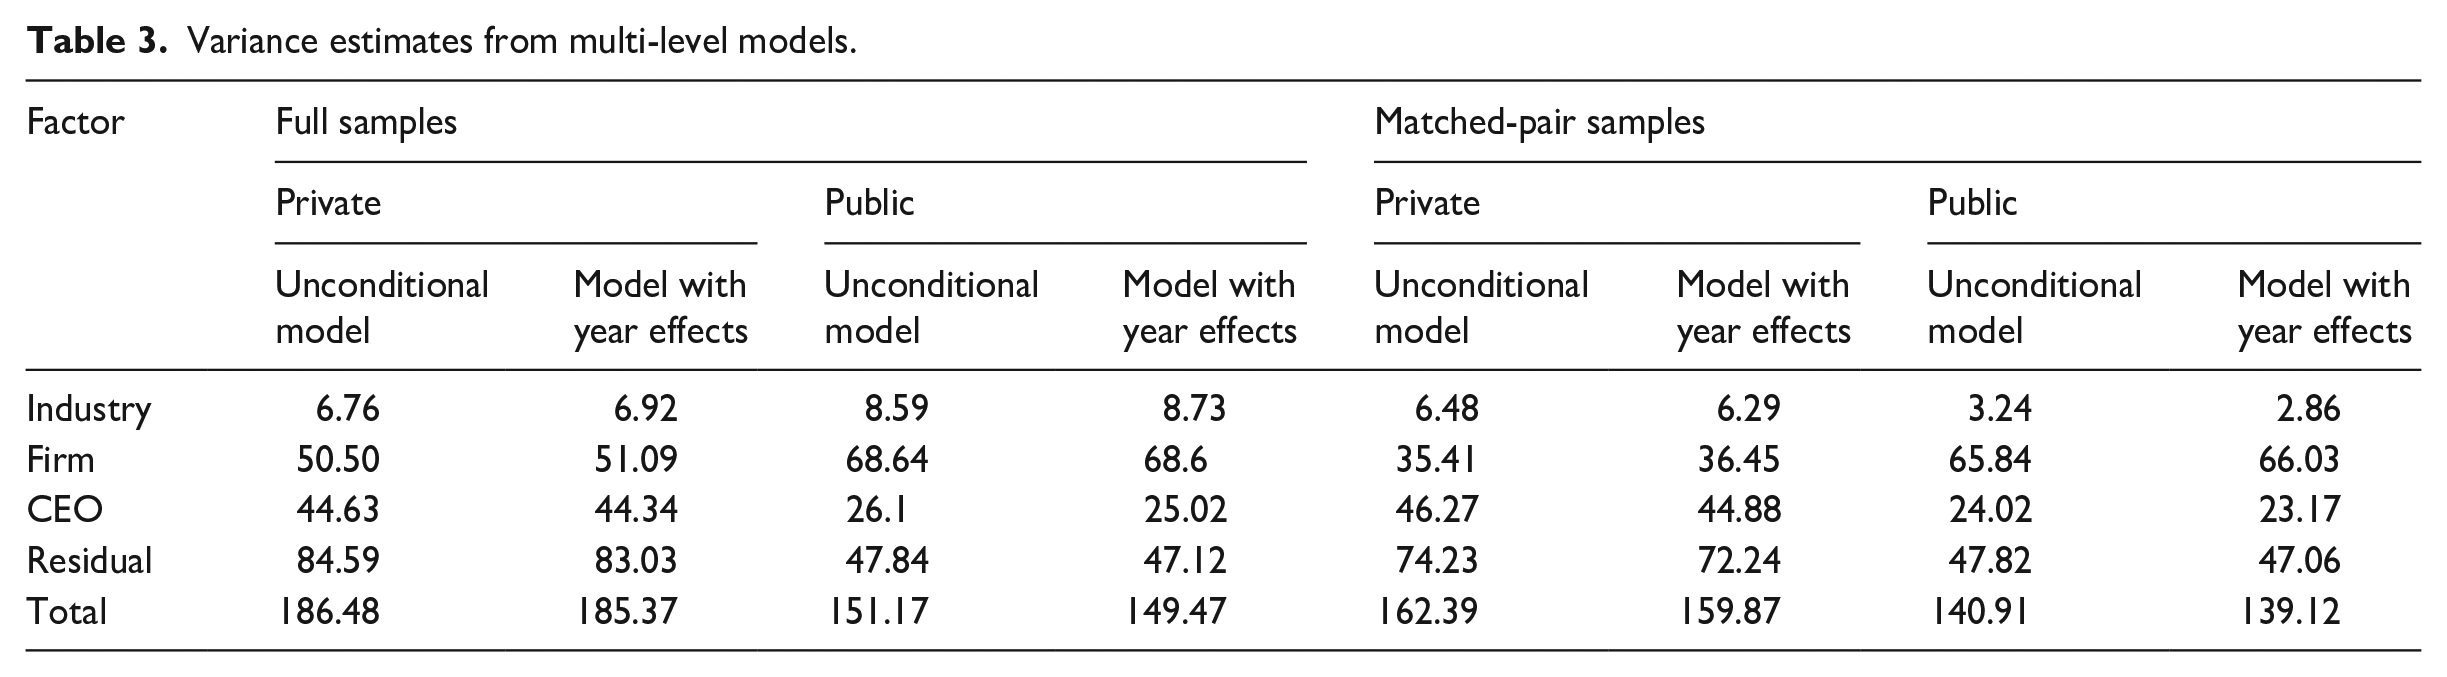
The left half of Table 3 provides the MLM variance estimates for our primary models while the left half of Table 4 reports the proportion of variance explained by each level in these models. In privately held firms, the CEO effect on ROA was 23.8% while in our publicly traded sample, it was 16.6%. Comparing these effect sizes with a Fisher’s z-test (Quigley and Hambrick, 2015) shows the difference is highly significant (p < 0.001). In the left side of Table 5, we report our additional analyses for our full sample using the three alternative dependent variables (ROE, Altman’s Z, and EBIT). In each case, the results are consistent with our primary findings.
Variance estimates from multi-level models.
Proportion of variance in ROA.Explained by level—full and matched-pair samples.
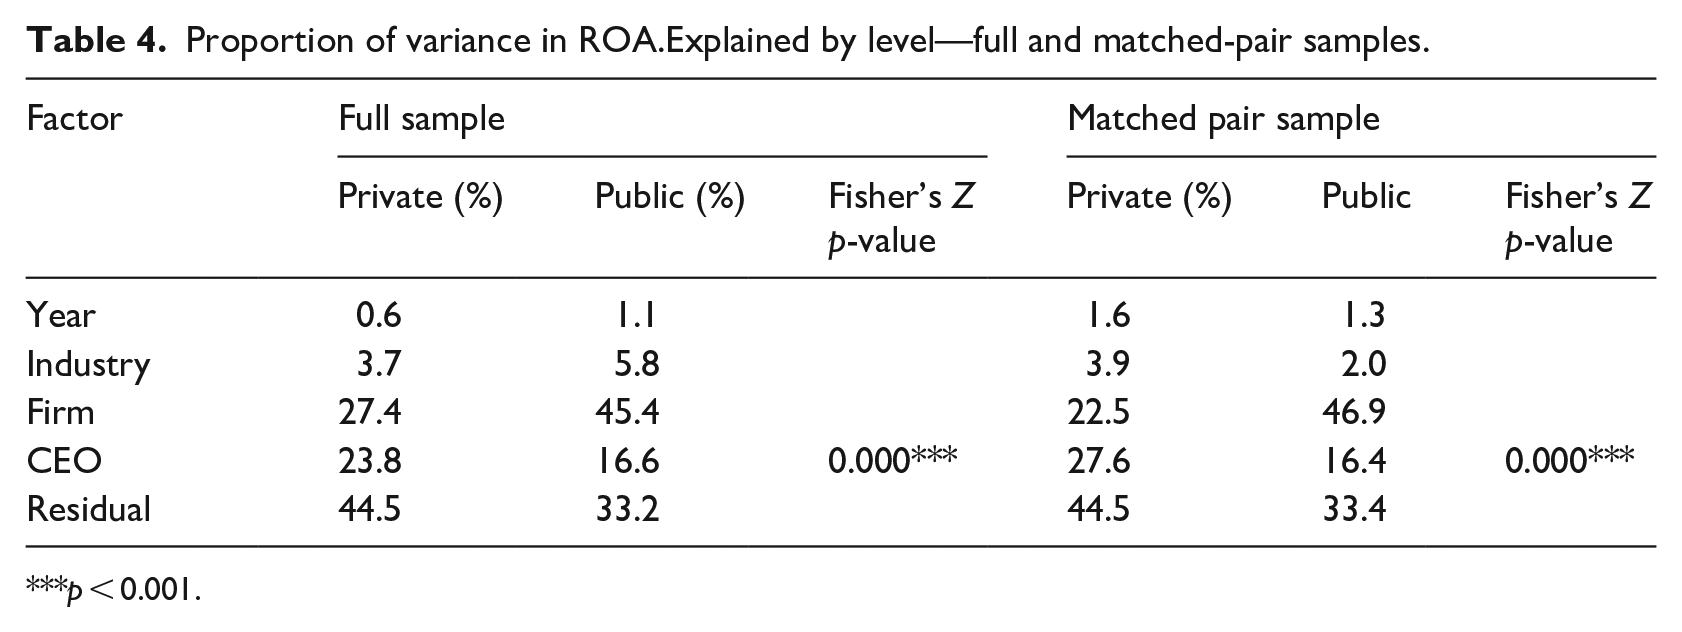
p < 0.001.
Proportion of variance in alternative performance measures.Explained by private and public CEOs.
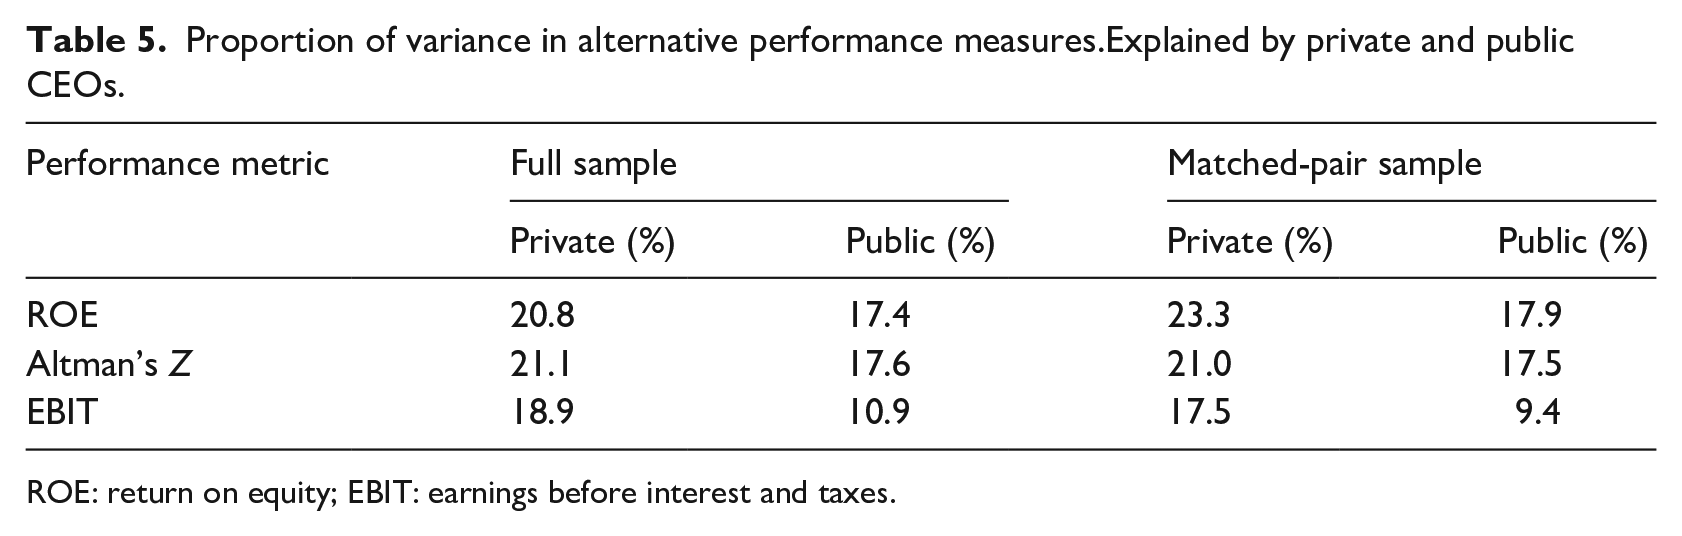
ROE: return on equity; EBIT: earnings before interest and taxes.
Earlier we made the case that, economically, Sweden was at least proximally similar to the United States and that CEOs of Swedish firms had moderate levels of managerial discretion (Crossland and Hambrick, 2011). Although direct comparisons of the CEO effect need to be made with caution, since this is a replication study it is still instructive to position these results within the broader CEO effects literature. As we noted above, the majority of studies have used American samples of generally large public companies. Lieberson and O’Conner’s (1972) initial work, using sequential ANOVA and a sample from 1946 to 1965, found a CEO effect of 14.5% (on ROS). Quigley and Hambrick (2015) studied the CEO affect across 60 years using both sequential ANOVA and MLM. Using MLM, they found that the CEO effect (on ROA) rose from 13.8% in the earliest period (1950–1969) to 22.9% in the latest period (1990–2009). Additional studies of contemporary samples found outcomes in similar ranges (Crossland and Hambrick, 2011; Mackey, 2008; Quigley and Graffin, 2017). Thus, the effect sizes we find here are quite comparable.
Also notable is the comparison of our findings to those of the only other CEO effects study we know of to use Swedish firms. In that study, Crossland and Hambrick (2011) found a CEO effect on ROA of 9.88% in a sample of publicly traded Swedish firms. This study focused on a comparison of the CEO effect across national settings and, importantly, used only firms from the Forbes Global 2000 list of the world’s largest companies. In such a setting of large firms, it is not surprising that they found a smaller overall CEO effect size. Notably, the final sample in that study included just 25 Swedish firms and 10 years of data. By comparison, our public firm sample comprised 178 companies, spanned 17 years, and included the large firms studied by Crossland and Hambrick as well as smaller (yet still considerably sized) public and private firms.
While these results provide strong evidence of a larger CEO effect in privately held firms, it may be that differences in firm size, firm profitability, or industries represented in the underlying samples drove these results. To address this, we also compared public and private firms using a matched-pair sample.
As shown in the first two columns of Table 2, while the public and private firms in our sample had roughly the same number of CEOs during our sample frame (about 4) and while these CEOs served about the same number of years (about 4.5), there were substantial differences in terms of company size and performance (ROA). To ensure these differences were not driving the results we reported above, we also developed a matched-pair sample that strove to minimize these differences. In particular, we used “Coarsened Exact Matching” (CEM) to improve the balance between the private and public firms (Blackwell et al., 2009; Iacus et al., 2012).
Research suggests that CEM has several advantages over other techniques that match on observables, such as propensity score matching. Specifically, CEM requires fewer post-estimation assumptions about how a match is defined by connecting observations across a number of dimensions simultaneously (Iacus et al., 2012). CEM is a monotonic, imbalance-reducing matching method that reduces estimation error, model dependence, selection bias, and inefficiency (De Figueiredo et al., 2013; Feldman et al., 2016; Heckman and Navarro-Lozano, 2004).
We specified a “k2k” match that produced samples of equal size. We matched on industry (2-digit SNI), average firm ROA, and average total assets (with the firm averages calculated across the entire sample timeframe). 2 The matching yielded a sample of 174 private and 174 public firms. Columns 3 and 4 of Table 2 provide descriptive statistics for the matched-pair samples. Although in CEM, “[t]reatment and control observations are . . . matched exactly within each bin, which eliminates the need to compare the means of the treatment and control groups after matching” (De Figueiredo et al., 2013: 856), a mean comparison test confirmed that the matching effectively selected strong controls for the cases.
The right half of Table 3 provides variance estimates for the match-pair sample models while the right half of Table 4 provides results. While the CEO effect in public firms remained essentially unchanged at 16.4% (vs 16.6% in the full public sample), the CEO effect in the matched-pair private sample increased to 27.6% (from 23.8% in the full private sample). The pattern of higher effects in private firms are consistently repeated with our alternative measures (ROE, Altman’s Z score, and EBIT), in both the full and matched-pair samples, as shown in Table 5. These results affirm our earlier findings that the CEO effect in private firms is likely larger than in publicly traded firms. Finally, as a further robustness test to ensure size was not driving our results, we repeated our analysis from the full samples by splitting each at the median of number of employees and firm assets. These results were consistent with our main analyses (employees high: private firms, 23.9%; public firms, 14.3%. Employees low: private firms, 24.1%; public firms, 18.9%. Assets high: private firms, 23.5%; public firms, 20.6%. Assets low: private firms, 24.2%; public firms, 11.8%).
Additional analysis
Comparison of CEO fixed effects
One limitation of our analysis above is that the CEO effects for public and private firms must be estimated using different models. What this means is that the “contextual conditions” of industry and calendar year (essentially grand means of each variable within each model), which help define the performance “expectations” or baseline for each CEO, are different across the samples. In very simple terms, the average performance for the industry and for a calendar year for all the firms in the sample may be different in public versus private firms. In practice, however, the public and private firms in our sample often compete directly against one and other thus, the baseline expectations should be the same as well. By extension, it could be that our results are driven by the fact that public and private CEOs are compared with these differing baselines.
To address this concern, we pooled the two samples together and repeated our analysis, effectively calculating the CEO effect on the combined sample. Unsurprisingly, the resulting CEO effect—at 22.9%—was between what we find in the independently analyzed private and public samples. After estimating variance decomposition models, we can extract a coefficient for each of the CEOs represented in the sample (Hambrick and Quigley, 2014). Prior work has used similar coefficients as an indicator of a CEO’s “career performance” and, conceptually, the values represent the systematic “amount by which a given CEO over- or under-performed expectations across his or her tenure” (Quigley et al., 2020) with expectations being established by the contextual conditions represented by year, industry, and firm factor variables in the models. Specifically, each coefficient represents the number of ROA percentage points by which a given CEO over- or under-performed expectations.
Following the estimation of this model using a combined public and private sample, we extracted the CEO coefficient for each CEO. We then graphed these coefficients, grouped by public and private firms, in the histogram shown in Figure 1. Notably, even in this combined analysis, the average private-firm CEO outperformed their public firm counterparts as evidenced by the slight right skew of private CEO coefficients versus the slight left skew of the public firm CEOs. Specifically, the average private-firm CEO coefficient was 0.44 while the average public firm coefficient was −0.99 (t = 14.60; p < 0.000). 3 Furthermore, the larger overall CEO effect in private-firm CEOs can be seen as represented by the fact that private CEOs are spread across a wider range (shorter and wider distribution), while a majority of public CEOs delivered performance within just a few ROA percentage points of expectations (taller and narrower distribution). To further emphasize this point, 62% of public firm CEOs had coefficients between −2 and 2 while 52% of private CEOs performed at that level across their tenure. In contrast, just 15% of public firm CEOs had coefficients larger in magnitude than +/- 4, while 25% of private-firm CEOs performed at those levels. In short, this graphic provides a visual representation of how the CEO effect differs in public and private firms and also documents a modest performance advantage for private-firm CEOs.
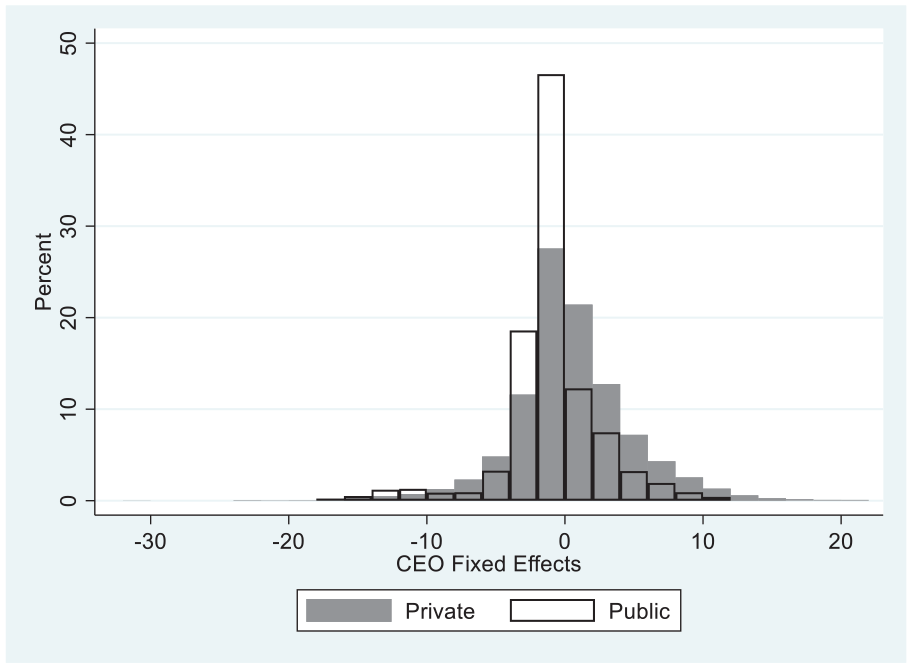
Distribution of CEO coefficients.
Explaining differences in CEO effect in private versus public firms
While the results comparing the CEO effect in public versus private firms are compelling, a significant unanswered question remains with regard to why these differences occur. While we offered some theoretical arguments above, a key limitation of variance decompositions of the sort we performed here is that those analyses do not provide insights into the reasons why private-firm CEOs are associated with more variance in firm performance than their public firm counterparts. As we discussed earlier, it may be that private-firm CEOs, unfettered by regulation of public equity markets, quarterly earnings targets, and pressures for conformity simply have greater latitude to pursue and implement unique strategies. On the contrary, the outcomes we see here could simply be the result of a greater variance in CEO ability present in private firms. While fully unpacking these issues is beyond the scope of this work and would be quite difficult given data limitations, especially for private firms, we performed several supplemental analyses to explore what might be driving the larger CEO effect in private firms.
Some initial clues can be gained from the descriptive statistics shown in Table 2. Notably, our full samples of public firms are somewhat larger in terms of total employees and total assets. Each of these is a potential driver of inertia (DiMaggio and Powell, 1983) which reduces managerial discretion (Hambrick and Finkelstein, 1987) and limits the potential for CEO impact. Notably, when we used a matched-pair design to reduce these variations, differences in the CEO effect remained. Thus, other factors are likely important drivers of the differences in CEO effect as well.
Above we speculated that private-firm CEOs might face limited scrutiny, have less pressure to conform to industry norms, and might be more agile in positioning their firms into unique positions in an industry. Since we found that private-firm CEOs have a greater CEO effect, perhaps these factors result in higher levels of risk taking in private firms, even though public firm CEOs are often incentivized, via stock options and grants, to enhance their own risk taking. We also speculated that private firms faced resource constraints that could limit the reach of CEOs and drive down the CEO effect. Perhaps this may be true for the average private firm, including very small firms, but not the larger ones included in our study. If so, that lack of constraint might offer some speculative explanations for our findings. Although our data options are limited by what is available through Statistics Sweden, we assessed these ideas by calculating slack (current assets divided by current liabilities), leverage (debt divided by equity), and strategic risk (factor-analyzing intangibles, capital expenditures, and long-term debt; Devers et al., 2008; Martin et al., 2013). We then used t-tests to compare the mean values between groups. Private firms had less slack (private firms, 2.0; public firms, 3.2; p < 0.000) and higher leverage (private firms, 3.2; public firms, 1.2; p < 0.000), both of which would likely limit options and impose constraints on a CEO’s reach. Surprisingly, private firms also exhibited lower levels of strategic risk: 9.4 for private firms versus 10.5 for public firms, p < 0.000.
In summary, public firms face inertial forces that can limit the CEO effect. At the same time, private-firm CEOs face limited resources, high leverage, and exhibit lower levels of risk which could also potentially limit the CEO effect. Despite this, private-firm CEOs are associated with more variance in performance outcomes while achieving slightly better performance. Thus, it appears that private-firm CEOs exert their effect, for good or for ill, through more nuanced aspects of strategic decision-making (Child, 1972, 1997). Perhaps, the constraints private firms face force them to be more creative, allowing prudent, lower risk strategies oriented toward long-term results. Uncovering exactly how this occurs is a ripe avenue for future research efforts.
Discussion
We sought to replicate prior studies in order to compare the CEO effect in privately held and publicly traded firms. Replication is key “to provide additional evidence that helps to build a cumulative body of knowledge in strategic management” (Ethiraj et al., 2016: 2191) and avoid “scientific knowledge . . . facing a credibility crisis” (Bergh et al., 2017). Using a unique dataset of public and private firms in Sweden, our results show that CEOs explain 7.2 percentage points more of the variance in firm performance in privately held firms than in publicly traded firms. Furthermore, after matching for industry, firm profitability, and size, this difference grows to 11.2 percentage points. Overall, CEOs of privately held firms explain between 43.7% and 68.1% more variance in firm performance than do their counterparts in publicly traded firms.
In reviewing our results, one additional contrast stands out. In the full and matched-pair samples, the firm effect was nearly twice as large in public firms (e.g. firm effect of 46.9% in public firms vs 22.5% in private firms in the matched-pair sample). While one might be tempted to attribute a larger firm effect to inertial factors, such as firm size, our matched-pair result largely eliminates this explanation. Instead, it appears private-firm CEOs have more latitude to impart their unique imprint on the firms they lead than do the CEOs of publicly traded firms.
To put our findings in perspective, the differences in magnitude of both CEO and firm effects observed in public and private firms are similar to those observed between the earliest (1950–1969) and latest (1990–2009) periods of Quigley and Hambrick’s (2015) 60-year study of US public firms. That is, in our study, the CEO effect was shown to be about 10 percentage points larger in private firms versus public firms while the firm effect declined by about half. Quigley and Hambrick demonstrated similar shifts in public US firms between 1950 and 2009 and argued that this was due to substantial shifts in the nature of the US economy and the role of CEOs between 1950 and 2009. That we see similar shifts in the effect of CEOs in public versus private firms—even those in similar industries and sized firms—suggests there are substantial differences in the way CEOs operate in these two environments.
Our findings make several important contributions which also serve to open up pathways for future research. Primarily, we contribute to the stream of research on CEO effects (Crossland and Hambrick, 2011; Fitza, 2014; Lieberson and O’Connor, 1972; Mackey, 2008; Quigley and Hambrick, 2015) by showing that the CEO effect is larger in private firms than in publicly traded firms. Early CEO effects studies typically engaged in the debate between population ecologists, institutional theorists, and scholars from the strategic choice perspective and were concerned with if CEOs mattered at all to firm outcomes. Building on Hambrick and Finkelstein’s (1987) conception of managerial discretion—or the idea that the potential for leader influence varies depending on contextual, firm-level, and within-person factors—more recent debates have focused on how much CEOs matter. Adding to prior research showing differences in the CEO effect across national setting (Crossland and Chen, 2013; Crossland and Hambrick, 2007, 2011) and over large periods of time (Quigley and Hambrick, 2015), our results show there are important differences between CEOs in publicly traded and privately held firms as well. Future studies, however, are needed to determine if these findings generalize to other national contexts. Specifically, given that Sweden and its economy is comparable to most other developed countries, it would be interesting to explore whether similar results would be found in developing countries such as in Latin America or in countries with different substantially different cultures or economic systems. For example, Crossland and Hambrick (2011), found that countries with low discretion, often related to norms centered on collectivism, lower tolerance for uncertainty, high ownership concentration, and less employment flexibility also had a lower CEO effect. With a lower overall CEO effect, countries from their study, like South Korea and Japan, may not see differences between public and private firms. Furthermore, countries with substantial government involvement in both public and private business, as in China, may see smaller differences as well. As scholars work to understand why the CEO effect is higher in private firms, some clues may be gained by exploring the boundary conditions of these relationships in other countries.
Next, our findings offer a new view on a number of related research areas such as CEO compensation and succession. Perhaps the most important tasks of a board are the hiring of a new CEO and implementation of compensation structures to properly incentivize and motivate them to produce superior performance (Monks and Minow, 2011). In a recent literature review, Hoskisson et al. (2017: 137) explained that “agency theory assumes that top managers should be compensated or monitored to achieve better outcomes” given that they may experience conflict with shareholders regarding risk preferences. While we find a larger CEO effect in private companies, their public firm counterparts, in the United States at least, are compensated much more handsomely, even after accounting for firm size (Chief Executive Group, 2014). Furthermore, in our sample, it appears that private CEOs may, in fact, outperform, public firm CEOs (e.g. Table 2 and Figure 1) while taking on less risk. This is seemingly in conflict with prior research showing that that CEOs in higher discretion settings, which typically equates to a higher CEO effect, generally receive higher compensation (Finkelstein and Boyd, 1998), and the idea of pay for performance. It may be that pay mix is the reason for these results. That is, public firm CEOs may be paid more but with large portions of that pay contingent on performance, while private-firm CEOs receive more guaranteed pay. This exact scenario would help explain why risk taking is lower in the private setting. It may also be that public firm CEOs are paid more handsomely for prestigious affiliations, status, or other indicators of legitimacy (Higgins and Gulati, 2003; Khurana, 2002) in ways that private-firm CEOs are not. In each of these cases, however, the stronger performance of private firms remains a considerable puzzle. While gaining access to compensation data for private firms may prove difficult, understanding how total pay and pay mix differs across these settings is a promising research direction that could further illuminate the results we present here while providing important insights to the compensation literature as well.
Our study highlights the importance of considering how findings may change based on the governance type of the underlying sample. From a practical perspective, a large majority of firms worldwide are private (Durand and Vargas, 2003; La Porta et al., 1999) and their strategic profiles and actions are likely to differ from those of public firms (Durand and Vargas, 2003; Trostel and Nichols, 1982). For instance, compared with public firms, private firms are known to have both economic and non-economic goals (Gómez-Mejía et al., 2007) such that the CEO role is made more prominent in an effort to achieve both goals in tandem. Numerous streams of research in strategic management focus almost entirely on large, publicly traded firms (Bebchuk and Fried, 2009) and reported results frequently come with obligatory “limitations” highlighting the open question of if and how findings might generalize to smaller or privately held firms. While data availability remains a challenge, our results emphasize the need for greater consideration of privately held firms in future research of all kinds. More pointedly, if the CEOs’ ability to affect firm outcomes differs broadly by governance type, then there are likely to be additional differences in areas, such as compensation, succession, strategic decision-making, and the upper echelons links between demographic factors and firm outcomes. For example, managerial characteristics, such as personality traits, functional background, prior experience, tenure, or education (Finkelstein et al., 2009) may be associated with a greater (or smaller) CEO effect in private firms. Furthermore, CEO ownership, CEO duality, status characteristics, or social capital may be associated with a higher or lower proportion of variance in organizational performance. In addition, although we performed some supplemental analyses in an attempt to explain differences in CEO effect in private versus public firms, future research might be able to more clearly isolate the specific mechanisms driving our results. These and many other areas of strategic management research, then, would benefit from greater consideration of samples using private firms.
Finally, perhaps the most interesting finding from our work, which offers important implications for practice is the idea that both the CEO effect and ROA are higher in private firms while, at the same time, risk taking and slack are lower. This is counter to what one would expect from prior work and theory related to the CEO effect and managerial discretion (Finkelstein et al., 2009). One particularly novel possibility is that private-firm CEOs, out of necessity, are simply more creative, learn how to “do more with less” and perhaps apply the concepts of bricolage (Baker and Nelson, 2005) to their daily task of managing their firms without timeline concerns. So much of strategic management research is heavily focused on public firms because of data availability. The implication of this is that knowledge of best practices generally flows from findings obtained from these large public firms toward smaller and private firms. If, as our findings suggest, private-firm CEOs are related to a higher CEO effect and modestly better performance along with lower risk and less resource availability, perhaps public firms would benefit from greater research in private contexts. It may be that public firms can benefit from knowledge flowing from private firms especially if this work offers both important insights on how CEO’s actions affect performance when resources are constrained.
Conclusion
We started by posing a simple question—are there differences in the CEO effect in public and private firms and, if so, which is larger? We first outlined a number of possible factors that might favor a larger effect in one group versus the other and then set out to estimate the CEO effect in the two settings. We found that CEOs in private firms are associated with a higher CEO effect—that is, they explain more variance in the various firm performance outcomes we measured, and these differences remain when we used a matched-pair design. In supplemental analyses it appears private firms do this with fewer resources and while taking on less, rather than more, risk than their public firm counterparts. This study highlights the importance of replicating prior research in alternative settings, points toward some compelling new research angles related to how and why this occurs and suggests there may be tremendous learning opportunities by focusing the research lens on private firms.
Footnotes
Acknowledgements
The authors would like to thank Don Hambrick and Scott Graffin for their helpful comments on earlier versions of this manuscript.
Funding
The author(s) received no financial support for the research, authorship, and/or publication of this article.