
Abstract
This study investigates the effect of vibration-induced loose connections on signal reflection (S11) for loose connection identification in aerospace coaxial cables using distributed sensing approach, which is effective in filtering the noise and identifying minor discontinuities. In this approach, a sliding gated window is applied to S11 signal, a fast Fourier transform is performed over the gated windows, cross-correlation is computed between the baseline and vibration-affected signals, and the standard deviation is mapped along the cable length. Sinewave signals from 9 kHz to 5 GHz were swept through cables with vibrating connectors under three conditions: fully tightened, loosened by 180°, and 360°. Vibration tests were conducted at frequencies of 0–640 Hz and magnitudes of 0.5–4G. Results show that fully tightened cable connectors exhibit a rapid increase in response up to approximately 80 Hz, followed by a gradual rise until approximately 320 Hz and saturation beyond approximately 320 Hz. At 180° loosening, the response followed an exponential cosine trend with small fluctuations at low vibration frequencies. The 360° loosened connector showed contrasting behavior: distributed responses decreased significantly at higher vibration magnitudes (1–4G) due to resonance and combined effect of connector orientation, resonance, and gravitational effect which caused the loose connector to turn toward tightening, whereas at 0.5G, the response increased exponentially, with small fluctuations at lower frequencies up to 80 Hz, followed by a gradual exponential increase. These findings confirm that distributed vibration sensing effectively identifies connector loosening and can be used for predictive maintenance in any dynamic environment by identifying loose connection in advance of failure.
Keywords
Introduction
The rapid growth of modern infrastructure and transportation systems has significantly increased the demand for dependable electrical and communication wiring. In particular, the transition toward electric vehicles in the automotive industry and implementation of fly-by-wire systems in aerospace have heightened reliance on cable networks, where stable performance is essential for safety and operational reliability. Cables and transmission lines also form the backbone of national communication and power grid, where failures pose serious fire safety hazards. 1 A passive measurement method utilizing machine learning has been proposed for diagnosis of anomalies in two-wire cables. 2 However, transmission lines that operate in harsh dynamic environments are prone to intermittent and arc faults that lead to ignition of cable insulation, loss of communication, and catastrophic aeronautical accidents. 3 Intermittent or arc faults usually occur in the points of loose connections. It was revealed that transmission lines exposed to persistent vibrations gradually loosen electrical connectors. 4 Loose or poorly crimped connections are identified as one of the main causes of intermittent faults. 5 Studies have shown that ignition time of wire decreases as arc fault current increases in loose connections. 6 A poor connection can even melt the connector where the temperature in direct current connectors can reach 113°C that exceeds the allowed temperature limit of 102°C. 7 Ignition in the cables exposed to heat source initially shows no change in shape followed by PVC sheath decomposition, rapid swelling, shrinkage stage, and end stable stage with generation of cracks. 8 The effect of degradation and loose coaxial connector on signal integrity and electrical performance repeatability revealed significant random variation in contact impedance that demonstrated the potential for intermittent failures in high-frequency signal communication.9,10 Sequence time-domain reflectometry method-based reference signal elimination technique has been used to identify loose connector fault in power cables, where reference signal response without fault is removed from reflected signal response with fault. 11 This method has been applied to loosen connection identification in power cables; however, to the best of the authors’ knowledge, loose connections in radio frequency (RF) and aerospace transmission lines have not sufficiently been investigated.
In aerospace applications, wiring connector lock wires enhance the mechanical stability of connections. However, improper installation that deviates from maintenance manual specifications or physical damage can still result in loosening due to persistent vibration inherent in aircraft structures and systems. Despite established vibration-level regulations designed to ensure fault-free system operation, connector loosening remains a problem in aircraft wiring systems, leading to various faults.
According to interviews with avionics maintenance engineers, lock wires can break due to continuous exposure to vibration, subsequently causing connections to loosen over time. Loose connections in data transmission lines do not significantly affect low-frequency communication signals until complete failure occurs. These loose connections can lead to arc faults, intermittent faults, and even fire. Arc fault circuit interrupters are being developed to detect and prevent such faults,12,13 where the interrupters break the circuit when a short circuit or arc fault occurs in the system.
Extensive literature review and discussions with aircraft engineers have shown that loose connections in transmission lines are typically detected only after failure, and most researchers have focused on mitigating the effects of loose connections in such lines. Some time domain reflectometry techniques have been applied to identify loose connections in power transmission lines, but the identification of loose connections in data transmission lines has scarcely been addressed. Electromagnetic (EM) field simulation and measurement of a loose connection in RF transmission lines showed a slight increase in the S11 magnitude when the connection was loosened to 540° at higher signal frequency bands. However, under smaller loosening conditions, no notable change in the EM field was observed; consequently, the S11 signal remained unchanged. 14 Another experimental study on the effect of an enlarged receptacle and a loose connection on the S11 signal showed that a loose connection has no significant effect on the S11 signal unless the connector receptacle is degraded. 9 This limitation to detect loose connections is attributed to the signal wavelength. Higher wavelengths, which occur at lower signal frequencies, are not significantly affected by the small gaps created during the initial stages of connector loosening. As a result, detecting such faults requires the use of reflectometers operating at higher frequencies, which are very costly. Based on an extensive literature review and the authors’ investigations, existing methods are limited in their ability to identify loose connections in RF data transmission lines. Loose connections are typically detected only when the loosening becomes significant, which leads to an open circuit and/or arc faults. To address this limitation, this study applies distributed vibration sensing approach to detect loosening in coaxial connectors before a catastrophic failure. The effect of vibrating loose connectors on the reflected signal (S11) is investigated using a distributed sensing approach for loose connector detection in data transmission lines. The experiment reveals that vibrating loose connectors significantly increase signal reflection, but direct measurement of signals from loose connectors is noisy, making it difficult to distinguish the distorted portion of the signal caused by loose connection.However, distributed sensing has proven effective in filtering the noise and identifying minor discontinuities the effect of vibrating loose connections on signal reflection and successfully employed in detecting the effect of loose connectors on signal reflection. The effect of vibration on loose connectors on S11 magnitude is investigated in three aerospace (3C058A) and three commercial (RG400) coaxial cables using distributed sensing, with sinewave signals swept from 9 kHz to 5 GHz through connections at fully tightened, 180° loose, and 360° loose conditions. Results for the aerospace grade 3C058A#1 and commercial grade RG400#1 cables are provided in the “Results and discussions” section. Results of the remaining cables are presented in supplementary material. The connections were exposed to vibrations at frequencies from 0 to 640 Hz and accelerations from 0.5G to 4G. The results establish a solid foundation for predictive identification of connector loosening in data transmission lines in advance, thereby reducing the possibility of arc faults in the system and enhancing the reliability of data transmission through the lines.
Distributed sensing
In coaxial cables, at high frequencies, distributed sensing refers to measurement of various physical parameters within the cable, where even small minor signal changes hidden behind the noise are filtered and amplified through time-domain signal processing combined with a sliding gating window technique. Minor physical discontinuities caused by various environmental factors are usually hard to detect using conventional reflectometry methods. But the distributed sensing approach proved to be efficient in filtering and locating minor discontinuities, since the approach uses a unique technique of “elaborating” properties of the coaxial cable that is affected by change in any environmental factor and filtering out noises. A review shows that coaxial cables transformed into distributed sensors are capable of high measurement resolution up to strains beyond fiber optic limits. 15 Distributed sensing in coaxial cables was effectively used to detect localized temperature variation, where analogy of Rayleigh backscattering mechanism, used in optical fibers, was applied. 16 Thermal expansion of the alumina tube in coaxial cable was successfully determined using distributed sensing on reflected signal intensity. 17 Correlation of signals before and after the effect of temperature provided the location of distributed heat within the cable. 18 Application of this technique enables the use of coaxial cable as a sensor for identifying different environmental factors.For instance, distributed crack sensing was used by inflicting shallow helical grooves in a coaxial cable with minimum crack width of 0.02 mm and then attaching it to a structure. Crack formation in the structure deformed the modified coaxial cable microstructure that was successfully identified using distributed sensing, proving the effectiveness of distributed sensing in crack detection. 19 A material with low elastic modulus used as an insulation part of coaxial cable, named coaxial cable Bragg grating, where direct strain was applied changed the form of the layer subsequently affecting the S11 signal. 20 An external load applied to coaxial cables attached to a surface served as a distributed strain sensor, since any external force tends to affect the viscoelastic structure of the coaxial cable. 21
Theoretical background
Discontinuities in data transmission lines are located using time-domain reflectometry, which uses reflection coefficient in the time domain, as shown in Equation (1): 22
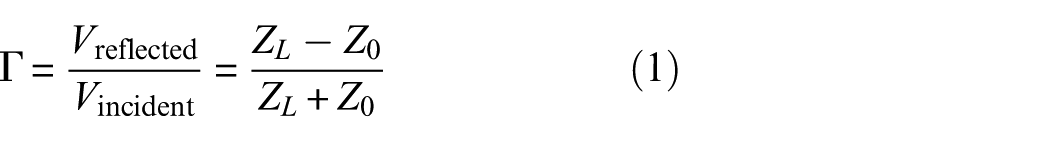
where
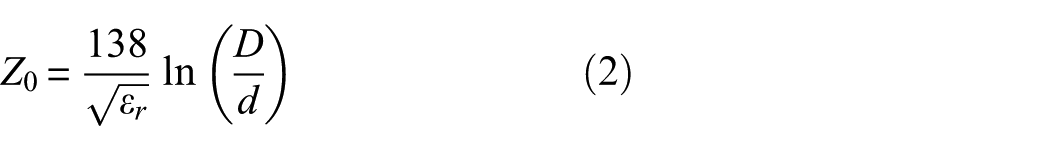
where
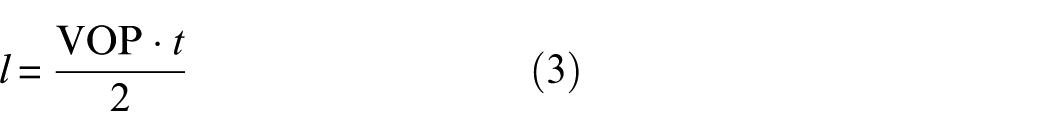
where t is the time delay of the signal that propagates forth and reflects from discontinuity, and VOP denotes velocity of signal propagation, where
The effect of vibration is identified at the reflection point from the cable connector exposed to vibration. Vibration induced by a shaker may be written as shown in Equation (4): 24

where ω and A denote the angular frequency and amplitude of motion, respectively, and
The vibration effect is superimposed on the static S11 signal, which is seen in S11 magnitude change under the effect of vibration as shown in Equation (5):

where
Distributed sensing
The distributed sensing approach is highly effective in localizing minor discontinuities within the transmission lines. This approach analyzes time-domain data. The scattering S11 parameter is obtained in time domain, and then a gating function is applied to magnify specific regions of the obtained S11 signal. Using a small step size, the gating window is moved along the S11 signal with overlapping windows. The accuracy of the approach is determined by the gating function step size; the smaller the step size, the higher the accuracy of subsequent processing. In this way, the coaxial cable is discretized along its length. Within each gated window of the S11 signal, fast Fourier transform (FFT) is applied to obtain the frequency spectrum of the signal. Then, a cross-correlation
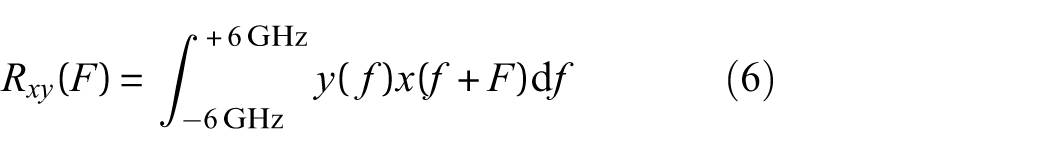
where
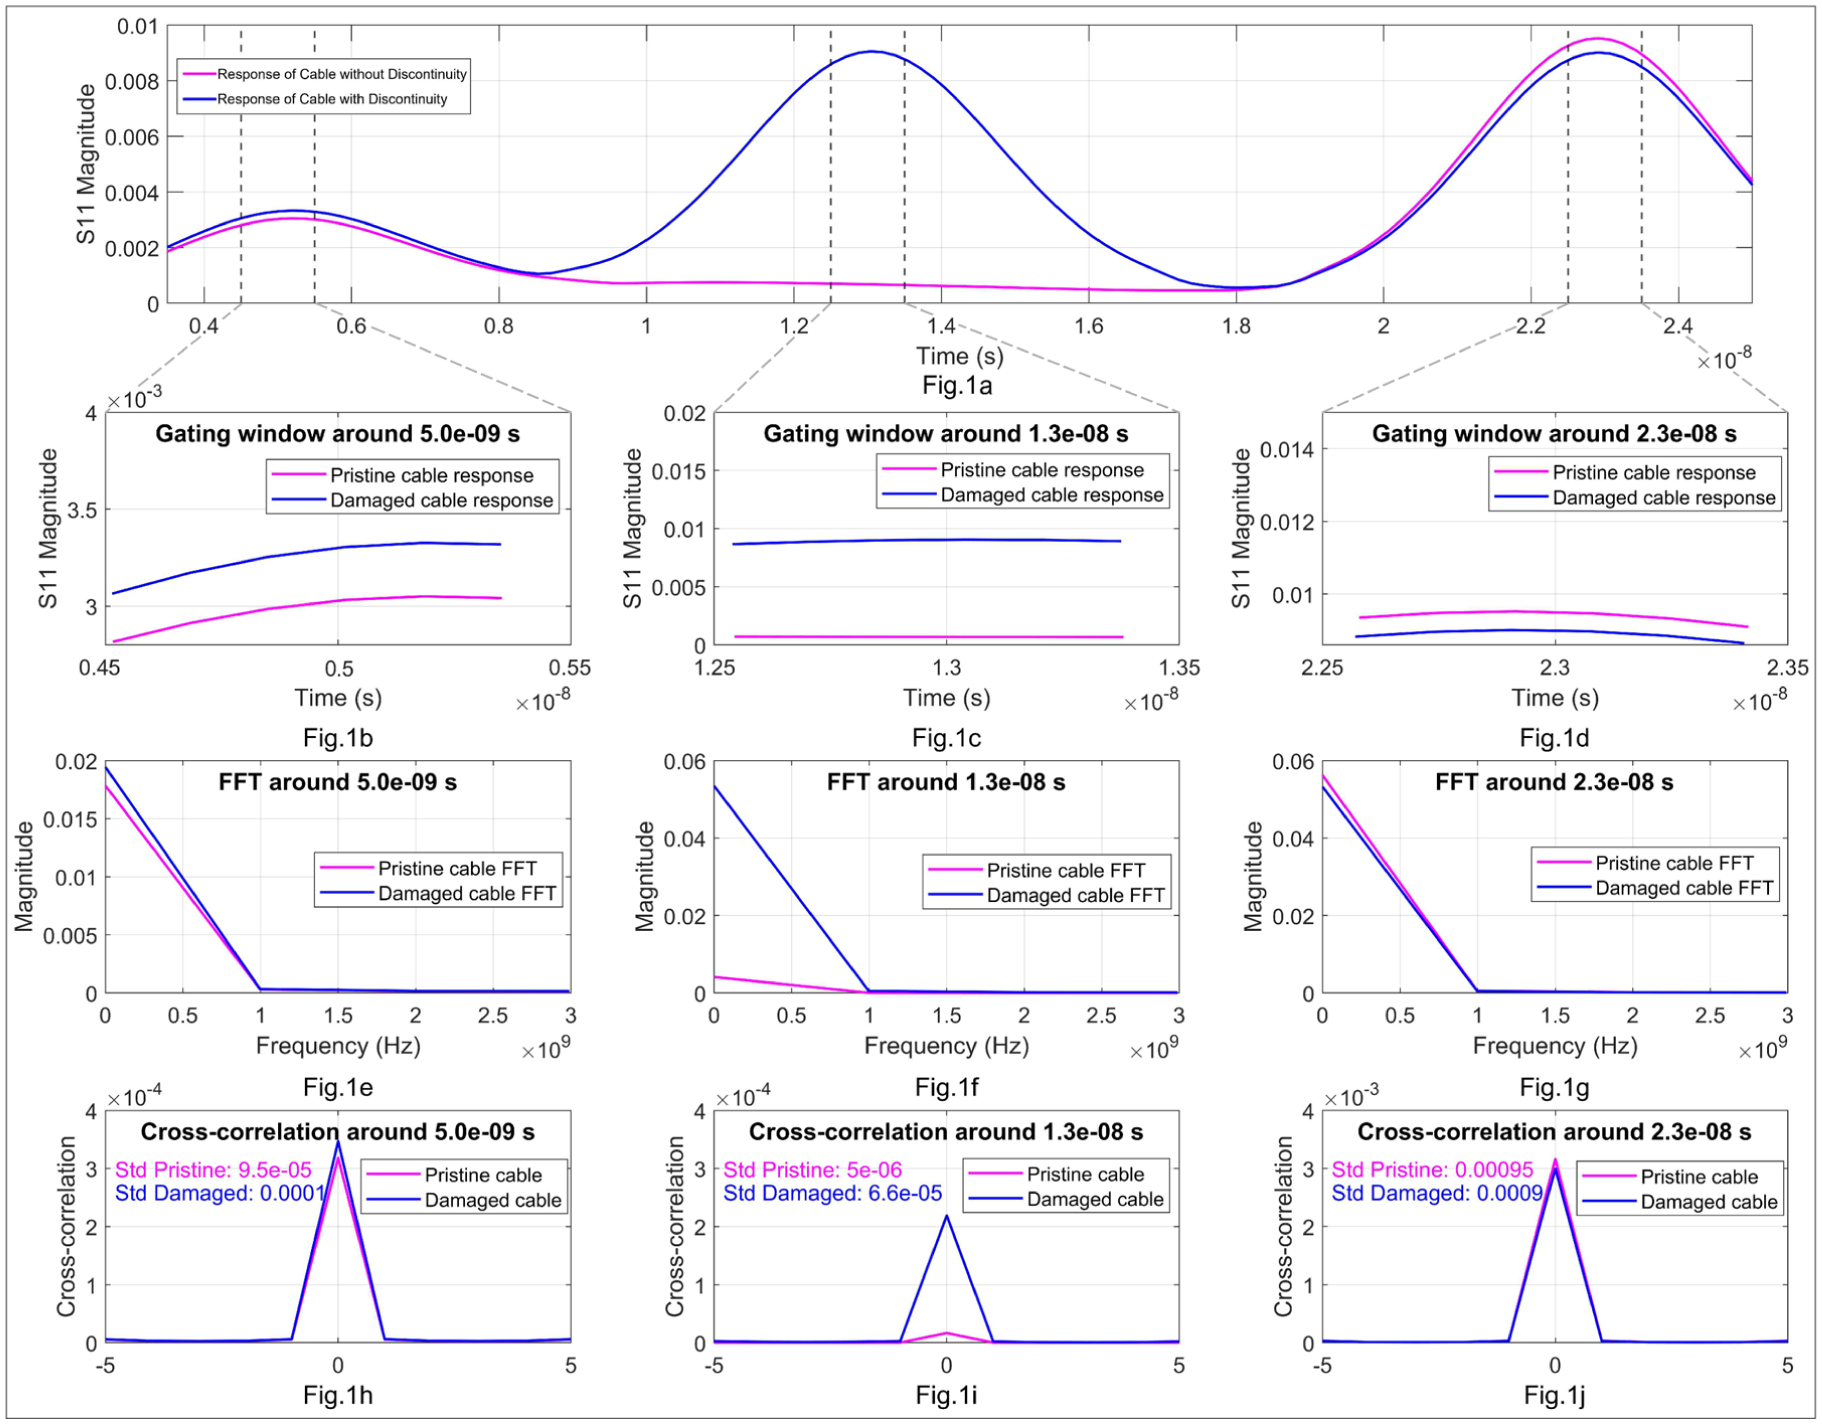
Distributed sensing process algorithm (a–j).
The S11 parameter is obtained in time domain (Figure 1(a)). Then the gating function with sliding window is applied (example is shown in dashed line in Figure 1(a)) as shown in Figure 1(b) to (d). FFT is obtained from the gated windows as shown in Figure 1(e) to (g). Then cross-correlation of the obtained FFTs is calculated between the pristine cable FFT and FFT of a cable with discontinuity. As can be seen from Figure 1(h) to (j), cross-correlation results almost align for connection points and show significant difference for the damage point. This feature helps to easily distinguish the presence of damage or change caused by loose connectors in the transmission line. Smoothened cross-correlation product gives spectral width of frequency shift in the signal caused by the loose vibrating connector. Eventually, the standard deviation of the cross-correlation product is distributed along the cable length that visually shows the discontinuity effect on signal frequency.
Other signal features, including the area under the curve and signal peak shift, were initially investigated. However, the plots for these parameters exhibited significant noise, making it difficult to distinguish the effect of vibration frequency on signal reflection. In contrast, the spectral width of the frequency shift demonstrated greater stability and clearer separation between fully tightened and loose connector conditions across various vibration levels. Consequently, spectral width was selected as the primary parameter for distributed vibration sensing.
Experimental procedure
Materials and equipment
The effect of vibration on reflected signals distributed response is investigated in three RG400 cables from Millimeter Wave Technologies (Chandler, AZ, USA) used in RF and microwave communication systems and three 3C058A cables from Carlisle Interconnect Technologies (New York, NY, USA) used in aerospace and defense applications. Reflected signals were obtained using VNA model P5004A. A Modal SmartShaker, model K2004E01 (Cincinnati, OH, USA), was used to induce vibration in cable connectors. A Yokogawa model FG120 2 MHz synthesized function generator (Newnan, GA, USA) was used to generate the signal driving the shaker. The actual vibration level was measured by a single axis accelerometer, printed circuit board Piezotronics model 352C25 (Depew, NY, USA), where the output signal of the accelerometer was filtered by a sensor signal conditioner, model 483C, and monitored using Tektronix MSO24 2-BW-200 Mixed Signal Oscilloscope (Beaverton, OR, USA).
Experimental plan and procedure
Sinewave signals from 9 kHz to 5 GHz were generated and swept down the line via VNA. The S11 signals were acquired at port 1 of the VNA. Calibrated 50Ω RG58 extension cables were used to protect the VNA from vibration-induced damage. Test cables were connected to the extension cables one at a time. The connection point between the test cable and extension cable connected to port 1 of the VNA was exposed to vibration. The S11 signals were acquired in time domain and saved in .csv format. The number of points set on the VNA was 5000, meaning each sweep produced 5000 data points, intermediate frequency bandwidth = 1 kHz, power P = 0 dBm, and sweeping resolution = 1 MHz.
The cable connector holder was mounted on the shaker, and then the connection point was fastened in the holder as shown in Figure 2.
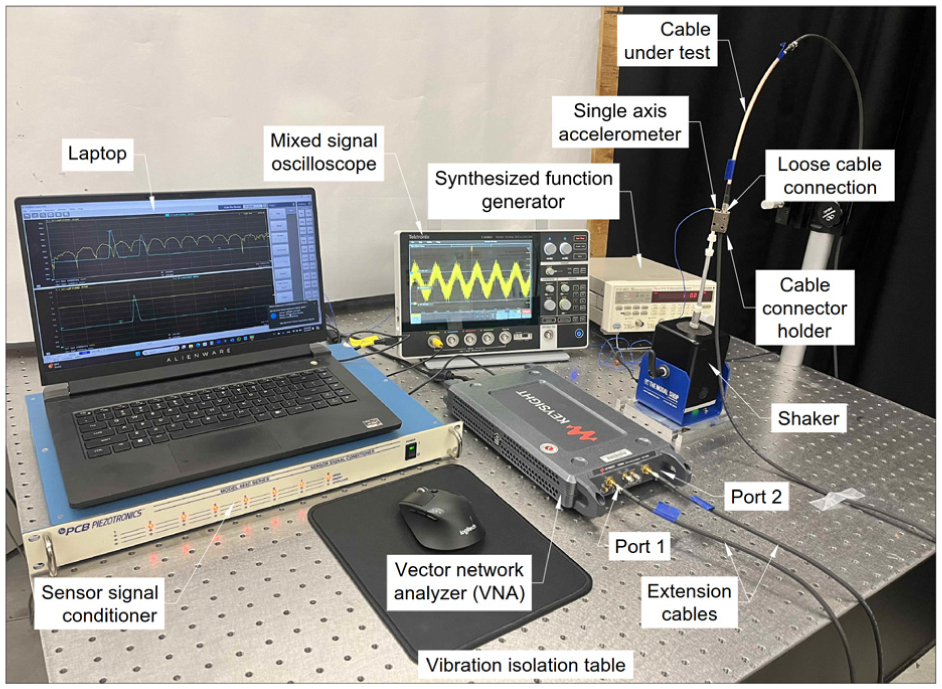
Experimental setup for loose connection identification in transmission lines.
The experiment was conducted on a vibration isolation table to eliminate the effects of environmental movement, as shown in Figure 2. Reflected S11 signals were acquired in time domain and further processed using MATLAB. The extension cables were calibrated using the VNA calibration kit as per calibration instructions. Then, the test cable was connected to the extension cables and mounted on a shaker in cable connector holder for exposure to vibration.
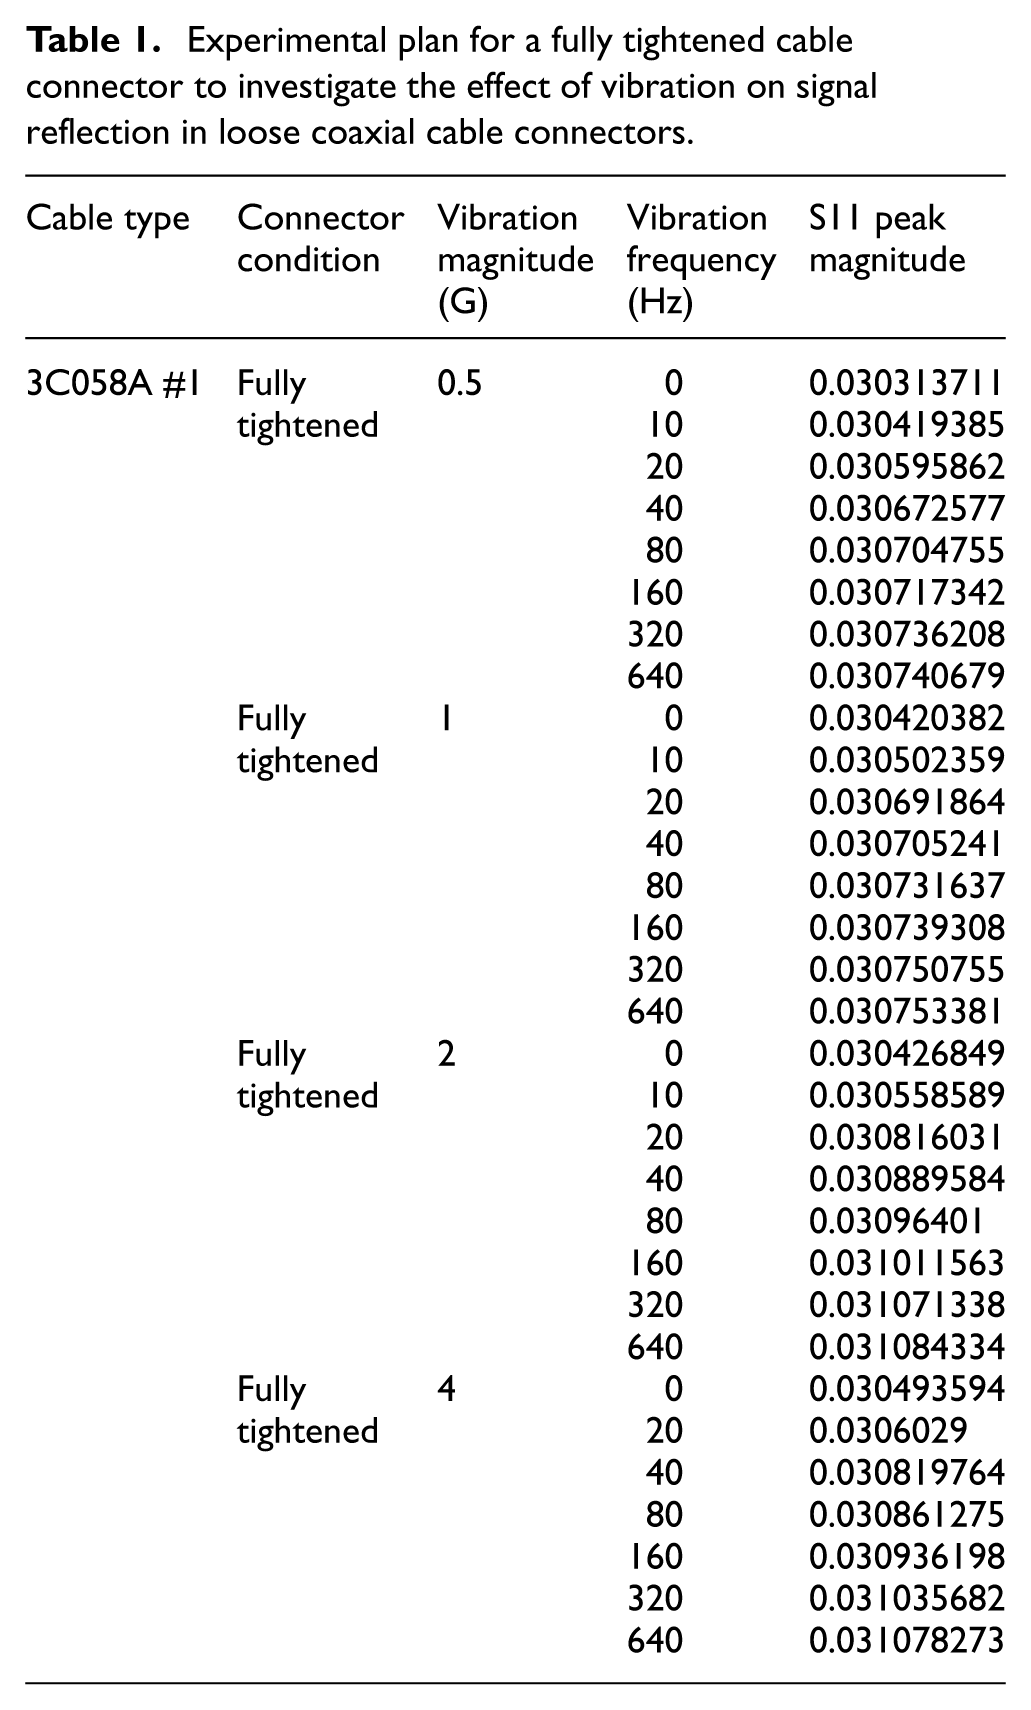
The cable connector holder was designed and machined using a CNC machining center. Each test cable connector was exposed to vibrations—one at a time—at eight frequencies of 0, 10, 20, 40, 80, 160, 320, and 640 Hz, and at four magnitudes of 0.5G, 1G, 2G, and 4G, as shown in Table 1.
Experimental plan for a fully tightened cable connector to investigate the effect of vibration on signal reflection in loose coaxial cable connectors.
The experiment was repeated under three connector conditions: fully tightened, loosened by 180°, and loosened by 360°.
Table 1 shows an experimental plan for the cable 3C058A with a cable connector in fully tightened condition. The same experimental plan was used for the remaining two connector conditions: loose by 180° and loose by 360°. The experiment was conducted on six transmission lines in total, three commercial-grade (RG400) and three aerospace-grade (3C058A). Results for the aerospace grade 3C058A#1 and commercial grade RG400#1 cables are provided in the following section. Results of the remaining cables are presented in supplementary material. Each line was exposed to vibration separately, and measurements were acquired using the VNA. The shaker’s vibration frequency and magnitude were controlled by a synthesized function generator that vibrated the cable connector along the cable’s axis. The frequency of the signal generator driving the shaker corresponds to the frequency of vibration. Acceleration magnitude was measured in gravitational acceleration term G that is found using Equation (7):
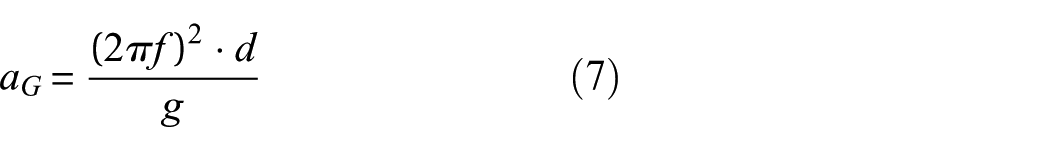
where f is the vibration frequency,
The actual vibration magnitude was monitored in the following order: The single axis accelerometer was attached to the cable connector holder via sticky wax. The sensor signal conditioner filtered the output signal of the accelerometer. The filtered signal was visualized for control using the oscilloscope. The schematic diagram of the experimental setup is shown in Figure 3.
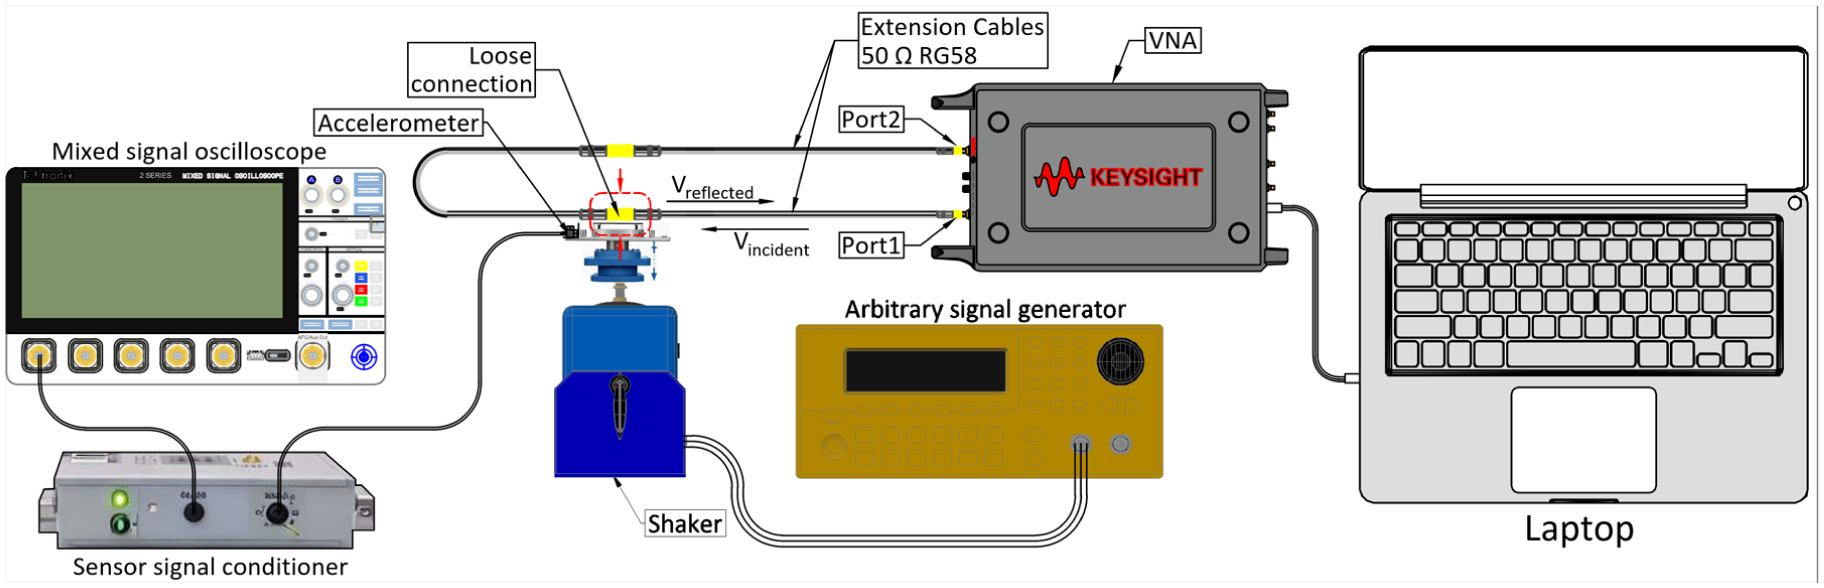
Schematic diagram of the experimental setup.
To ensure repeatability of the connector loosening states, connections were fully tightened with the VNA’s standard torque wrench, and then were loosened to the corresponding looseness degrees. Each measurement was repeated three times, and the average value was plotted with error bars indicating deviation from the average value.
Results and discussions
The S11 responses were acquired for the fully tightened cable connector condition at all combinations of vibration frequency and acceleration. Then, the connector was loosened by 180° and exposed to the same vibration conditions. Finally, the connector was loosened by 360° and S11 responses were acquired at the same vibration combinations. The acquired time-domain S11 signals were processed using distributed sensing approach in MATLAB.
Effect of vibration on signal reflection in fully tightened transmission line connectors
The distributed vibration sensing for the aerospace coaxial cable 3C058A#1 under the fully tightened connector condition is shown in Figure 4.
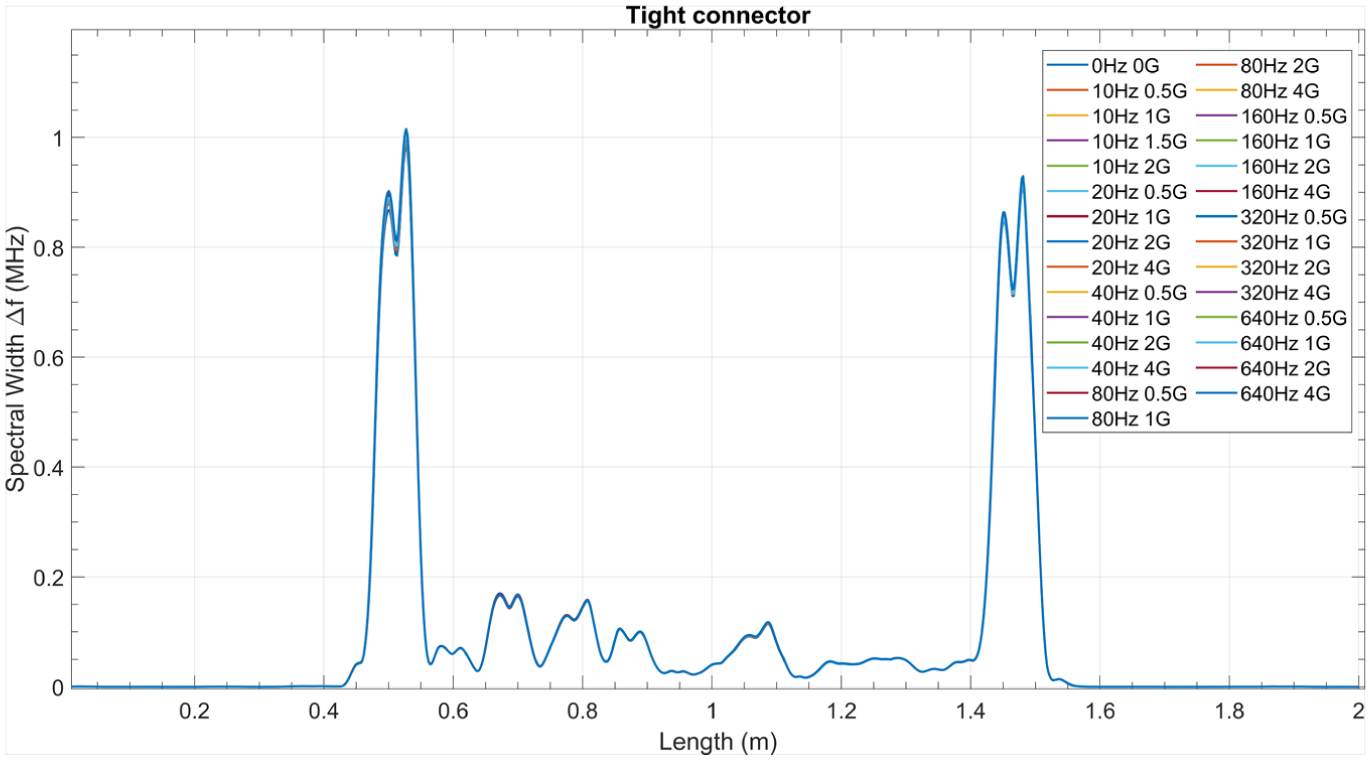
Distributed vibration sensing of the cable with a fully tightened connector.
The first peak, appearing on the left at approximately 0.5 m in Figure 4, represents the distributed vibration sensing of the reflected signal from the vibrating cable connector, which was connected to the extension cable linked to port 1 of the VNA. The second highest peak at approximately 1.5 m represents the response from the second end of the cable under test—connection point to the extension cable connected to port 2 of the VNA. The distributed vibration sensing was acquired at all combinations of vibration frequencies and magnitudes for each cable separately. As seen from the first peak in Figure 4, vibration has a negligible effect on S11 magnitude, and, consequently, on distributed vibration sensing when connector is fully tightened. A small spectral change in frequency is observed.
The first peak that represents distributed vibration sensing from fully tightened connector exposed to vibration at 0.5G, 1G, 2G, and 4G magnitudes is shown in Figure 5.
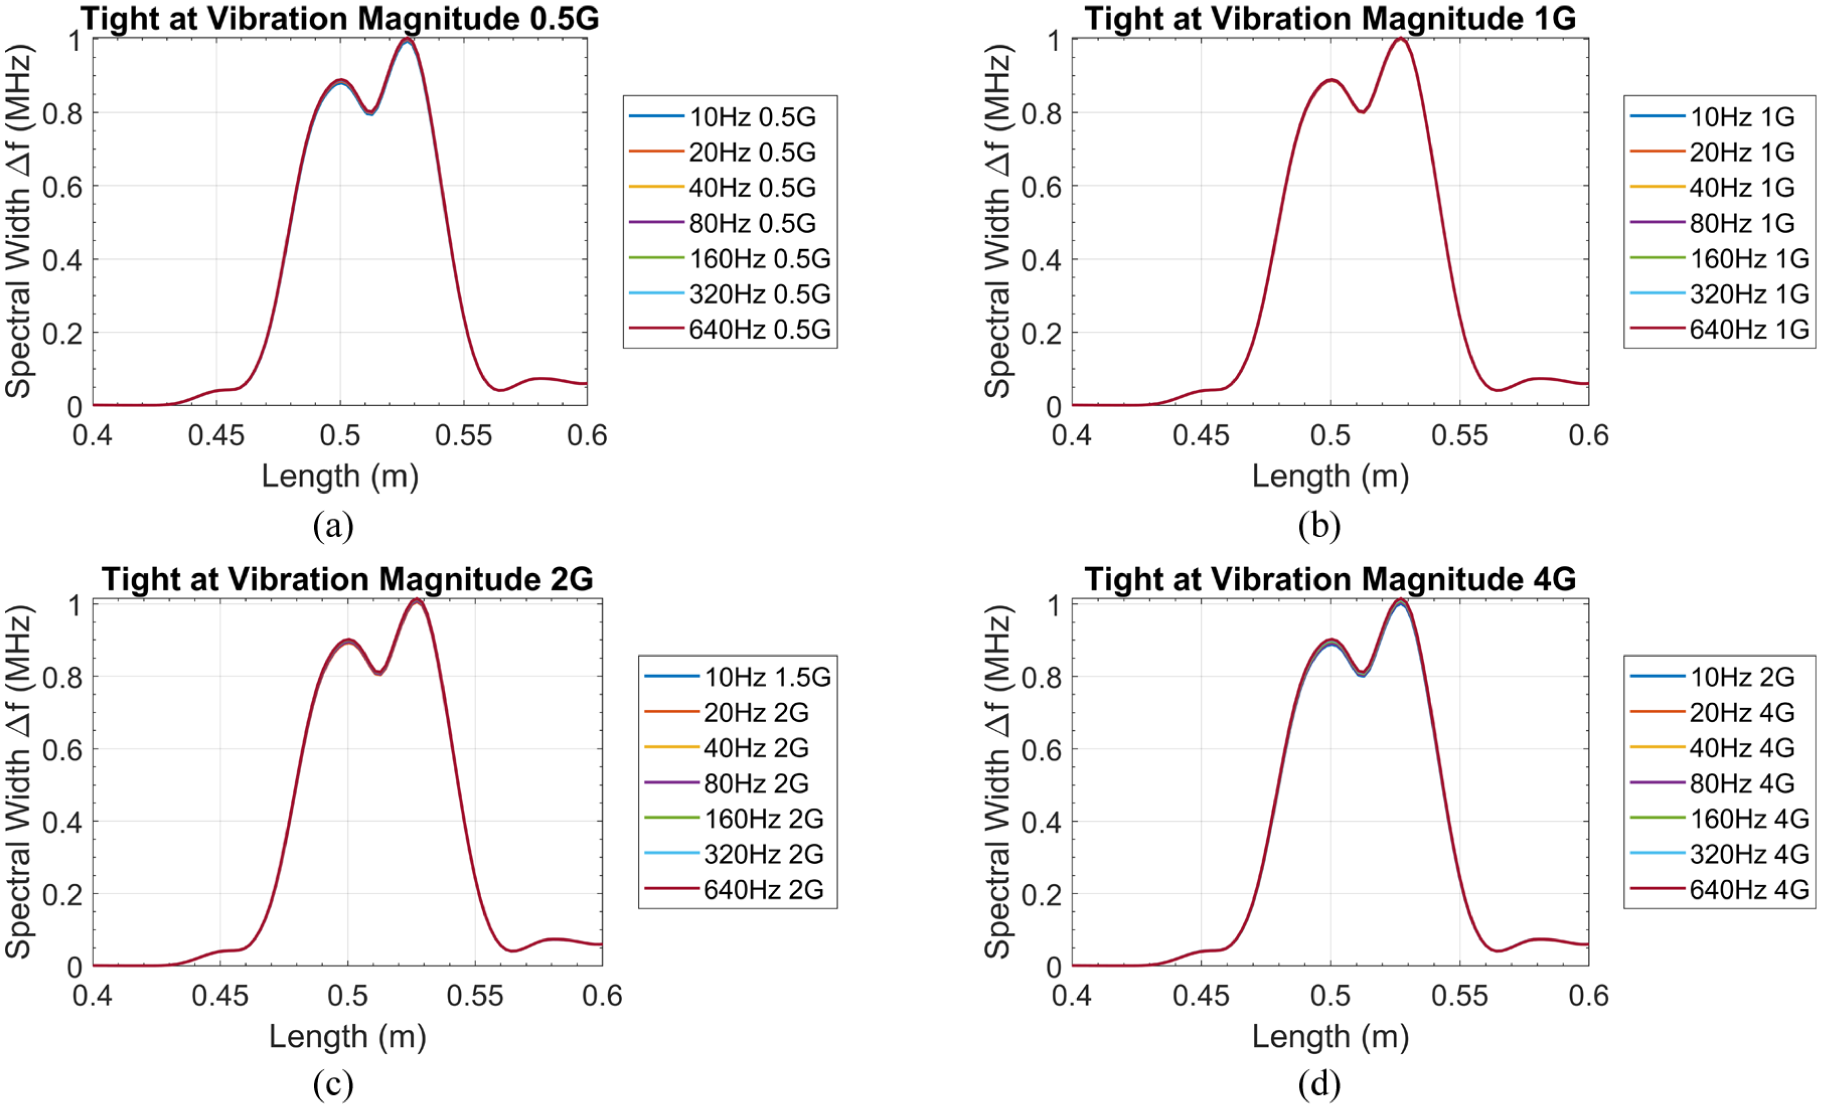
Distributed vibration sensing of the fully tightened cable connector (a–d).
As Figure 5(a) to (d) shows, vibration frequency and acceleration have a small effect on distributed vibration sensing of the reflected signals, meaning that vibration of the tightly assembled cable connector does not distort the signal passing through. However, minimal variations in spectral width over vibration frequency are observed that can be used to detect the vibration level in the system. Spectral width magnitude remains consistent at vibration magnitudes of 0.5G, 1G, 2G, and 4G with small variation.
The change in spectral width peak over vibration frequency follows an exponential form of a cosine trend, as Figure 6 shows.
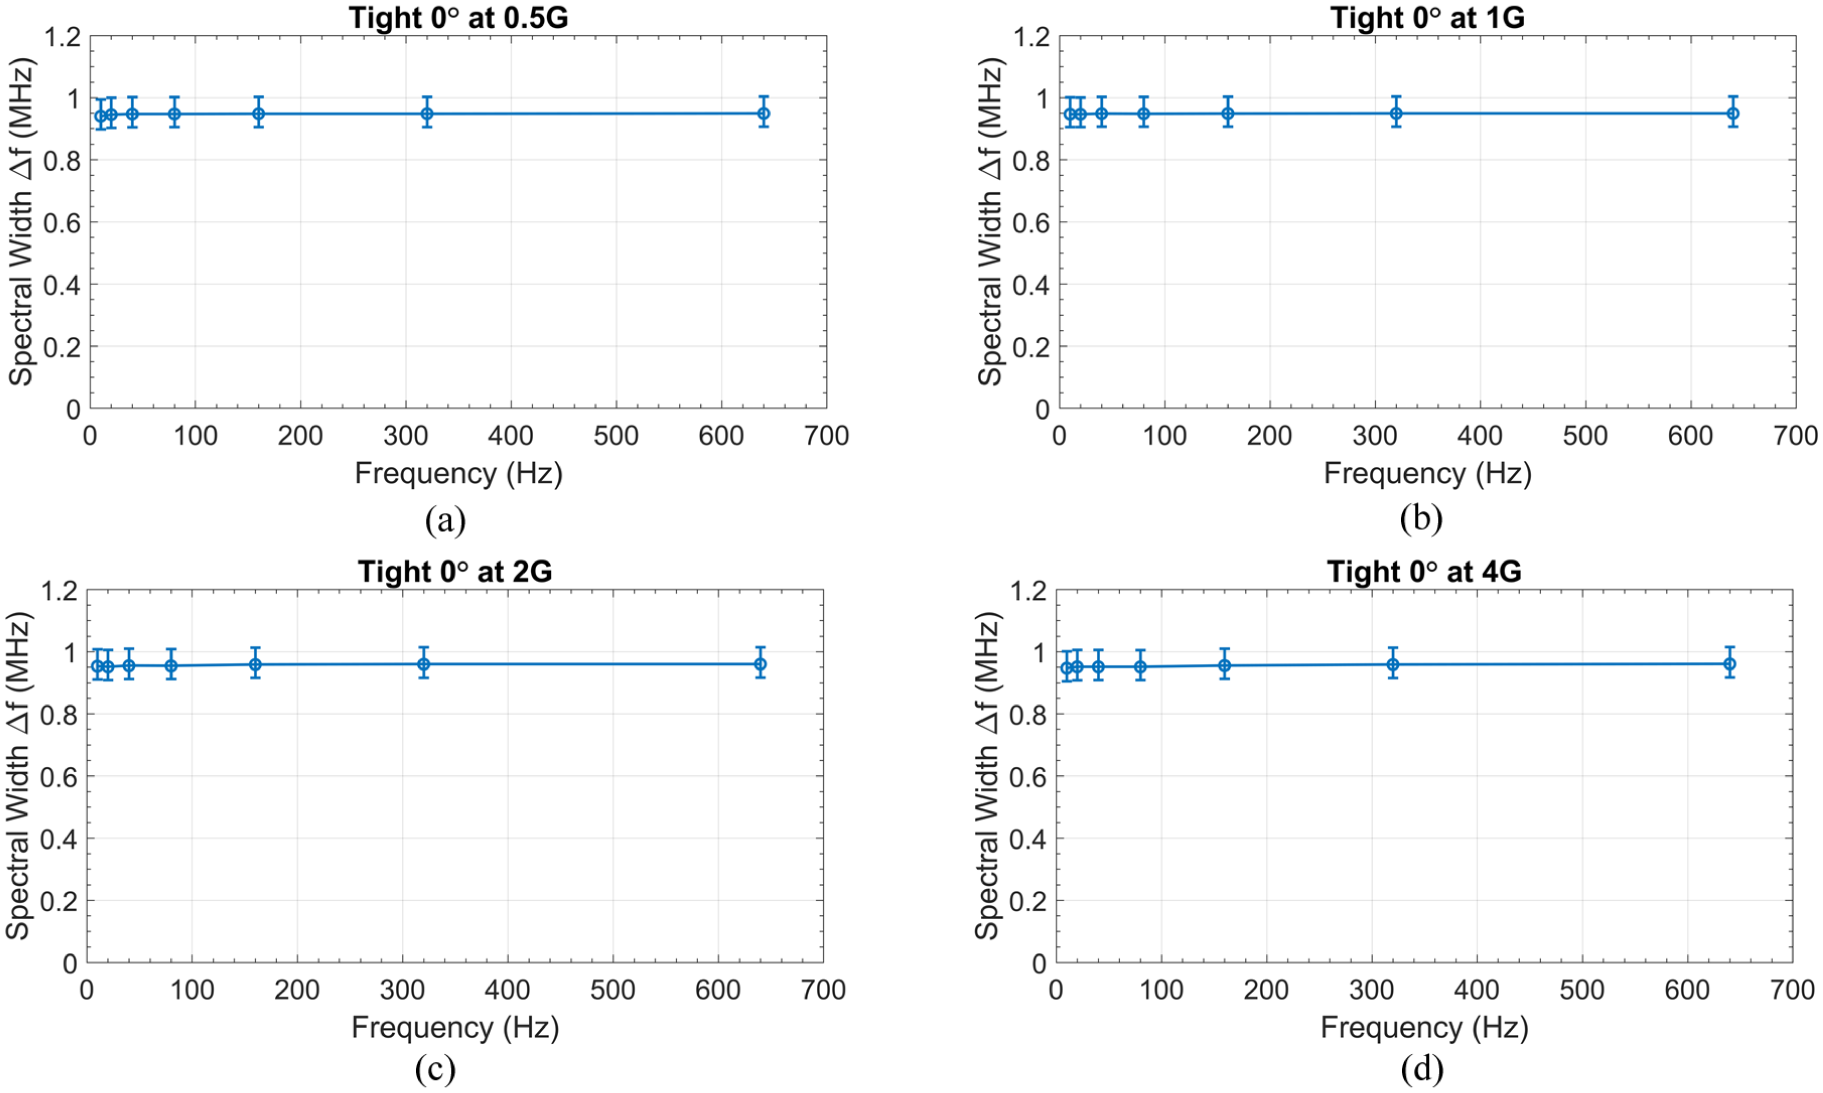
Distributed vibration sensing response for the fully tightened cable connector as a function of vibration frequency (a–d).
Figure 6(a) to (d) shows spectral width change over vibration frequency at four vibration magnitudes. Spectral width increases nonlinearly with an increase in vibration frequency following exponential form of a cosine. The higher the vibration magnitude, the higher the spectral width. The spectral width changes over vibration frequency at 1G (Figure 6(b)) were close to that of 0.5G (Figure 6(c)) with a slight difference in the magnitude. The spectral width at 4G (Figure 6(d)) was significantly higher than those at 0.5G and 1G followed by 2G (Figure 6(c)) having the second highest magnitude. At lower vibration frequencies the spectral width curves corresponding to different vibration magnitudes remain close to each other, resulting in smaller differences between vibration levels. As the vibration frequency increases, the separation between the curves becomes more noticeable, allowing easier distinction between vibration magnitudes.
The error bars shown in Figure 6(a) to (d) may appear notably large; however, this is due to the plot resolution, which makes the error bars look significantly bigger. The standard deviation and uncertainty quantification are presented in the following section of the manuscript.
The combined effect of vibration frequency and magnitude on distributed vibration sensing of the fully tightened cable connector is shown in Figure 7.
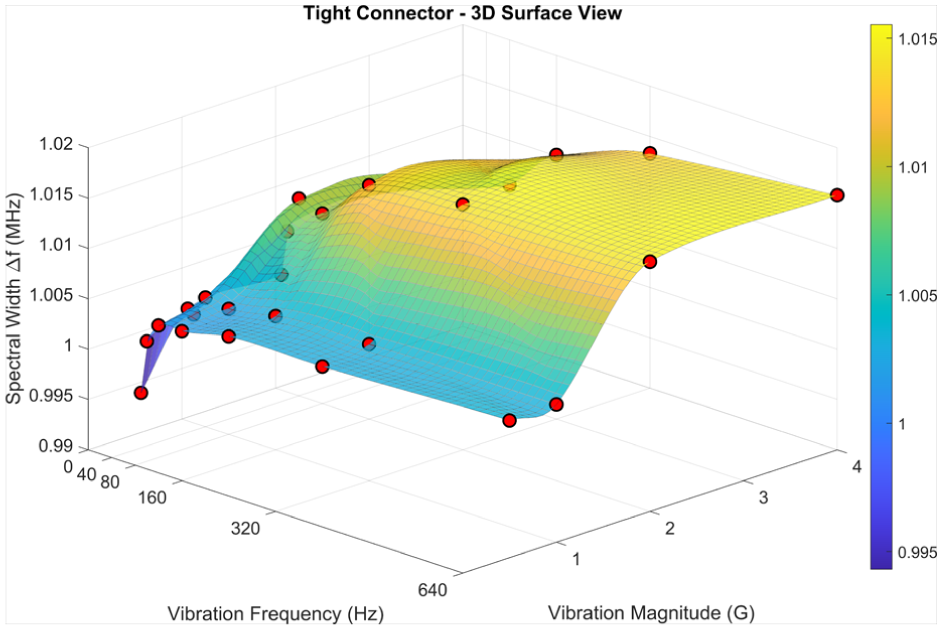
Distributed vibration sensing over vibration frequency and magnitude of the fully tightened cable connector.
Figure 7 shows spectral width magnitude change over vibration frequency at four vibration magnitudes for a fully tightened connector. Distributed vibration sensing of S11 parameter for a fully tightened cable connector shows minimal spectral width change for the fully tightened connector. The spectral width shows stable nonlinear increase across the entire vibration frequencies and magnitudes, where values are confined to a range from 0.995 to 1.018 MHz. The spectral width increase follows an exponential function of a cosine with respect to both vibration frequency and vibration magnitude, reflecting the effect of vibration superimposed on the reflected signal captured through distributed vibration sensing. The maximum spectral width of approximately 1.018 MHz occurs at the highest vibration frequency (640 Hz) and magnitude (4G) combination, while the minimum value of 0.995 MHz occurs at low frequency and magnitude conditions. This fully tightened connection demonstrates stability of signal transmission and minimal sensitivity to vibrational disturbances, indicating optimal connector performance and reliability. Therefore, information about vibration level can be extracted without signal disturbance based on the S11 signal magnitude. 25
Vibration effect on signal reflection in loose by 180° transmission line connectors
The acquired S11 responses, processed using distributed sensing for the aerospace coaxial cable 3C058A#1 under the connector loosened by 180° condition, are shown in Figure 8.
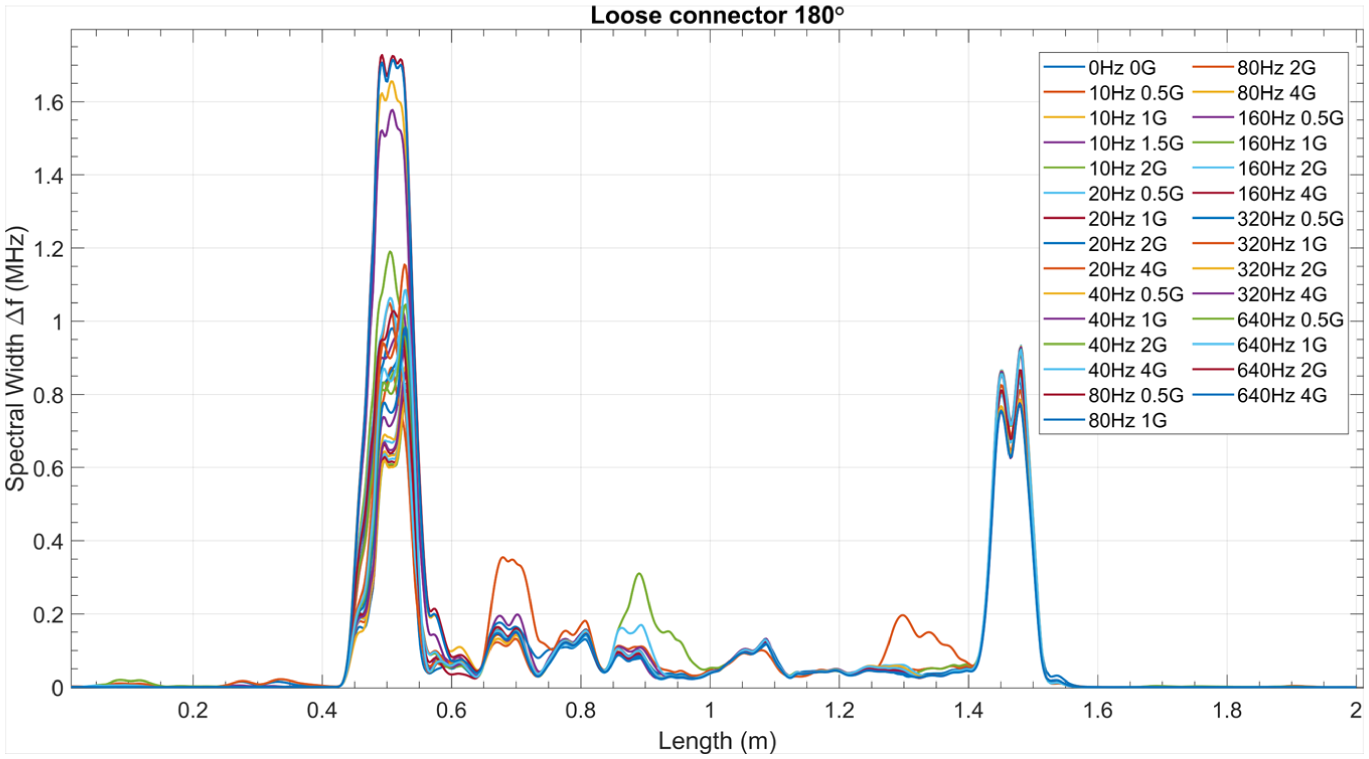
Distributed vibration sensing of the cable with a connector loosened by 180°.
The first peak, appearing on the left at approximately 0.5 m in Figure 8, represents the distributed vibration sensing of the S11 signal from the vibrating cable connector loosened by 180°, which was connected to the extension cable linked to port 1 of the VNA. The second highest peak at approximately 1.5 m represents the response from the second end of the cable under test—connection point to the extension cable connected to port 2 of the VNA. The distributed vibration sensing response was acquired at all combinations of vibration frequency and magnitude for each cable separately. As seen from the first peak in Figure 8, vibration has a significant effect on distributed vibration sensing when the connector is loose by 180°.
The first peak that represents distributed vibration sensing from connector loosened by 180° exposed to vibration at 0.5G, 1G, 2G, and 4G magnitudes is shown in Figure 9(a) to (d), respectively.
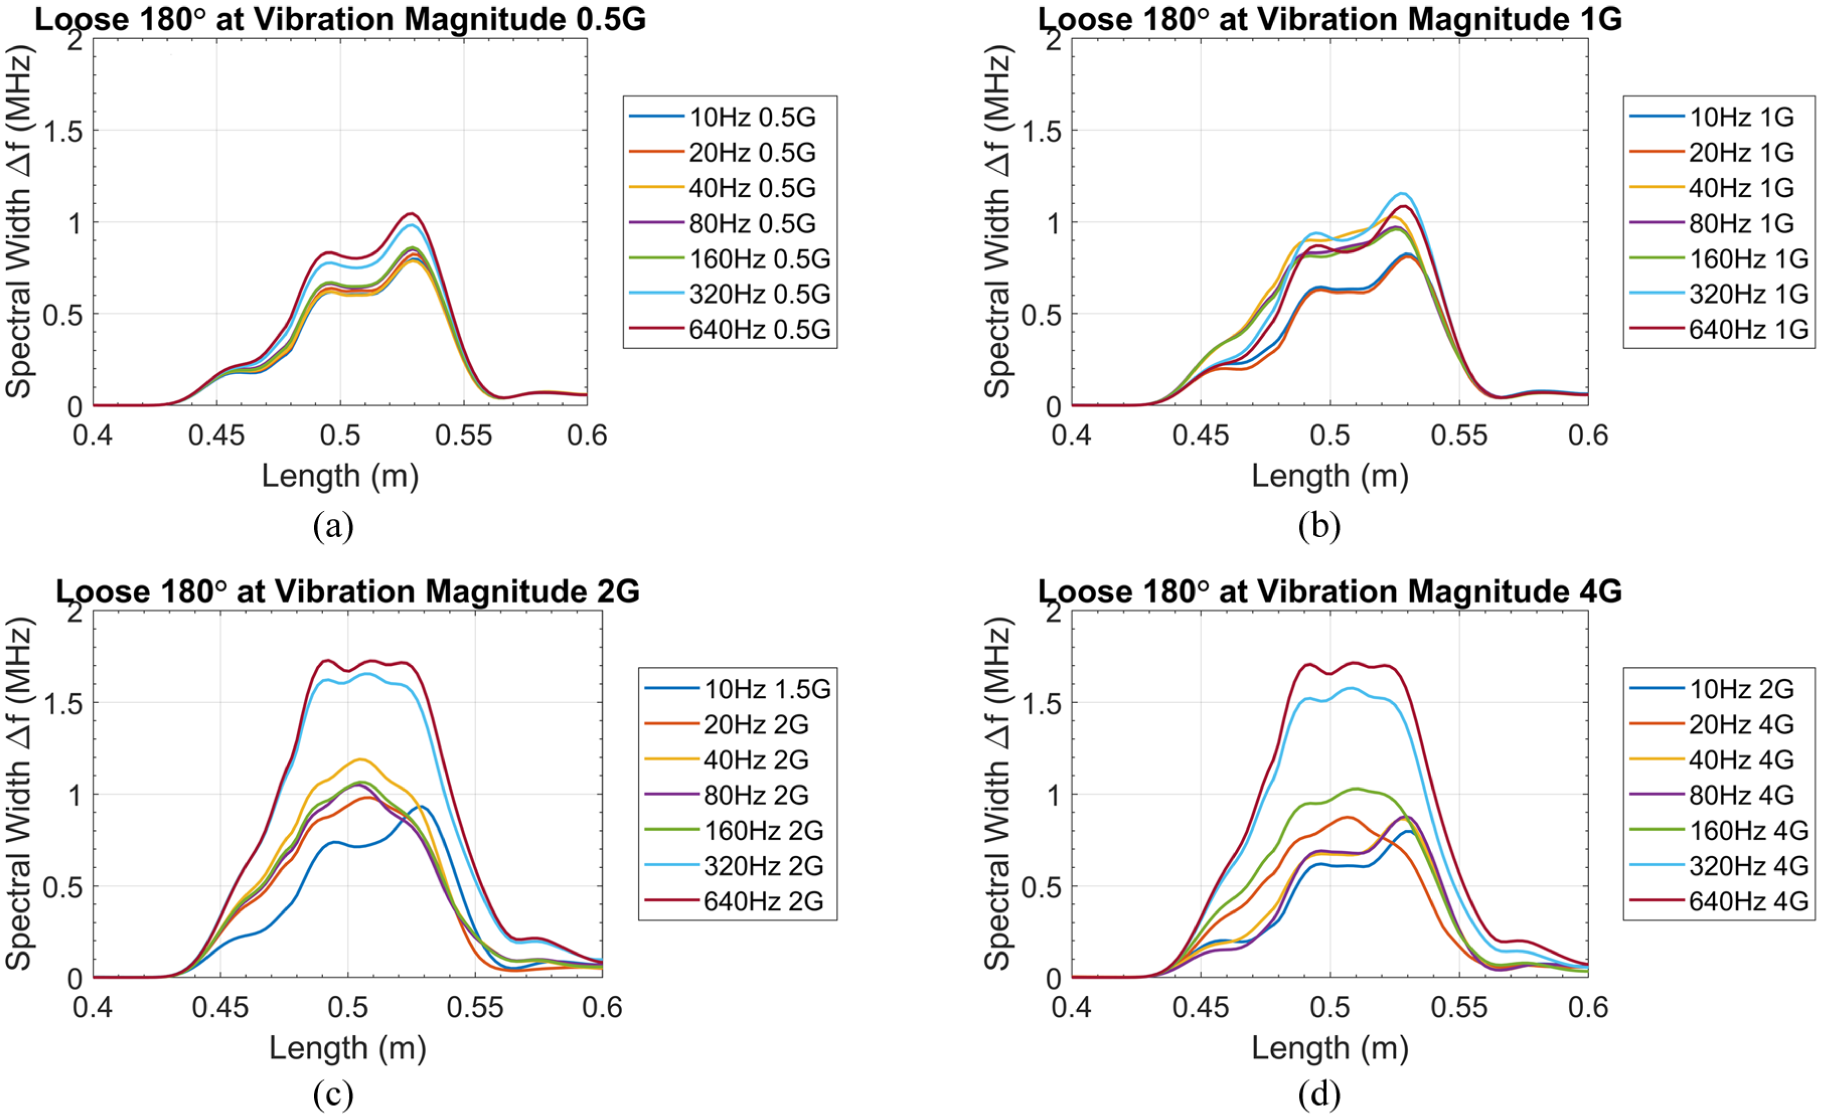
Distributed vibration sensing of the cable connector loosened by 180° (a–d).
As Figure 9(a) to (d) shows vibration frequency and magnitude have a significant effect on distributed sensing of the reflected signals, meaning that vibration of the loosened cable connector by 180° leads to significant signal distortion, when exposed to vibration. The direct S11 response from a cable connector loosened by 180° exposed to vibration showed fluctuating magnitude with changes in vibration frequency and magnitude, making it impossible to identify the effect of the loose connection. In contrast, distributed vibration sensing proved to be effective in filtering the noises and identifying loose connection effect. Distributed sensing of S11 parameters shows consistent increase in spectral width with vibration frequency as seen in Figure 10. Spectral width magnitude increases with vibration magnitudes except for the response at 2G that shows the highest magnitude.
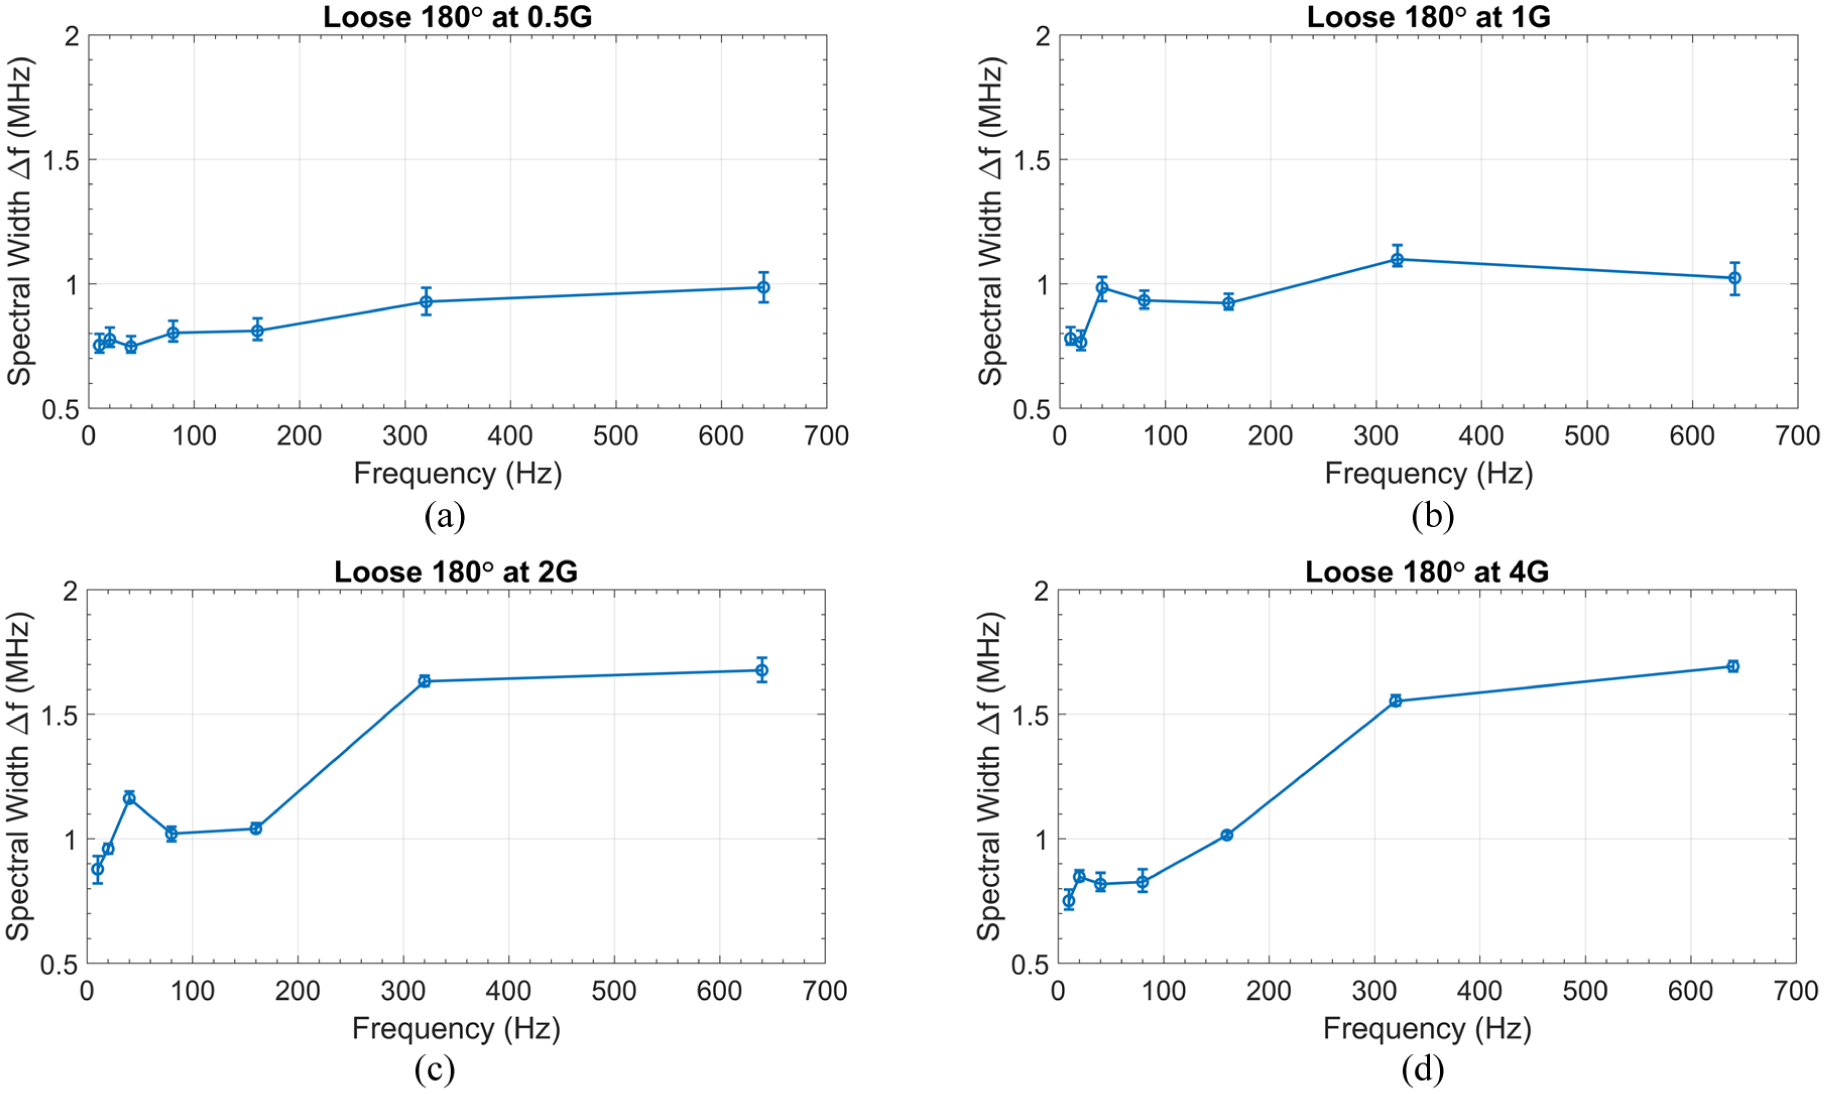
Distributed vibration sensing response for the loose cable connector by 180° as a function of vibration frequency (a–d).
Figure 10(a) to (d) shows spectral width change over vibration frequency at 0.5G, 1G, 2G, and 4G vibration magnitudes, respectively. Spectral width increases nonlinearly with an increase in vibration frequency. The higher the vibration magnitude, the higher the spectral width. The relative comparison of the spectral width levels across the different vibration magnitudes is presented in Figure 10(a) to (d). This observation is evaluated over the tested vibration frequency range (0–640 Hz), where the overall spectral width level increases with increasing vibration magnitude, except for the case at 2G, which shows the highest response due to resonance and connector orientation effects described in the manuscript. The spectral width change over vibration frequency at 2G (Figure 10(c)) was the highest followed by 4G (Figure 10(d)), 1G (Figure 10(b)), and 0.5G (Figure 10(a)). It was observed that vertical orientation of the loosened cable connector by 180° connector exposed to 2G vibration makes the connector to turn where it gets into resonance resulting in the highest distributed vibration sensing response. If the cable connector was oriented upside down, vibration at the cable connector resonance frequency would lead to more loosening leading up to full disconnection of the cables. As the distributed sensing shows significant increase that resembles trends shown in Figure 10, it is important to check cable connection for loosening, thus preventing arc faults or disconnection in the system.
The combined effect of vibration frequency and magnitude on distributed vibration sensing of the loosened by 180° cable connector is shown in Figure 11.
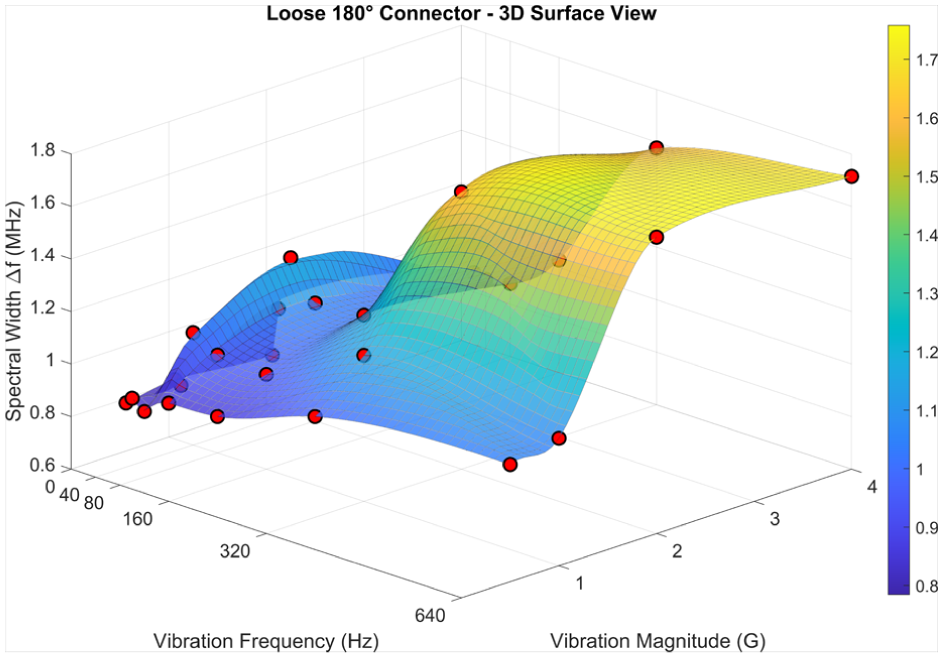
Distributed vibration sensing over vibration frequency and magnitude of the loose cable connector by 180°.
Figure 11 shows spectral width magnitude change over vibration frequency at four vibration magnitudes for a 180° loosened connector. The distributed vibration sensing in Figure 11 shows significant spectral width variation with vibration frequency and magnitude for the 180° loosened connector. The spectral width shows an intermediate response between the fully tightened and 360° loose configurations, with values ranging from 0.8 to 1.8 MHz across all the tested vibration frequencies and magnitudes. The response surface shows two distinct regions: spectral width increases slowly at lower vibration frequencies (40–160 Hz) across all magnitudes, then increases sharply at higher frequencies (320–640 Hz), particularly at higher vibration magnitudes. The highest distributed sensing response of approximately 1.8 MHz was observed at 4G vibration magnitude and 640 Hz frequency, followed by decreasing responses at lower magnitudes and frequencies. This connector loosening condition (180°) causes connector instability and consequent signal transmission deterioration, with spectral width variations indicating developing connection degradation that requires monitoring and maintenance to prevent further failure.
Vibration effect on signal reflection in loose transmission line connectors to 360°
The acquired S11 responses, processed using distributed sensing for the aerospace coaxial cable 3C058A#1 under the connector loosened by 360° condition, are shown in Figure 12.
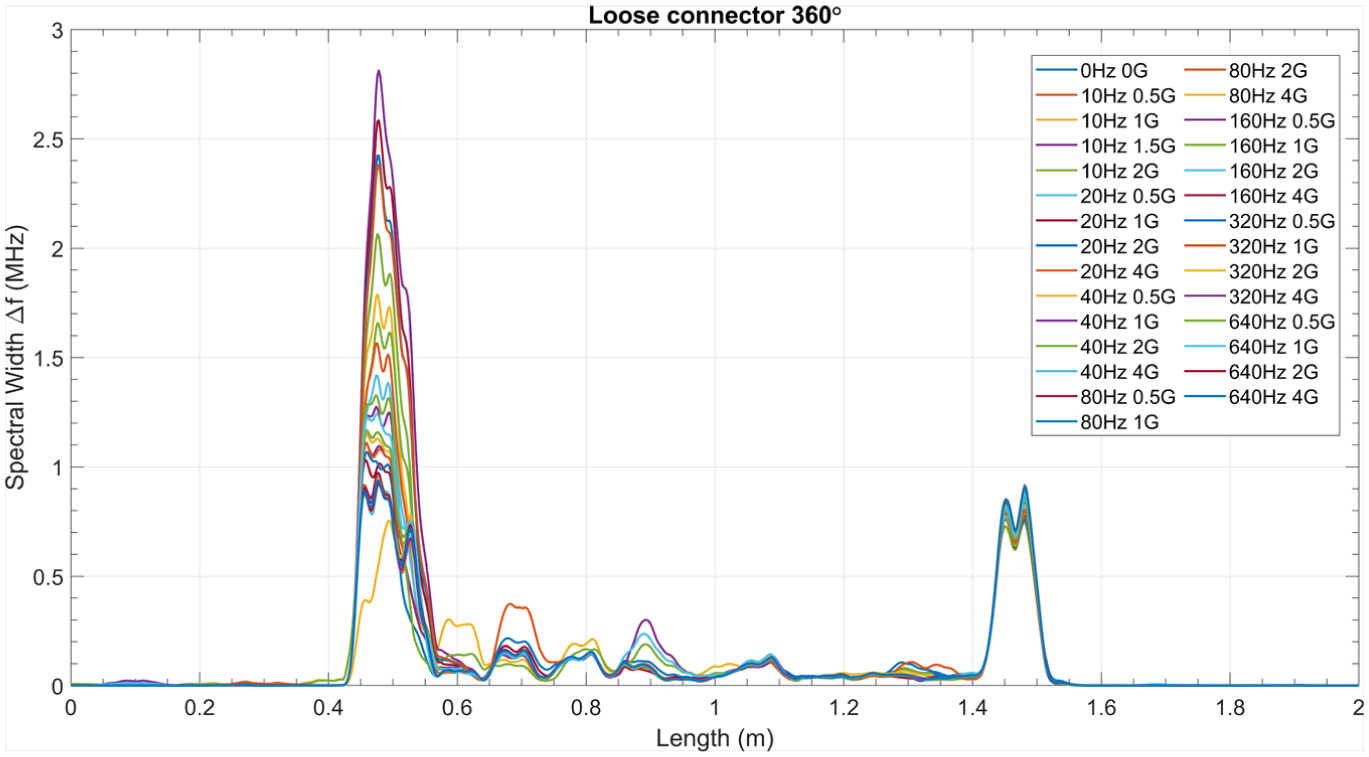
Distributed vibration sensing of the cable with a connector loosened by 360°.
The first peak, appearing on the left at approximately 0.5 m in Figure 12, represents reflected signal’s distributed vibration sensing for the cable connector loosened by 360°, which was connected to the extension cable linked to port 1 of the VNA. The second highest peak at approximately 1.5 m represents the response from the second end of the cable under test—connection point to the extension cable connected to port 2 of the VNA. The distributed vibration sensing was acquired at all combinations of vibration frequency and magnitude for each cable separately. As seen from the first peak in Figure 12, vibration has a significant effect on S11 magnitude, and, consequently, on distributed vibration sensing when connector is loose by 360°.
The first peak that represents distributed vibration sensing from connector loosened by 360° exposed to vibration at 0.5G, 1G, 2G, and 4G magnitudes is shown in Figure 13(a) to (d), respectively.
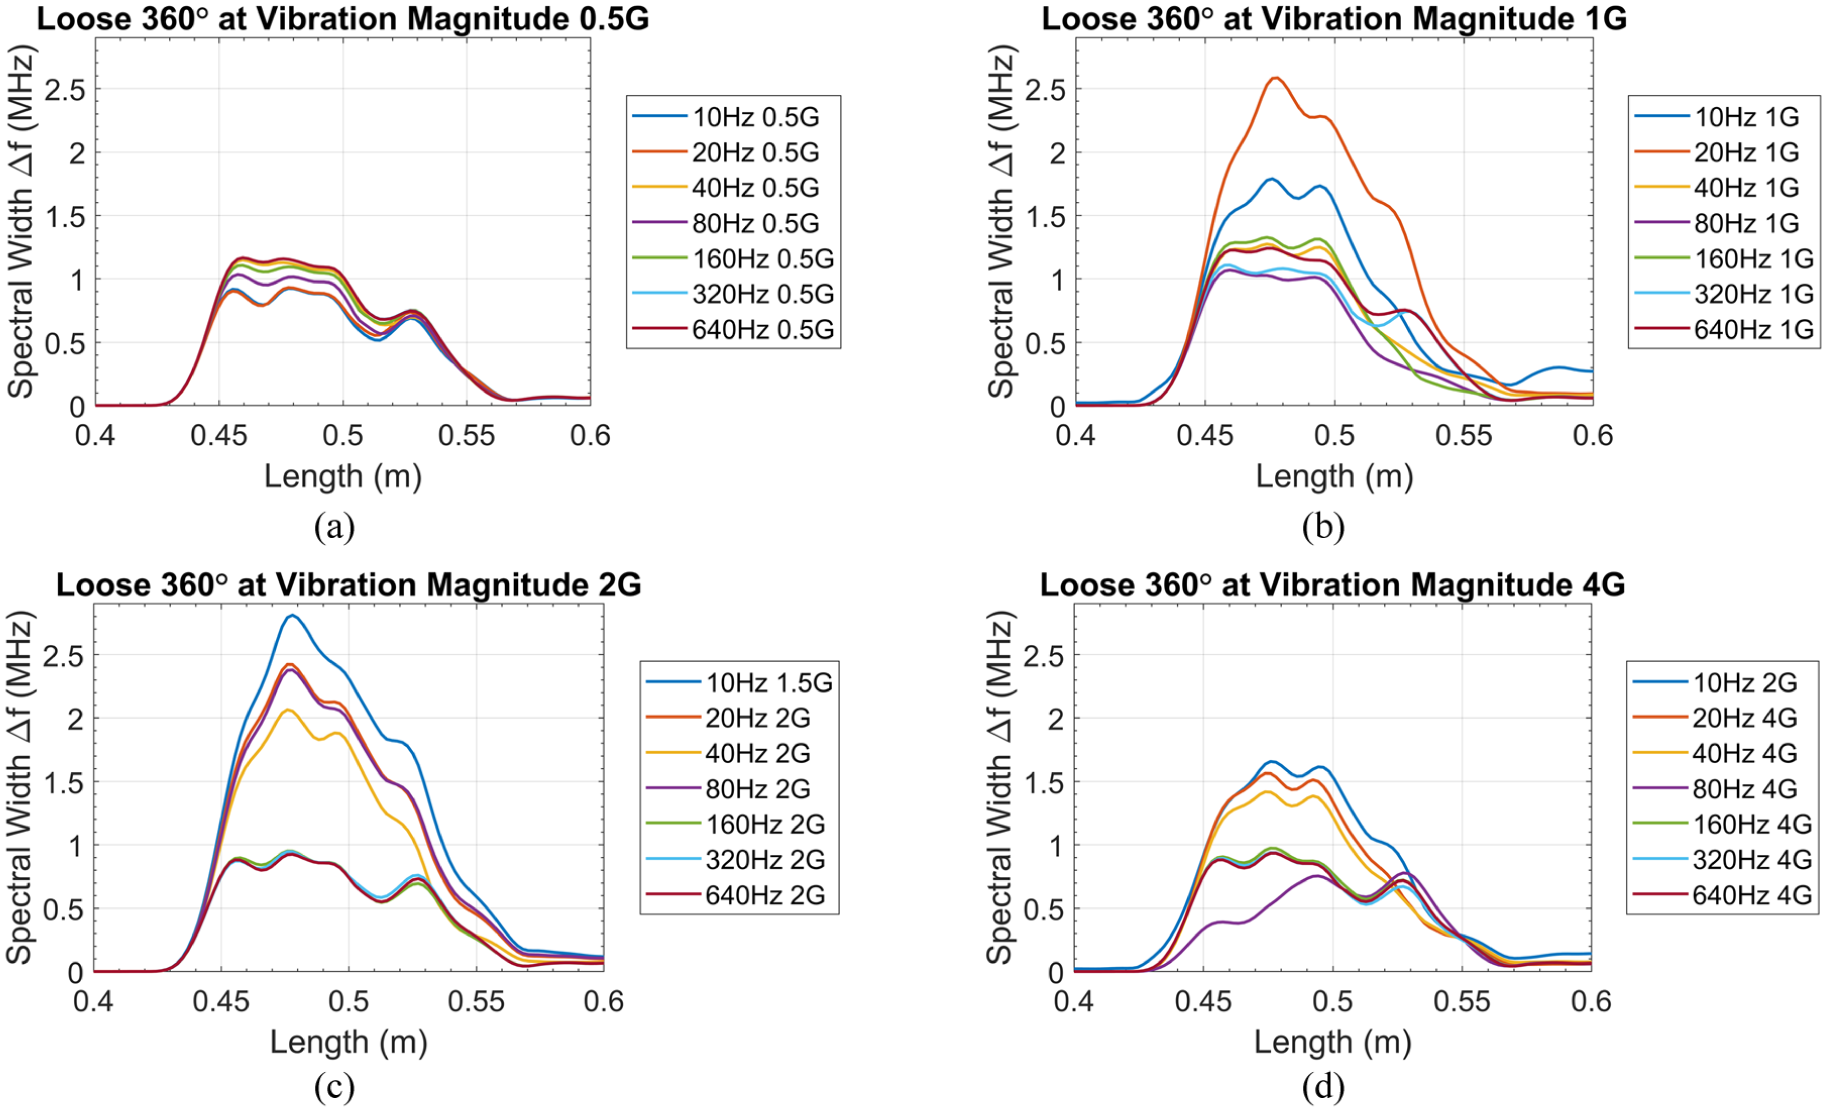
Distributed vibration sensing of the cable connector loosened by 360° (a–d).
As Figure 13 shows, vibration frequency and magnitude have a significant effect on distributed vibration sensing of the reflected signals, meaning that vibration of loose cable connector by 360° leads to significant signal distortion, when exposed to vibration. The direct S11 response from a cable connector loosened by 360° exposed to vibration showed fluctuating magnitude with increase in vibration frequency and magnitude, making it impossible to identify the effect of the loose connection. In contrast, distributed vibration sensing proved to be effective in filtering the noises and identifying loosened by 360° connection effect. Distributed sensing of S11 parameter shows increase at 0.5G vibration magnitude and consistent decrease at 1G, 2G, and 4G vibration magnitudes as seen in Figure 14(a) to (d).
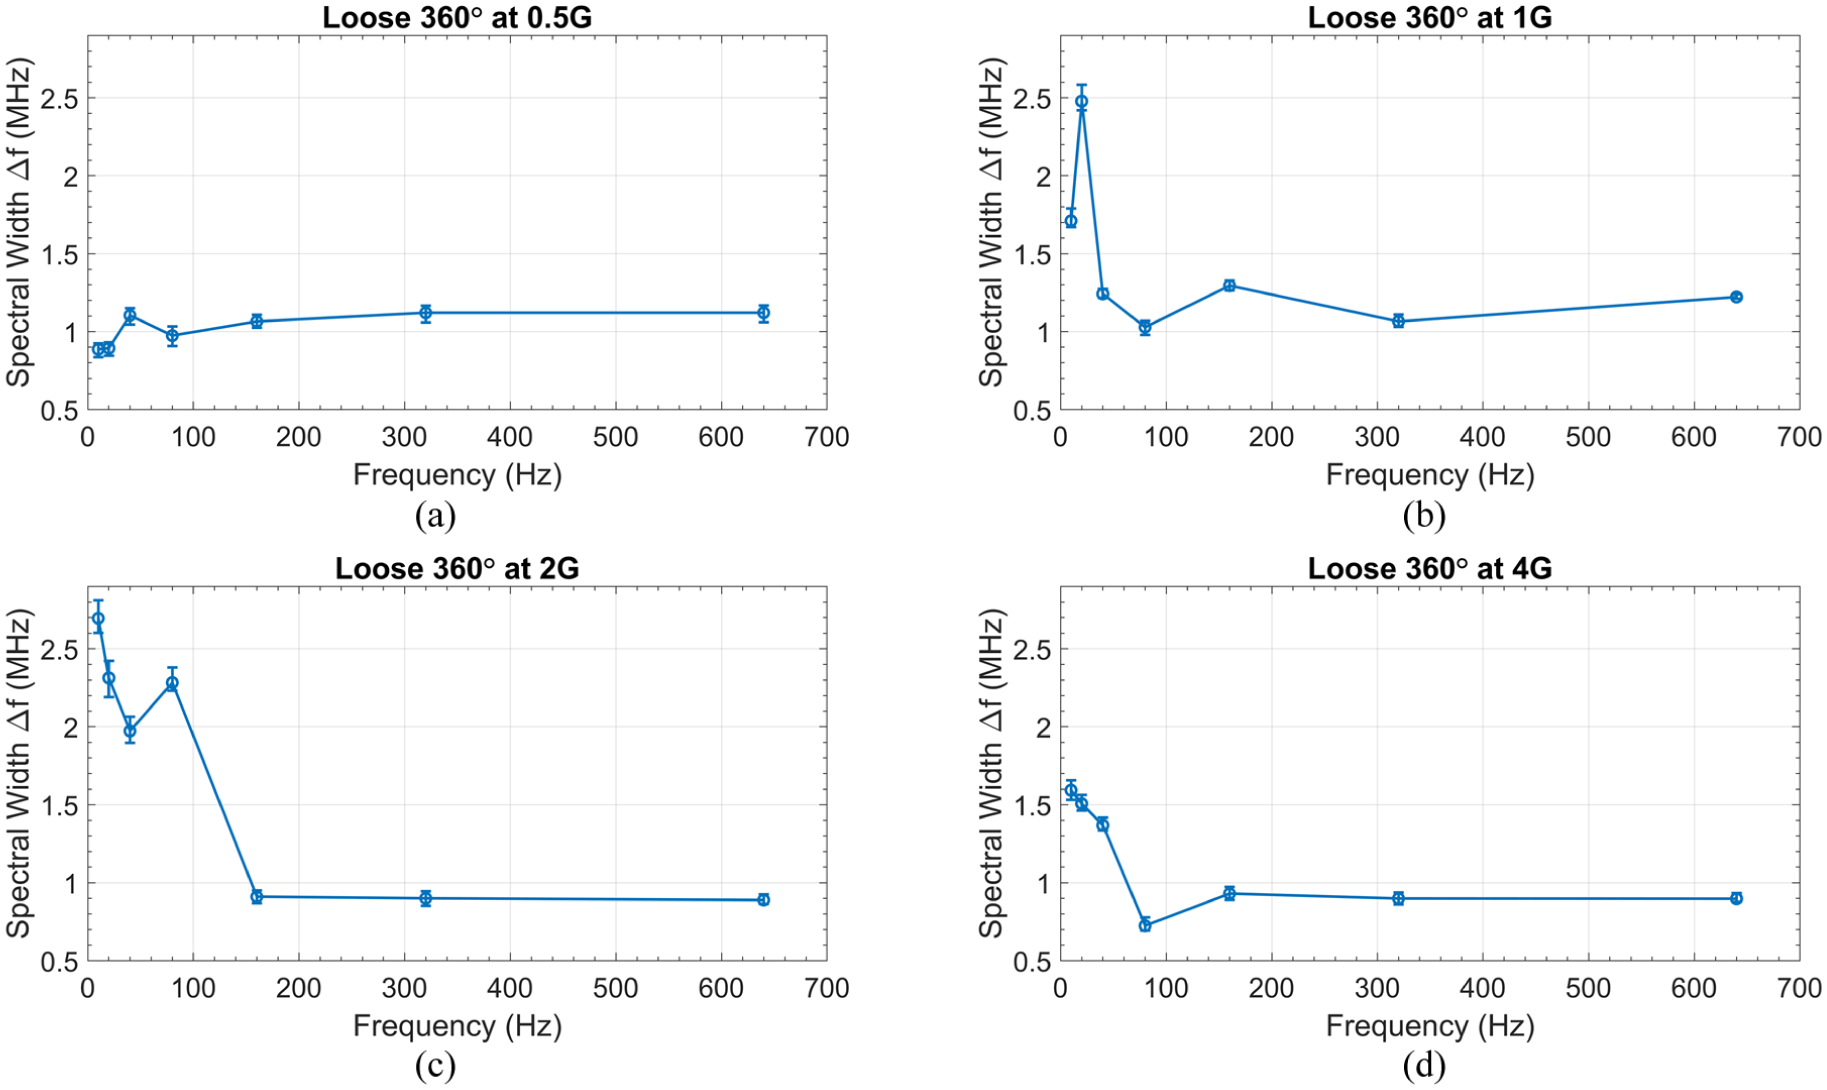
Distributed vibration sensing response for the loose cable connector by 360° as a function of vibration frequency (a–d).
Figure 14(a) to (d) shows spectral width changes over vibration frequency at four vibration magnitudes. Spectral width increases nonlinearly with increase in vibration frequency at 0.5G (Figure 14(a)) vibration magnitude and decreases nonlinearly with vibration frequency at 1G (Figure 14(b)), 2G (Figure 14(c)), and 4G (Figure 14(d)) vibration magnitudes. This phenomenon is due to vertical downward orientation of the cable connector, where gravitational force coupled with the effect of vibration, leading to tightening of the loose connection. This transient tightening can momentarily improve the electrical contact between connector interfaces, resulting in a temporary reduction in spectral width and an apparent improvement in signal transmission. In contrast, a properly fully tightened connector provides the most stable electrical contact and therefore the most reliable signal transmission. This behavior does not indicate that a loose connection performs better than a fully tightened one. Rather, it reflects a dynamic mechanical interaction under vibration, where the connector position changes during resonance or vibration cycles. If the cable connector was oriented upwards, the opposite distributed response would be observed that eventually would lead to complete disconnection of the cable connector and loss of communication. The highest distributed sensing response over vibration frequency was observed at 0.5G vibration acceleration followed by 1G, 2G, and 4G. As shown by distributed sensing, significant increases—like the trends in Figure 14—indicate that cable connection loosening is critical. Regular inspection of cable connections is essential to preventing open circuit, arc faults, intermittent faults, or even fire in the system.
The combined effect of vibration frequency and magnitude on distributed vibration sensing of the loosened by 360° cable connector is shown in Figure 15.
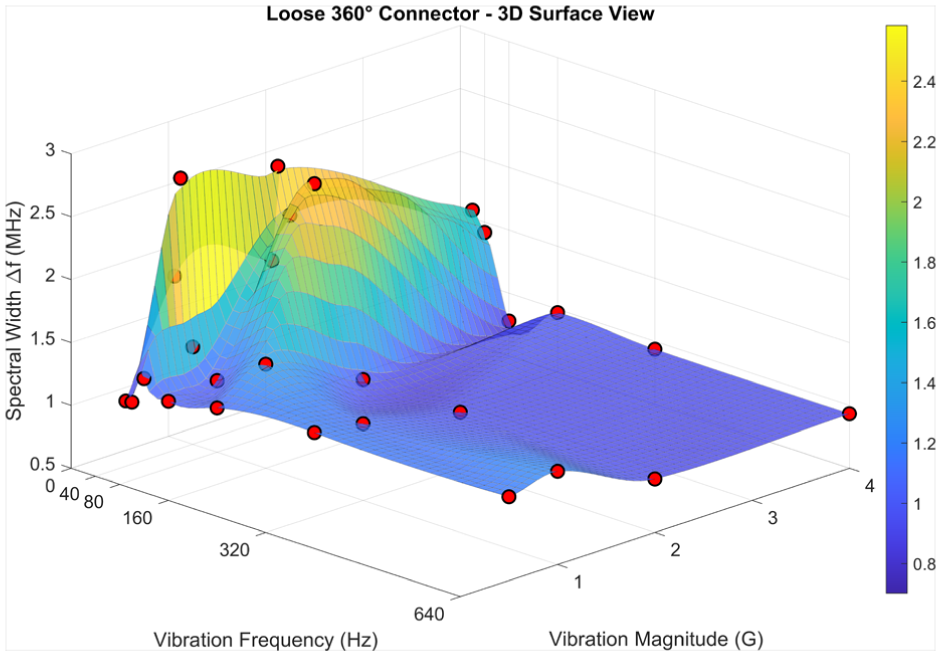
Distributed vibration sensing over vibration frequency and magnitude of the loose cable connector by 360°.
Figure 15 shows spectral width magnitude change over vibration frequency at four vibration magnitudes for a 360° loosened connector. Distributed sensing of S11 parameter shows a significant spectral width variation with both vibration frequency and magnitude for the 360° loosened connector. The spectral width shows fluctuations at lower vibration frequencies with maximum values reaching from 0.7 to 2.8 MHz at around 80 Hz and all vibration magnitudes. The surface plot reveals that the spectral width decreases sharply with increasing vibration frequency at 1G, 2G, and 4G and increases significantly with vibration magnitude, particularly in the 40–160 Hz range. At higher frequencies (320–640 Hz), the spectral width stabilizes at lower values (∼0.8–1.6 MHz) at 1G, 2G, and 4G vibration magnitudes. This extreme loosening condition (360°) creates the most severe connector instability, resulting in the highest spectral width variations and indicating critical connection degradation requiring immediate fastening of the connector to prevent communication failure.
Comparative analysis of distributed vibration sensing at fully tightened and loose connector conditions for different cable connectors
Loose connection affects the distributed vibration sensing differently compared to that of fully tightened connection. The magnitude of spectral width change in loose connection is much higher than that of fully tightened connection. The fully tightened and loose connection distributed vibration sensing over vibration frequency at 0.5G, 1G, 2G, and 4G vibration for the cable 3C058A #1 is shown in Figure 16(a) to (d), respectively.
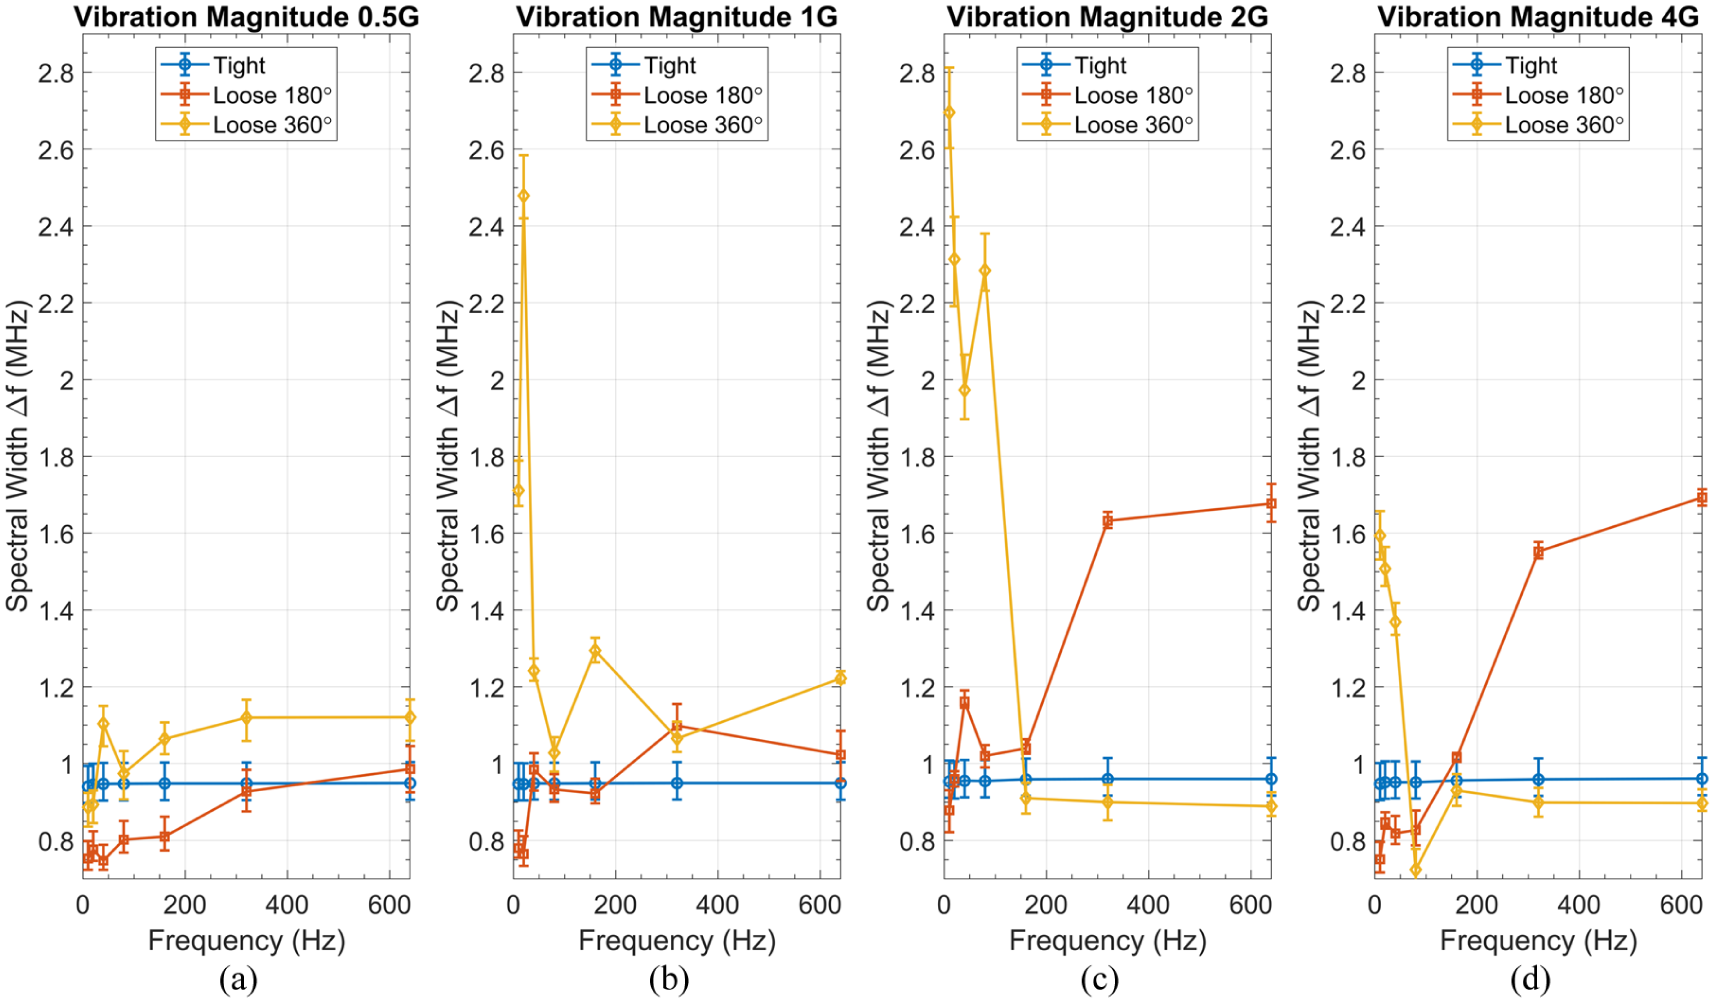
Distributed vibration sensing as a function of vibration frequency for the 3C058A#1 cable connector in fully tightened, 180° loose, and 360° loose conditions (a–d).
As shown in Figure 16(a) to (d), on the plotted scale, the spectral width of the fully tightened connection shows a very small change in magnitude, following an almost linear trend, whereas the spectral width of the loose connection shows large fluctuations across the vibration frequency range. The distributed vibration sensing of the 3C058A#1 cable connector loose by 180° shows exponential increase with vibration frequency. At connector condition loose by 180°, at lower vibration frequencies, fluctuation in spectral width magnitude is observed that is due to resonant modes excited in connector interfaces, leading to periodic opening and closing of microscopic gaps. These mechanical micro-gaps change the characteristic impedance at connection points, which leads to fluctuation in the distributed sensing response amplitude. As the vibration frequency increases, the amplitude of vibration-induced impedance variations increases with less fluctuations due to inertial effects, as the connector’s internal frictional forces function as mechanical dampers, reducing periodic fluctuations in connector interface.
At connector condition loose by 360°, at lower vibration frequencies, fluctuation in spectral width magnitude is observed that is due to resonant modes excited in connector interfaces, leading to periodic opening and closing of microscopic gaps as in the case of connector loose by 180°. At 1G, 2G, and 4G vibration magnitudes, as the vibration frequency increases, the amplitude of vibration-induced impedance variations decreases with fewer fluctuations; consequently, the spectral width decreases as seen in Figure 16(a) to (d). This phenomenon is due to vertical downward orientation of the cable connector, where gravitational force coupled with the effect of vibration leads to tightening of the loose connection when connector enters resonance with the vibration. If the cable connector was oriented upwards, opposite distributed response would be observed that eventually would lead to complete disconnection of the cable connector.
Likewise, the effect of a loose connection was investigated for the remaining two 3C058A cables; a comparative analysis of their distributed vibration sensing results is provided in the Supplementary Material.
The fully tightened and loose connection distributed vibration sensing over vibration frequency at 0.5G, 1G, 2G, and 4G vibration magnitude for the commercial RG400 #3 cable is shown in Figure 17(a) to (d), respectively.
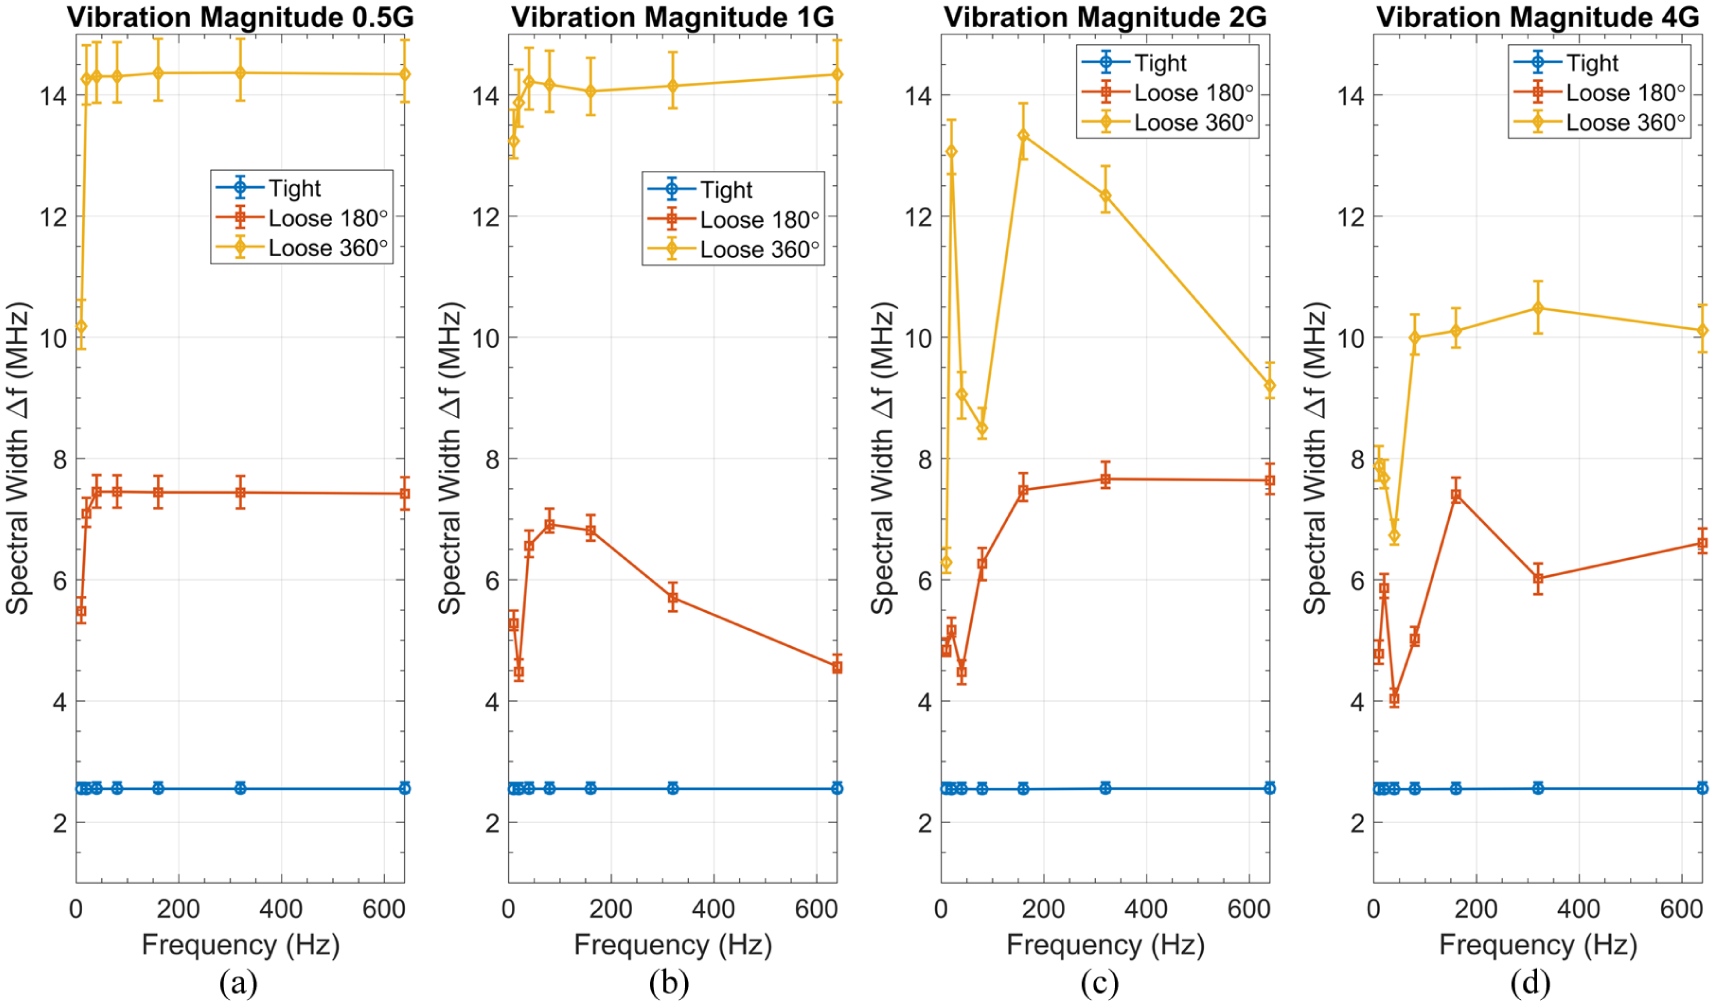
Distributed vibration sensing as a function of vibration frequency for the RG400#3 cable connector in fully tightened, 180° loose, and 360° loose conditions (a–d).
As Figure 17(a) to (d) shows, spectral width at fully tightened cable condition follows a linear trend with negligible increase in magnitude with vibration frequency at all vibration magnitudes. The highest spectral width magnitude is observed at the 360° loose connection, with the highest magnitude occurring at 0.5G vibration (Figure 17(a)), followed by 1G (Figure 17(b)), 2G (Figure 17(c)), and 4G (Figure 17(d)). At 0.5G vibration, spectral width change over vibration frequency follows exponential form of a cosine.
As vibration magnitude increases from 0.5G to 1G, spectral width begins to exhibit minor fluctuations with a slight decrease at 1G and 160 Hz vibration. At 1G and 20 Hz vibration, a sharp decrease is followed by exponential increase, which decreases again and then shows consistent decrease after 80 Hz vibration frequency. This decrease occurs because it was observed during the experiment that at these vibration magnitudes and frequencies, the connector enters resonance and begins to turn toward the tightening direction, resulting in better signal transmission. This behavior is attributed to the connector being attached in a vertical downward orientation with vibration excited along the cable axis.
At 2G vibration, the 360° loose connector showed the highest spectral width magnitude, followed by the 180° loose connector response. The 180° loose connector’s distributed sensing response at 2G vibration showed a sharp increase and then decreased up to 40 Hz vibration frequency, followed by exponential increase with vibration frequency. At the 360° loose connection, sharp significant fluctuations in spectral width over vibration frequency are observed, which result from the connector entering resonance and rotating left and right during vibration exposure.
The same scenario was observed for the 180° loose connector at 4G vibration, where continuous fluctuations occurred across all tested vibration frequencies. At 4G vibration for the 360° loose connector, spectral width showed a sharp decrease up to 40 Hz vibration frequency, followed by sharp increase up to 80 Hz, then moderate increase up to 320 Hz with slight decrease up to 640 Hz.
Likewise, the effect of a loose connection was investigated for the remaining two RG400 cables; a comparative analysis of their distributed vibration sensing results is provided in the Supplemental Material.
Influence of loose connection and connector orientation
The unexpected decreases and fluctuations in spectral width magnitude over vibration frequency in the distributed sensing response shown in the figures above highlight the crucial role of connector tightening in communication integrity. These effects are caused by the connector entering resonance and rotating left and right during vibration exposure or rotating toward the fastening direction due to the vertical downward orientation of the connection. If the connection were oriented in reverse (upside down), this would lead to loosening of the connection up to complete disconnection and loss of communication. However, if the cable were oriented horizontally with vertical exposure to vibration, it would result in left or right rotation, leading to continuous noise induction during vibration exposure.
Implications for loose connection identification
The distributed vibration sensing analysis demonstrates that spectral width can serve as a reliable diagnostic indicator for loose connection identification. Fully tightened connections exhibit minimal spectral width changes following a nearly linear trend across all vibration frequencies and magnitudes, providing a stable baseline. In contrast, loose connections show substantially higher (or lower depending on cable type) spectral width magnitudes with characteristic fluctuation patterns due to resonant modes that excite periodic micro-gap variations at connector interfaces, creating detectable impedance changes through spectral width monitoring.
The critical role of connector orientation significantly impacts loose connection identification capabilities. Vertical downward orientation can lead to self-tightening effects when loose connections enter resonance, potentially masking the loose connection condition and resulting in false negatives during monitoring. Upward orientation would exacerbate loosening and lead to complete disconnection, while horizontal orientation with vertical vibration exposure creates continuous rotational disturbances that generate persistent noise signatures. For practical implementation, monitoring systems should focus on spectral width magnitude thresholds above (or below) the linear baseline established by fully tightened connections, incorporating multiple frequency ranges to capture the full spectrum of loose connection signatures. The detection algorithm is sensitive to fluctuation patterns and absolute values depending on cable type.
Uncertainty analysis
Experimental measurements inherently contain uncertainty. To account for local signal variation along with the distributed sensing, uncertainties were evaluated based on the three repetitions of the experiment. During vibration, a mean was calculated from the three measurement repetitions. The upper and lower uncertainty bounds were then defined by the absolute maximum and minimum values within.
Uncertainty analysis for the aerospace grade cable 3C058A#1 is shown in Table 2.
Uncertainty analysis for the aerospace grade cable 3C058A#1.
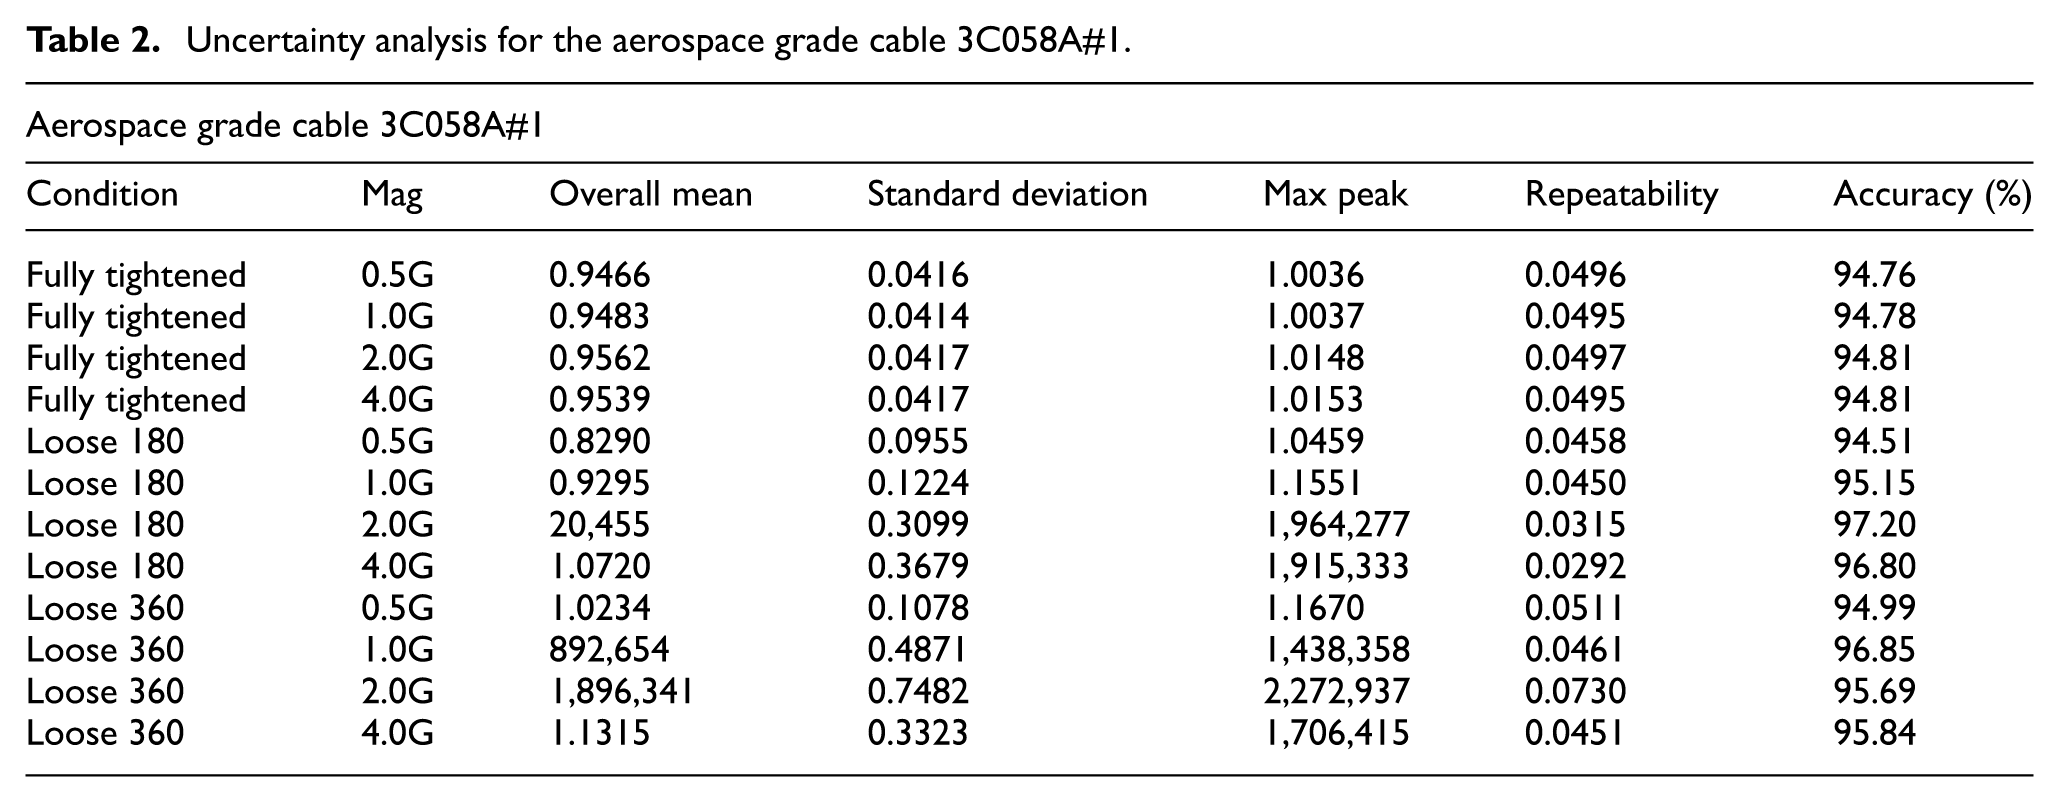
Table 2 presents a statistical summary of the distributed vibration sensing performance across different connector conditions and acceleration magnitudes. Key evaluated parameters include the overall mean and standard deviation of the spectral width, maximum peak responses, true measurement repeatability, and the resulting overall accuracy. As observed in the data, the fully tightened condition exhibits highly stable and precise signal responses, characterized by consistently low standard deviations across all vibration levels. In contrast, the loose 360° condition allows for greater physical displacement of the cable, resulting in significantly higher signal variations and standard deviations. Because the unconstrained physical movement in the 360° condition produces substantially larger spectral shift amplitudes, these amplified peaks yield a higher signal-to-noise ratio (SNR) and more easily surpass predetermined detection thresholds. This phenomenon is due to vertical downward orientation of the cable connector, where gravitational force is coupled with the effect of vibration, leading to tightening of the loose connection.
Uncertainty analysis for the commercial grade cable RG400#1 is shown in Table 3.
Uncertainty analysis for the commercial grade cable RG400#1.
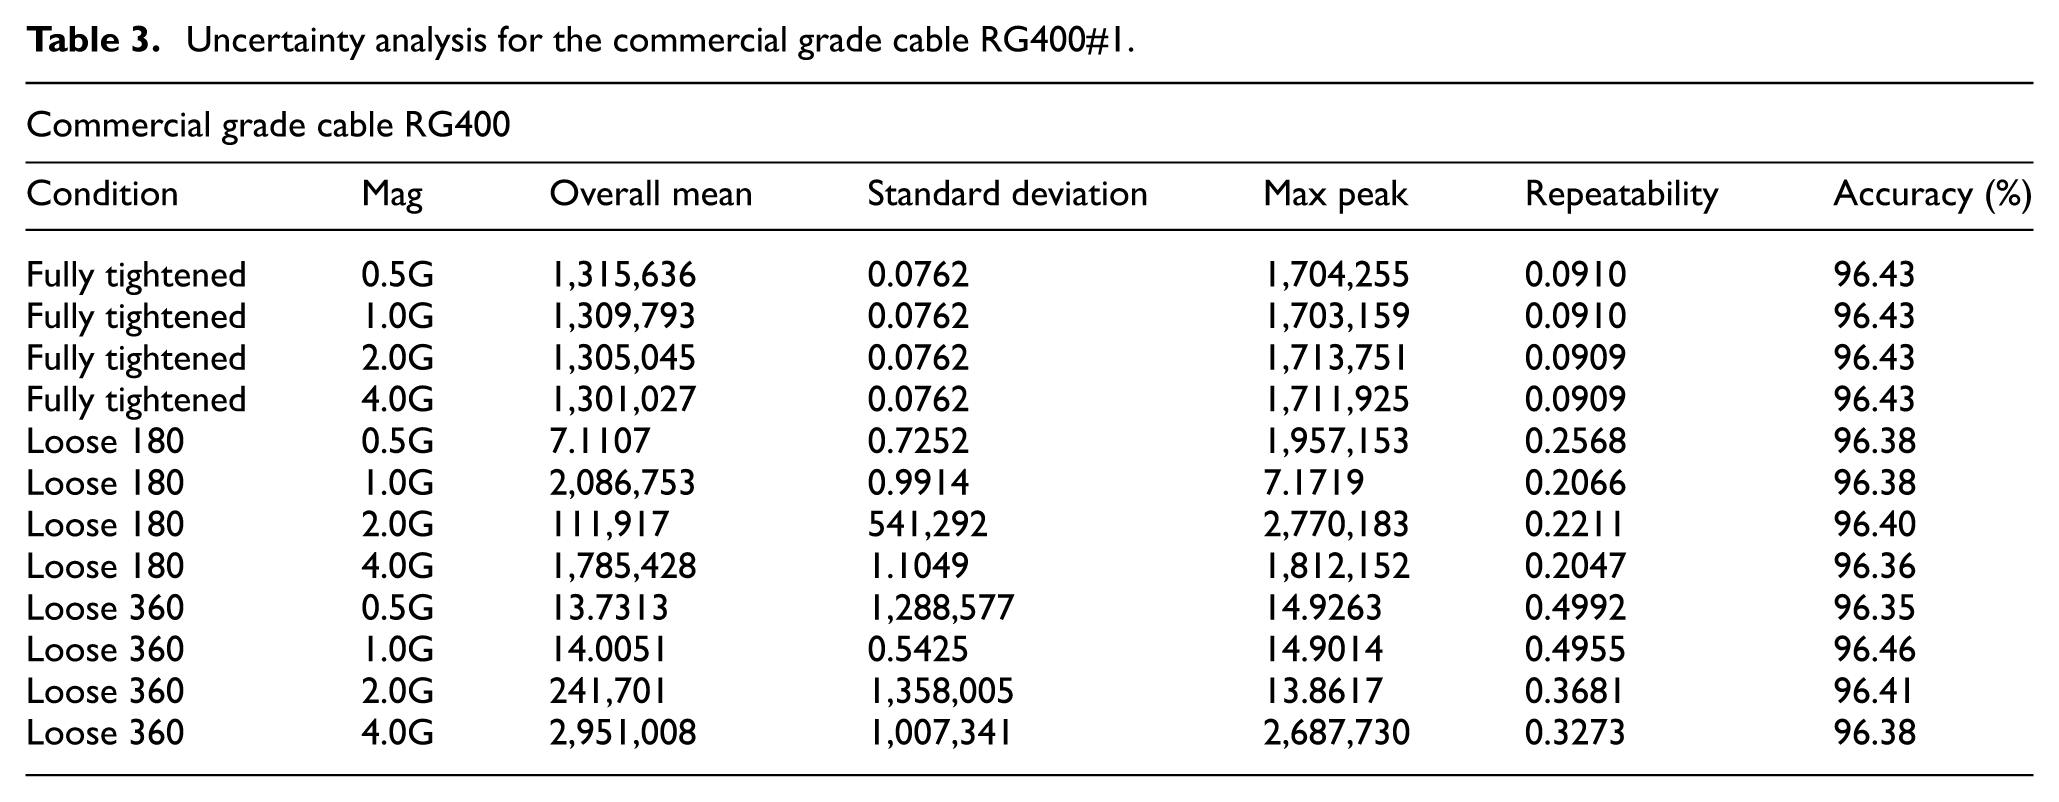
Table 3 presents a statistical summary of the distributed vibration sensing performance across different connector conditions and vibration magnitudes. As observed, the mechanically unconstrained nature of the loose 180° and 360° conditions leads to significantly higher overall signal means and maximum peak responses compared to the fully tightened connection responses. While this increased freedom of movement naturally introduces higher signal variance (standard deviation) and reduces true repeatability, the overall detection accuracy remains remarkably stable at approximately 96.4% across all tested scenarios. This consistency demonstrates the high robustness of the sensing algorithm, highlighting its capability to maintain reliable vibration detection regardless of the physical constraints on the cable.
The VNA is a high-precision laboratory instrument used in this study to experimentally validate the proposed distributed sensing concept. In practical aerospace applications, the implementation of the proposed method would not require a laboratory-grade VNA. Instead, the sensing approach can be realized using a compact reflectometer or integrated monitoring unit designed for wiring health monitoring. Such systems can be used either on the ground during aircraft maintenance or onboard integrated into the aircraft avionics testing systems. In these configurations, periodic signal transmission and analysis can be used to monitor variations in the reflected signal and identify vibration-induced connector loosening before catastrophic failure occurs.
Conclusion
This work investigated the effect of vibration-exposed loose connectors on the distributed sensing response of reflected signals (S11) in three aerospace-grade (3C058A) and three commercial-grade (RG400) coaxial cables. Sinewave signals from 9 kHz to 5 GHz were transmitted under connector conditions of fully tightened, 180° loose, and 360° loose, while subjected to vibration frequencies of 0–640 Hz and acceleration levels of 0.5–4G. The key findings are summarized as follows:
Fully tightened connectors exhibited negligible changes in S11 magnitude, with spectral width confined between 0.995 and 1.018 MHz. The distributed vibration response increased rapidly up to approximately 80 Hz, gradually from approximately 80 to approximately 320 Hz, and plateaued above approximately 320 Hz. In contrast, loose connections showed large fluctuation across the vibration frequencies and magnitudes.
In aerospace-grade cables, 180° loosened connectors showed spectral width increases that followed an exponential cosine trend with vibration frequency. At 360° loosening, spectral width increased nonlinearly at 0.5G but decreased at higher vibration levels (1–4G) due to gravitationally induced tightening. Aerospace-grade cable 3C058A#1, with 180° loosened connectors, showed spectral width increases that followed exponential cosine trend with vibration frequency. At 360° loosening connector, the spectral width increases nonlinearly at 0.5G but decreases at higher vibration magnitudes (1G, 2G, and 4G) due to the vertical downward orientation, where gravitational force coupled with vibration causes tightening of the connector.
Commercial-grade RG400 cables demonstrated significantly larger spectral width variations than aerospace-grade cables, reflecting their less stringent manufacturing standards, while aerospace-grade cables comply to stricter standards. RG400#1 reached highest spectral width at 180° loosening under 4G vibration, with peaks at 80 and 320 Hz under 4G vibration.
Connection orientation played a critical role. At loose cable connectors by 180° and 360°, in vertical downward orientation of cable connectors, vibration often vibration-induced tightening at certain resonance frequencies, whereas an inverted orientation would likely promote further loosening and potential complete disconnection of communication.
Overall, the distributed vibration sensing approach successfully identified loose connections through characteristic spectral width patterns. Fully tightened connections maintained minimal spectral width change, while loose connections exhibited higher spectral width variations with varying fluctuation patterns. It is necessary to track distributed sensing response while the system is under vibration and check for spectral width magnitude changes and fluctuations. The more severe the connector loosens, the greater the fluctuations.
Future work
Future work will focus on demonstrating the feasibility of the distributed vibration sensing approach, and the development of compact embedded hardware for practical applications.
Distributed vibration sensing approach will be investigated using transmitted signals to eliminate the need for integrated or external circuitry.
Supplemental Material
sj-docx-1-shm-10.1177_14759217261439264 – Supplemental material for Distributed vibration sensing for identification of loose connectors in coaxial data transmission lines
Supplemental material, sj-docx-1-shm-10.1177_14759217261439264 for Distributed vibration sensing for identification of loose connectors in coaxial data transmission lines by Saidanvar Esanjonovich Valiev, Anthony C Okafor, Jeremiah J Rittenhouse, Jie Huang and Daniel S Stutts in Structural Health Monitoring
Footnotes
Acknowledgements
The authors acknowledge and thank Abhishek Prakash Hungund for guidance with the distributed sensing approach.
Declaration of conflicting interests
The authors declared no potential conflicts of interest with respect to the research, authorship, and/or publication of this article.
Funding
The authors disclosed receipt of the following financial support for the research, authorship, and/or publication of this article: This research was partially supported by the Missouri University of Science and Technology’s Kummer Institute for Student Success, Research and Economic Development through the Kummer Innovation and Entrepreneurship Doctoral Fellowship.
Supplemental material
Supplemental material for this article is available online.
References
Supplementary Material
Please find the following supplemental material available below.
For Open Access articles published under a Creative Commons License, all supplemental material carries the same license as the article it is associated with.
For non-Open Access articles published, all supplemental material carries a non-exclusive license, and permission requests for re-use of supplemental material or any part of supplemental material shall be sent directly to the copyright owner as specified in the copyright notice associated with the article.