
Abstract
Structural health monitoring (SHM) of civil infrastructure is often challenged by environmental and operational variability, which can mask or imitate damage-induced changes in modal properties. This study evaluates the minimum detectable damage (MDD) of the Magerholm linkspan using a finite element—based sensitivity framework that explicitly accounts for environmental effects and measurement noise. Environmental variability was modeled using a synthetic temperature profile and a two-stage tidal stiffness interpolation scheme derived based on field-identified natural frequency data. Damage was simulated as a reduction in the stiffness provided by one or both of the lifting towers. The detectability of damage was quantified using the probability of detection and receiver operating characteristic curves derived from Mahalanobis distance-based damage indices. Results show that tidal variations exert the strongest environmental effect on natural frequencies, yielding a significantly higher MDD compared to temperature alone. When both effects were combined, MDD increased further, and the introduction of noise to the extracted frequencies caused a substantial reduction in detectability, with MDD rising from 22% in the noiseless case to over 35% with 3% noise. Under asymmetric damage conditions affecting a single tower, the frequency changes are more subtle, leading to reduced detectability. Moreover, the MDD increases sharply with noise to above 50% at 3% noise—highlighting the strong noise sensitivity of asymmetric configurations. However, detectability improved when modes with low stiffness sensitivity were excluded. Overall, the study demonstrates the strong impact of environmental variability and noise on the detectability of damage in linkspans and provides practical insights into achievable MDD thresholds for lifting towers using vibration-based SHM.
Keywords
Introduction
Motivation
Linkspans are critical coastal structures that serve as adjustable bridges for ferry operations, providing a flexible connection between ferries and shore-based infrastructure. The safe operation of linkspans is vital for both maritime logistics and passenger transport, as structural deterioration can compromise service continuity and lead to severe safety risks.1,2 Marine and coastal facilities—including linkspans, ferry terminals, movable spans, and coastal bridges—are characterized by low redundancy; a single failure can cause disproportionate disruption. Their exposure to harsh environmental conditions, cyclic loading, intense impacts, and constant operational demands makes structural health monitoring (SHM) strategically essential.
As a representative case, this study focuses on the Magerholm ferry quay, which forms part of Route 60 connecting Magerholm and Sykkylven. This route is a critical transport link within the Møre og Romsdal region, serving up to 2500 vehicles per day.
3
The quay consists of two primary components: a steel linkspan, also called
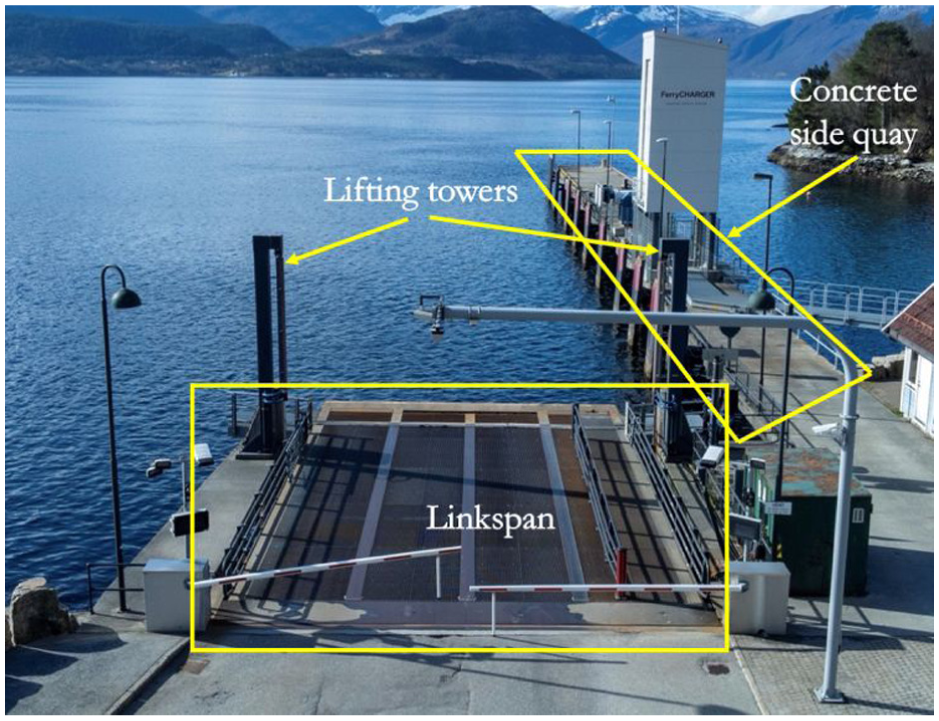
Magerholm linkspan.
Because the quay must operate under varying tidal conditions, the docking bridge is supported and adjusted in height by lifting towers, which connect to a lifting beam beneath the deck. Additional support is provided at the abutment, where conical fenders absorb berthing forces from incoming ferries. Once a ferry is securely locked with the linkspan front beam, the lifting towers disengage their jacks, and the vessel itself temporarily becomes the vertical support for the linkspan. This structural arrangement, combined with demanding operational schedules and the harsh coastal environment, makes the Magerholm linkspan an ideal case study for investigating SHM under realistic operational and environmental conditions.
In recent years, several incidents have underscored the vulnerability of linkspan lifting systems. During a severe storm in January 2024, the deck at the Magerholm ferry quay detached from its towers and sank, requiring extensive salvage and repair operations. 4 While the root cause remains uncertain, the event illustrated how degradation or malfunction in tower components can escalate into full structural failure. Comparable deck separations and collapses have occurred at other ferry terminals,5,6 highlighting that this is not an isolated case but a recurring challenge for aging linkspan infrastructure. These observations underscore the need for early detection mechanisms that can identify stiffness loss or alignment degradation in lifting systems before failure propagates into catastrophic collapse.
Early approaches to maintaining these facilities relied on periodic inspections, but SHM has since evolved into continuous monitoring frameworks, particularly following the construction of large-scale sea-crossing projects and long-span bridges where safety and reliability are critical. 7 Continuous monitoring enhances safety by enabling near-real-time detection of abnormal responses, supports informed maintenance planning, and reduces unnecessary interventions by targeting deterioration where it occurs.8–10
Building on this capability, early detection of structural damage is especially critical for coastal and maritime infrastructure like linkspans, where deterioration can accelerate rapidly under the combined effects of corrosion, fatigue, and cyclic environmental loading. Once local damage initiates, it tends to propagate quickly in such harsh conditions, leading to increased operational risk and potentially costly service interruptions. Detecting these changes at an early stage enables timely intervention before safety or functionality is compromised, minimizing downtime and maintenance expenditure. Among various SHM techniques, vibration-based approaches are particularly easy to implement, as they can identify subtle stiffness reductions through shifts in modal properties without requiring direct access to the structure.
Vibration-based SHM
Vibration-based approaches rely on changes in modal properties such as natural frequencies, mode shapes, and damping ratios to infer stiffness reductions and other deterioration. 11 Their advantages include non-invasiveness, global coverage, and relatively low cost. For linkspans and other movable or semi-floating systems, vibration-based methods are particularly attractive because they provide system-level information without requiring intrusive inspection.
Over the past decades, a wide range of vibration-based damage detection methods have been developed. Early comprehensive work by Doebling et al. 12 provided an overview of approaches based on variations in basic modal parameters and discussed their dependence on test data, sensor placement, and linear modeling assumptions. Later reviews expanded the scope to more complex cases. Sekhar 13 focused on detecting multiple cracks in beams and rotating components, emphasizing that the largest crack tends to dominate the response and highlighting the potential of advanced signal-processing tools such as wavelet and Hilbert–Huang transforms for improved sensitivity. Sinou 14 examined vibration-based damage detection in both civil and mechanical systems, identifying unresolved challenges related to environmental variability, damping changes, and modeling uncertainties. Fan and Qiao 15 classified vibration-based methods into frequency-, mode-shape-, curvature-, and combined approaches, demonstrating through finite element (FE)-based studies that although localization is relatively mature, reliable quantification of damage severity remains a major challenge. Subsequent studies, such as Katunin, 16 further explored wavelet-based analysis of modal curvatures, particularly for composite structures, emphasizing the influence of measurement noise and boundary conditions.
More recently, the integration of data-driven approaches has gained momentum. Avci et al. 17 reviewed the use of machine learning and deep learning in vibration-based damage detection, noting their potential for automatic feature extraction and classification.
However, the main challenge of vibration-based SHM is that its sensitivity to minor stiffness reductions is often masked by environmental and operational variability (EOV), including temperature fluctuations, changing boundary conditions, wind, and traffic loading. 18 Changes in these factors can cause shifts in modal properties of comparable or even greater magnitude than those caused by early-stage damage, making it difficult to establish reliable thresholds for damage detection. This challenge is especially pronounced in marine environments, where environmental variability directly influences both structural materials and boundary conditions.
Environmental influence in SHM
The EOV factors can shift modal frequencies and damping by amounts comparable to, or larger than, those induced by small-scale structural deterioration, thereby masking true damage and inflating false alarms. Sohn 18 framed this challenge and surveyed normalization strategies that attempt to separate benign variability from damage effects using statistical modeling, time-series methods, and feature normalization. The central message is that any damage indicator must be interpreted relative to an environment-conditioned baseline; otherwise, the probability of detection decreases while the probability of false alarm increases.
Subsequent reviews have cataloged EOV sources and countermeasures, emphasizing that temperature is often the dominant driver of modal drift in civil structures, followed by wind and operational loads. These influences can be nonlinear and seasonally nonstationary. Mitigation strategies span physics-based corrections, regression with environmental covariates, subspace or Principal component analysis (PCA)-based projection to remove low-rank trends, and machine learning methods such as domain adaptation and transfer learning for more complex relationships. 19
Case studies on long-span bridges have demonstrated practical approaches to modeling and compensating for environmental effects. For instance, work on the Tamar Suspension Bridge modeled frequency variability as a function of temperature and wind using PCA to capture dominant environmental trends and polynomial meta-models to describe input–output relationships, identifying temperature as the largest contributor. 20 On the physics side, temperature influences both geometry/constraint conditions (e.g., expansion, support settlement) and material properties. Temperature-dependent steel models from National Institute of Standards and Technology (NIST) – U.S. Department of Commerce formalize these mechanisms by describing elastic modulus, yield strength, and post-yield hardening as functions of temperature and strain rate, enabling FE-based simulation of thermal effects. 21
In marine structures such as linkspans, tidal variation is particularly important. Tides modify effective boundary conditions by altering support height and stiffness, leading to systematic shifts in modal frequencies.22,23 In the Magerholm linkspan, Sibille et al. 24 reported a strong inverse linear correlation between tidal level and the first vibration mode identified from operational modal analysis.
Damage detectability and the concept of minimum detectable damage
Recent SHM studies have formalized minimum-change detectability directly in terms of the smallest parameter change that can be resolved under uncertainty, rather than inferred from visual separation of healthy and damaged feature distributions. Marsili et al. 25 proposed a Bayesian framework in which the minimum detectable change is derived from posterior uncertainty and a predefined decision threshold, without requiring data from the damaged state. Mendler et al. 26 introduced a reliability-based formulation linking feature sensitivity, statistical variability, and prescribed false alarm and detection probabilities, explaining why small stiffness losses may remain undetectable under dominant environmental or measurement uncertainty. Similarly, Jahangiri et al. 27 defined minimum observable damage via Receiver Operating Characteristic (ROC) analysis as the damage level required to achieve a target detection performance when modal features are used.
To address the masking effects of EOV, recent SHM research increasingly focuses on damage detectability metrics. A commonly used metric is the damage index (DI), which condenses complex modal information into a single scalar quantity. Rather than directly comparing two high-dimensional modal feature vectors (e.g., natural frequencies and mode shapes at two time instants), outlier detection methods can be used to quantify how different a current modal state is from the undamaged reference. A larger DI indicates greater deviation and, therefore, a higher likelihood of damage.
Various outlier detection methods exist for this purpose, and several well-known approaches were previously applied to the frequency dataset of the Magerholm linkspan. 28 The results demonstrated that the Mahalanobis distance provided the most sensitive quantification of damage for this structure. Accordingly, the present work adopts Mahalanobis distance to compute the DI for all subsequent analyses.
However, even a healthy structure may exhibit a broad range of DI values due to EOV. As illustrated schematically in Figure 2, the distributions of DI for healthy (green) and damaged (red) conditions can overlap significantly, especially when damage is small. This overlap represents the masking effect, where environmental variability conceals early damage indicators.
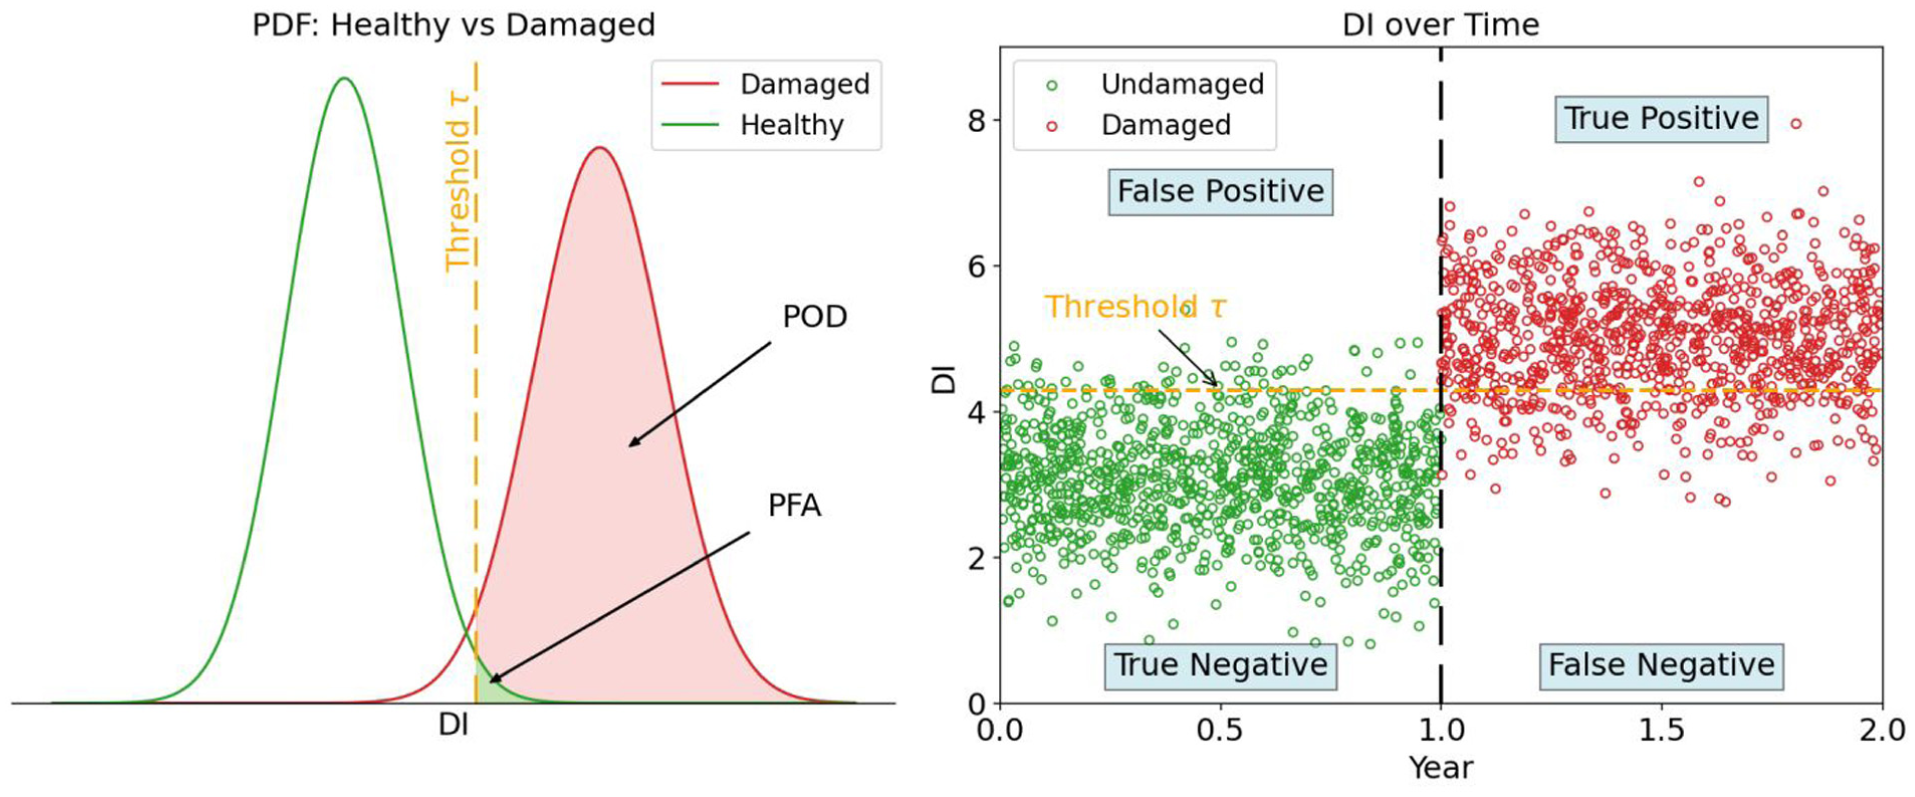
Damage index calculation based on PFA alarm threshold.
To distinguish between these overlapping conditions, a threshold value (τ) is introduced. Any DI exceeding τ is classified as indicative of damage. Selecting τ as the maximum DI from the healthy condition would eliminate false alarms but make detection overly conservative. Instead, a small allowable fraction of healthy-state DIs—defined as the probability of false alarm (PFA)—is permitted to exceed τ. At this same threshold, the proportion of damaged-state DIs exceeding τ defines the probability of detection (POD). The minimum detectable damage (MDD) is then defined as the smallest damage level (κ) that achieves a target POD (e.g., 95%) at a specified PFA (e.g., 5%). The procedure used for defining MDD in the present study can be summarized as follows:
Select target PFA and POD values.
Determine the alarm threshold from the healthy-state DI distribution according to the chosen PFA.
For each κ, compute the POD as the fraction of damaged-state DI values exceeding the threshold.
Identify the MDD as the smallest κ meeting the target POD criterion (Figure 3).
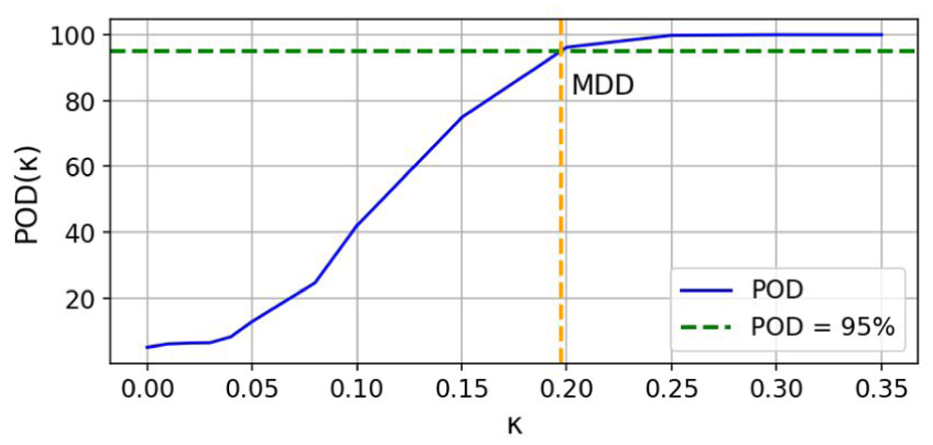
Defining minimum detectable damage.
In summary, the FE-derived natural frequencies are first mapped into scalar DIs using Mahalanobis distance, and the statistical performance of these DIs is evaluated in terms of PFA, POD, and MDD to quantify the detectability of structural damage under realistic environmental variability. This framework was previously demonstrated by Kamali et al. 29 on a simulated 2D steel truss under varying temperature conditions. In this study, the proposed framework is extended to a physical structure—the Magerholm linkspan, accounting for both tidal and temperature influences.
Additionally, ROC curves are used in this study to visualize trade-offs between POD and PFA across thresholds. An example of ROC curve can be seen in Figure 4 that has been obtained by varying the damage parameter- κ. Generally, the closer a ROC curve lies to the upper-left corner, the better the detection performance.30,31
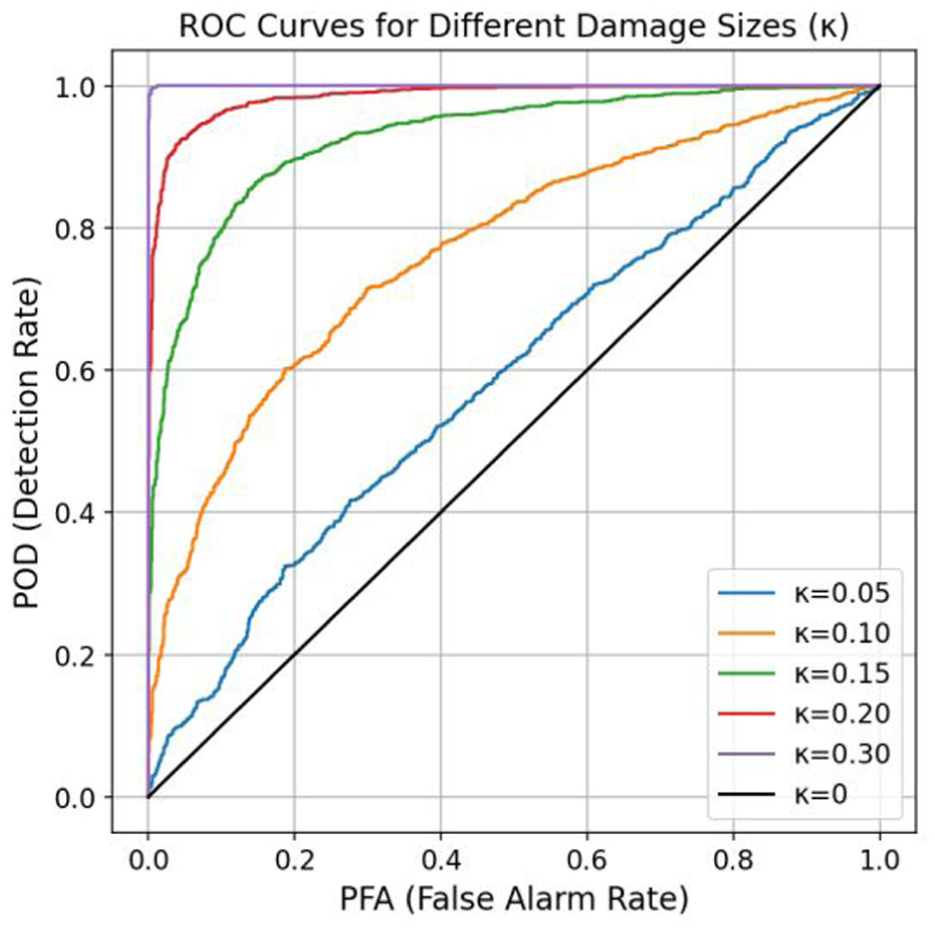
ROC curves of varying damage levels.
Objectives
While environmental effects on SHM have been studied extensively for bridges and offshore platforms,20,32–34 linkspans remain comparatively underexplored, despite their high sensitivity to tidal variability. Few studies address the combined effects of temperature, tide, and measurement noise, and even fewer quantify MDD probabilistically under realistic environmental conditions.
The objectives of this study are therefore to:
Develop an FE-based framework that incorporates realistic tidal and temperature effects into modal simulations,
Quantify MDD using DI distributions, POD analysis, and ROC curves under varying damage levels represented as stiffness loss in lifting towers at different noise levels,
Examine symmetric (stiffness reduction in both lifting towers) and asymmetric (stiffness reduction in only one tower) damage scenarios on lifting towers to evaluate their influence on detection sensitivity.
Through this investigation, the study contributes new insights into the practical limitations and challenges of frequency-based SHM for coastal linkspan structures, providing a more realistic understanding of damage detectability in the presence of limiting factors, namely, environmental variability and noise.
Environmental effects
In the case of Magerholm linkspan, two dominant environmental variables are temperature and tidal level, both of which alter the structure’s modal characteristics. In this study, these effects are incorporated directly into the updated FE model: temperature fluctuation is modeled through its nonlinear influence on the Young’s modulus of steel while tidal variation is represented as a change in the lifting tower spring stiffness.
To quantify the influence of these environmental factors on the Magerholm linkspan’s dynamic response, two separate sensitivity analyses were performed using the updated FE model. The range of each parameter was chosen to visualize the trend of change in the natural frequencies.
Temperature effect: The first analysis varied the Young’s modulus of steel in the range [120,000–260,000] kN/m2, and tracked the resulting changes in 5 selected vibration modes of the updated FE model. 35 These five modes correspond to the five modes that were successfully identified from field measurement data. The results, shown in Figure 5 , indicate that all five natural frequencies increase approximately linearly with a change in Young’s modulus.
Tidal effect: Since tidal level directly alters the effective vertical support conditions of the linkspan by modulating the stiffness provided by the lifting towers, a second sensitivity analysis was conducted to investigate how variations in spring stiffness influence the natural frequencies. The results ( Figure 6 ) show that most modes are affected by spring stiffness changes. Modes 1 and 2 are the most sensitive, particularly when the springs have lower stiffness values. The frequency variation becomes more pronounced for stiffness values below 15,000 kN/m, indicating greater susceptibility at lower spring stiffness. As a result, tidal variations induce a wider variety of changes across different modes, indicating a greater overall impact on the structure’s natural frequencies compared to temperature variations.
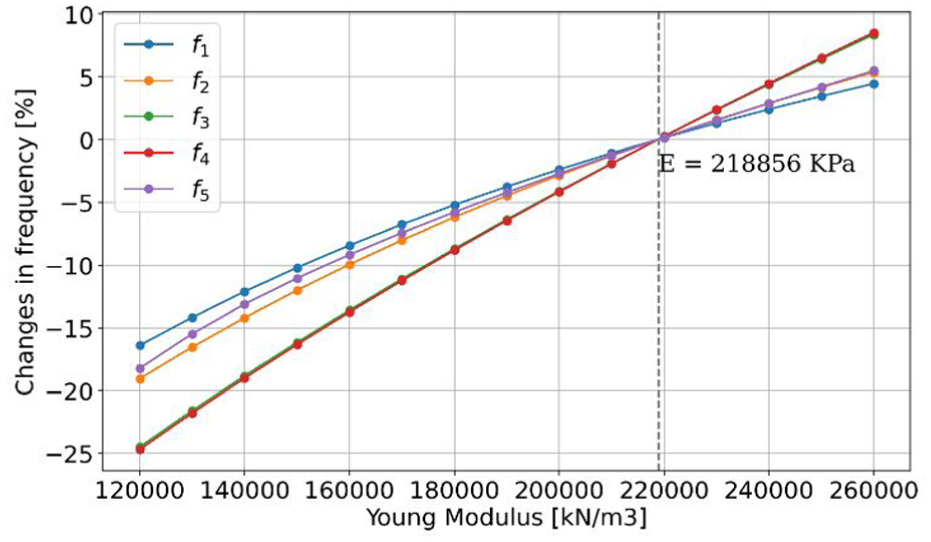
Relationship between Young modulus and natural frequency.
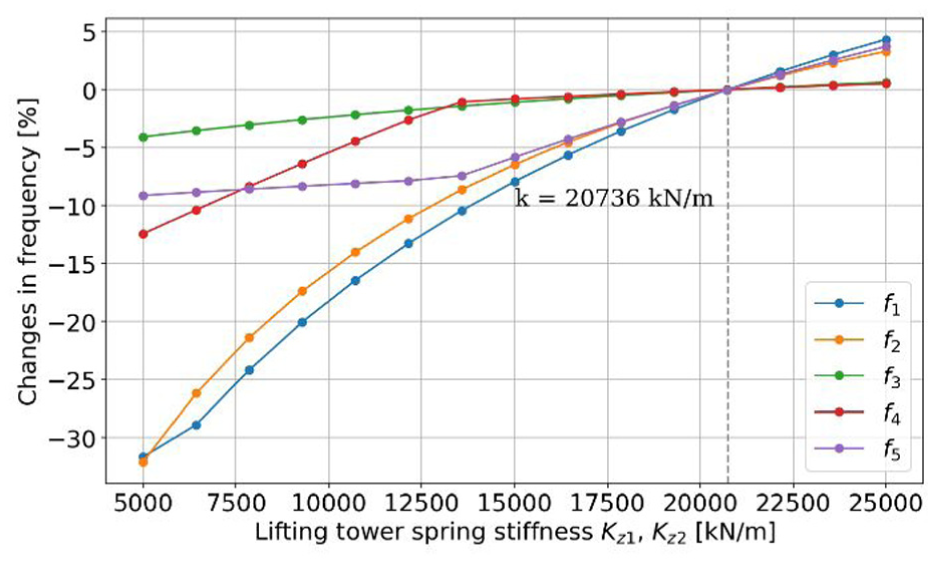
Relationship between lifting towers spring stiffness and natural frequency, k = 20,736 kN/m is the lifting towers spring stiffness value after FEMU process.
Modeling temperature effect
To incorporate temperature variability into the FE simulations, a synthetic climate profile was generated. This profile was deliberately designed to represent an extreme temperature scenario, rather than typical Norwegian conditions, in order to magnify the effect of temperature on the linkspan’s dynamic behavior. Sensitivity studies had shown that with realistic Norwegian temperature ranges (moderate seasonal differences), the frequency shifts were relatively small; therefore, a more severe profile was modeled to explore a worst-case scenario for damage detectability.
The synthetic temperature profile combined an annual and a daily sinusoidal component to represent seasonal and diurnal cycles, respectively, with additional short-term Gaussian fluctuations (σ = 3°C) to capture random variability.
This produced a continuous hourly temperature series for one full year (8760 data points). The profile was down sampled uniformly to 1098 values for computational efficiency providing results presented in Figure 7.
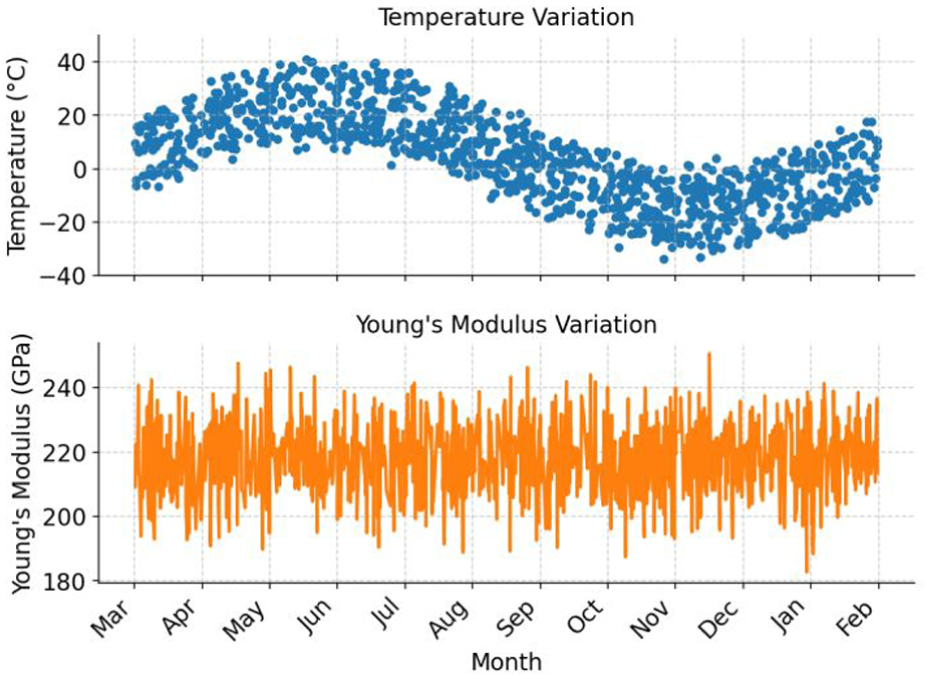
Simulated Norwegian temperature profile and corresponding Young modulus.
The influence of temperature on the structural properties was incorporated by applying a nonlinear relationship between Young’s modulus and temperature, as proposed in Seif et al. 21
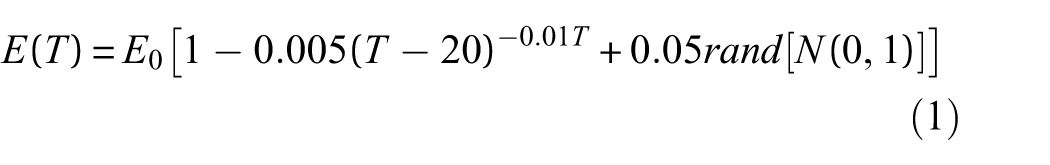
Here, a small stochastic term (5%) was added to reflect uncertainty. Corresponding Young’s modulus variation is shown in Figure 7. It is noteworthy that the fluctuations of Young’s modulus in Figure 7 are largely because of the 5% added uncertainty in Equation (1). Excluding this 5% of variability and considering temperature values alone would result in less variability in Young’s modulus and corresponding natural frequencies.
Modeling tidal effect
In this study, tidal variation is represented as a change in the lifting tower spring stiffness. However, through FE model sensitivity analysis, it is only possible to derive the relationship between the spring stiffness (k) and the first natural frequency (f). Conveniently, the relationship between tidal level h and first natural frequency f was reported by Sibille et al., 24 who utilized data from a permanent monitoring system installed at Magerholm linkspan. 36 Collected data reveals a strong inverse linear correlation (Pearson correlation coefficient r = −0.83) between tidal level and the first identified natural frequency.
It should be noted that this strong inverse correlation cannot yet be regarded as conclusive. Field measurements at Magerholm 35 and another linkspan 37 have shown the presence of two closely spaced modes with similar frequencies and mode shapes, which complicates identification of the “first mode.” On this basis, the relationship observed by Sibille et al. is treated here as a plausible working assumption, while further studies are needed to clarify the influence of such double modes.
In the present study, this measured h-f relationship was combined with the f-k relationship obtained from FE-based sensitivity analysis to create a two-stage interpolation framework. In the first stage, the FE model was used to compute the first natural frequency for a range of lifting tower spring stiffness values (Figure 8(b)), yielding a nonlinear dependency well fitted by the quadratic expression:

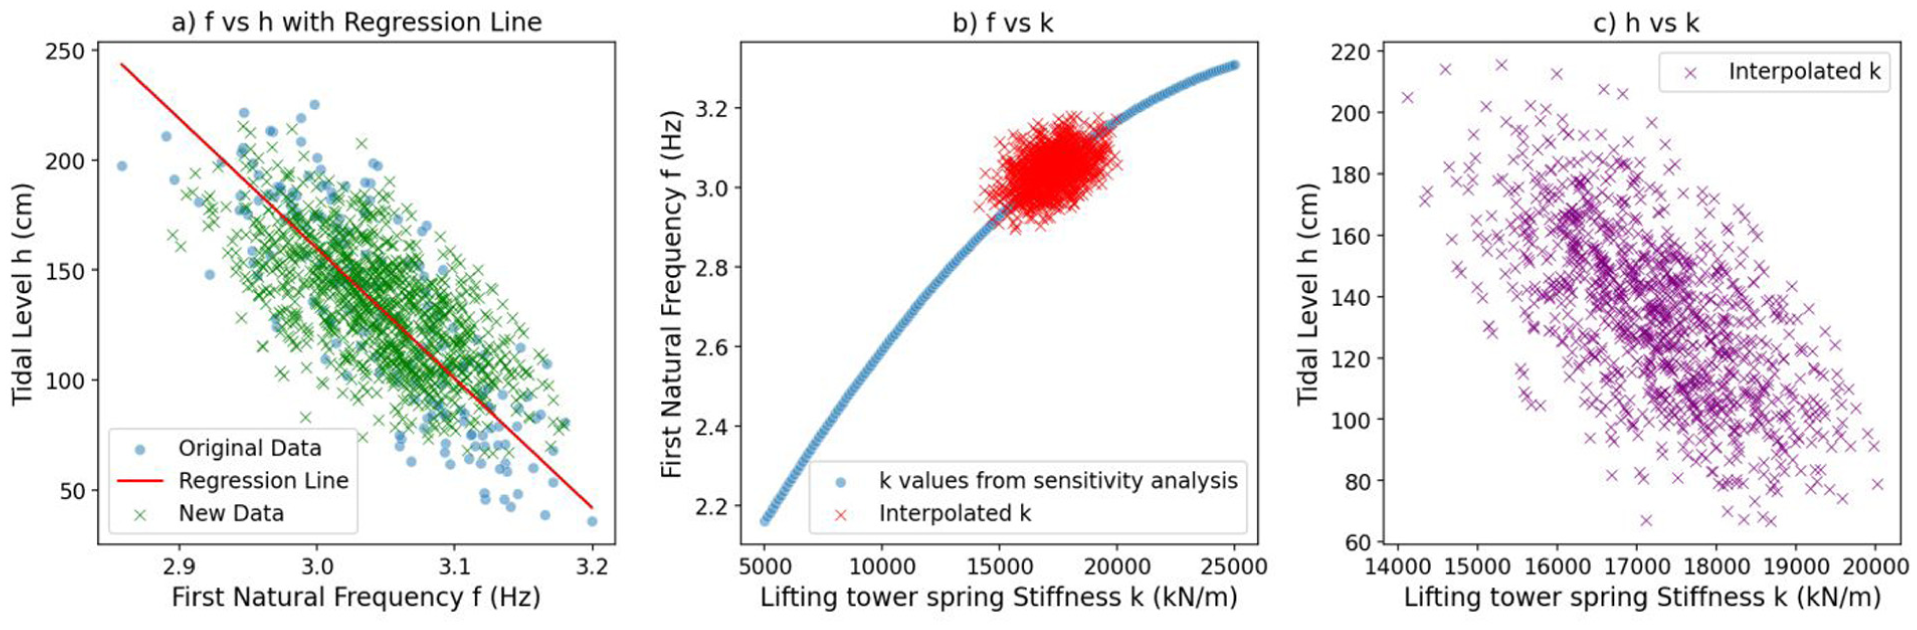
Modeling tidal effect on lifting tower spring stiffness via interpolation (a) Representation of h–f mapping using linear regression and residual resampling to capture scatter in the empirical dataset (b) Mapping from frequency to equivalent spring stiffness via quadratic inversion of the f(k) relationship (c) Interpolated spring stiffness values from the new tidal level dataset.
In the second stage, the empirical h–f dataset reported by Sibille et al. 24 was used. This dataset exhibits a clear linear trend between tidal level (h) and the first natural frequency (f), but with substantial scatter around the trend line. To capture this relationship, a linear regression model was fitted to the dataset, while residual resampling was applied to reproduce the observed statistical variability. This ensured that the simulated frequency values not only followed the underlying linear dependency but also retained the natural scatter observed in real measurements as depicted in Figure 8(a).
These perturbed frequencies were then inserted into the quadratic f(k) relationship, which was inverted via the quadratic formula to determine interpolated stiffness—the red marks in Figure 8(b). This combined mapping from tidal level to stiffness—shown in Figure 8(c)—was then applied to 1 year of tidal data for the Ålesund region, 38 sampled three times per day (1098 samples), yielding a time series of equivalent lifting tower spring stiffness under realistic tidal level of the region as presented in Figure 9.
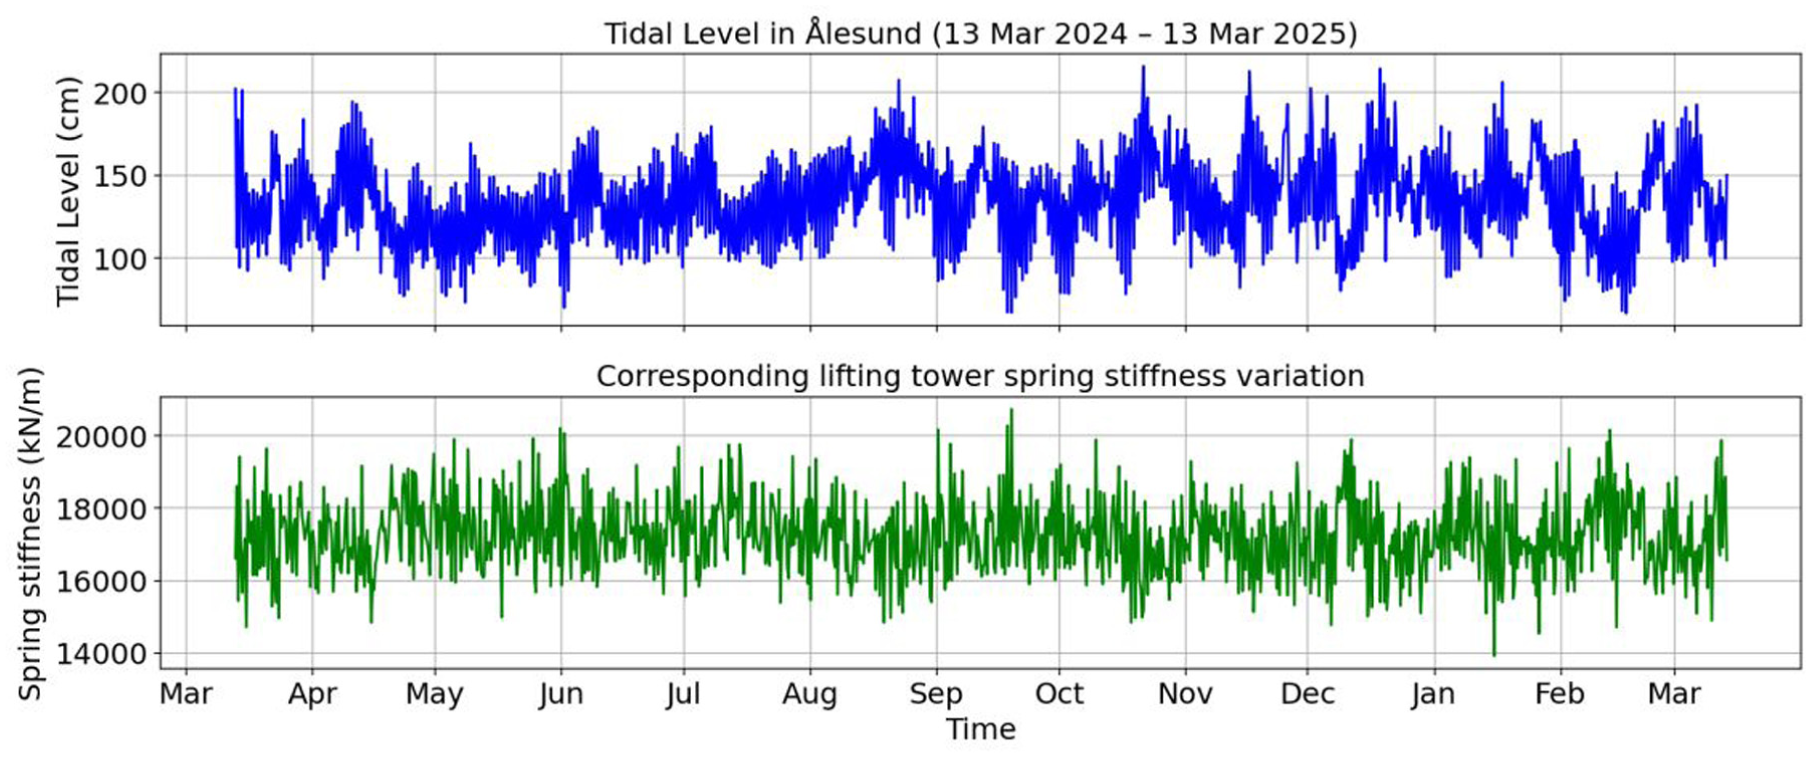
Alesund tidal level in 1 year and corresponding lifting tower spring stiffness.
Methodology
Finite element model updating
In vibration-based damage detection, identifying structural damage requires comparing the condition of the structure in its healthy state to that in its potentially damaged state. This comparison could be performed through a DI calculated from damage-sensitive features such as natural frequencies. Consequently, the availability of a reliable healthy-state baseline is essential.
In principle, such a baseline could be established by continuous monitoring over an extended period from the time of construction until damage occurs. However, this approach is rather impractical, as the time to first damage and its type are both very uncertain, resulting in substantial data storage requirements. A more feasible strategy is to develop a FE model that accurately represents the undamaged structure and use it to simulate structural response under various environmental and damage scenarios.39,40 The simulated modal properties then serve as input for calculating DIs and assessing detectability.
Recent advances in FE model updating have further strengthened the role of model-assisted vibration-based SHM for damage detection by improving the reliability of damage assessment 41 through explicitly accounting for modeling uncertainties and structural complexity. 42
At the same time, it should be acknowledged that the present study relies entirely on numerically simulated damage scenarios since the data from the damaged structure was not available up to this point. While this limitation is common in early-stage SHM development, particularly for safety-critical infrastructure where controlled damage tests are not feasible. The reported herein MDD values should therefore be interpreted as detectability trends under modeled assumptions rather than field-confirmed thresholds. In future studies, those thresholds should be validated when the data becomes available.
Because FE models rely on simplifying assumptions, their predictions may differ from actual structural behavior. To minimize such discrepancies and provide a representative baseline for damage detection, Finite Element Model Updating (FEMU) can be applied.43,44
FEMU procedure applied in this study, originates from Mottershead’s sensitivity method 45 further advanced by Svendsen et al.46,47 FEMU results for the Magerholm Linkspan have been previously presented by Le et al. 35 Briefly, the finite element model was developed in ABAQUS based on as-built drawings and supplementary field measurements. The structure was modeled using quadrilateral reduced-integration shell elements (S4R) with a validated mesh size of 50 mm. Structural components were assigned realistic cross-sections and steel material properties corresponding to S235–S275 grades. Non-structural mass, including railings and steel gratings, was incorporated explicitly to match the measured total mass of 53.64 tons. Boundary conditions were represented using vertical springs for the lifting towers and “pinned” support at the abutment.
Mottershead’s sensitivity-based optimization method minimizes discrepancies between numerically predicted and experimentally identified natural frequencies. Four uncertain input parameters were selected for updating: steel density, Young’s modulus, and the vertical stiffnesses of the two lifting towers. These parameters capture uncertainties in mass distribution, material stiffness, and support conditions. The model was iteratively updated using five measured vibration modes to ensure a well-posed inverse problem and a unique solution. Further implementation details are provided in Cho and Cho. 32
The resulting FEMU model from that study—shown in Figure 10—is used in the present investigation. Five vibration modes identified in both the field measurements and FE simulations, are shown in Figure 11. The natural frequencies of these five modes form the basis for subsequent damage quantification that would be described in Subsection “Damage index calculation.”
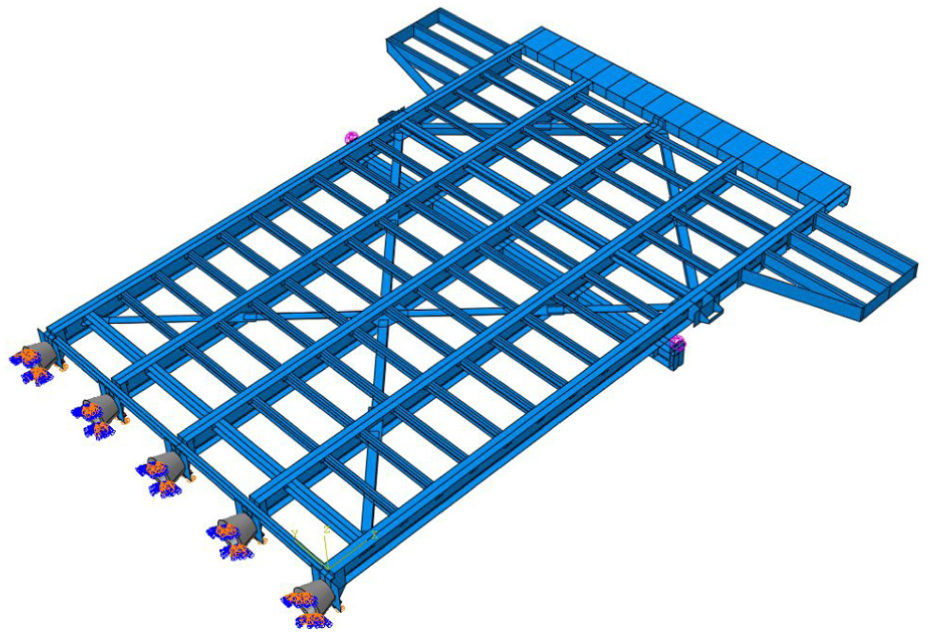
Updated finite element model of Magerholm linkspan.
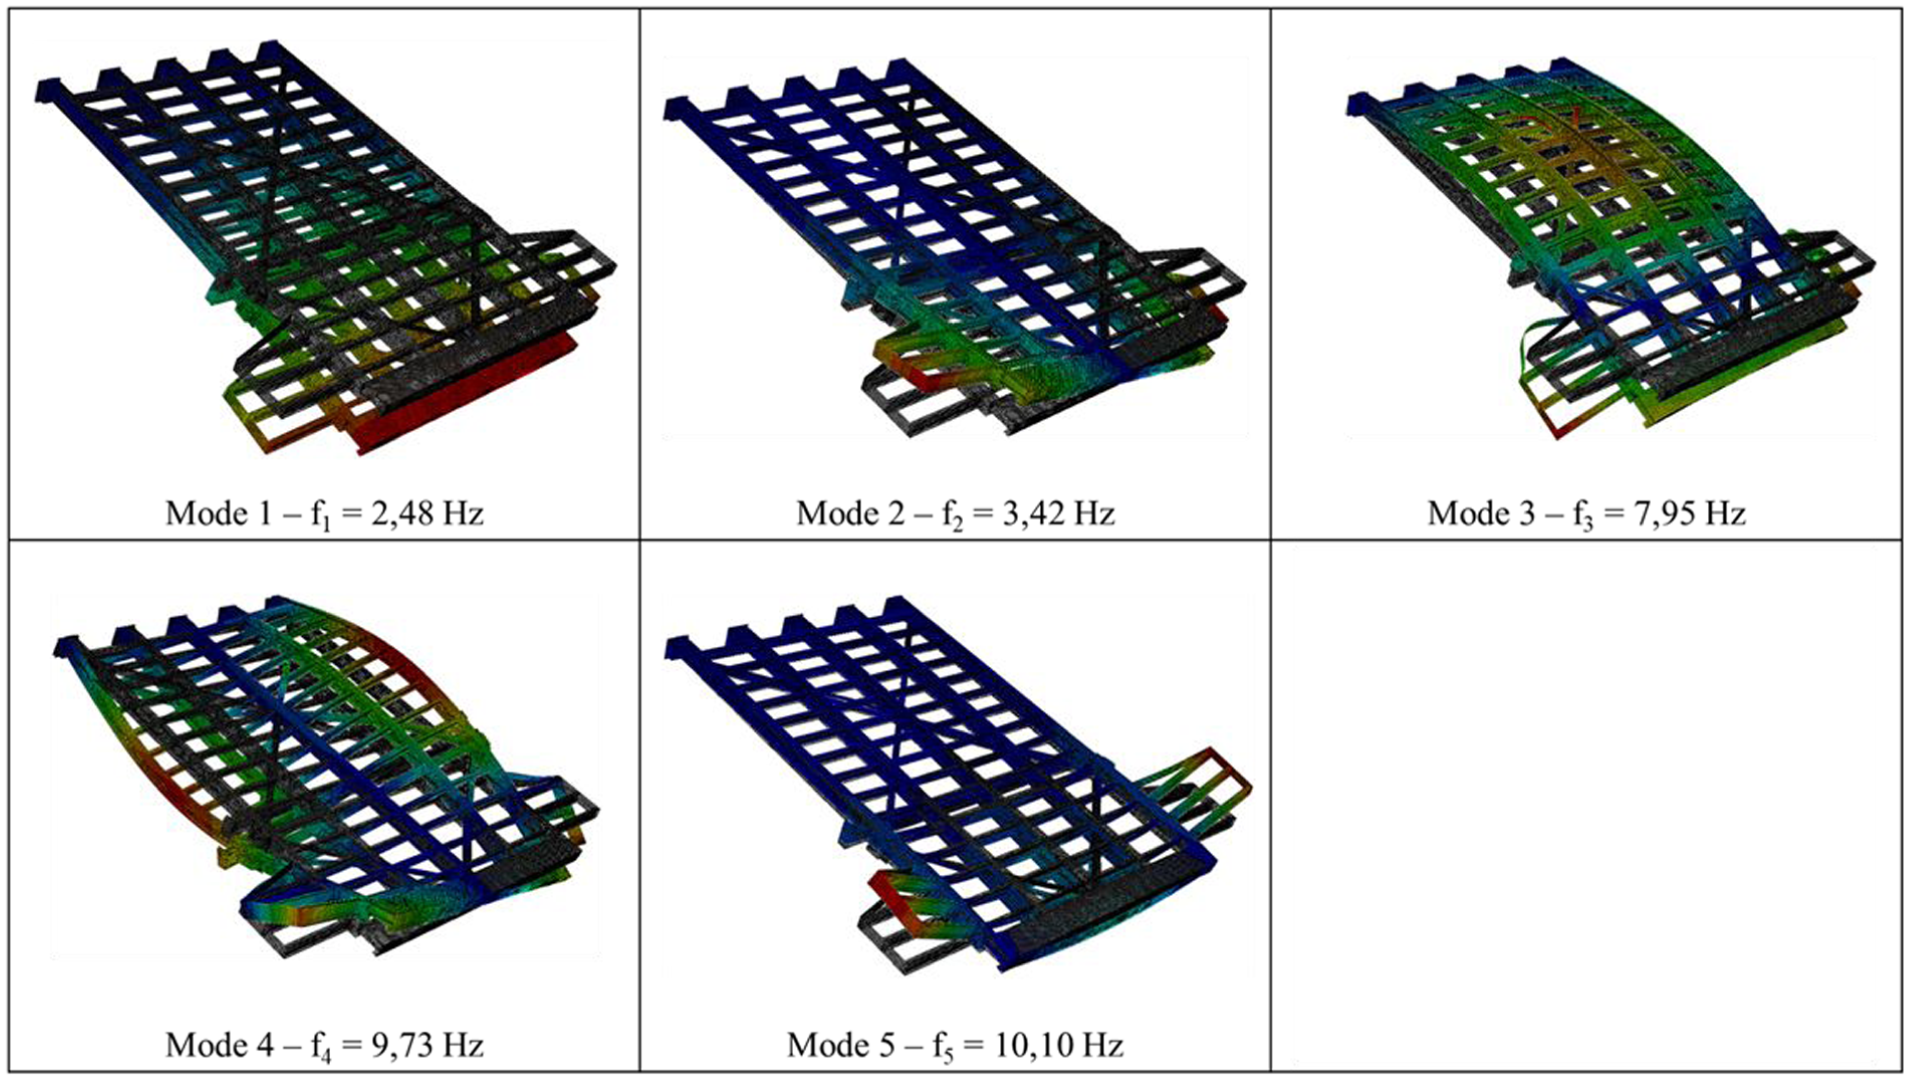
Five FE model modes forming the basis for damage quantification.
After FEMU, the average error between the measured and the FE-obtained frequencies was only 4.3%, indicating high confidence in the reliability of the updated model used in this study. As a result, for simplicity, no further uncertainty from the updated FE model was considered to affect damage detectability.
Damage modeling and simulation framework
In this study, structural damage in the Magerholm linkspan is modeled as a stiffness reduction in lifting towers represented in the FE model as equivalent linear springs. The towers are assumed to have identical initial stiffness, and damage is introduced in both towers in symmetrical damage case and in only one tower in asymmetrical damage case. The damage level is parameterized by a stiffness reduction factor, denoted as κ, where κ = 0 represents the healthy state and increasing values of κ indicate progressively larger reductions in stiffness. Simulations are performed for a sequence of κ values until the POD reaches 100%, beyond which further increases in κ are unnecessary. For each damage level κ, the FE model generated modal data for both healthy and damaged states. To assess how environmental variability influences damage detection, three simulation groups were defined:
Temperature-only: Young’s modulus varies according to the temperature profile, while spring stiffness is fixed.
Tide-only: Young’s modulus is fixed, and spring stiffness varies with tidal level using the procedure from Section “Modeling tidal effect.”
Combined Temperature and Tide: Both Young’s modulus and spring stiffness vary simultaneously based on paired temperature–tide samples.
In all three scenarios, the damage is simulated by applying the κ-based stiffness reduction to the tide dependent spring stiffness.
For each simulation case, the FE model outputs a set of m natural frequencies for each of the n environmental samples, producing an m × n modal frequency matrix for each damage level in each simulation group.
Damage index calculation
To quantify deviations caused by damage and environmental variability, a scalar DI is computed from the simulated natural frequencies, where the healthy-state dataset serves as the reference condition for each simulation group. The DI is calculated using the Mahalanobis distance between each damaged-state frequency vector x and the healthy-state distribution:
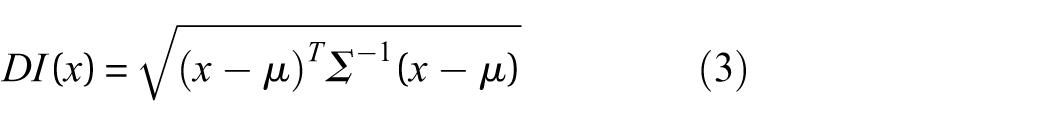
Where μ and Σ are the mean vector and covariance matrix of healthy state m x n matrix with natural frequencies.
In this study for each κ in each simulation group, the damaged-state dataset is compared to the healthy-state matrix by computing the Mahalanobis distance for each environmental sample, producing a set of n DI values for that damage level. DI distributions are then used in the statistical analysis described in subsection “Damage detectability and the concept of minimum detectable damage” to produce POD and ROC curves as well as define MDD.
It should be noted that DI is not an objective measure of damage and should not be compared between different scenarios. Rather, it should be treated as a tool helping to track changes in dynamic behavior of the structure through time and to calculate the MDD.
Summary
While the methodology above is presented in general terms, the following parameters were applied in this study:
Damage levels κ evaluated from 0 up to a value where POD converged to 100%.
Damage index DI is calculated using Mahalanobis distance based on natural frequencies.
For the symmetric damage scenario, damage is simulated in both lifting towers simultaneously. Conversely, the asymmetric scenario involves simulating damage in only one lifting tower.
PFA threshold is set at 5% and target POD level is set at 95% for defining the MDD.
For clarity, the overall methodology is summarized in Figure 12, which presents the main steps from FE model updating process, FE model simulations under environmental and damage conditions, through damage index calculation, to the final evaluation of POD, PFA, and MDD. This flowchart provides a concise overview of the framework and highlights the sequential structure of the analysis.
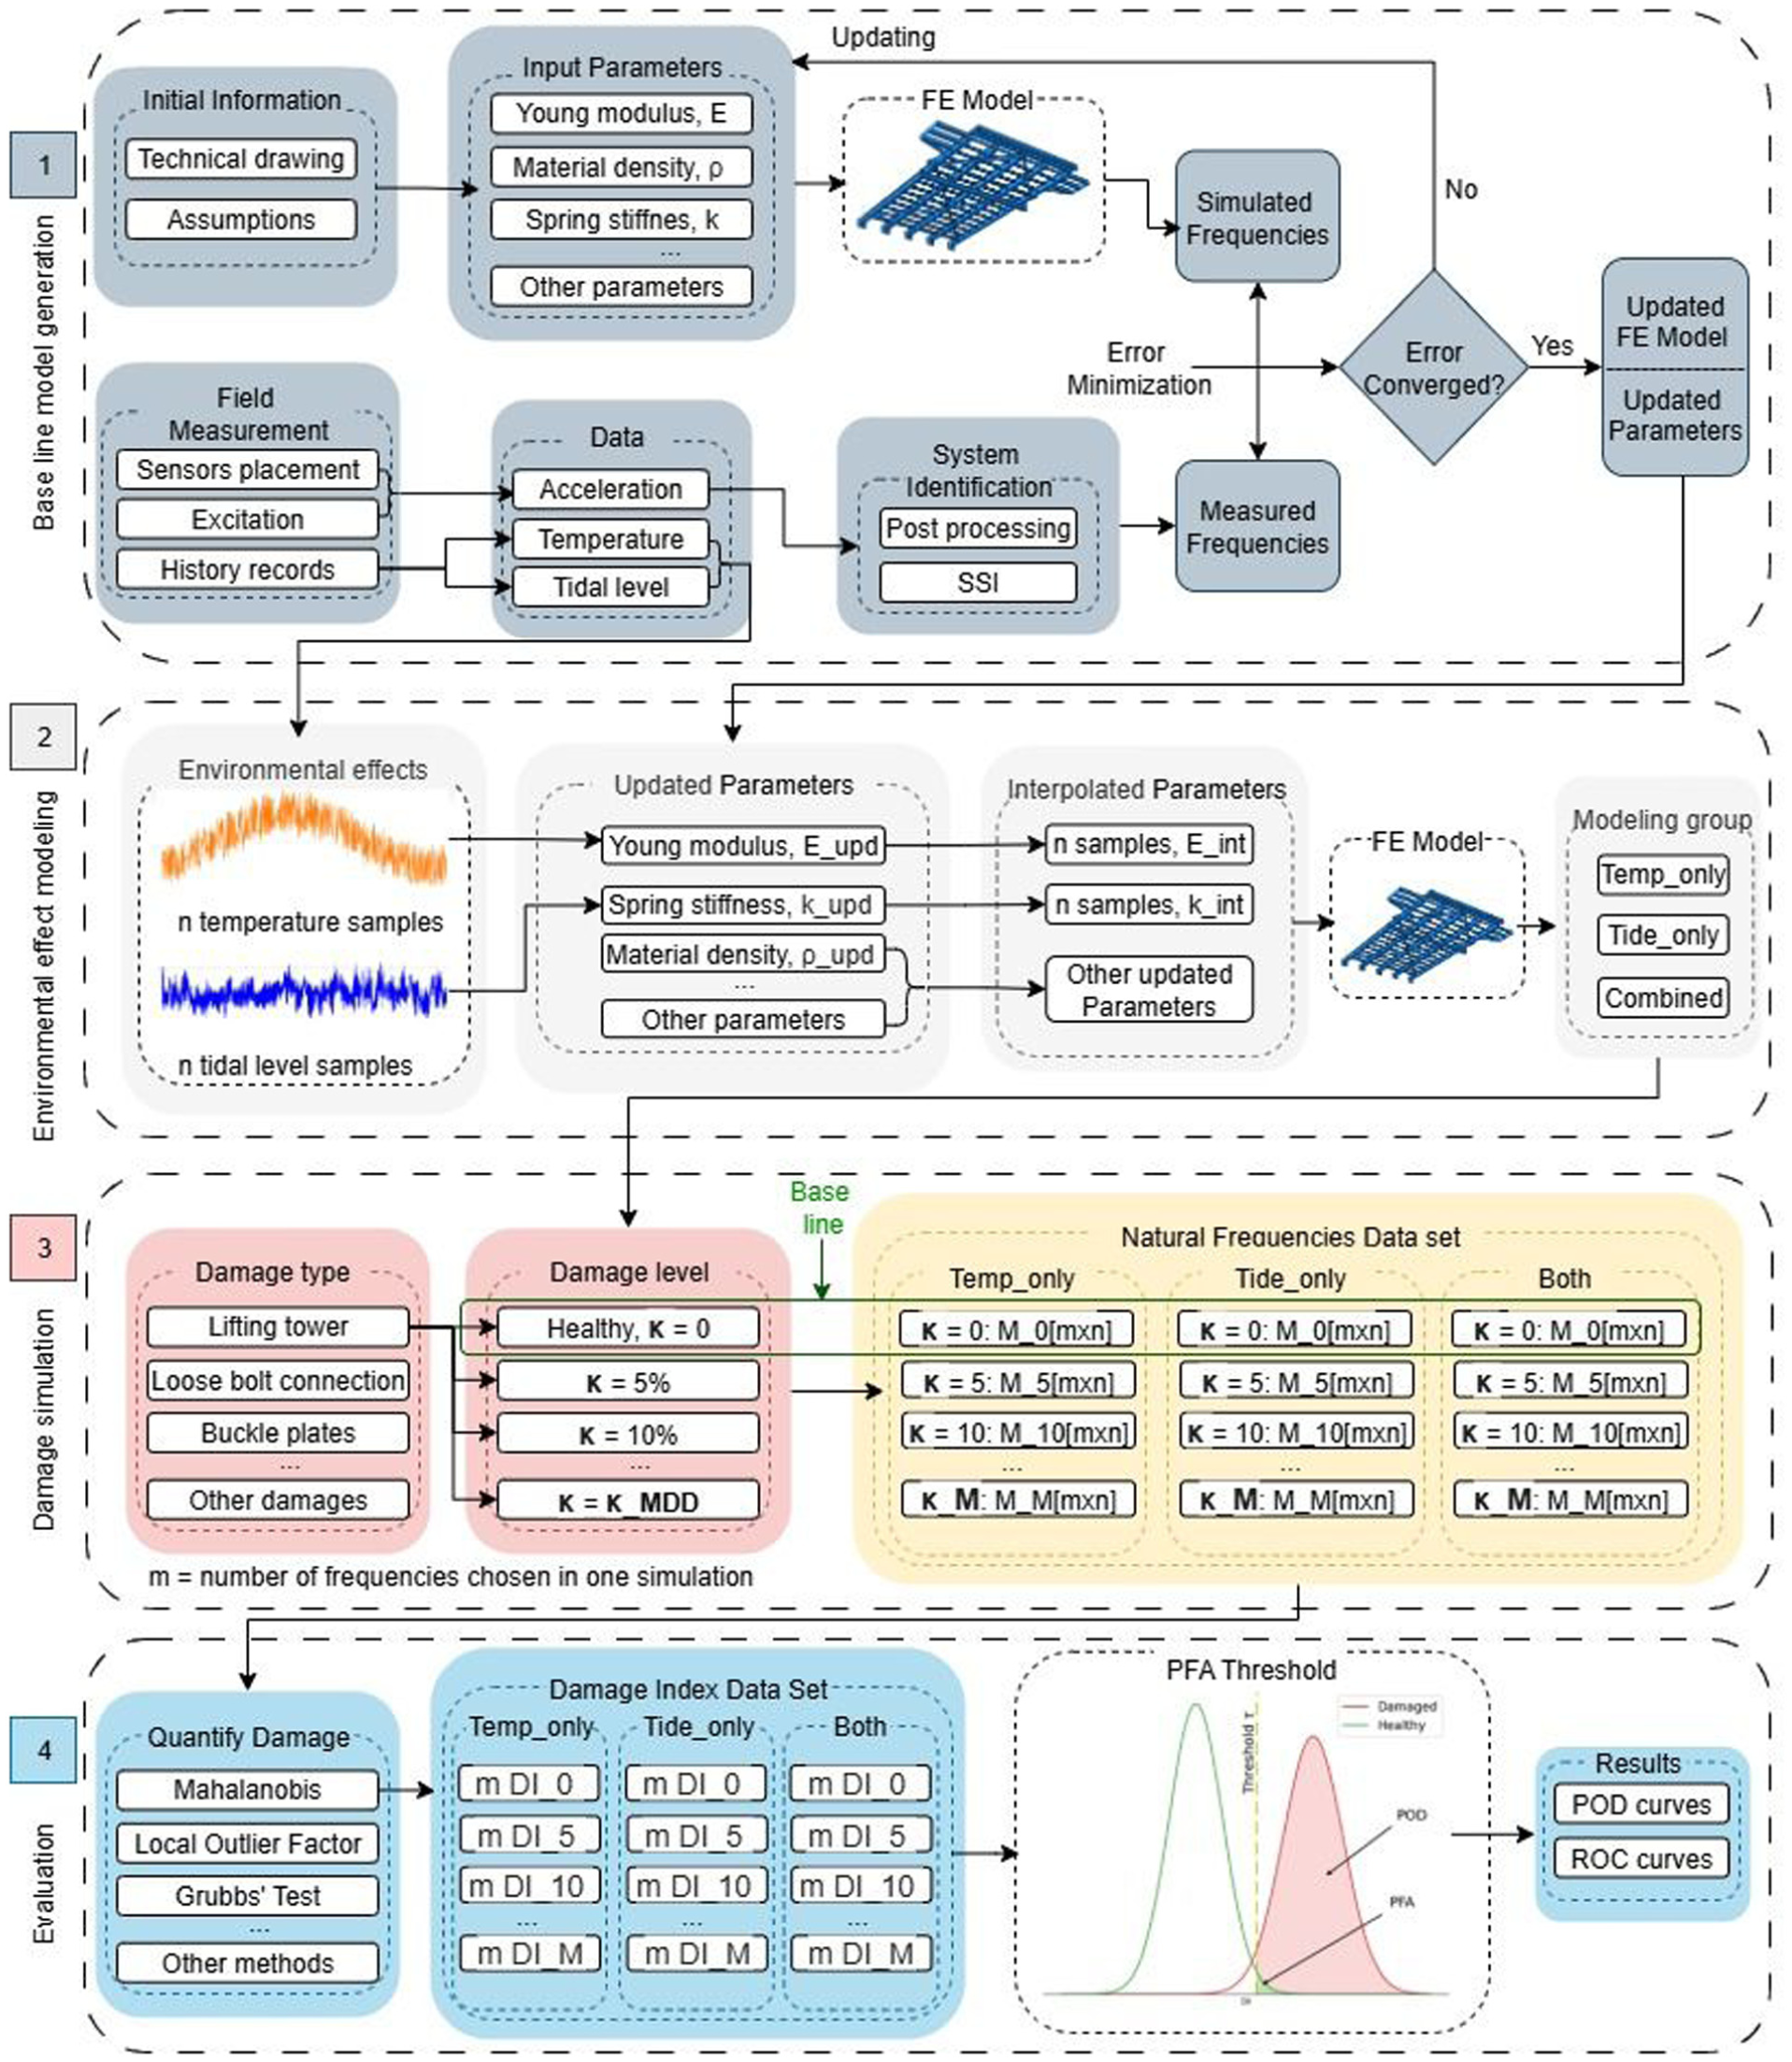
FE model-based identification of minimum detectable damage methodology flow chart.
Results
Damage index distribution under environmental variability
For each environmental scenario Temperature-only, Tide-only, and Combined, the healthy-state frequency matrix serves as the reference distribution. Frequency vectors from damaged states are then compared to this baseline to compute DIs using Mahalanobis distance.
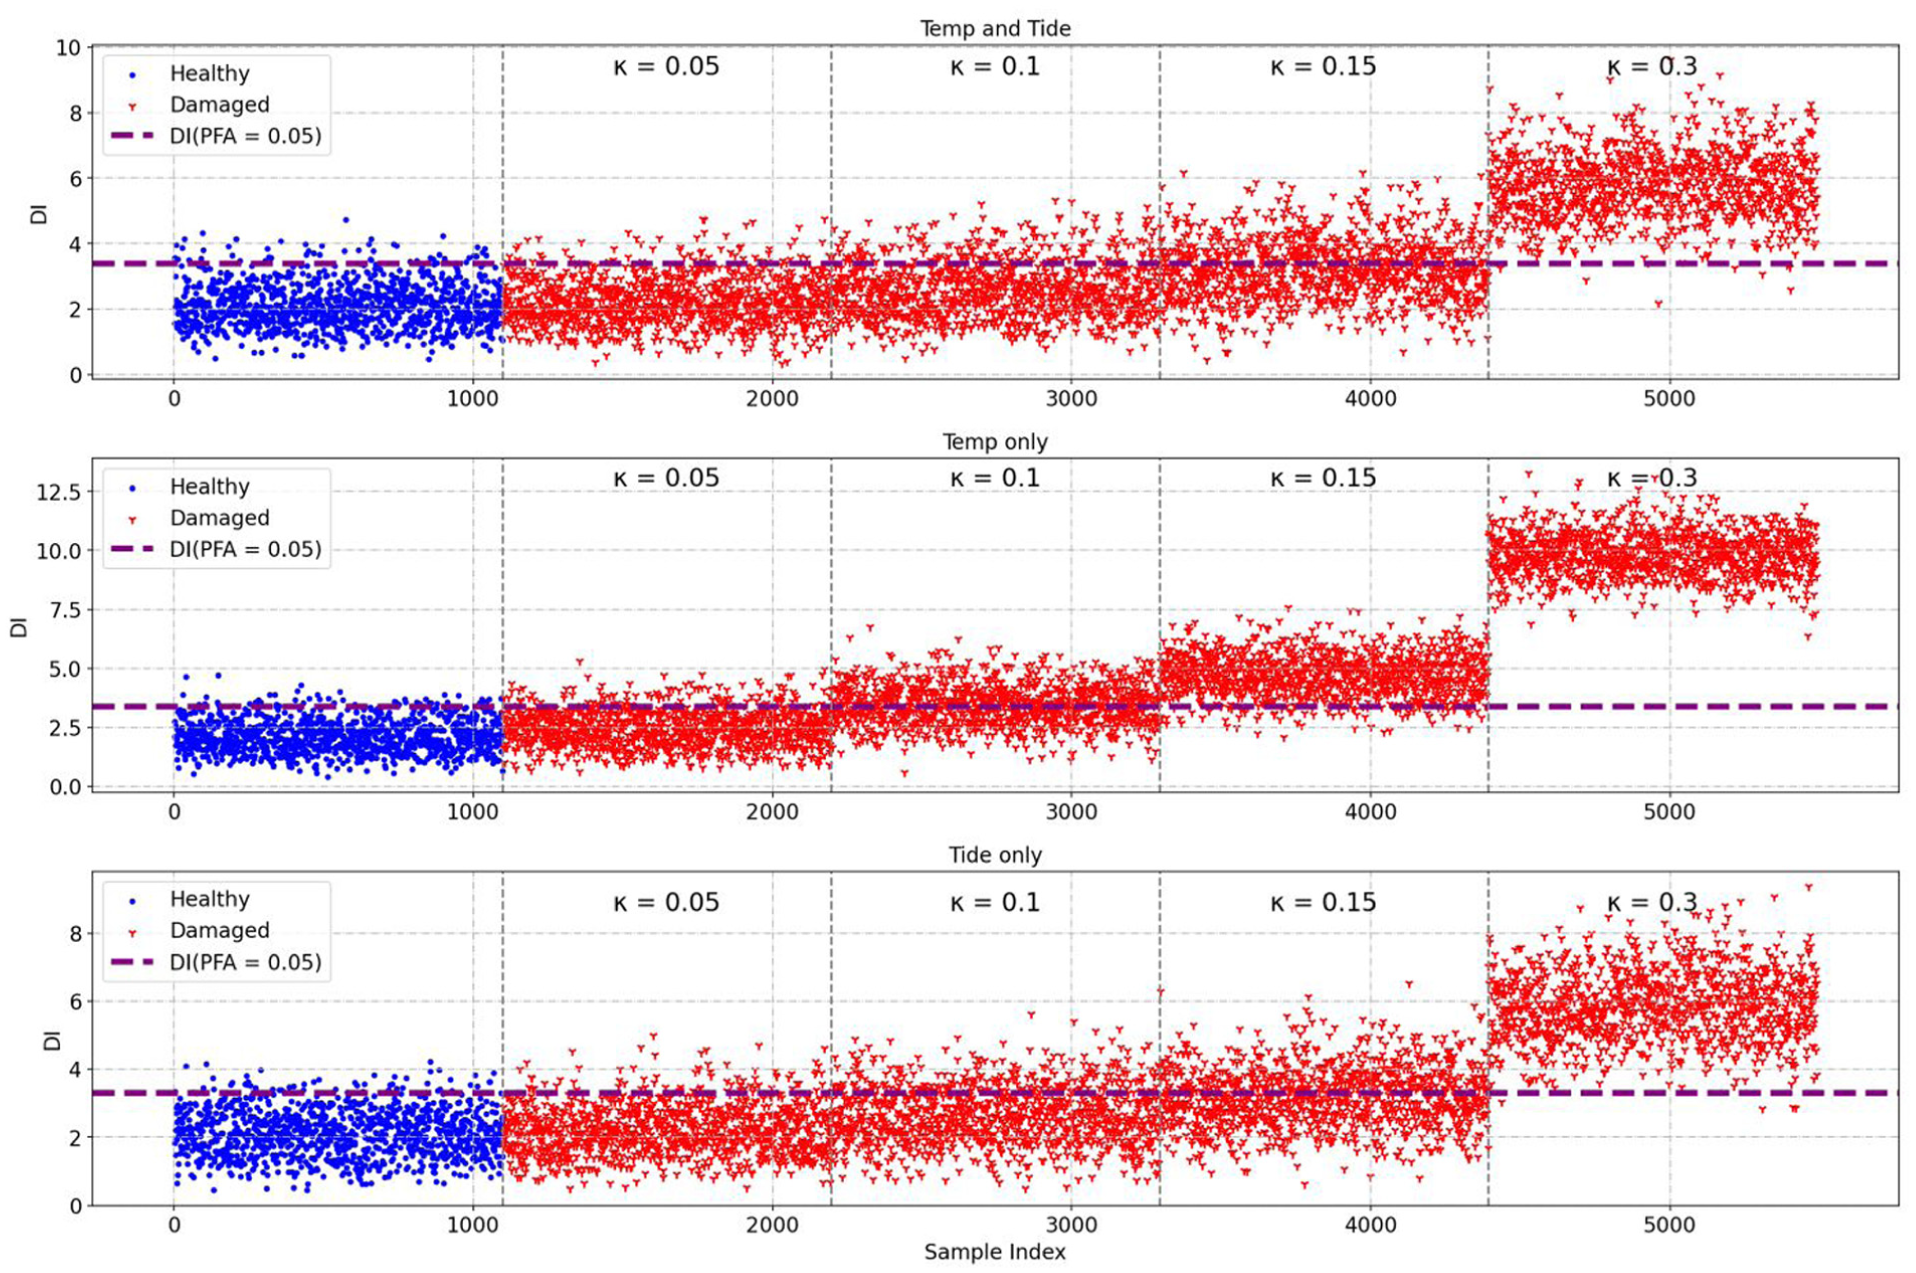
Figure 13 illustrates a comparison of DI distributions across all three environmental scenarios at different damage levels κ. It can be seen as the simulated structural damage increases, the DI values progressively shift away from the healthy-state baseline. At lower κ values, there is significant overlap between the healthy and damaged DI distributions; however, at larger κ values, the distributions become increasingly distinct and separable.
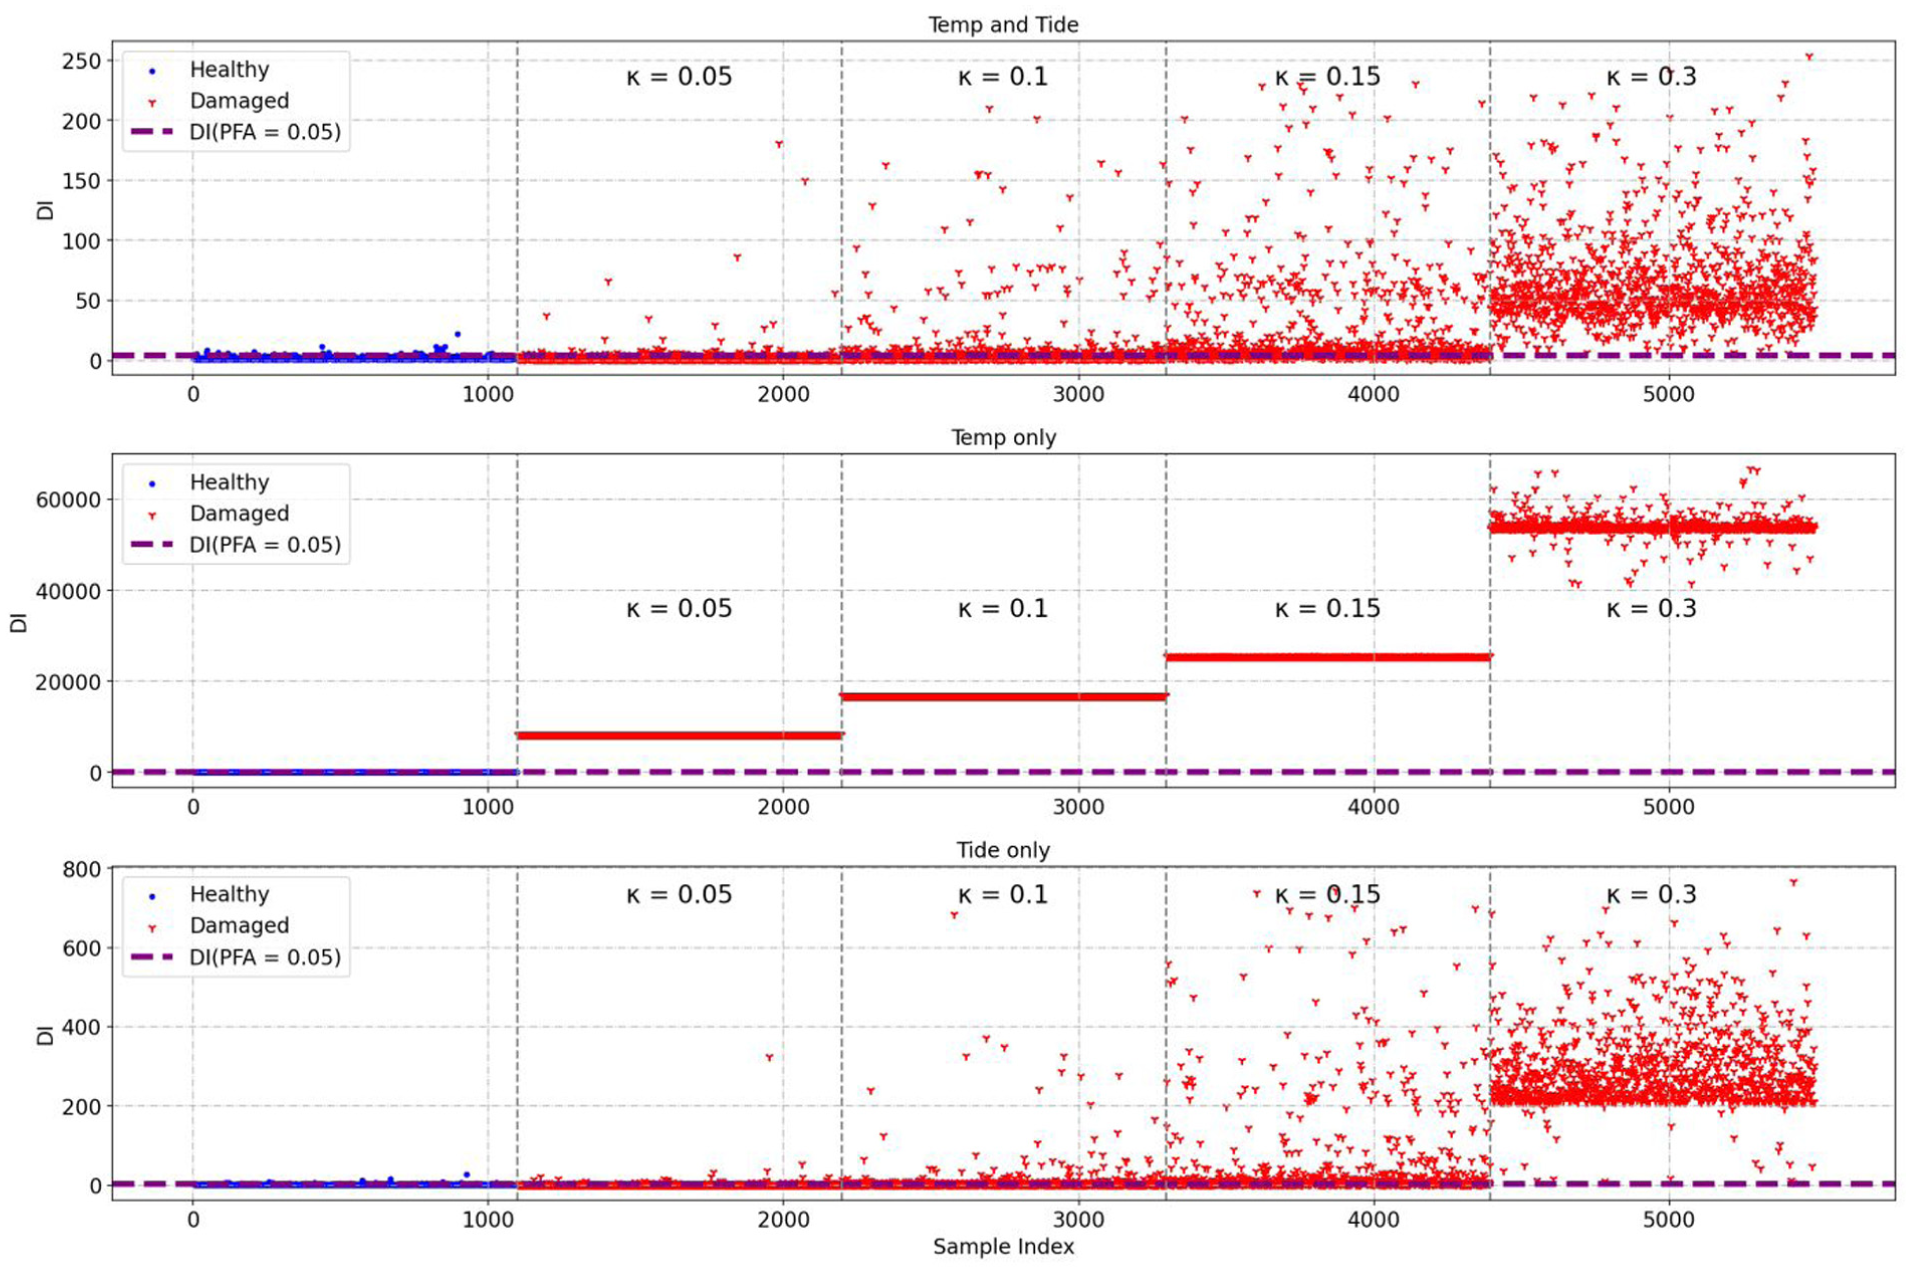
Damage index distribution over different damage levels of the three simulation groups.
Moreover, temperature-only yields larger DIs at all κ because temperature induces small healthy-state frequency variability. With tidal variability, healthy-state fluctuations are larger, so DI values grow more gradually.
Finally, it can be observed that, as the damage level increases, the DI values not only grow in magnitude but also in range. This trend can be explained by examining the sensitivity plots in Figures 5 and 6 that show nonlinear stiffness-frequency relationships. As natural frequencies changes of Magerholm linkspan are more pronounced at lower values of spring stiffness. Even small tidal variation can be more impactful.
MDD analysis under environmental variability
For each environmental modeling group, the DI values from the healthy-state simulations were used to define the alarm threshold, which was set such that only 5% of healthy samples exceeded it (PFA = 5%). The POD for each damage level κ was computed as the fraction of DI values in the damaged state that exceeded the threshold. By repeating this process across increasing κ values, POD curves showed in Figure 14 were obtained for each environmental scenario.
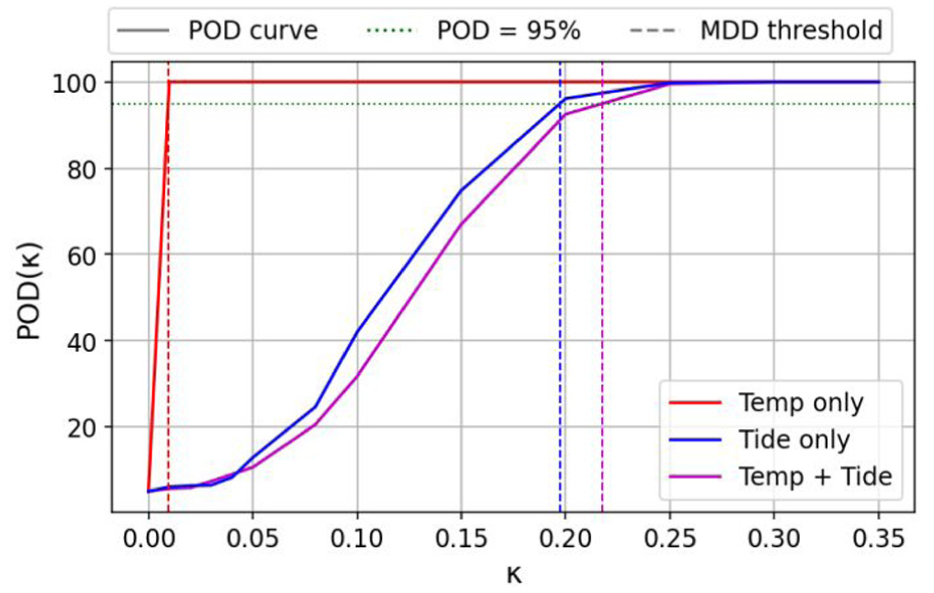
POD curves over increasing damage levels under different environmental effects.
There, the intersection of each POD curve with the 95% POD threshold defines the MDD. For the Temperature-only scenario, the intersection occurs at κ 1%, indicating that even very small damage can be reliably detected when only temperature variability is present. In contrast, the MDD for the Tide-only scenario is approximately 19.7%, while for the Combined case it increases further to about 22%, confirming tidal variability as the dominant masking effect. Despite considering the extreme temperature profile and 5% of variability in Equation (1) for the worst-case scenario, the result shows that the temperature has a very limited effect on the detectability of damage.
This trend is mirrored in the ROC curves shown in Figure 15. Temperature-only ROC curves indicate nearly perfect discrimination between the healthy and damaged states. In contrast, the ROC curves for the Tide-only and Combined scenarios show a gradual progression: at κ = 5%, they lie close to the diagonal (κ = 0%), while at κ = 30%, they shift toward the top-left corner, reflecting improved discrimination with increasing damage. In the Combined case, the ROC curves are slightly closer to the top-left corner than in the Tide-only case.
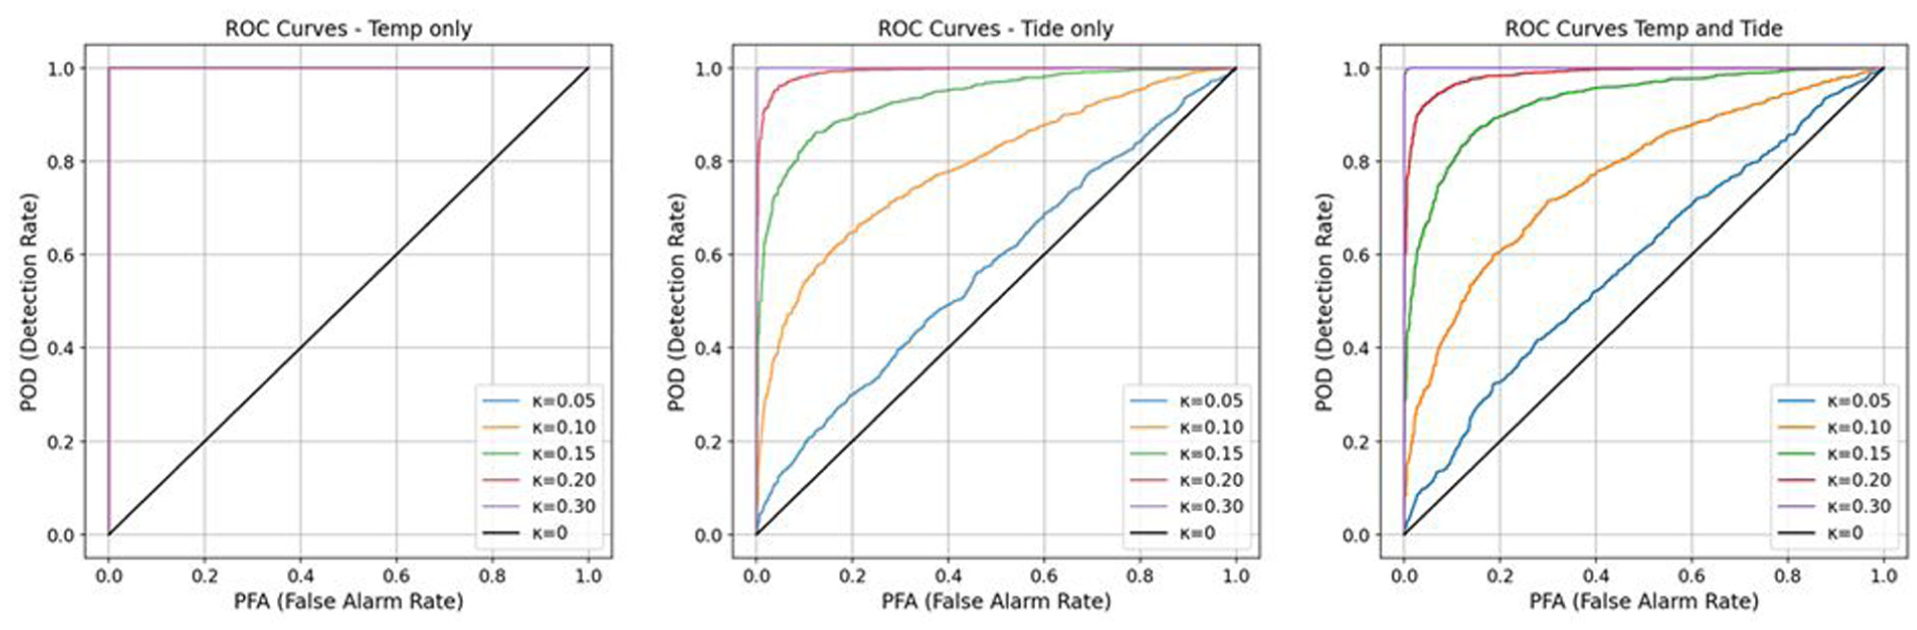
ROC curves of lifting tower damage under different environmental effects.
Noise effect on identifying MDD
To emulate measurement uncertainty, proportional Gaussian noise (1%, 2%, and 3%) was added to FE-derived frequencies. The 1% noise level models a scenario with minimal experimental error, representing a high-quality conversion from acceleration data to natural frequencies. In contrast, the 3% noise level simulates less favorable conditions with greater measurement variability. The resulting datasets were re-evaluated via DI, POD, and ROC.
Figure 16 presents the DI distributions across different damage levels when 1% noise is added to the natural frequencies after each FE run. It can be seen that already at 1% noise, DI dispersion increases and separation between adjacent κ narrows.
DI distributions over different damage levels—1% noise added.
Since the influence of environmental effects on MDD identification has already been discussed in the previous subsection, the focus here is on the impact of noise on detectability. All subsequent analyses are therefore based on the Combined dataset.
Figure 17 compares the POD curves for the Combined case under different noise levels, ranging from no noise to 3% added noise. The results clearly show that detectability decreases as noise increases. The MDD increases from 22% (no noise) to 25.2% (1%), 33% (2%), and >35% (3%). Table 1 summarizes MDD values across all environmental scenarios.
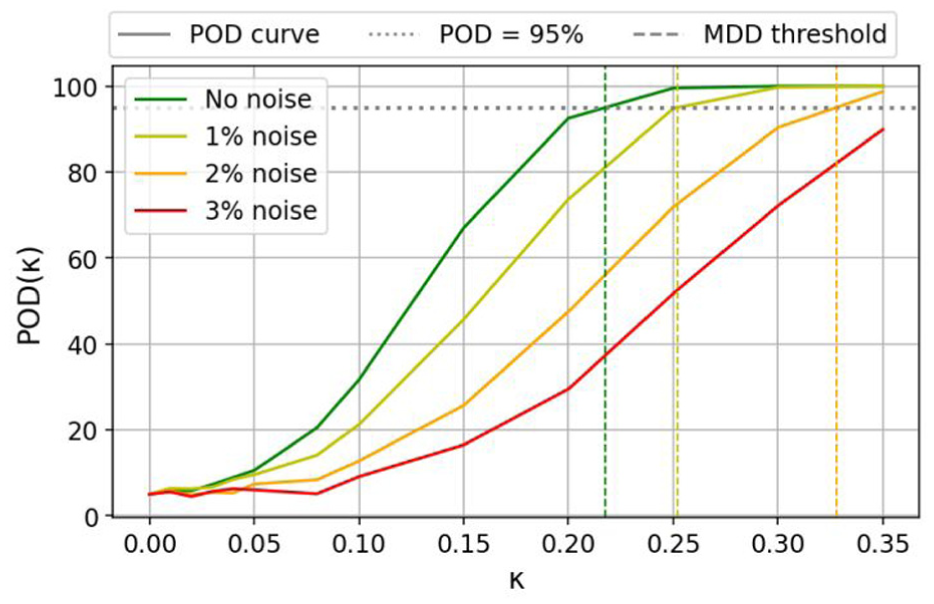
Combined POD curves over increasing damage of different noise levels.
Summary of MDD values across different environmental effects.
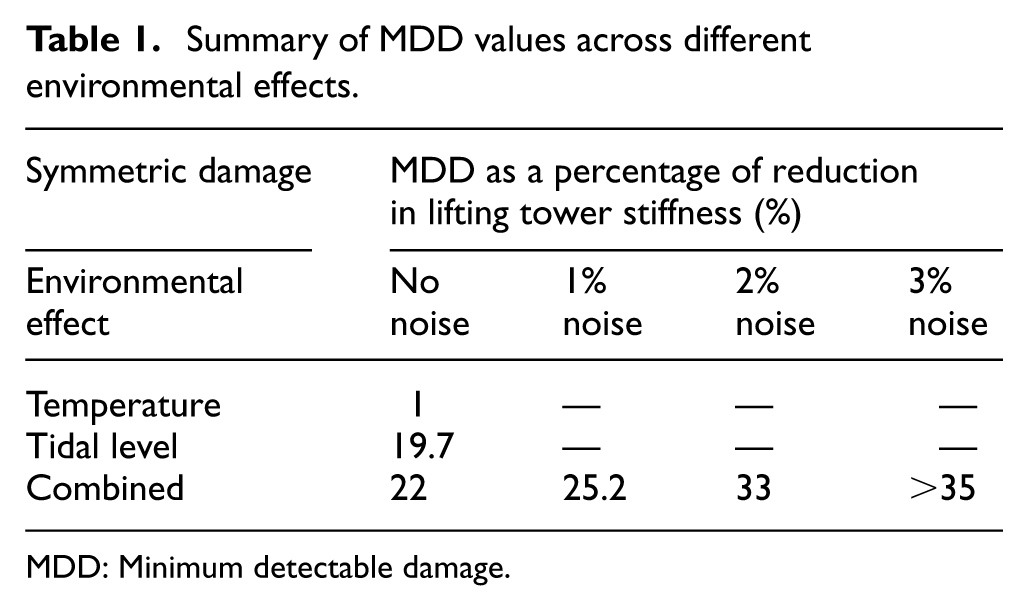
MDD: Minimum detectable damage.
Figure 18 shows also how increasing noise levels progressively reduce the ability to distinguish between healthy and damaged states. ROC curves move toward the diagonal with noise, especially at small κ. For higher damage levels (e.g., κ = 30%), the separation remains clear even with added noise, as indicated by the distinct distance between the ROC curve (purple line) and the diagonal black solid line representing the healthy state.
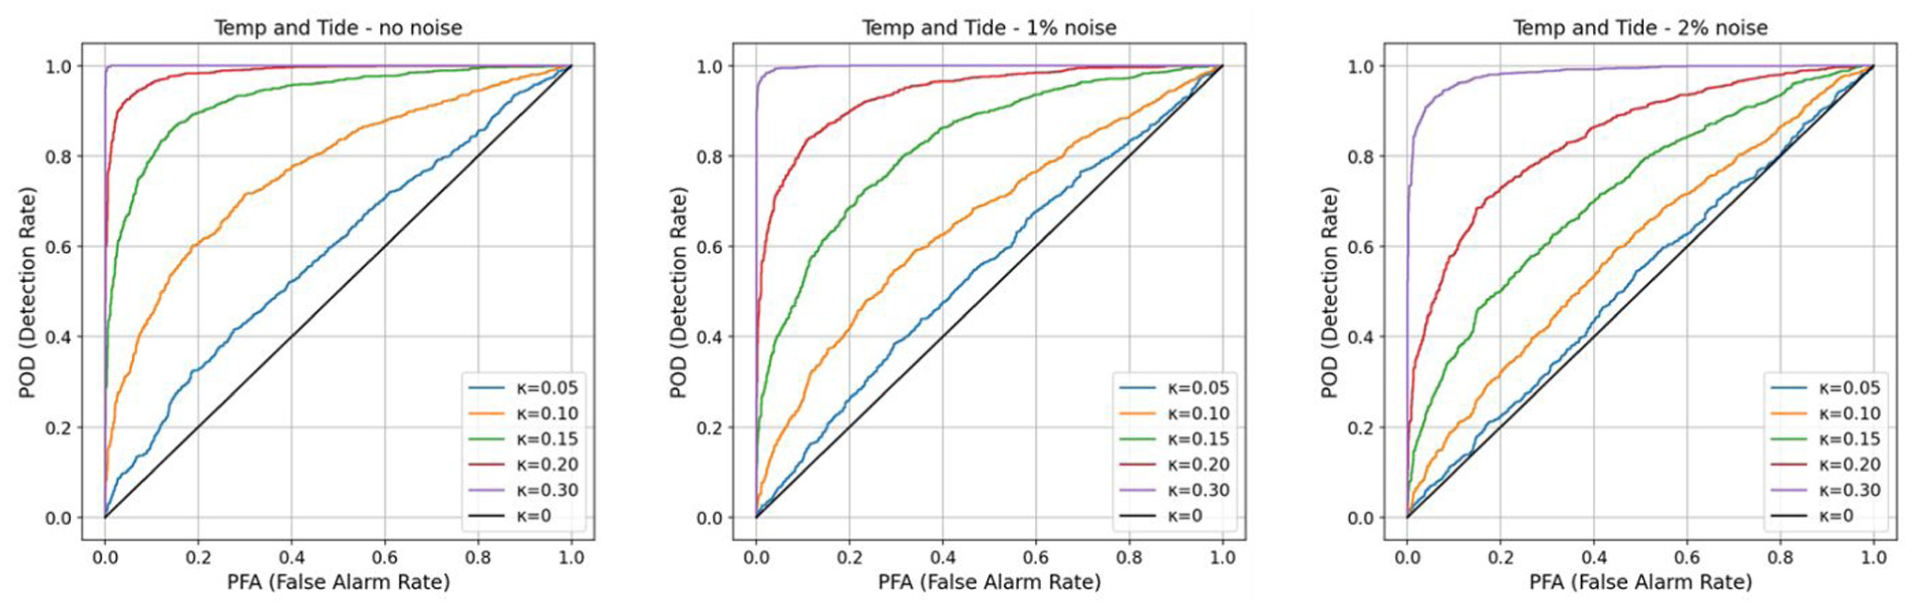
Combined case ROC curves over increasing damage of different noise levels.
Damage detectability under an asymmetric damage scenario
In the previous analyses, structural damage was modeled as a symmetric reduction in spring stiffness applied simultaneously to both lifting towers. While this represents an idealized condition, lifting towers might not experience a perfectly uniform degradation. To emulate non-uniform degradation, stiffness reduction was applied to a single tower in analyses of this subsection.
The influence of single-tower damage on modal properties is first examined in Figure 19, which presents the sensitivity of natural frequencies to variations in one tower’s stiffness across the range of 5000–25,000 kN/m. Damage asymmetry alters modal sensitivity: Mode 1 remains sensitive, while Modes 2–5 vary little across the stiffness range, reducing diversity in frequency shifts.
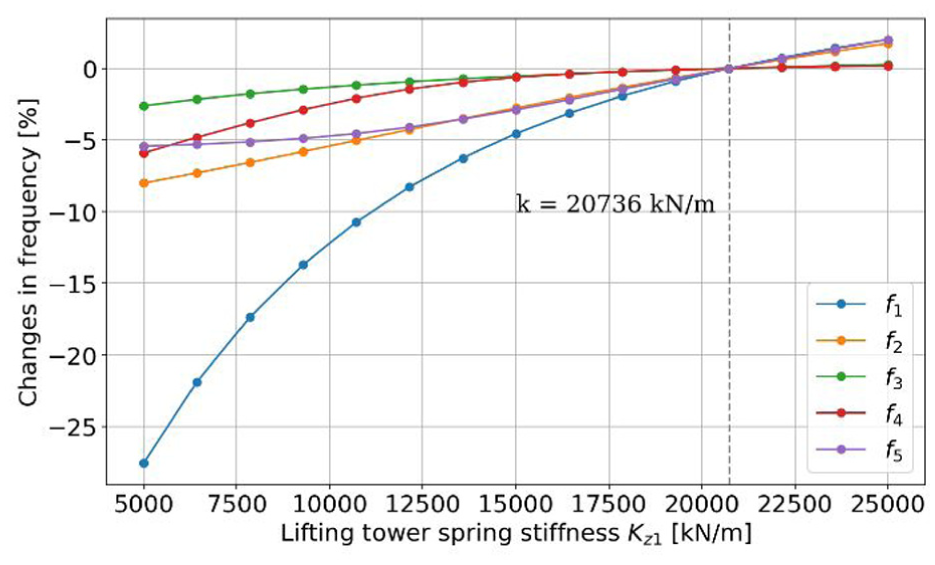
Changes in natural frequencies of the linkspan when altering the spring stiffness in only one lifting tower.
The impact of this reduced modal diversity on detectability is evident in Figure 20, which compares the DI distributions between the symmetric and asymmetric damage scenario under the Combined condition with 1% noise. It can be seen that the DI values of asymmetric case are distinctly lower, and the distributions for different damage levels overlap considerably. This demonstrates a significant reduction in detectability when damage occurs asymmetrically. The corresponding ROC curves in Figure 21 further confirm this trend: the curves for the asymmetric case lie noticeably closer to the diagonal, indicating weaker discrimination capability relative to the symmetric damage scenario.
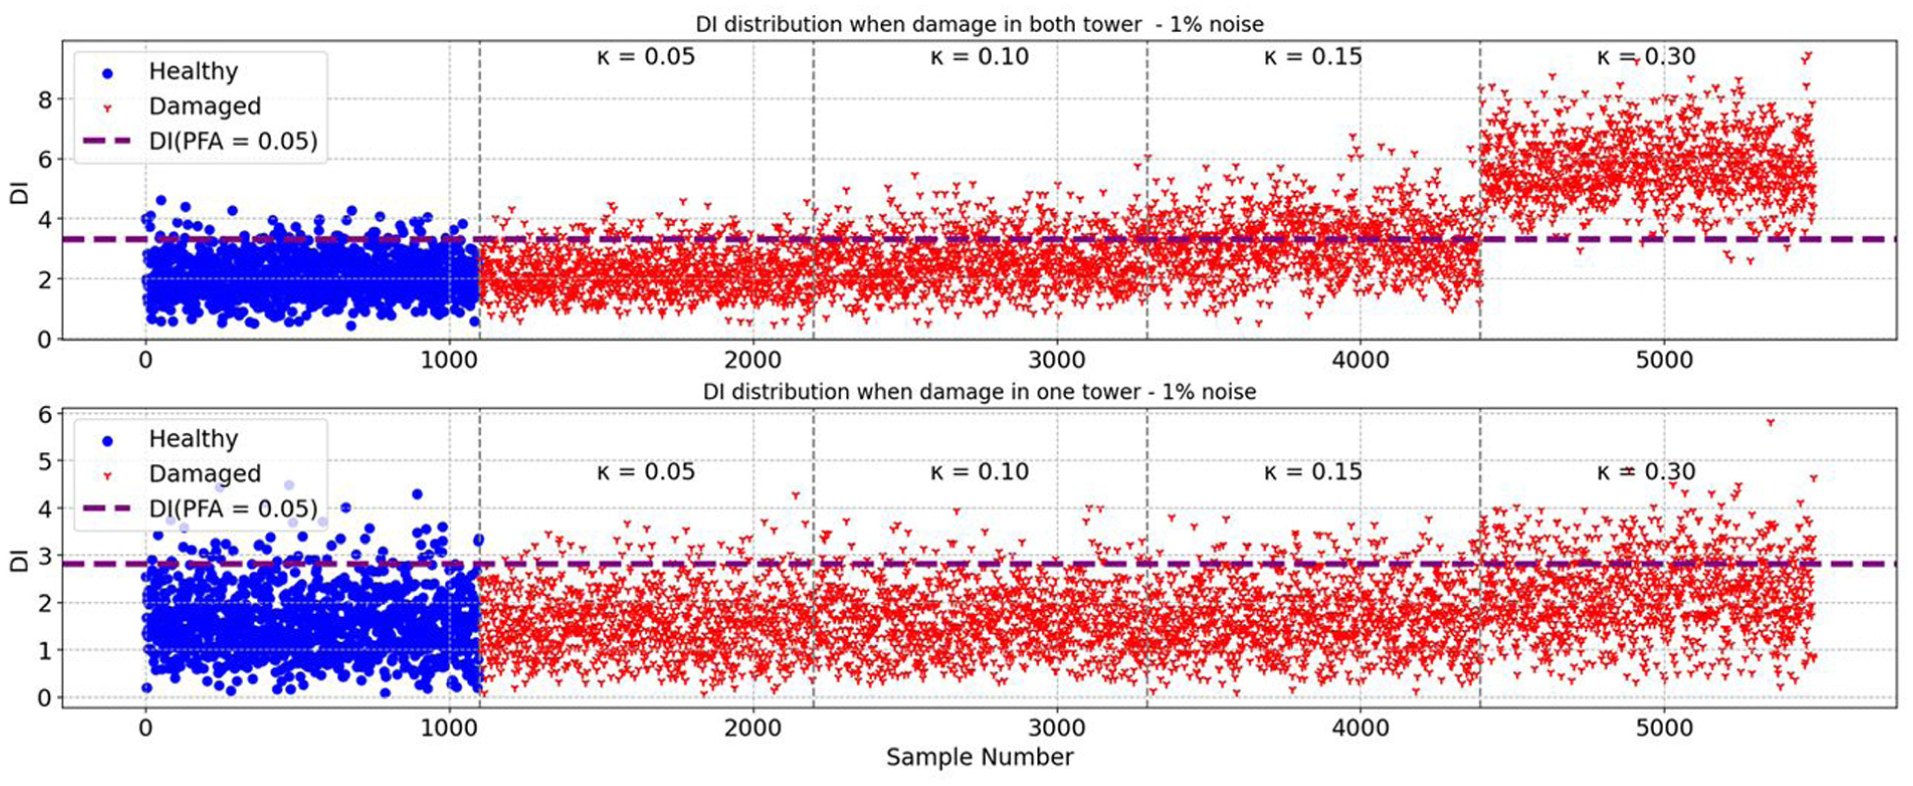
DI distributions comparison between symmetric and asymmetric damage scenario under the combined condition with 1% noise.
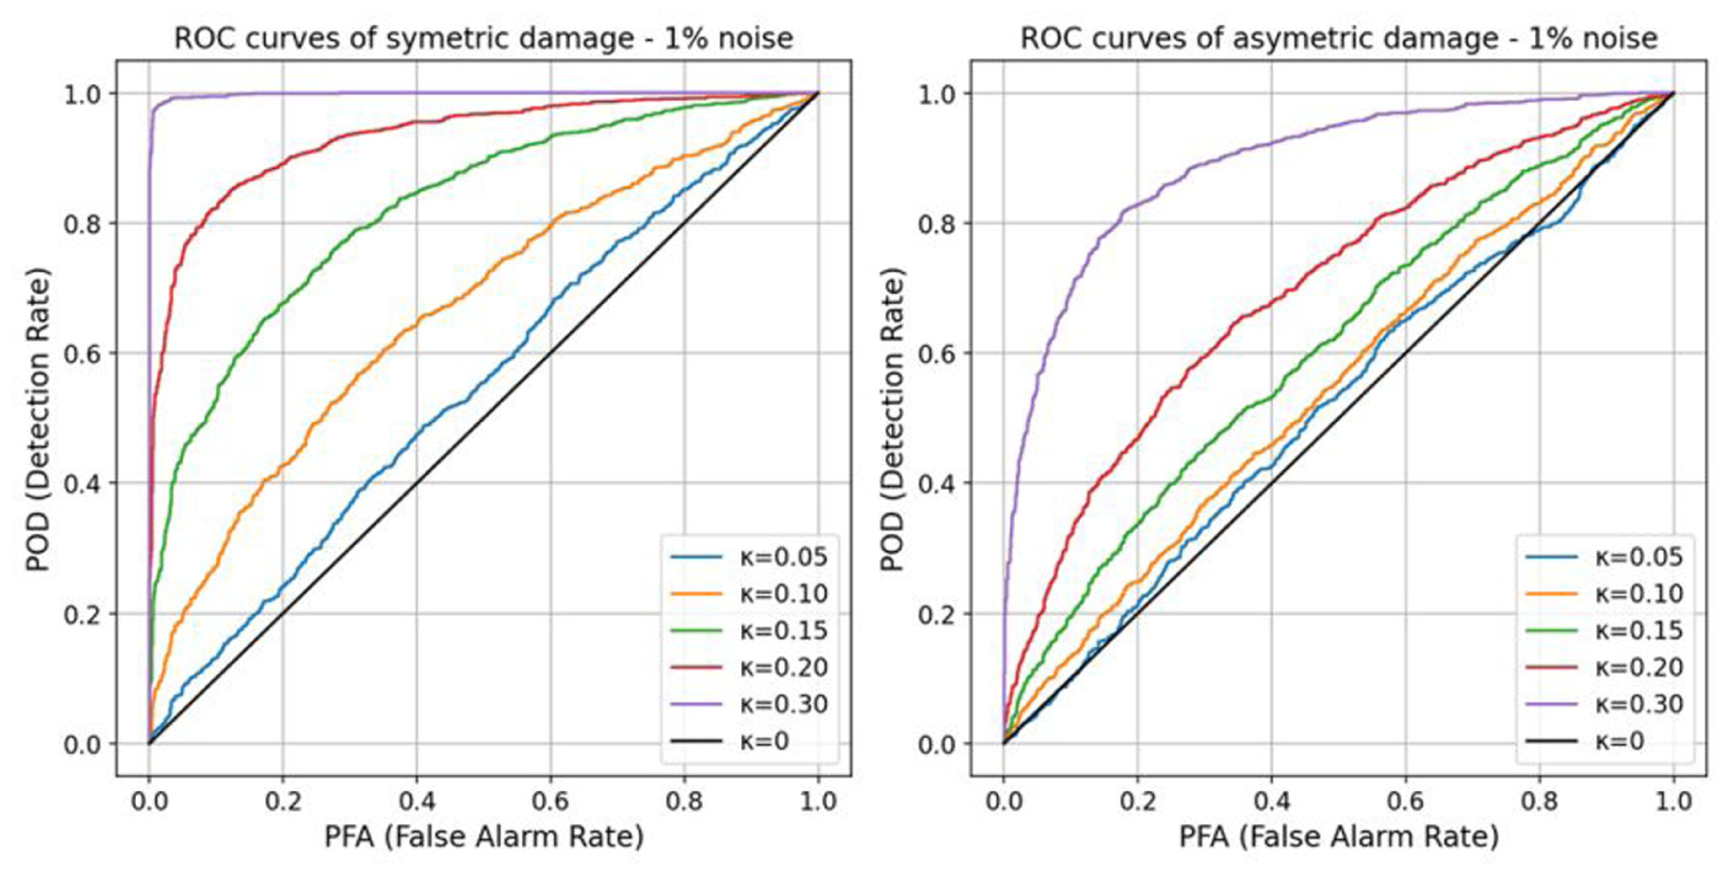
Comparison of ROC curves for symmetric and asymmetric damage scenarios under combined temperature–tidal conditions at different damage levels.
The POD curves in Figure 22 present a direct comparison of the two scenarios. The MDD from asymmetric scenario rises to 39.4% (1% noise), 48.7% (2%), and >50% (3%), compared with 25.2%, 33%, and 35% for the symmetric case.
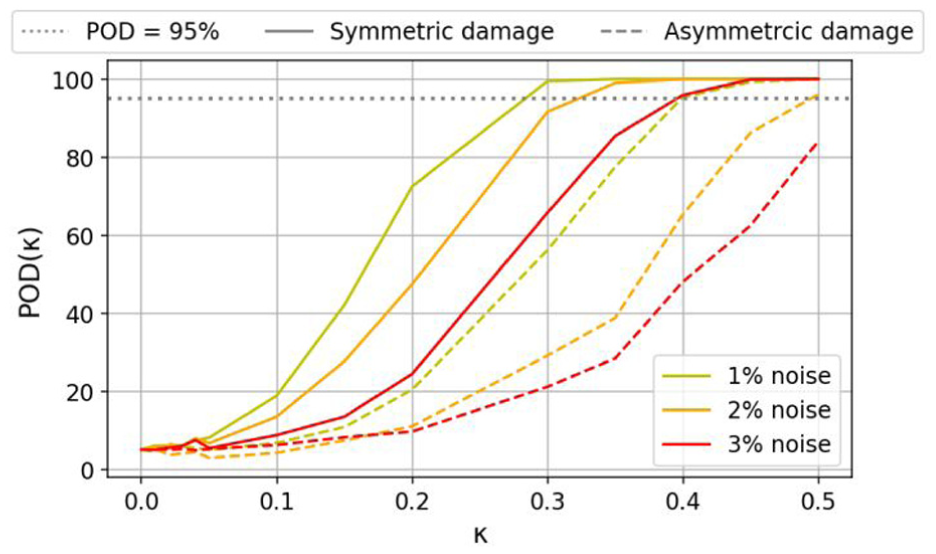
POD curves comparison between symmetric and asymmetric damage scenario at different noise levels under combined scenario.
In addition to frequency shifts, asymmetric damage also affects the structural mode shapes. To investigate this effect, a sensitivity analysis of the Modal Assurance Criterion (MAC) values was performed for all identified modes as the asymmetric damage level increases. The results, shown in Figure 23, indicate a systematic decrease in MAC values with progressive stiffness reduction, particularly for Modes 1 and 4.
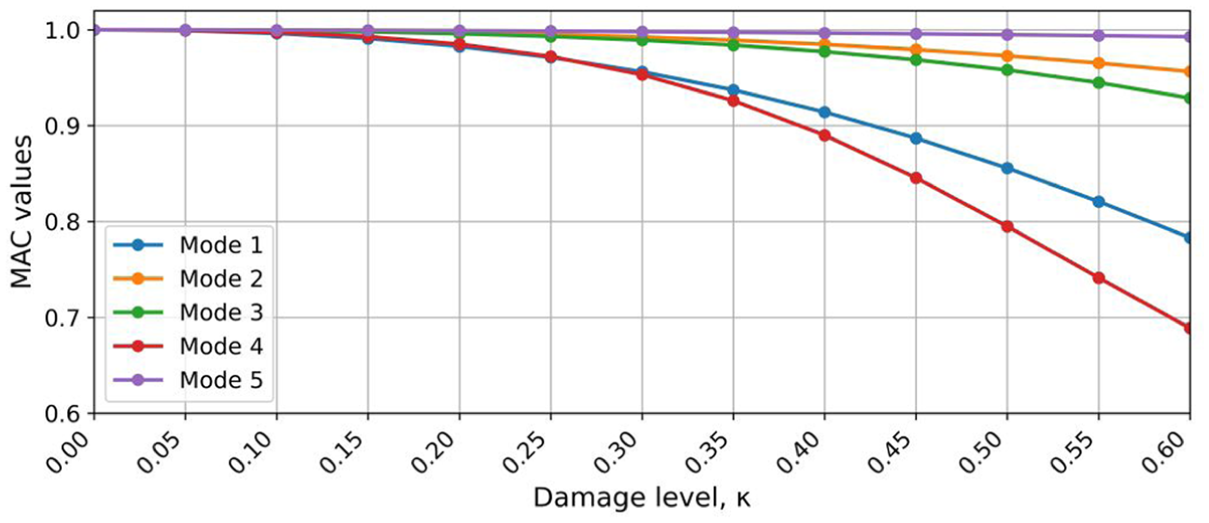
Changes in MAC values between mode shapes from healthy and damaged states for different asymmetric damage levels.
These findings suggest that future damage indices could be extended to incorporate both frequency variations and mode-shape correlation metrics, thereby improving sensitivity to asymmetric degradation mechanisms. However, the present study adopts a frequency-based formulation for two practical reasons. First, natural frequencies are generally more robust and easier to extract reliably under operational conditions than mode shapes. Second, the long-term objective of this research is to support population-based structural health monitoring of ferry quays, where only a single sensor per linkspan is envisaged. Under such sparse instrumentation, frequency-based features provide the most feasible and transferable indicators for large-scale deployment. Nevertheless, the results clearly demonstrate the potential benefit of incorporating mode-shape information, which will be explored in future work when denser instrumentation becomes available.
Impact of mode selection
The preceding analysis revealed that, under asymmetric damage conditions, the DI distribution exhibits signs of strong noise sensitivity. As observed from the modal sensitivity in Figure 19, the limited variation among Modes 2–5 implies that the obtained results could be noise-driven rather than stiffness-driven. This raises an important question: could damage detectability be improved by excluding modes that contribute little to stiffness sensitivity and are dominated by noise effects?
To explore this, a new analysis was conducted in which the least stiffness-sensitive modes were removed from the frequency dataset, namely Modes 3 (green) and 4 (red).
Figure 24 presents the POD curves obtained after sequentially removing these modes and compares the results to the original case, where all five modes were included. The dashed lines correspond to the case with Mode 3 removed (four modes included), while the dotted lines represent the case where both Modes 3 and 4 have been removed (three modes included). For all noise levels, excluding the least stiffness-sensitive modes leads to lower MDD values, indicating improved detectability under noisy conditions. The summary of all MDD values under asymmetric damage analysis can be found in Table 2.
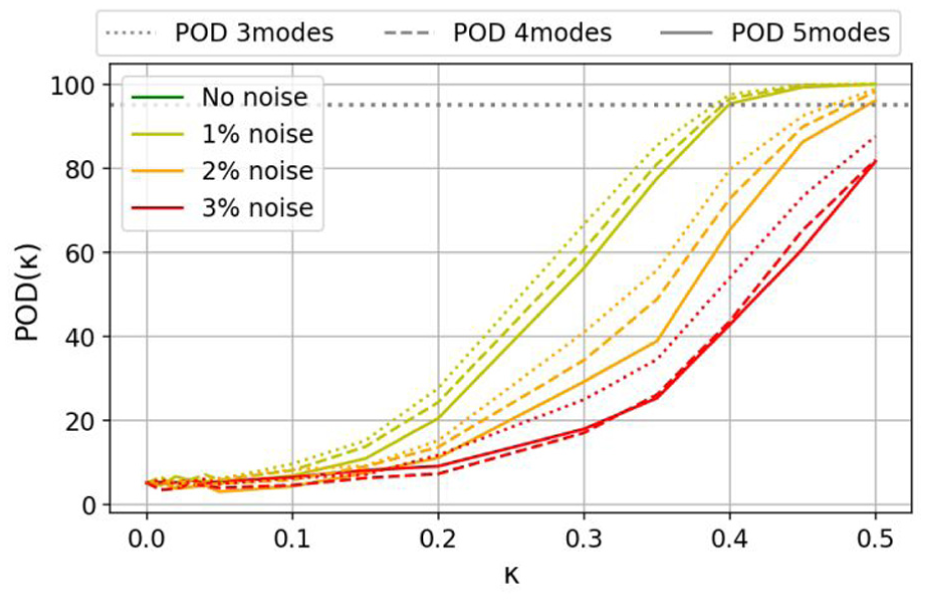
POD curves when removing noise-driven modes at different noise levels.
Summary of MDD values across all asymmetric damage analysis.
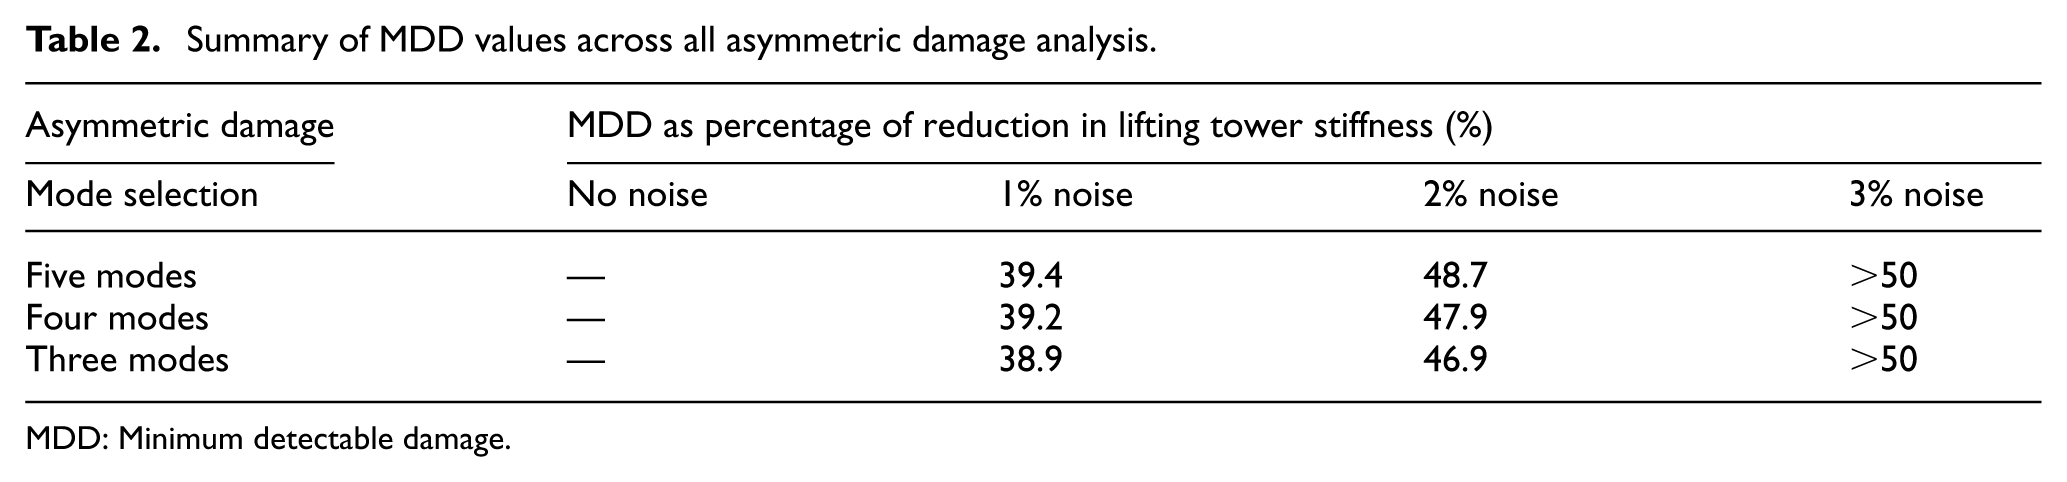
MDD: Minimum detectable damage.
This suggests that, for damage detection where measurement noise is present, pre-screening modal data based on stiffness sensitivity can enhance detection performance. By excluding modes with low sensitivity, the resulting DI distributions become more stiffness-driven, reducing MDD and improving robustness against noise.
It should be noted that large asymmetry can reorder/mix mode shapes and complicate FE–measurement matching, and therefore, asymmetric simulations were limited to moderate stiffness reductions.
Conclusions
This study presented a FE model-based framework for identifying the MDD of the lifting towers at the Magerholm ferry quay under realistic environmental conditions. Damage was modeled as a reduction in the stiffness of the lifting tower springs in the updated FE model. Environmental effects were incorporated through temperature-dependent variations in Young’s modulus and tidal-dependent variations in spring stiffness. Three simulation groups were investigated: Temperature-only, Tide-only, and Combined. DIs were derived from the natural frequencies using the Mahalanobis distance, and the detectability of damage was evaluated through POD and ROC curves.
The main findings can be summarized as follows:
Temperature variations alone have minimal influence on natural frequencies, resulting in MDD as low as 1%.
Tidal variability strongly masks damage and produces MDD significantly higher—19.7% underscoring its dominant influence.
When tide and temperature effects were combined, the MDD further increased to 22%, demonstrating the compounding effect of multiple environmental factors.
Measurement noise lowers detectability. The MDD increased from 22% without noise to 25.2% (1% noise), 33% (2% noise), and 35% (3% noise).
Asymmetric damage (one tower only) yields less distinguished DI distributions, resulting in MDD being as high as 39% (1% noise) and beyond 50% (3% noise).
Excluding low-sensitivity modes (e.g., Modes 3 and 4) can reduce noise-driven variability and lower MDD under noisy conditions.
Overall, the findings show that explicitly modeling environmental variability is essential for reliable FE-based SHM of linkspans. Among the environmental factors considered, tidal variation had the strongest impact on natural frequencies and detectability. Measurement noise adds a further challenge by elevating MDD thresholds, especially in asymmetric damage scenarios where modal sensitivity is lower. Removing noise-insensitive modes mitigates this effect, leading to improved detectability and lower MDD values.
From a practical perspective, the present study provides quantitative detection limits that can support risk-informed maintenance planning for ferry quay infrastructure. The derived MDD values allow operators to assess which levels of stiffness degradation are realistically detectable under combined temperature, tidal, and measurement noise conditions, thereby enabling maintenance decisions to be based on detectability rather than visual inspection alone. The results further demonstrate that environmental effects, particularly tidal variations—must be explicitly incorporated into baseline models to avoid overly optimistic detection thresholds. In addition, alarm thresholds should be formulated in a noise-aware manner, accounting for uncertainty in frequency extraction. For asymmetric damage scenarios, where frequency changes are more subtle and noise sensitivity is higher, stricter monitoring quality and extended feature sets (e.g., inclusion of mode-shape correlation metrics such as MAC) are recommended. Finally, while the present framework is based on an updated deterministic FE model, future work should integrate Bayesian model updating to propagate model uncertainty into detectability estimates and validate detection thresholds using long-term field measurements as monitoring data become available.
Footnotes
Declaration of conflicting interests
The authors declared no potential conflicts of interest with respect to the research, authorship, and/or publication of this article.
Funding
The authors disclosed receipt of the following financial support for the research, authorship, and/or publication of this article: The authors wish to acknowledge the support from the Research Council of Norway through the SARTORIUS project (Project No. 353029) and Møre og Romsdal Fylke for access to their ferry quays.