
Abstract
Ensuring the structural integrity of bridges is essential for maintaining infrastructure safety and promoting long-term sustainability. In this context, indirect structural health monitoring (ISHM) through drive-by bridge inspection emerges as a promising alternative to traditional inspection methods, offering a cost-effective and scalable solution by leveraging vehicle-mounted sensors to assess the condition of bridges without requiring direct instrumentation. To our knowledge, this study introduces the first purpose-built electric inspection vehicle specifically designed for drive-by bridge inspection. The autonomous platform is capable of maintaining a constant low speed and offers customisable operational parameters to maximise the accuracy and repeatability of indirect sensing capabilities not achieved in previous studies. The vehicle is deployed within an ISHM framework and tested on two full-scale bridges to evaluate its effectiveness in capturing structural dynamic responses. Three rigorous unsupervised frameworks are then employed to analyse the collected data to identify features indicative of bridge properties and structural condition, including adversarial autoencoders, matrix profile and transformer network. The promising findings from this study demonstrate the practical feasibility of the approach. The study underscores the potential of ISHM as a viable tool for efficient bridge monitoring, contributing to the development of next-generation structural health monitoring systems that enhance safety, optimise maintenance strategies and support the longevity of critical infrastructure.
Keywords
Introduction
Bridges are critical components of modern infrastructure, enabling the transportation of people and goods while supporting economic stability and connectivity. 1 Their structural integrity is vital to public safety, operational efficiency and sustainable development. However, as these structures age, they are subjected to various deteriorating factors, including environmental effects, material degradation, increasing traffic loads and unexpected external events. 2 Such degradation can lead to catastrophic failures, as seen in the collapse of the Morandi Bridge in Italy (2018) and the failure of the Saint Anthony Falls Bridge in the United States (2007).
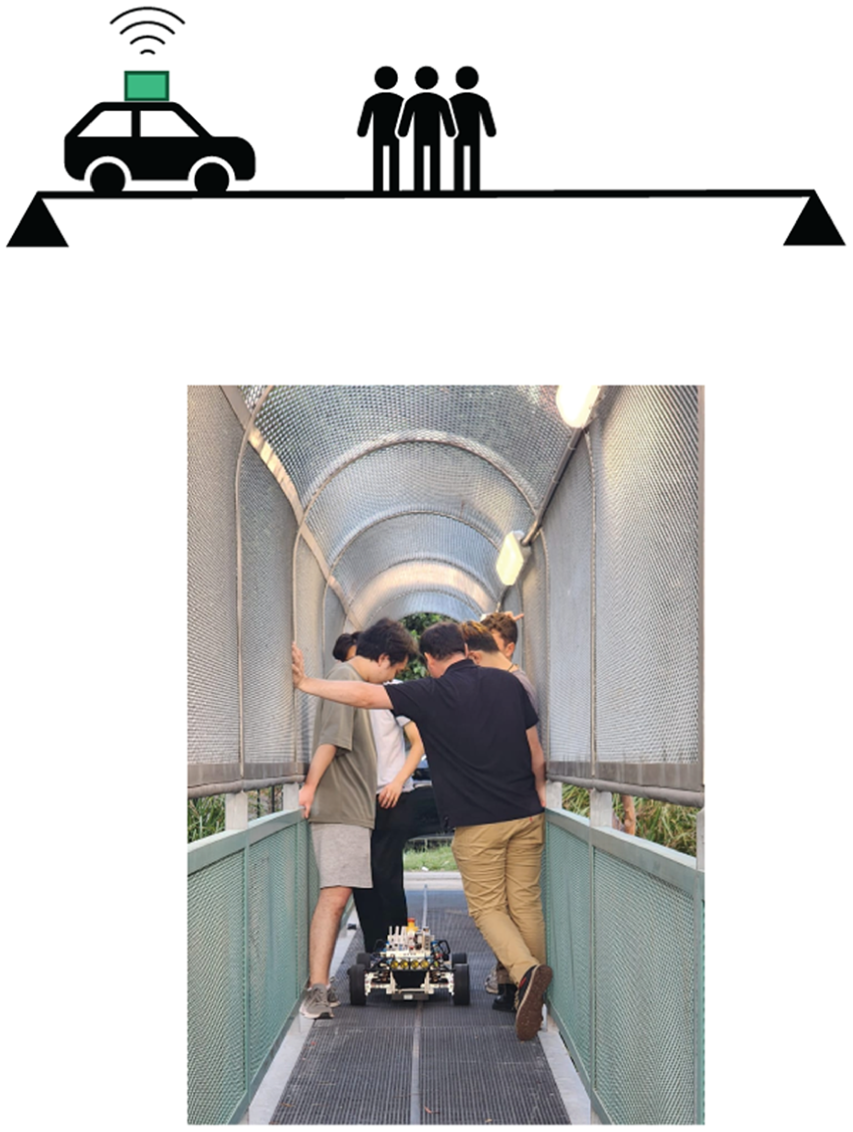
Worldwide, bridge infrastructure maintenance is an increasing challenge. For instance, in Australia, the majority of bridges were constructed prior to 1976, and many are now approaching or exceeding their design lifespans. 3 At the same time, bridge usage is projected to increase by 300% over the next three decades, intensifying the demand for reliable and cost-effective monitoring strategies. 4 Currently, periodic visual inspection remains the dominant approach, typically conducted every 2 years. 5 Despite its widespread use, this method suffers from several limitations, such as being subjective, labour-intensive, expensive and inherently restricted in scope due to its dependence on the inspector’s criteria. 6 More specifically, in Australia, a substantial proportion of short- to medium-span bridges are located in regional and remote areas where access to power, communication infrastructure and continuous monitoring systems is limited. Accordingly, this project targets the development of a low-cost, adaptable inspection framework specifically suited to short- and medium-span bridges that operate under such constraints. Although the present study focuses on two Australian bridges, the proposed approach is designed to be generalisable to similar bridge types worldwide. In addition, recent work by the authors 7 has proposed design guidelines for the configuration and optimisation of the inspection vehicle, further supporting the adaptability of the system to a wide range of operational environments.
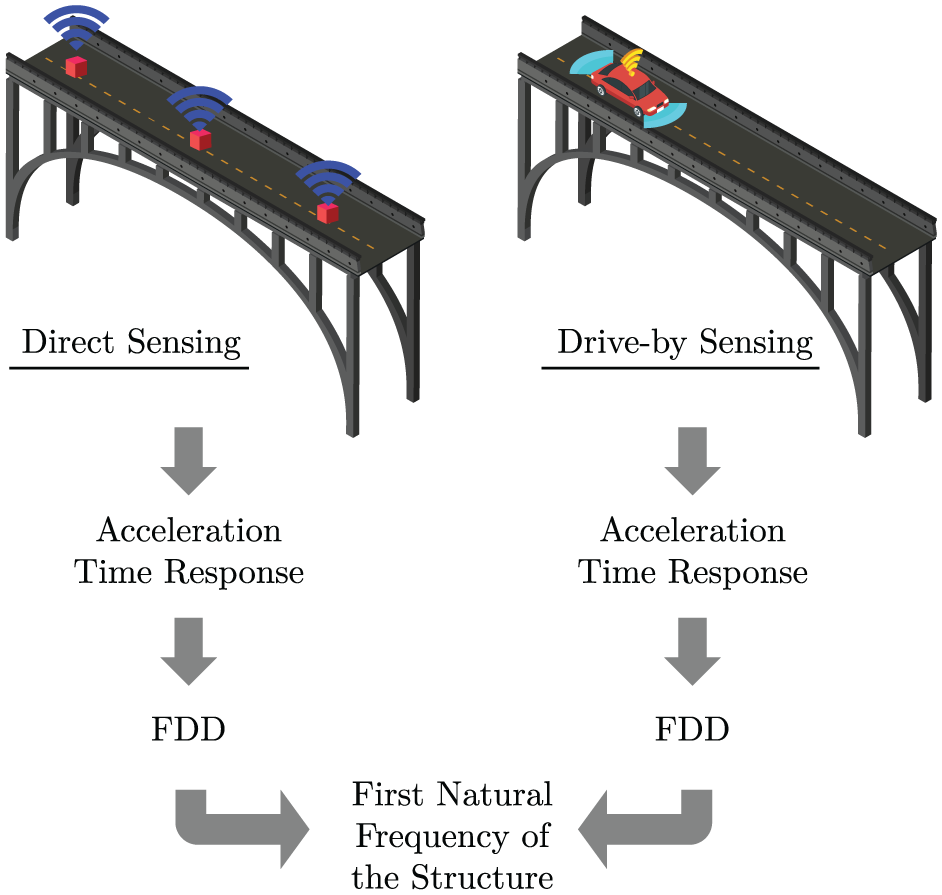
To address these limitations, the demand for automated, objective and continuous structural health monitoring systems (SHMS) has grown considerably. In particular, indirect structural health monitoring (ISHM) using drive-by bridge inspection has emerged as a promising alternative to visual inspections and conventional SHMS, which rely on fixed sensors installed directly on the structure. 8 By contrast, drive-by bridge inspection involves instrumented vehicles crossing the bridge, using the dynamic response measured by mounted sensors, to infer the bridge’s condition. This approach enables the extraction of modal properties, such as natural frequencies, damping characteristics and potential damage indicators. Its advantages include low cost, scalability across many structures and reduced deployment and maintenance effort. 2
Over the past two decades, numerous laboratory studies have contributed to validating drive-by methodologies under controlled conditions. Zhang et al. 9 used wavelet-based time–frequency analysis to extract mode shapes from a scaled beam, while Kim et al. 10 introduced artificial damage through saw cuts and added masses to demonstrate damage identification using frequency and damping changes. Cerda et al.5,11 conducted scaled laboratory tests where damage was simulated by changing boundary conditions and adding mass, validating classification-based identification techniques using frequency-domain analysis. Mei et al. 12 applied Mel-frequency spectral coefficients (MFCC) and principal component analysis to detect damage in a scaled setup using a two-axle instrumented vehicle.
Recent studies have focused on improving robustness under variable operating conditions. Liu et al. 13 proposed a multi-task unsupervised learning framework that uses short-time Fourier transform signals from multiple vehicles to identify, localise and quantify bridge damage, achieving high identification accuracy across different test scenarios. Li et al. 14 combined MFCCs with support vector machines to achieve high detection sensitivity and low computational cost in a scaled experiment. Singh and Sadhu 15 introduced a hybrid signal processing technique that effectively isolates bridge dynamics from noisy vehicle signals using wavelet packet transform and synchro-extracting transform, even under varying speeds. Yang et al. 16 demonstrated the effectiveness of variational mode decomposition in extracting modal frequencies despite strong vehicle-induced noise.
In terms of model generalisation and scalability, Liu et al. 17 developed a transfer learning method using adversarial and multi-task networks, allowing damage classifiers to generalise across different structures without labelled data. Matarazzo and Pakzad 18 introduced STRIDEX, a blind deconvolution approach that isolates bridge responses from vehicle signals without relying on detailed system models. Eshkevari et al. 19 proposed the crowdsourced modal identification using continuous wavelets technique, showing that fusing data from multiple smartphone-equipped vehicles increases identification reliability compared to single-vehicle systems.
Although laboratory validations are promising, real-world applications are more complex and remain limited. Most experimental tests in real bridges focus on the identification of dynamic properties. Yang et al. 20 and Lin and Yang 21 extracted bridge natural frequencies through frequency-based methods, with the latter using additional truck mass to enhance response amplitude. Locke et al. 22 applied operational modal analysis in a field setting, though their methodology was constrained to short-span bridges. Yang et al. 23 conducted field testing on the Turtle Mountain Bridge using frequency-domain analysis of contact point accelerations to extract dynamic properties, providing practical validation of vehicle–bridge interaction models. Additional field validations by Kong et al. 24 and Yang et al. 25 confirmed the effectiveness of tractor-trailer and contact-point acceleration approaches, respectively, for identifying bridge frequencies without fixed sensors. McGetrick and Kim 26 emphasised the challenges of simulating repeatable artificial damage in operational bridges, which remains a key limitation for full-scale ISHM validation. As summarised in Table 1, previous studies focused on the scaled vehicle and bridge model in laboratory conditions or relied on a commercial passenger vehicle for full-scale testing. However, the use of a custom-built inspection vehicle specifically designed for ISHM has not been reported. Laboratory-scale setups cannot fully capture the complexities of real bridge dynamics, while commercial vehicles offer only limited control over speed and allow restricted flexibility in sensor placement.
Drive-by experimental studies summary.
Despite these successes, ongoing research in advanced signal processing, robust machine learning techniques and optimised vehicle configurations continues to enhance the feasibility of these methods for real-world applications.
This study advances drive-by bridge inspection for full-scale, operational structures by building on two rigorous ISHM frameworks.32,33,37 For the first time, we introduce a purpose-built autonomous inspection vehicle and demonstrate its application in field tests to identify key dynamic properties and evaluate its practical potential for damage assessment. The outcomes of this work contribute to the development of scalable, cost-effective SHMS that support the long-term safety, maintenance and sustainability of bridge infrastructure.
Research contribution
Building on previous work by this research group,32,33,37 which introduced novel drive-by bridge damage assessment frameworks validated under controlled laboratory conditions, this study extends those unsupervised approaches to two full-scale, in-service bridges. The primary contributions of this research are as follows:
(a) Development of an autonomous inspection vehicle: We designed, constructed and field-characterised what is, to our knowledge, the first purpose-built autonomous platform for drive-by bridge inspection. This platform integrates custom instrumentation and control systems to serve as a versatile mobile sensing unit.
(b) Indirect characterisation of bridge dynamics: During multiple crossings over real bridges, the autonomous vehicle successfully captured vibrational data that revealed key dynamic properties (e.g., natural frequencies) without the need for fixed sensors on the structures.
(c) Field validation of unsupervised damage assessment techniques: The study applied and validated previously proposed indirect sensing methodologies under operational conditions, demonstrating their effectiveness for real-world damage detection and underscoring the practical value of prior ISHM frameworks.32,33,37
(d) Additionally, all experimental data and analyses presented in this paper are original. The field tests and dataset collection were conducted specifically for this study to validate the proposed customised vehicle scanning system.
(e) Integration of advanced learning frameworks for drive-by SHM: The study incorporates the AMFormer Transformer model 38 and the StiefelGen data augmentation method, 39 adapted for frequency-domain singular-value sequences from vehicle–bridge interaction data. This integration enables data-efficient, attention-based anomaly detection and addres-ses data scarcity in deep learning models.
The paper is structured as follows: section ‘A novel autonomous inspection vehicle’ details the configuration and characterisation of the proposed novel inspection vehicle. Section ‘Experimental case studies’ presents the two case studies used for field test validation. Sections ‘Methodology’ and ‘Results’, respectively, describe the proposed methodologies for damage assessment, as well as the results obtained from both direct and indirect sensing across the two case studies. Finally, section ‘Conclusions’ summarises the main findings and provides recommendations for future work.
A novel autonomous inspection vehicle
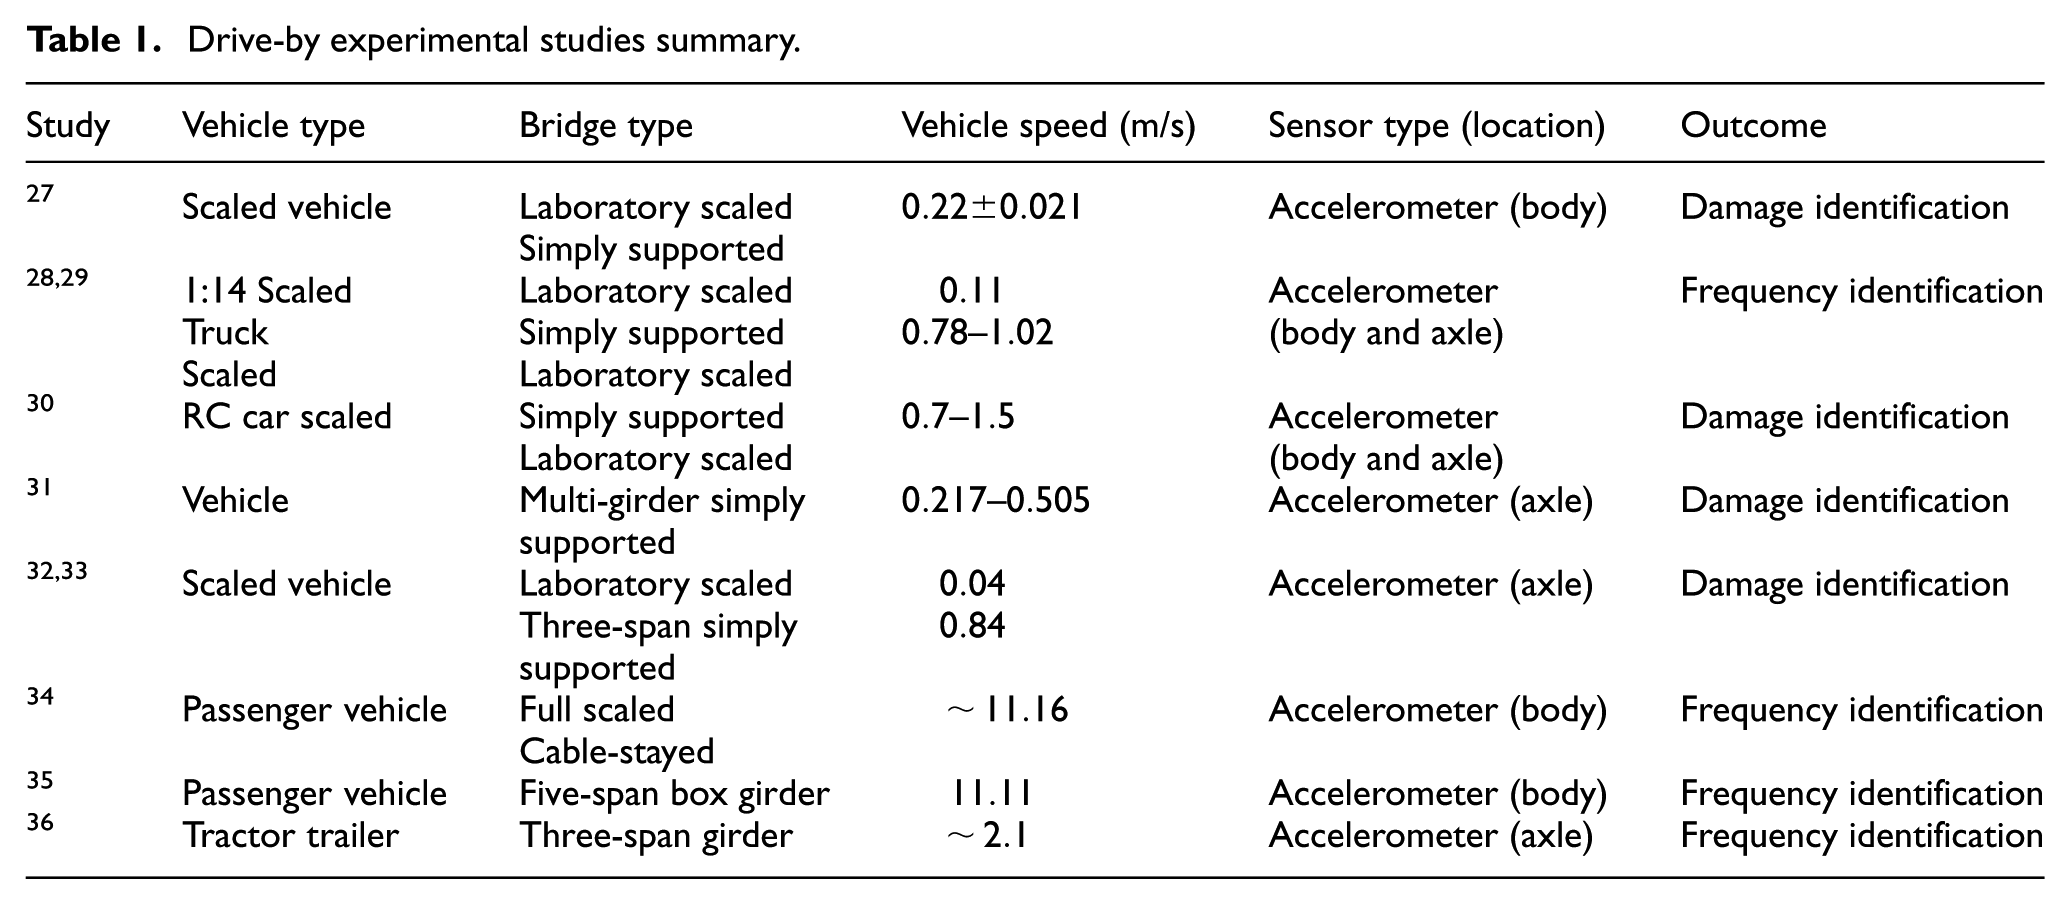
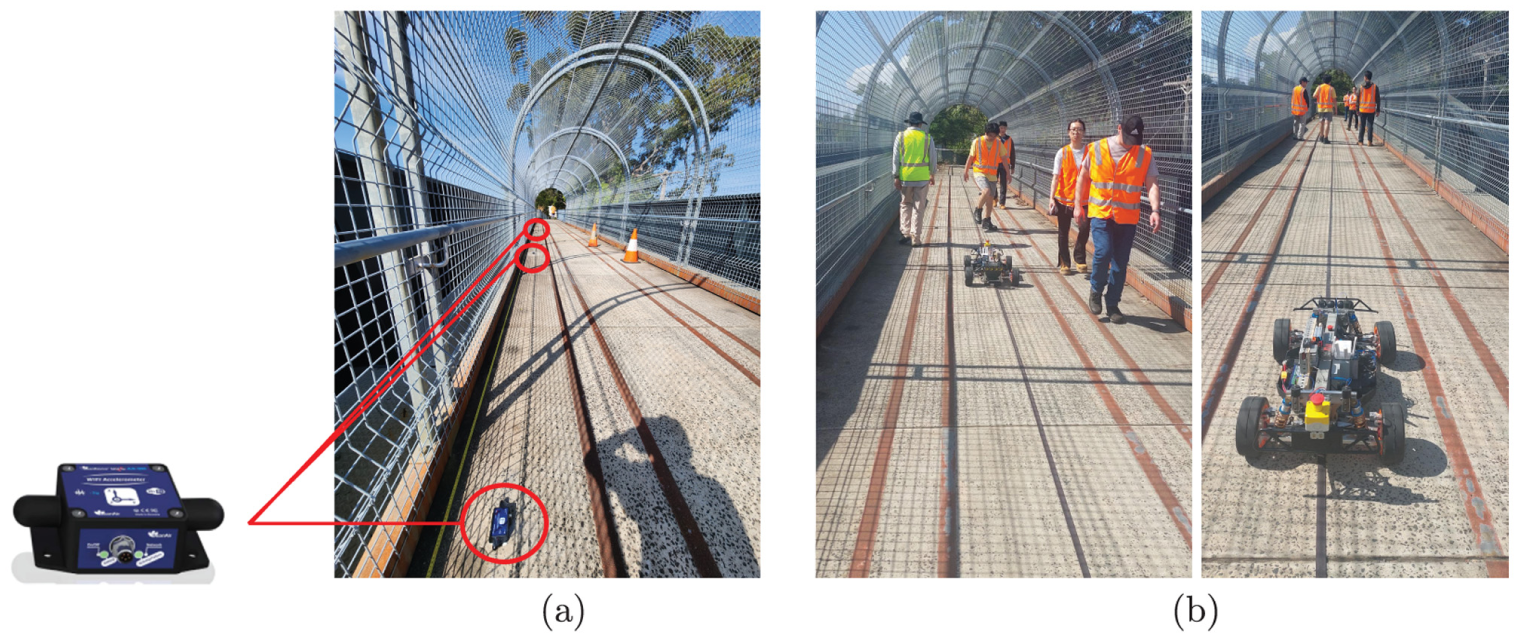
This section presents the inspection vehicle setup, specifically designed and developed to perform drive-by bridge inspections. The inspection vehicle is a customised 1:5 scale electric Remote Control (RC) car, adapted to carry the necessary instrumentation for bridge monitoring. Figure 1 illustrates the complete inspection vehicle and its data management system. Specifically, it is equipped with four timely synchronised PCB-ICP393B05 accelerometers, one mounted on the suspension system of each wheel, capable of measuring within a
Inspection vehicle setup for drive-by bridge inspection.
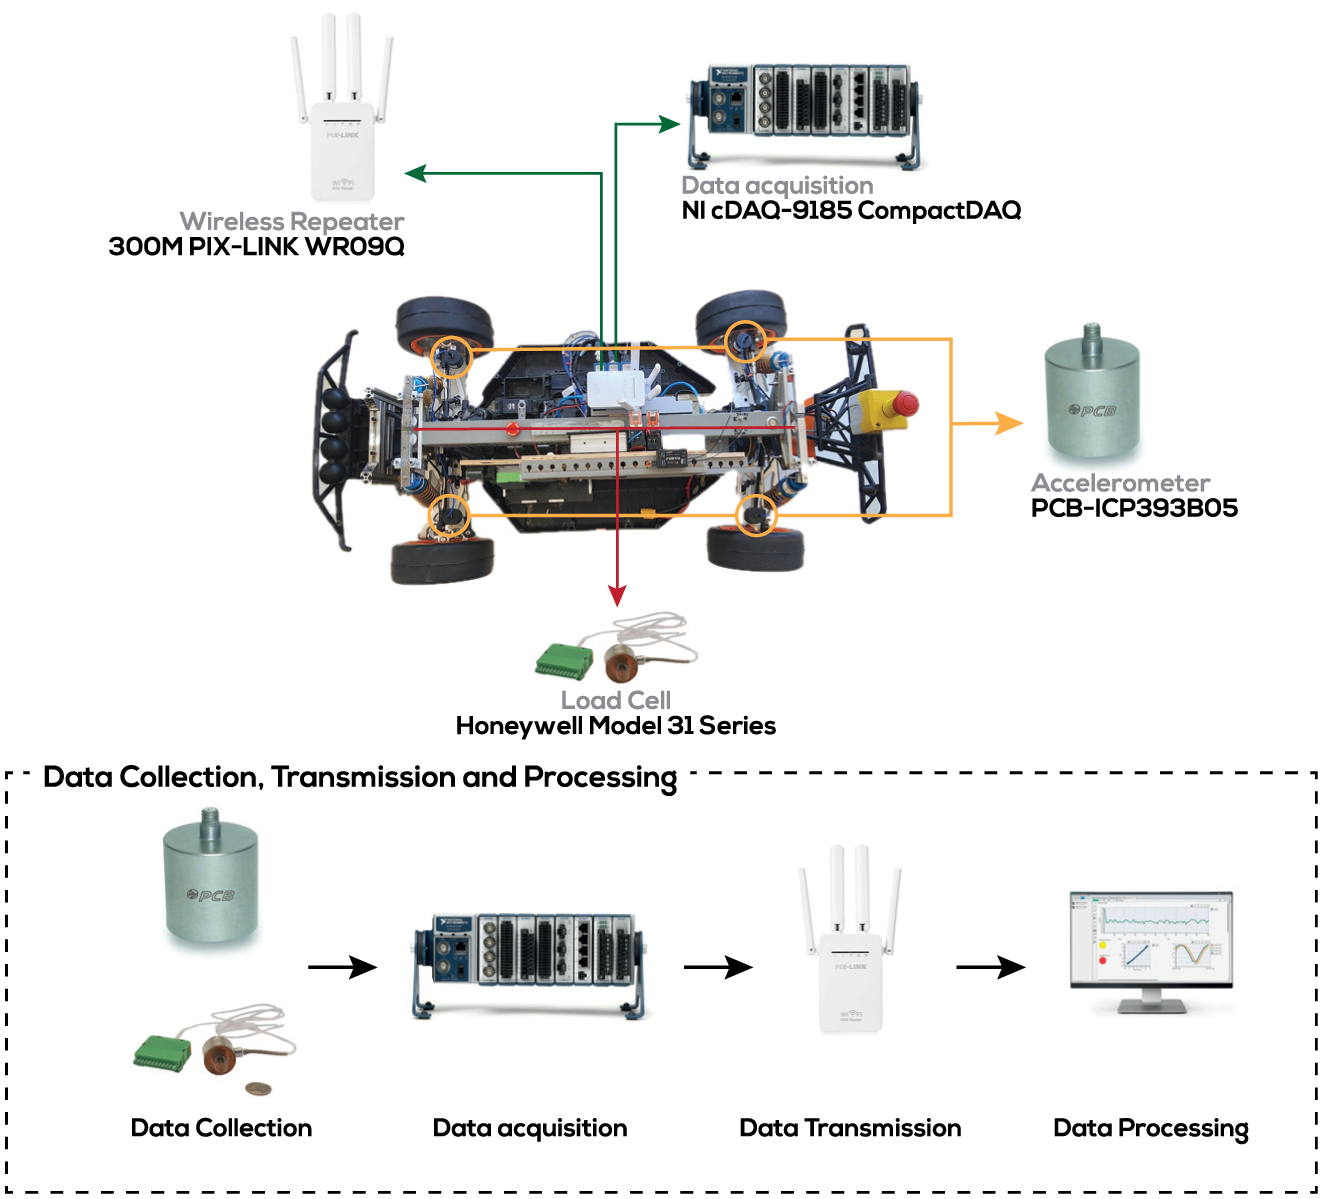
Illustration of (a) system block diagram and (b) suspension tower.
The vehicle’s autonomous control architecture ensures both precise path following and a stable inspection speed, critical for consistent data collection for drive-by bridge scanning purposes. Steering guidance is achieved using a RoboteQ MGSW1600 magnetic guide sensor, which continuously tracks a magnetic tape embedded along the inspection route. This approach ensures that the vehicle follows exactly the same path in every run, improving test repeatability and reducing the influence of surface unevenness. The vehicle can also be operated manually via remote control when the use of magnetic guidance is not feasible in practical conditions. Its real-time output interfaces directly with the steering servo, enabling precise path tracking and delivering high accuracy in lateral positioning, while also facilitating smooth navigation even over uneven surfaces. A closed-loop feedback system handles speed regulation: an AMS Hall-effect sensor mounted on the drive train shaft measures rotational speed and relays this data to an ESP32 microcontroller. The ESP32 implements a PID control algorithm that adjusts the motor speed via a standard R/C electronic speed controller, working in tandem with a reduction gearbox to convert high-RPM motor output into the slow, torque-rich speeds required for scanning. A double-pole double-throw switch provides seamless toggling between manual and autonomous modes for both steering and motor drive control, allowing the operator to intervene for greater flexibility in operation, if required. This integrated system maintains target speeds, maximises data repeatability, and minimises operator workload during extended field campaigns. This architecture is shown in Figure 2(a). The overall system, with a vehicle mass of 20 kg and axle distance of 80 cm, offers a robust and adaptable platform for efficient and repeatable drive-by bridge inspections, with operating speeds varying from 0.1 to 10
Inspection vehicle’s characteristics
Accurately characterising the dynamic properties of the inspection vehicle is essential for reliable drive-by sensing. To this end, a driving test is performed in which the vehicle is driven at a constant velocity of 0.17
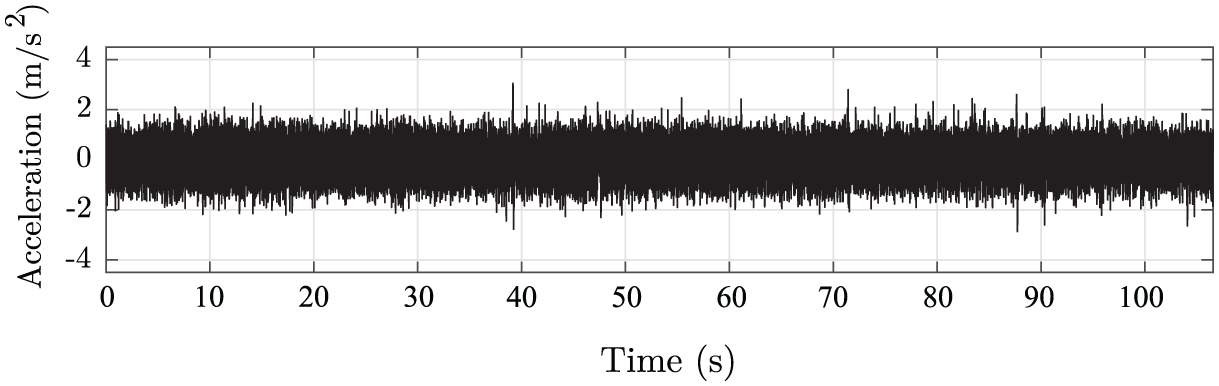
Acceleration responses from four accelerometers mounted on the vehicle’s suspension are recorded and processed using frequency-domain decomposition (FDD) to identify the dominant motor-related frequencies.
The FDD methodology is expressed as follows
40
: considering a matrix
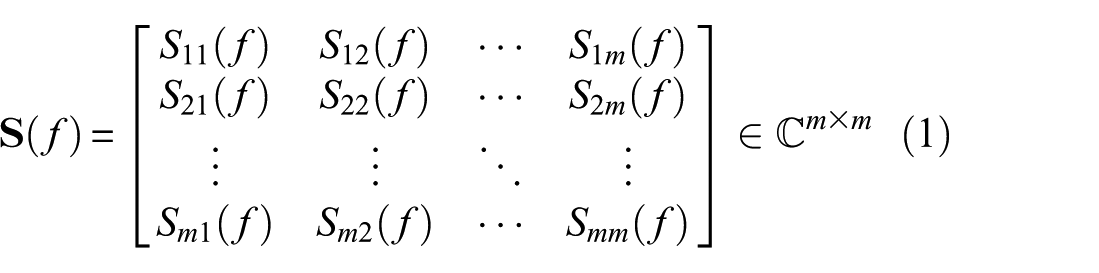
where

where
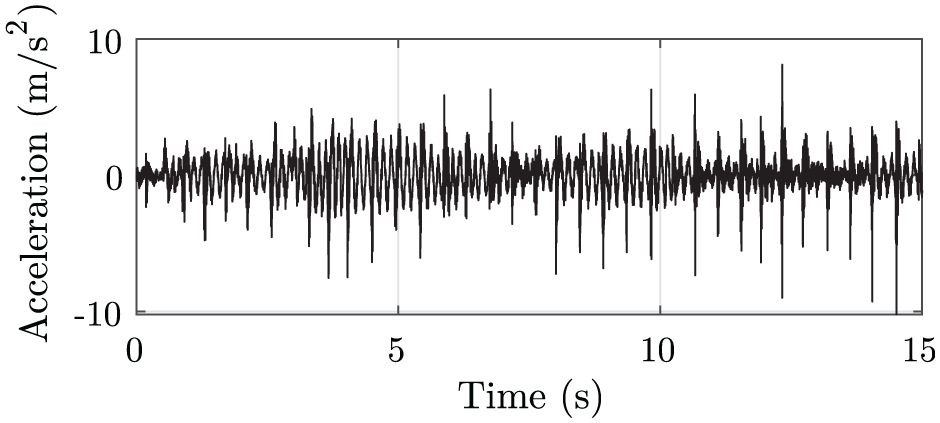
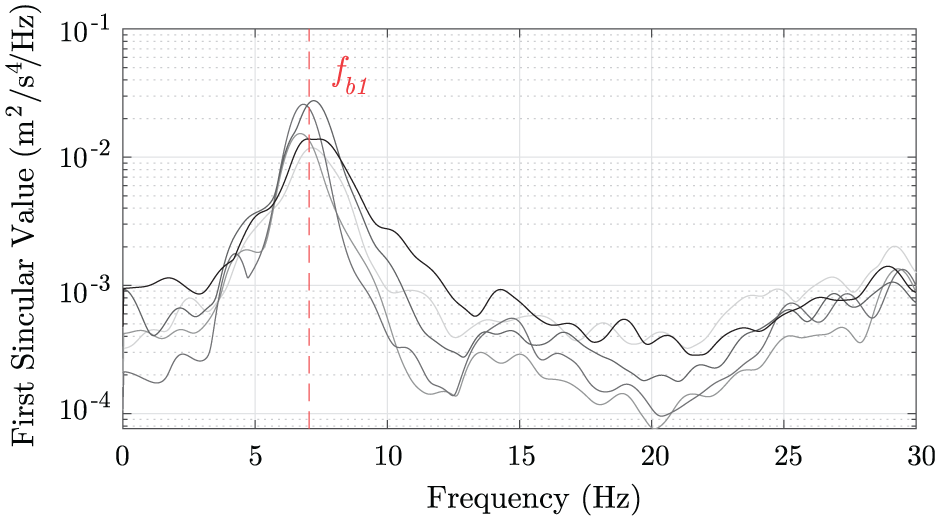
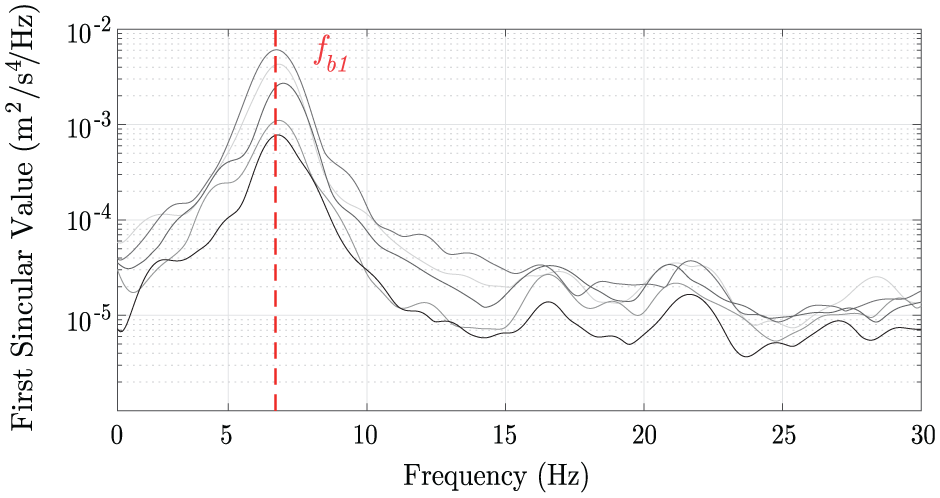
Figure 3 presents the analysis of the test conducted to characterise the inspection vehicle. Figure 3(a) shows an example of the acceleration response from one of the vehicle’s sensors during a driving test. Figure 3(b) illustrates the first singular value, from the FDD analysis, across five different tests when the vehicle’s speed is maintained at a constant velocity of 0.17 m/s. It can be observed that the electric motor produces a dominant frequency,
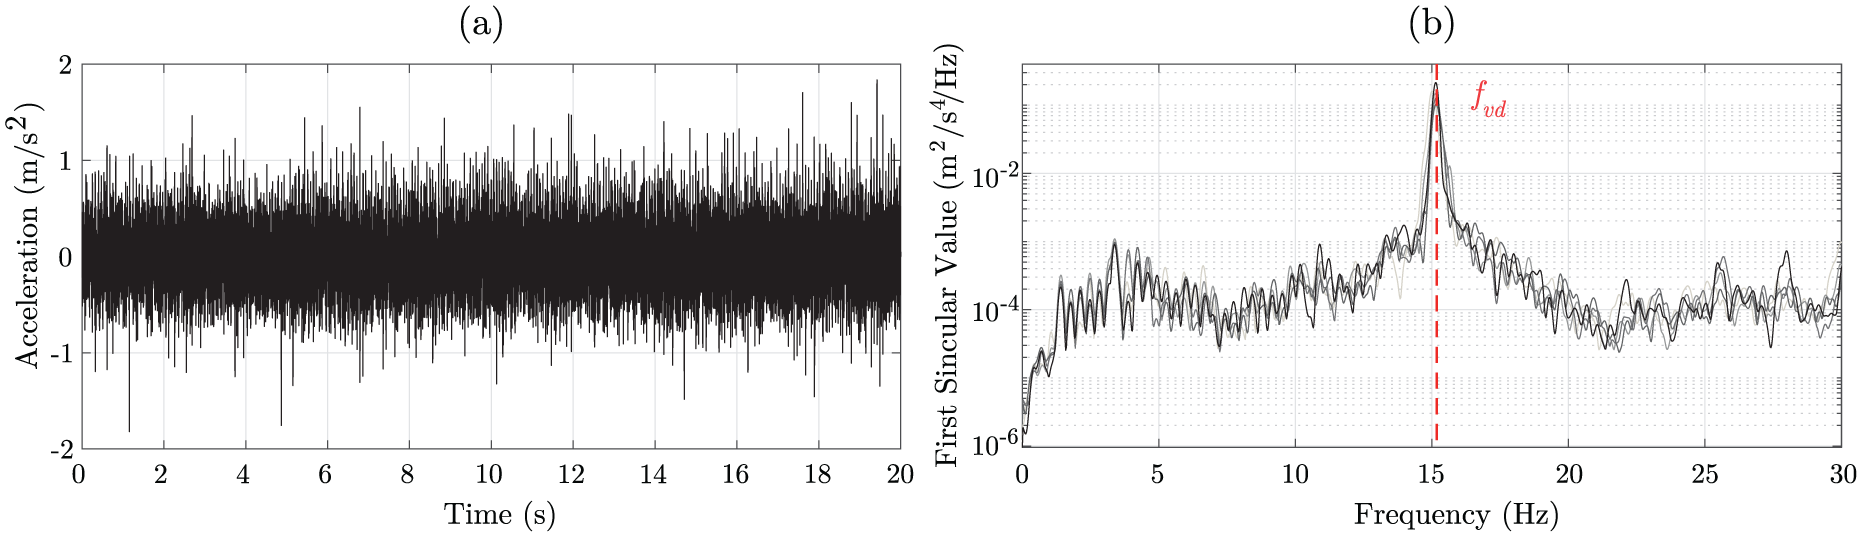
Identification of the driving frequency associated with the electric motor in the inspection vehicle: (a) acceleration time response from the accelerometer mounted on the front-right suspension arm and (b) the first singular value from five different driving tests incorporating all four accelerometer responses. The vehicle drives at a constant speed of 0.17 m/s over a smooth surface where no interaction with the bridge exists. The red dashed line represents
Experimental case studies
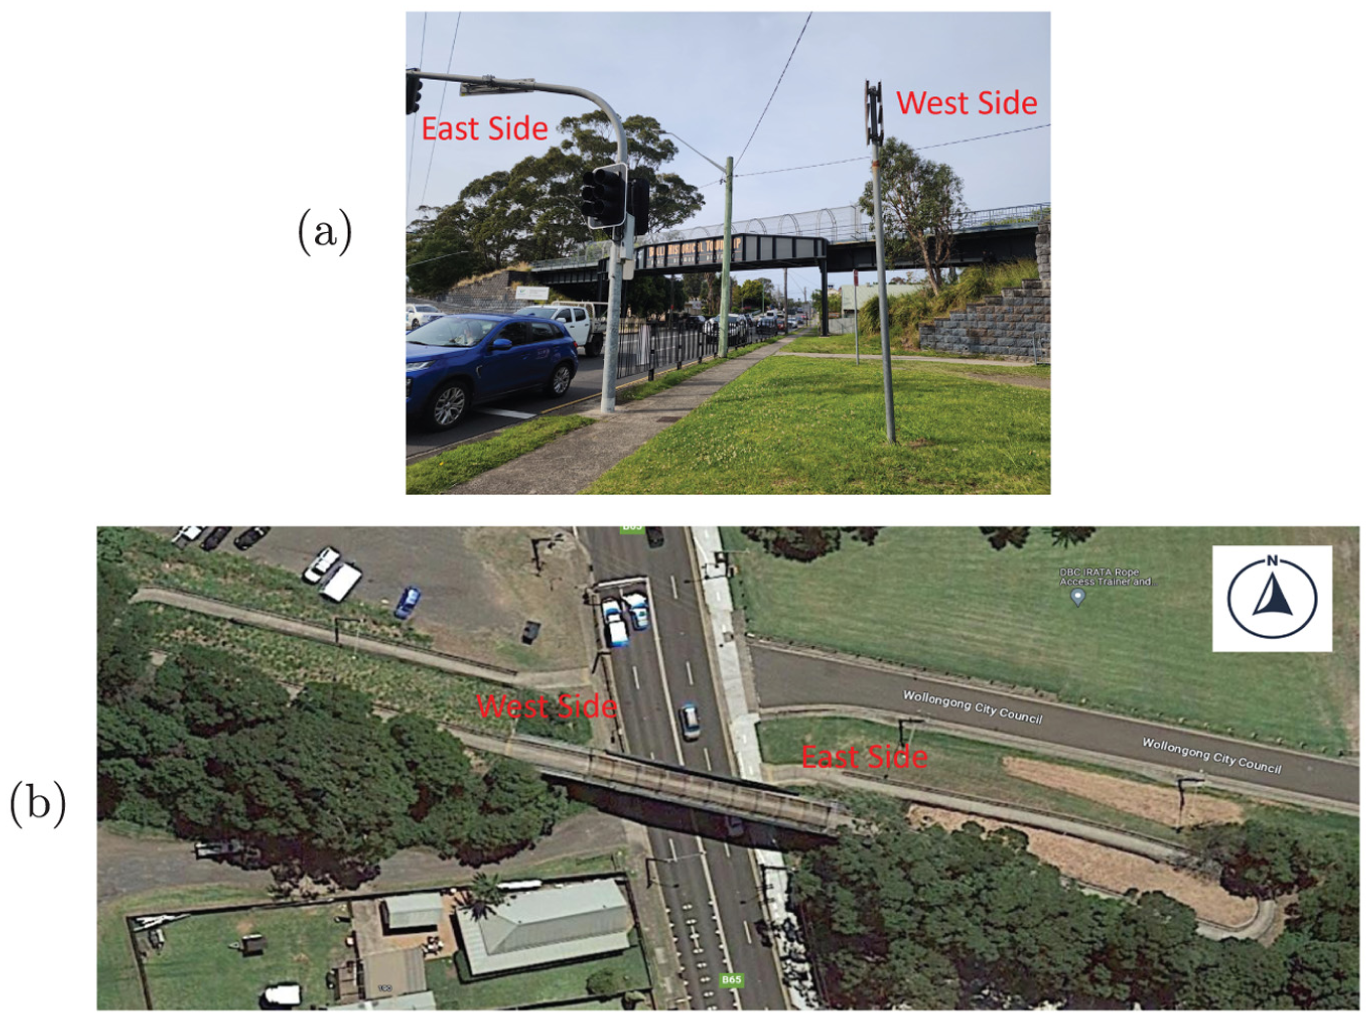
Case study I: pedestrian bridge at UNSW
The first case study analyses a real pedestrian bridge located at the Kensington campus of the University of New South Wales in Sydney, Australia. The bridge is a simply supported steel structure with a total length of 17
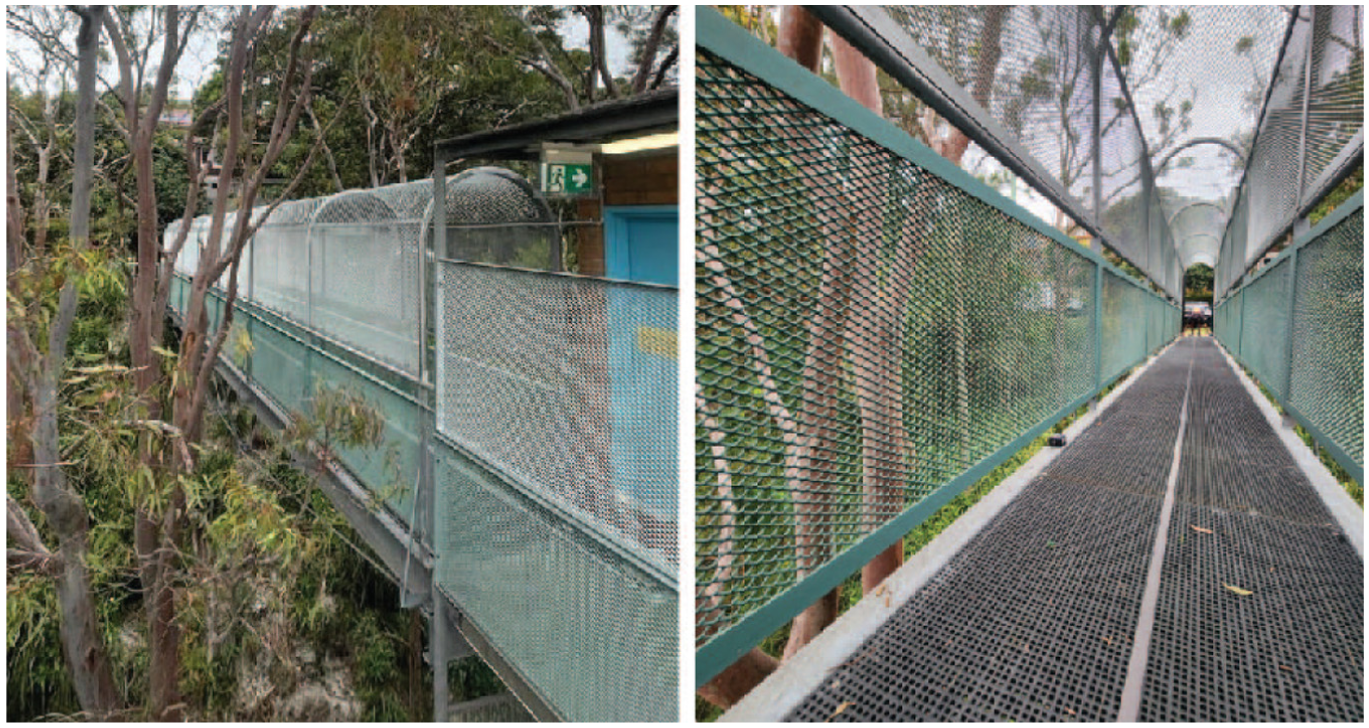
Pedestrian bridge to be inspected, located at the Kensington campus of the University of New South Wales, Australia.
Two measurement campaigns are conducted on this pedestrian bridge (see Figure 5). First, a direct sensing is conducted to identify the structure’s first natural frequency, which is later used as a benchmark to verify the indirect sensing. In the second stage, an indirect sensing using drive-by inspection is performed on the bridge.
Bridge natural frequency identification.
Direct sensing
For the first test, three wireless accelerometers are installed at the quarter-span locations of the bridge, as shown in Figure 6(a). The sensors used are BeanAir Willow AX-3D triaxial accelerometers, configured with a sampling frequency of 500
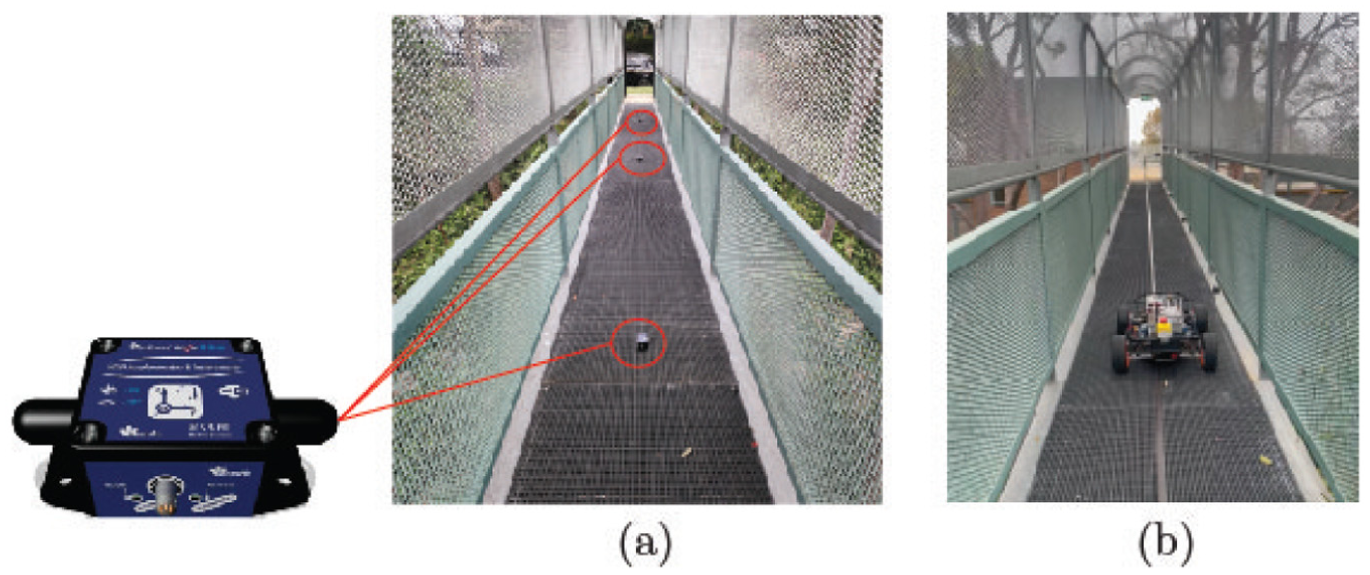
Tests on the pedestrian bridge at UNSW: (a) direct test with three triaxial BeanAir sensors installed on the bridge and (b) drive-by inspection.
To identify the structure’s first natural frequency, the FDD method is applied to the acceleration signals. As described in ‘Inspection vehicle’s characteristics’ section, the FDD method involves computing SVD of the CPSD matrix constructed from the acceleration signals. In this study, only the first singular value is considered, and the peak in this spectrum is taken as the estimate of the first natural frequency of the structure.
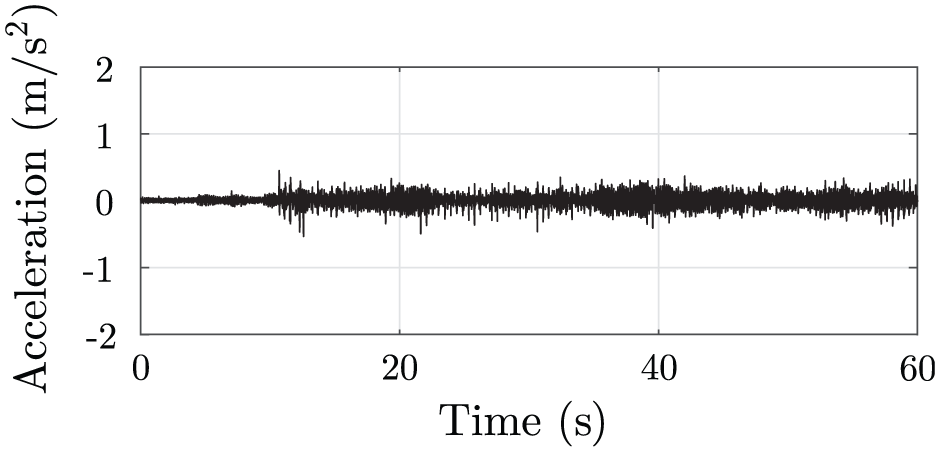
Figure 7 shows a representative example of the acceleration time series recorded by one of the sensors located on the bridge, illustrating the typical duration and amplitude of the measured response. Then, the FDD analysis was performed on the recordings from the three sensors, following the procedure described in ‘Inspection vehicle’s characteristics’ section, but using the frequency spectra from the three fixed bridge sensors instead of those from the vehicle sensors. Figure 8 shows the first singular values obtained from five independent tests. It is confirmed that the first natural frequency of the bridge is
Representative acceleration time series recorded by one of the sensors located on the bridge.
First singular values from five different direct inspection tests. The red dashed line represents the averaged first natural frequency of the structure.
Indirect sensing
The second test consists of a drive-by inspection (see Figure 6(b)). To this end, 49 passes of the inspection vehicle are performed at a constant speed of 0.17
Acceleration time series from one of the vehicle-mounted sensors during the drive-by inspection.
Figure 10 presents the first singular values obtained from the FDD (i.e., as described in ‘Inspection vehicle’s characteristics’ section), considering the acceleration responses of the four mounted accelerometers. The figure displays the results from five different vehicle runs over the bridge. The average first natural frequency of the structure, identified from the peaks of the singular value plots, is
First singular values from five different indirect inspection tests. The red dashed line represents the averaged first natural frequency of the structure
Table 2 presents the peak values of the first singular values obtained from both direct sensing tests (see Figure 8) and indirect sensing tests (see Figure 10). The low standard deviation of the obtained peaks confirms the consistency of the results across all tests, and the agreement between direct and indirect measurements supports the correct identification of the first natural frequency of the structure. The slight differences observed between the two measurement types are attributed to the different experimental setups and the use of distinct sensor systems in each configuration.
Comparison of peak values from the first singular value obtained from direct and indirect sensing tests(case study I).
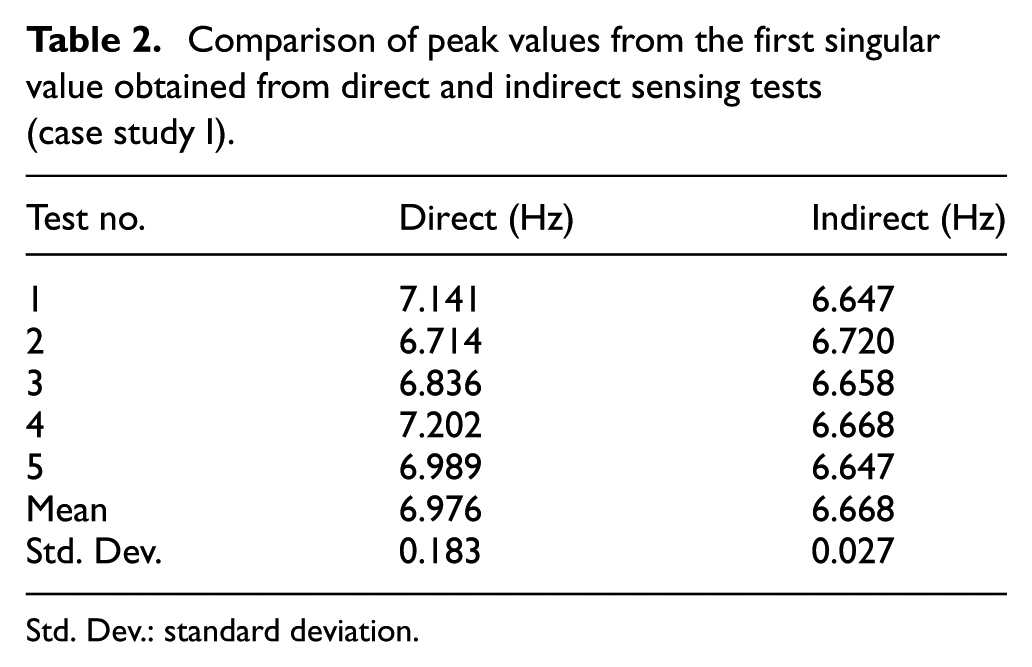
Std. Dev.: standard deviation.
Case study II: Bulli Colliery Bridge
The second case study examines a real bridge located in Bulli, NSW, Australia. The bridge, named the Bulli Colliery Bridge, is a steel girder bridge that spans the Princes Highway in Bulli. The Bulli Colliery Bridge was originally built to transfer coal trucks to the Illawarra railway line, but is currently used as a pedestrian bridge. It consists of three spans, with the middle span being the focus of this study. The target span is 23.9
Bulli Colliery Bridge location: (a) the side view of the bridge pointing in the south direction and (b) the top view of the bridge (taken from Google Maps).
Direct sensing
As in case study I, two tests are performed on this structure. The first test (see Figure 12(a)) corresponds to a direct sensing experiment with fixed wireless sensors installed on the structure. The same sensors and setup as in the first case study (i.e., three sensors located at the quarter points of the target span) are adopted.
Bulli Colliery Bridge inspection tests: (a) direct test with three triaxial BeanAir sensors on the bridge and (b) drive-by inspection.
Figure 13 shows an example of the acceleration time series of the direct sensing test. Figure 14 presents the corresponding first singular values from five different tests obtained from the FDD, considering the three accelerometers mounted on the bridge following the procedure described in ‘Direct sensing’ section. The first fundamental frequency of the bridge,
Example of an acceleration time series from one of the sensors during the direct sensing test.
First singular value from five different direct inspection tests. The red dashed line represents the first natural frequency of the structure.
Indirect sensing
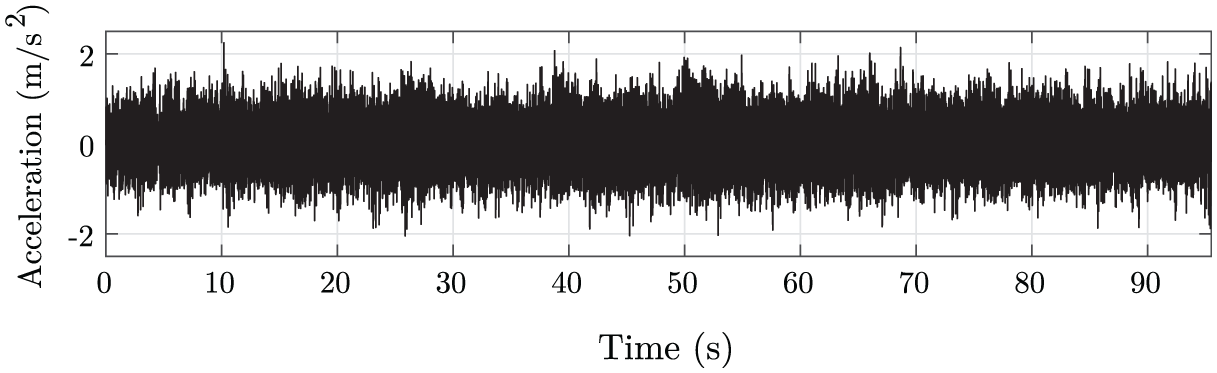
Second, an indirect sensing test using drive-by bridge inspection (see Figure 12(b)) is conducted. The same inspection vehicle setup as in case study I, driving at the same speed (i.e., 0.17 m/s), is used for this purpose, and 39 crossings of the vehicle were performed. As in the first case study, the bridge remained in service during both tests, with pedestrians able to walk across it. Figure 15 shows an example of the acceleration response recorded by one of the accelerometers mounted on the vehicle during the test, illustrating the length of the measured signal.
Acceleration time series from one of the accelerometers mounted on the inspection vehicle during the indirect test performed on the Bulli Colliery Bridge, illustrating the length and characteristics of the recorded signal.
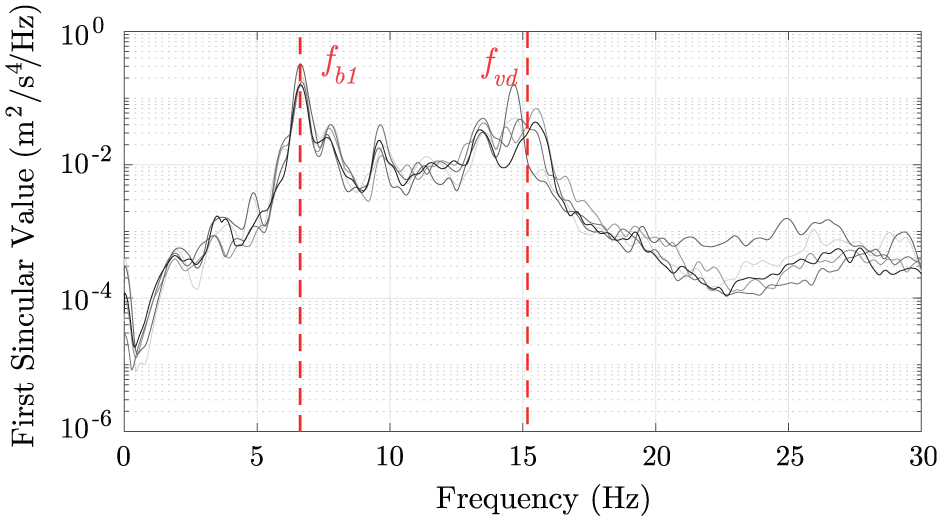
The first singular values obtained from the FDD process are presented in Figure 16 for five different test runs, following the methodology presented in ‘Inspection vehicle’s characteristics’ section. As shown in Figure 16, the results confirm the successful identification of both the bridge’s first natural frequency and the driving frequency associated with the electric motor by the inspection vehicle during the indirect sensing tests. Specifically, peaks are consistently observed at approximately 6.7 Hz. across all tests, corresponding to the bridge’s first vibration mode. Additionally, the frequencies associated with the operation of the electric motor,
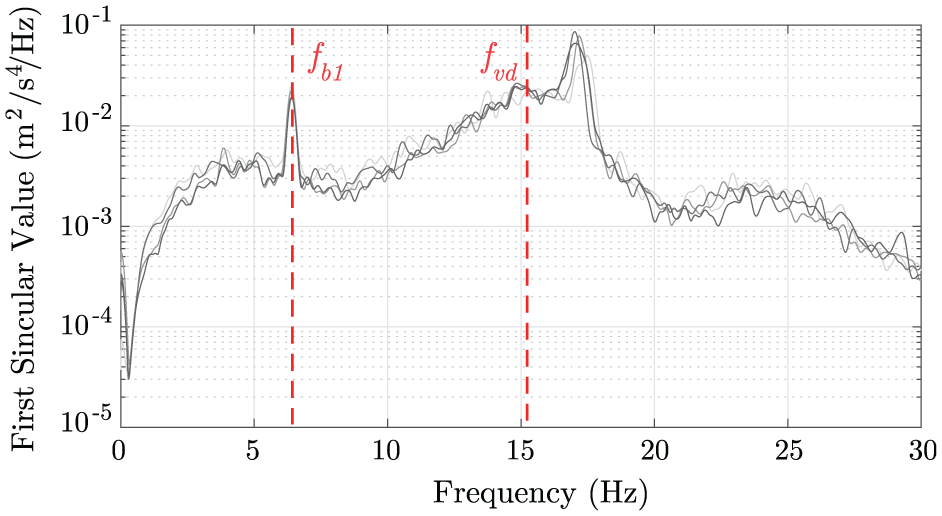
First singular values from five different indirect inspection tests on the Bulli Colliery Bridge. The red dashed lines represent the averaged first natural frequency of the structure
Table 3 presents the peak values of the first singular values obtained from both direct sensing tests (see Figure 14) and indirect sensing tests (see Figure 16). The low standard deviation of the obtained peaks confirms the stability and repeatability of the identified frequencies across the five independent tests. The close agreement between direct and indirect results supports the correct identification of the first natural frequency of the Bulli Colliery Bridge. Minor differences between the two sensing configurations are attributed to variations in the experimental setup and the distinct characteristics of the sensors used in each configuration.
Comparison of peak values from the first singular value obtained from direct and indirect sensing tests (case study II).
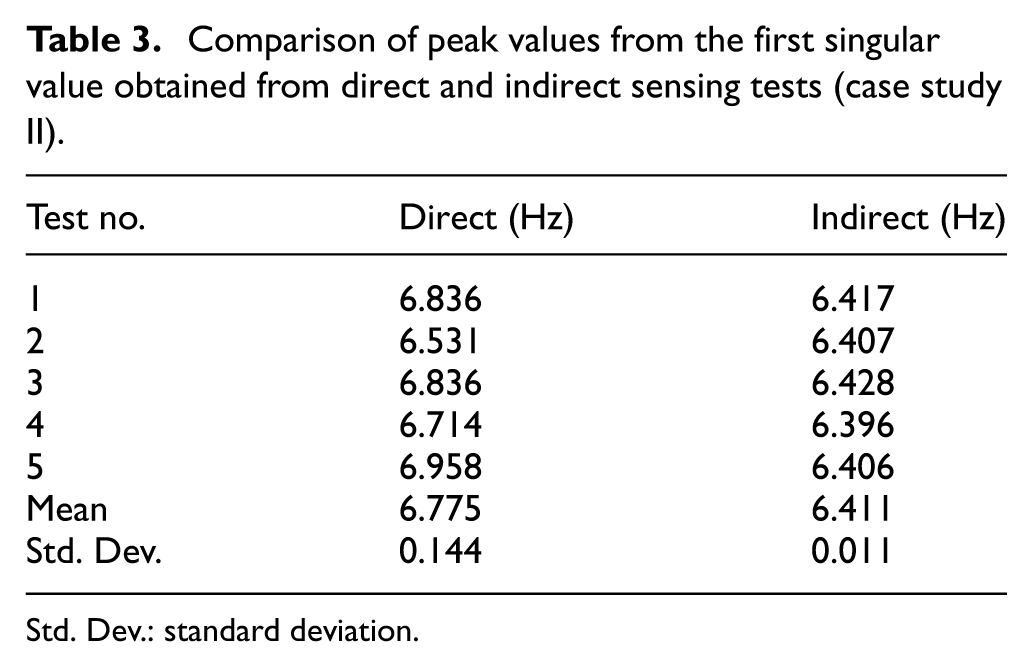
Std. Dev.: standard deviation.
Methodology
After successfully identifying the bridge’s fundamental frequency using vehicle-mounted accelerometers – and confirming consistency with direct sensing – this paper focuses on drive-by sensing to explore its potential for bridge health monitoring. To this aim, three state-of-the-art unsupervised damage assessment frameworks, previously established in the studies by Hurtado et al., 32 Alamdari, 33 Hamedani et al., 37 Zhong et al. 38 and Cheema and Sugiyama, 39 respectively, will be used and are presented next.
Indirect SHM using drive-by bridge inspection
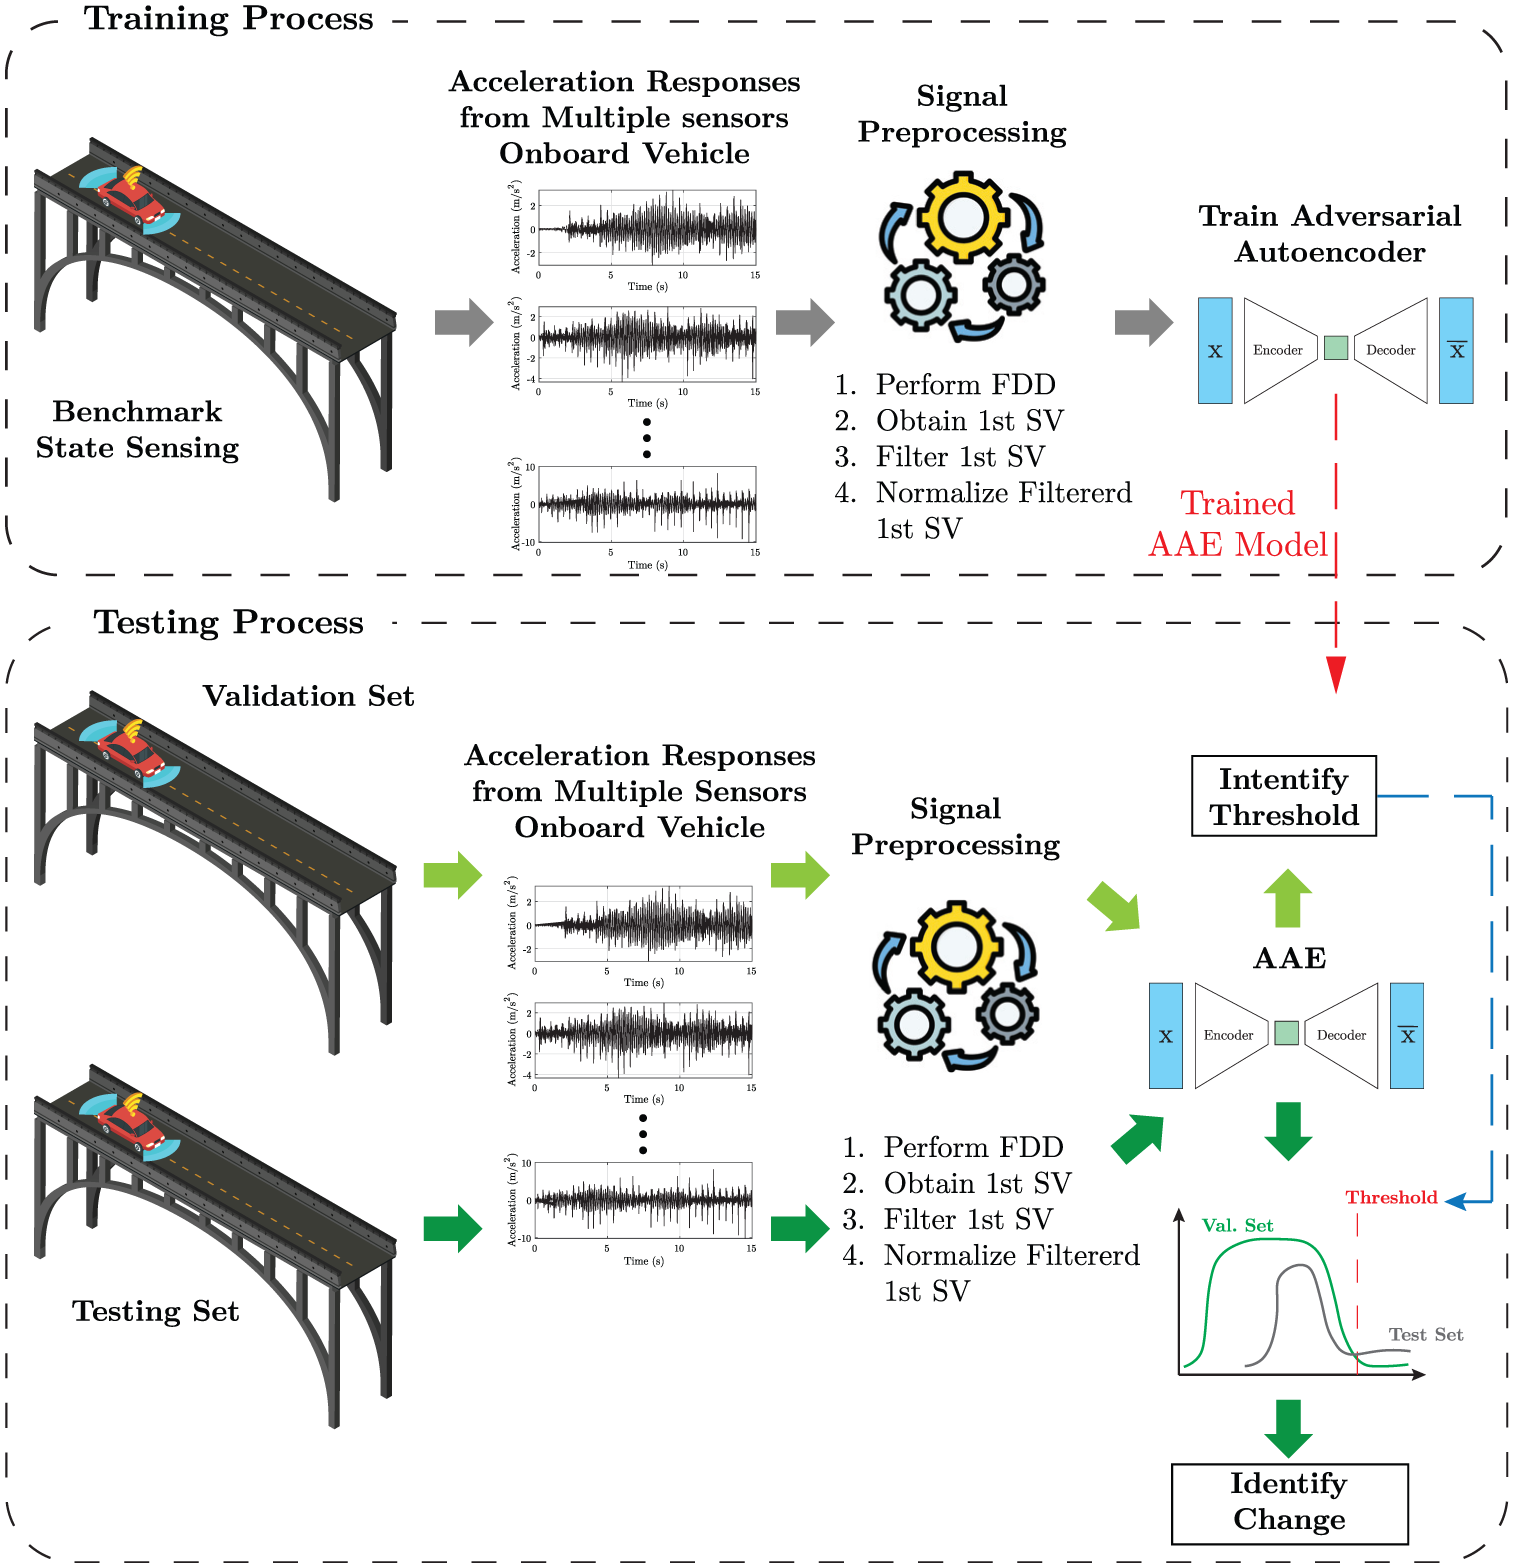
This section demonstrates the potential application of the drive-by bridge inspection setup to SHM. In this stage, the data recorded by the inspection vehicle from the target bridges are processed using state-of-the-art damage assessment techniques. The first methodology, presented in the study by Hurtado et al., 32 employs an adversarial autoencoder (AAE) to identify and evaluate damage. In that study, the authors compared the proposed approach with other state-of-the-art techniques, demonstrating its superior performance. Although the methodology was validated through a scaled experimental test, its applicability in more realistic scenarios has not yet been demonstrated.
The second methodology, presented in the study by Alamdari 33 and Hamedani et al., 37 involves a time-series-based analysis using an unsupervised semantic segmentation technique based on matrix profile (MP). Although promising results were obtained using the MP, previous work was limited to direct sensing and simplified laboratory experiments.
The third methodology integrates a Transformer-based framework (i.e., AMFormer) 38 combined with a novel time-series data augmentation approach (i.e., StiefelGen). 39 This approach enhances anomaly detection performance by leveraging deep spectral reconstruction through Transformer attention mechanisms, while Stiefel-manifold-based augmentation mitigates data scarcity by generating physically consistent synthetic samples. Together, these techniques enable robust and data-efficient analysis of vehicle–bridge interaction signals in real-world conditions.
The current study aims to further validate the frameworks proposed in the studies by Hurtado et al., 32 Alamdari, 33 Hamedani et al. 37 and Zhong et al. 38 using real data from these two bridges, specifically concerning the proposed sensing platform described earlier. In the first case study, the nominal condition of the bridge is intentionally varied by adding localised mass to simulate a variation on the bridge condition. However, in the second case study, such modification could not be performed due to the bridge’s high mass and operational constraints, which made it impractical to introduce a measurable dynamic change. As a result, the second case study focuses solely on characterising the nominal bridge state and evaluating the robustness of the methodology to false positives.
Adversarial autoencoders
The first damage assessment methodology employed in this work aims to establish the baseline condition of the bridge using an unsupervised machine learning approach based on an AAE.
32
To this end, the data collected by the inspection vehicle are first processed following the procedure presented in ‘Experimental case studies’ section. In addition, two pre-processing steps are applied to the first singular values
Then, sets of three

where
The framework based on AAE to prove the potential application of drive-by bridge inspection in SHM. 32 AAE: adversarial autoencoder; SHM: structural health monitoring.
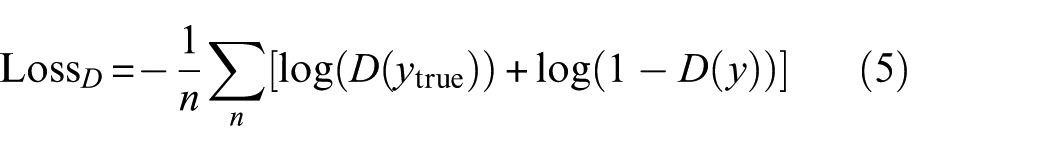
AAE extends traditional autoencoders by incorporating adversarial training to impose a desired prior distribution on the latent space, thereby improving the structure and continuity of the encoded representation. 42 An AAE consists of three components: an encoder, a decoder and a discriminator network. While the encoder–decoder function as in a standard autoencoder for data reconstruction, the discriminator encourages the latent codes to match a predefined prior distribution (e.g., Gaussian distribution). 43 Figure 18 shows a typical AAE structure.
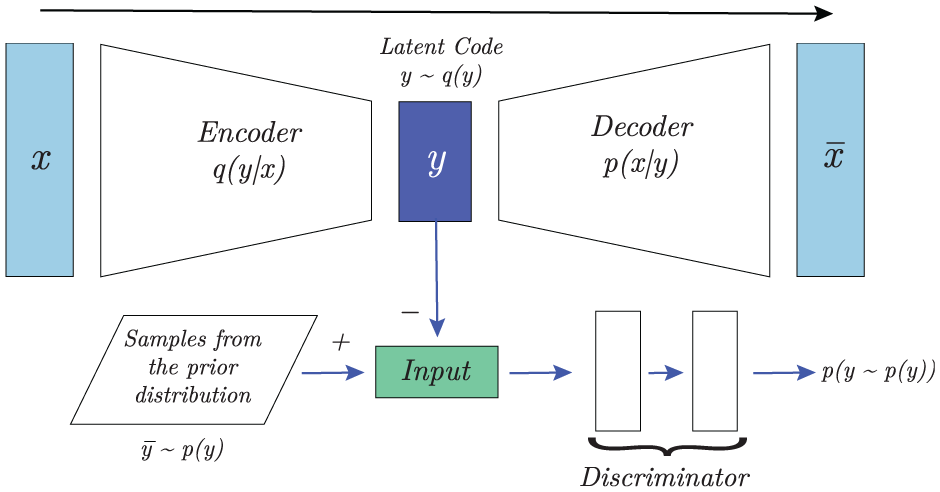
A typical AAE structure. 44 AAE: adversarial autoencoder.
Let the input data vector be denoted as

where
where

In this work,
Summary of AAE structure.
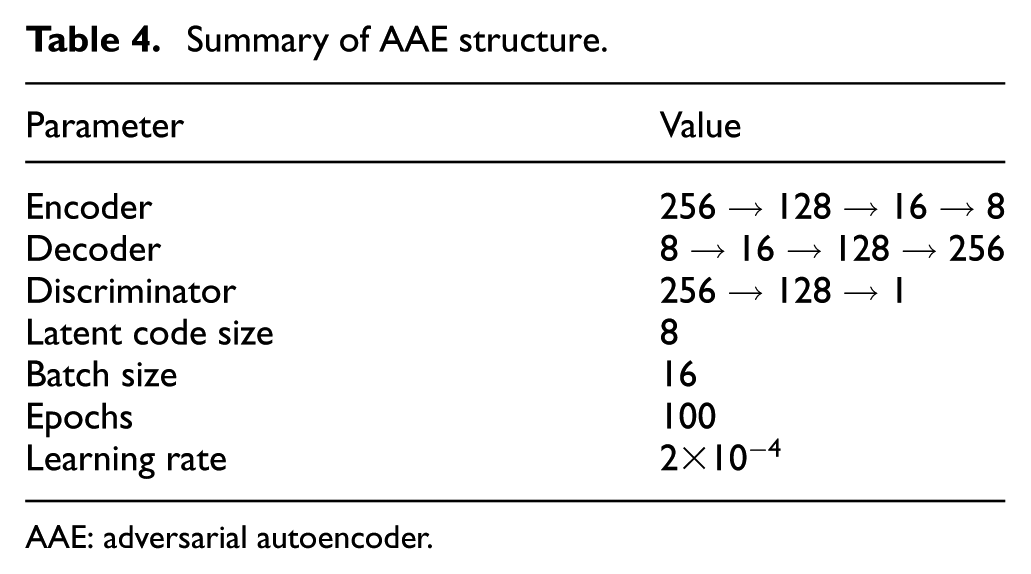
AAE: adversarial autoencoder.
Training and testing the model
As previously mentioned, the aim of implementing a damage assessment methodology in this work is to demonstrate the potential of drive-by bridge inspection for identifying structural damage. However, due to the challenges of modelling real damage in in-service structures, this study adopts two complementary approaches. In the first case study (i.e., the University of New South Wales (UNSW) Bridge), bridge condition variation is simulated by introducing added mass to the structure. In the other case study (i.e., Bulli bridge), the focus is on detecting false positives using only responses from the structure’s healthy, or nominal, condition. To this end, the preprocessed acceleration signals recorded by the instrumented inspection vehicle (i.e.,

Once the damage threshold is defined, the testing set is passed through the AAE network, and the corresponding reconstruction errors are computed. These errors are then compared against the predefined threshold to identify if damage is present.
To demonstrate the methodology’s potential for ISHM using drive-by inspection, it is crucial to evaluate both its ability to minimise false positives (i.e., healthy samples misclassified as damaged) and to identify true negatives consistently. A low false-positive rate suggests that the methodology reliably characterises the nominal state of the structure, which is a necessary foundation for any SHM system. However, robustness to false positives alone does not guarantee sensitivity to actual damage. Therefore, complementary validation, such as a separate test on the UNSW Bridge where damage is simulated by adding localised mass, is essential to assess the method’s capacity to detect real structural changes.
Matrix profile
The second approach is based on the framework presented in the studies by Alamdari 33 and Hamedani et al. 37 In drive-by inspection, the amount of available data is often limited due to constraints in testing opportunities or operational conditions. This presents a challenge for the AAE approach, which relies on large training datasets. One potential solution is the MP method, 45 which can detect change points in bridge states using limited observations. Therefore, this study investigates the use of this technique as a second approach.
Figure 19 provides a schematic overview of the MP-based framework. The MP method is typically used in combination with the corrected arc crossings (CAC) to detect potential change points in the bridge’s state. If the bridge remains in a consistent condition throughout the observation period, the algorithm is not expected to detect any change points. This method has been validated in the study by Alamdari 33 and Hamedani et al. 37 using numerical simulations and laboratory experiments, but it has not yet been tested on full-scale bridges.
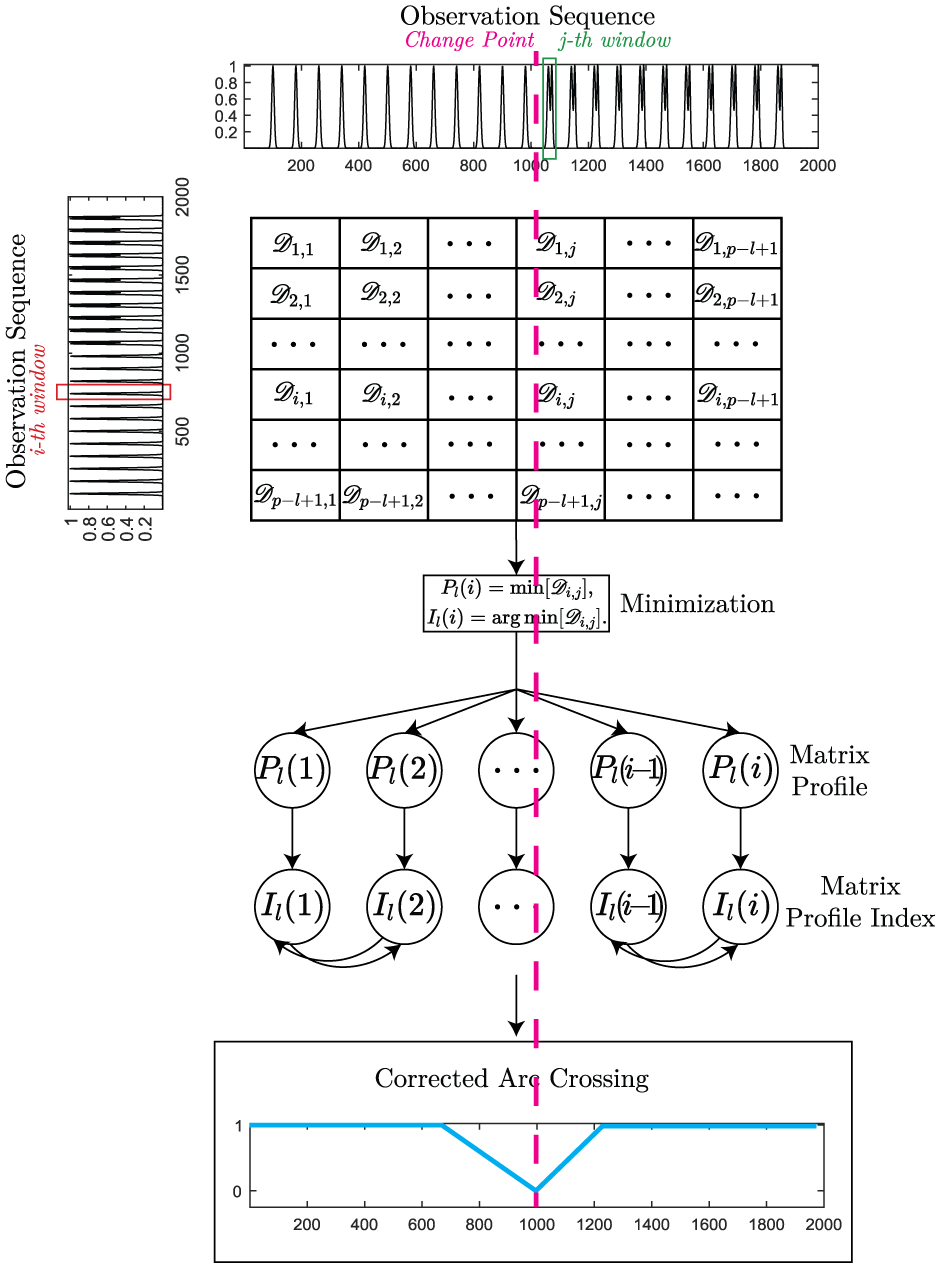
Overview of the MP method. MP: matrix profile.
Change point detection
In the change point detection framework, drive-by inspections are carried out periodically over a defined inspection period. During each inspection, vehicle responses are recorded as the vehicle passes over the bridge. The responses from multiple inspections are then combined to form a single observation sequence. The framework analyses this sequence to identify potential change points in the bridge state.
Let
Once the full set of subsequences is constructed, the all-pairs similarity search is performed to identify the first-nearest neighbour of each subsequence. During the search procedure, trivial matches, such as self-matching ones, are excluded. For each pair of subsequences

where

Here, the


Since the total number of subsequences is
Each entry in the MP index defines a pair (
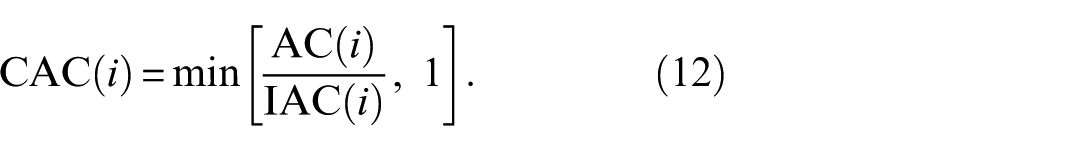
The IAC denotes the number of arcs obtained if all matches were uniformly sampled from the entire time series. This idealised curve forms an inverted parabola, peaking at
In the context of this work, the MP-based framework is applied to vehicle responses collected by the customised inspection vehicle. The recorded vehicle responses are processed using the methodology outlined in ‘Experimental case studies’ section to extract the first singular value from the CPSD. The extracted singular values are assembled sequentially to form the observation sequence
Transformer-based anomaly detection (AMFormer)
The transformer-based architecture used in this study follows the AMFormer framework proposed in the study by Zhong et al., 38 originally developed for time-series anomaly detection tasks. In its original formulation, AMFormer learns temporal dependencies directly from sequential data, modelling long-term relationships through self-attention. In this work, the model is adapted to operate on spectral sequences derived from VBI experiments, where each sequence corresponds to the first singular values obtained from the FDD of acceleration data recorded during a single vehicle passage.
Although the original temporal evolution is not explicitly present in the singular-value data, the ordering of frequency bins is treated as a pseudo-time axis, enabling the transformer to learn sequential dependencies among spectral features in an analogous manner to time-domain series. This adaptation enables the AMFormer to leverage its attention mechanism for identifying structural changes in the spectral representation of bridge vibrations over time. Figure 20 shows the structure of the AMFormer used in this work.
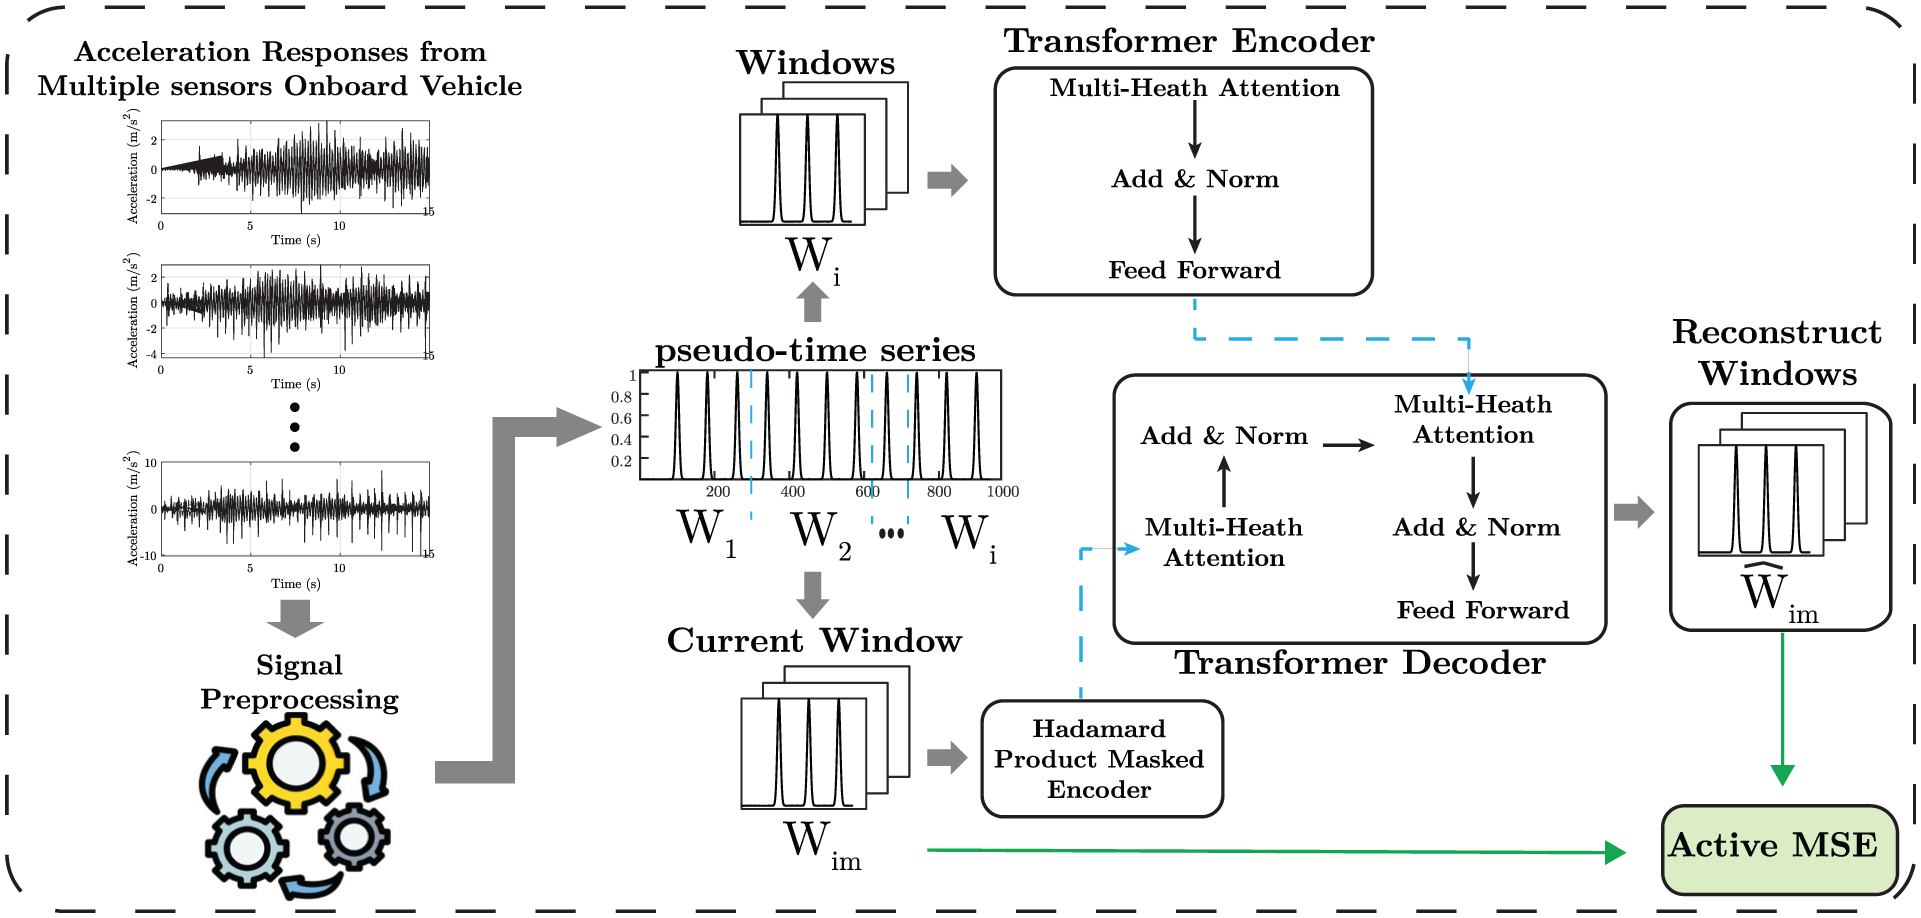
AMFormer structure.
Model architecture
Let the input sequence be defined as
For each windowed segment, the historical portion

where
In the decoding stage, an attention-guided masking mechanism is introduced to modulate the spectral content of the input before reconstruction. Guided by the encoded features

where

where ⊙ denotes the Hadamard (element-wise) product. Finally, the decoder network

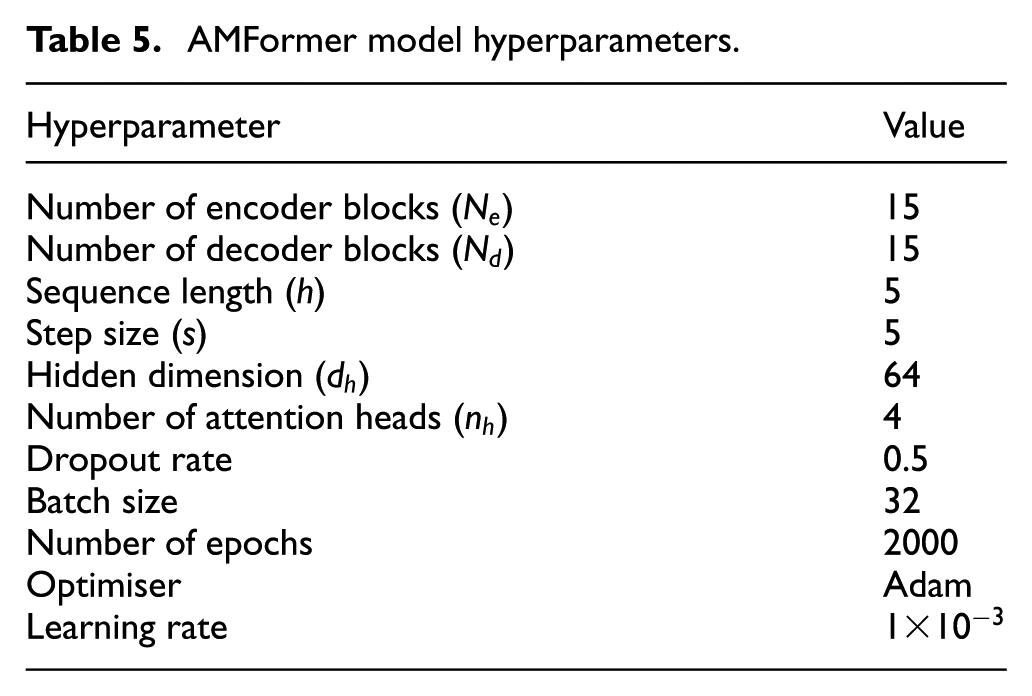
The hyperparameters used in the AMFormer implementation are summarised in Table 5. These values were selected after empirical tuning to ensure stable convergence and optimal reconstruction performance. The number of encoder and decoder blocks was set to 15 each, enabling deep feature abstraction and multi-scale attention over frequency-domain representations. A relatively small hidden dimension and two attention heads were adopted to balance expressiveness with computational efficiency. The model was trained for 2000 epochs using the Adam optimiser with a learning rate of
AMFormer model hyperparameters.
Active reconstruction objective for anomaly assessment
The network is trained using the Active-Mean Squared Error (MSE) loss introduced in the study by Zhong et al.,
38
which dynamically re-weights reconstruction errors to emphasise consistent patterns while reducing the influence of extreme outliers. For each training sample

where
where

with

This adaptive weighting improves training stability and robustness, particularly when the available data are limited or partially augmented. After training, the reconstruction error
After training, the model operates in inference mode to identify anomalous vehicle passages. For each test window

where
To ensure scale invariance across sequences, all reconstruction errors are normalised using the mean
An adaptive threshold

This procedure yields a binary anomaly decision for each input window. Higher normalised errors indicate structural deviations in the vehicle–bridge system’s frequency-domain response. Aggregating the anomaly scores across all test sequences enables quantitative assessment of anomaly evolution and localisation.
Data augmentation using StiefelGen
Despite the sequential formulation adopted in the transformer, the available dataset represents a limited number of vehicle passages per bridge condition. Such scarcity restricts the model’s ability to learn diverse spectral representations and may cause overfitting to a small subset of singular-value patterns. To address this limitation, the StiefelGen framework proposed in the study by Cheema and Sugiyama 39 was employed to synthetically expand the training data while preserving the geometric structure of the original feature space. Following the study by Peralta-Braz et al., 49 this approach enables the synthesis of physically consistent acceleration signals that retain the intrinsic structure of the original sensor measurements.
Let the measured acceleration dataset for sensor

where
Each signal is first embedded in a subspace representation

where
The StiefelGen framework models the local geometry of the data manifold by mapping samples to the tangent space at a reference point

where

which guarantees that
Both real and synthetic accelerations are subsequently processed through the FDD method to extract the first singular values of the CPSD matrices, which serve as the spectral inputs
Results
Case study I
Bridge condition assessment using AAE
Following the procedure described in ‘Adversarial autoencoders’ section, this section demonstrates the potential application of the AAE-based methodology for drive-by bridge inspection. First, 49 vehicle crossings over the bridge were analysed. From these crossings, the first singular values of the CPSD from the four acceleration responses of
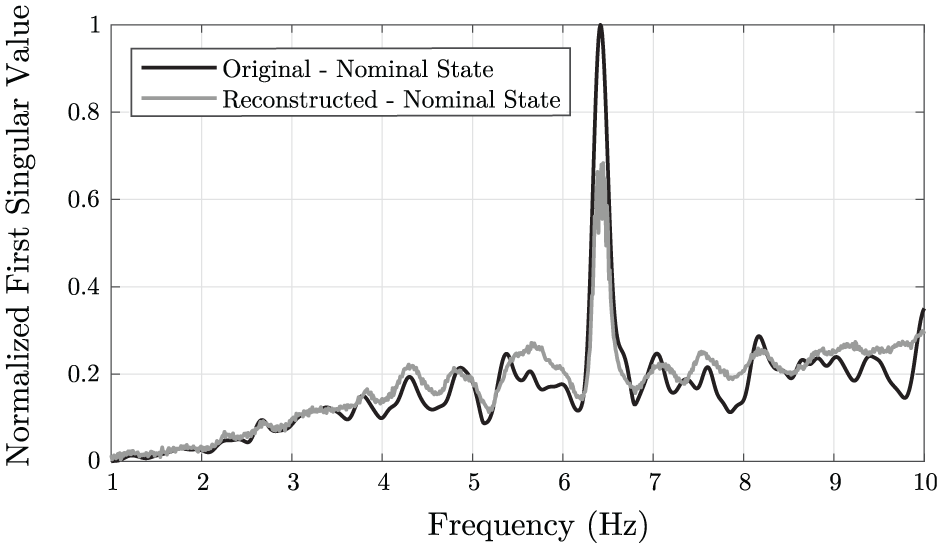
Reconstruction of a
To test the bridge condition assessment approach, damage was simulated by adding mass to the bridge (i.e., five people standing at mid-span), as shown in Figure 22. The total additional mass was approximately 375
Drive-by bridge inspection with simulated damage.
First natural frequencies under added-mass condition (indirect sensing tests).
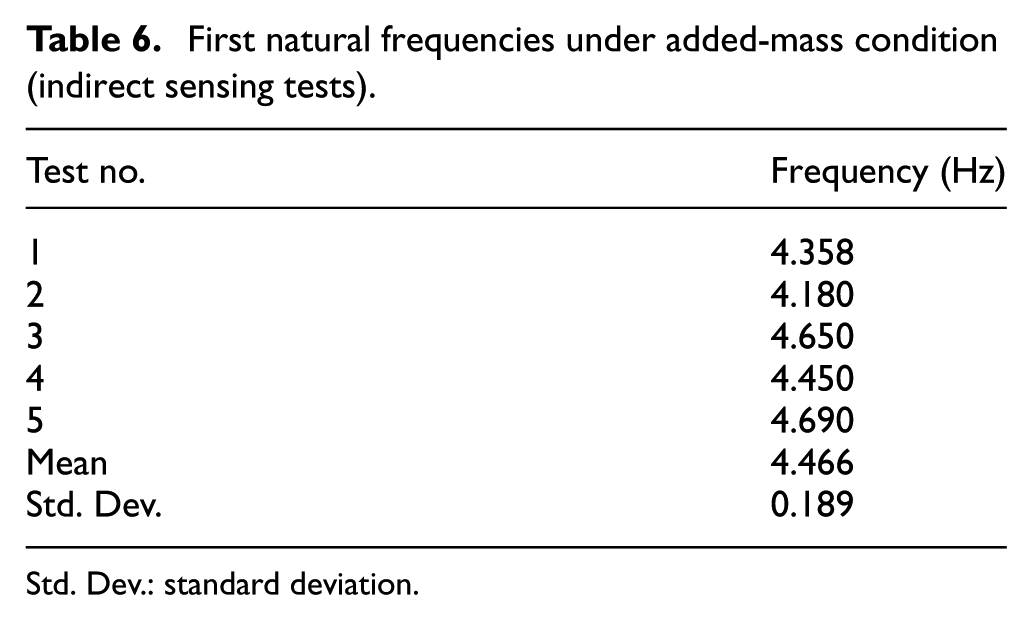
Std. Dev.: standard deviation.
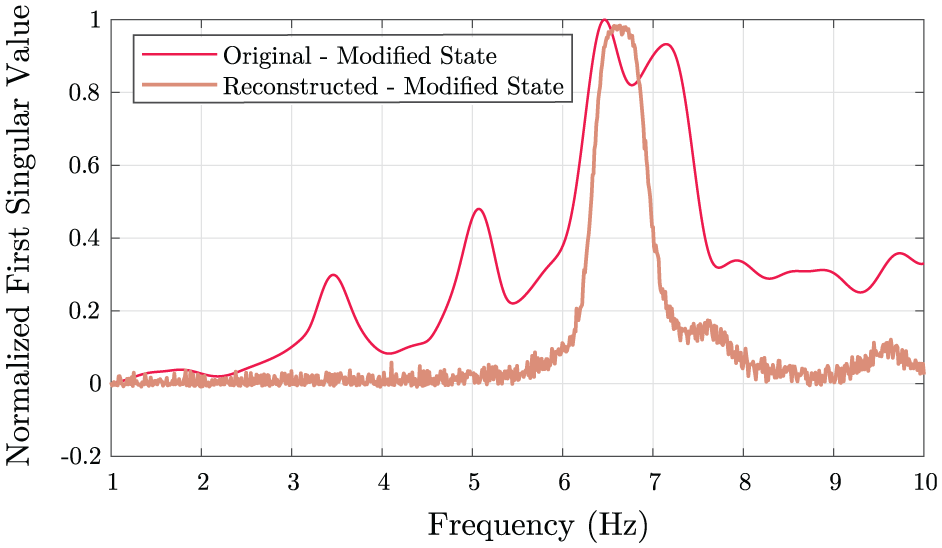
The vehicle crossed the modified bridge state 10 times, and the corresponding acceleration responses were pre-processed following the methodology described in ‘Adversarial Autoencoders’ section. These pre-processed signals were then fed into the trained AAE, and the resulting reconstruction error was used to demonstrate the framework’s ability to detect structural variations. Figure 23 shows an example of the reconstruction of the frequency spectrum from the modified state of the bridge, from which it is clear that the AAE fails to reconstruct the sample from the varied bridge state. Figure 24 is the result of this study.
Reconstruction of a
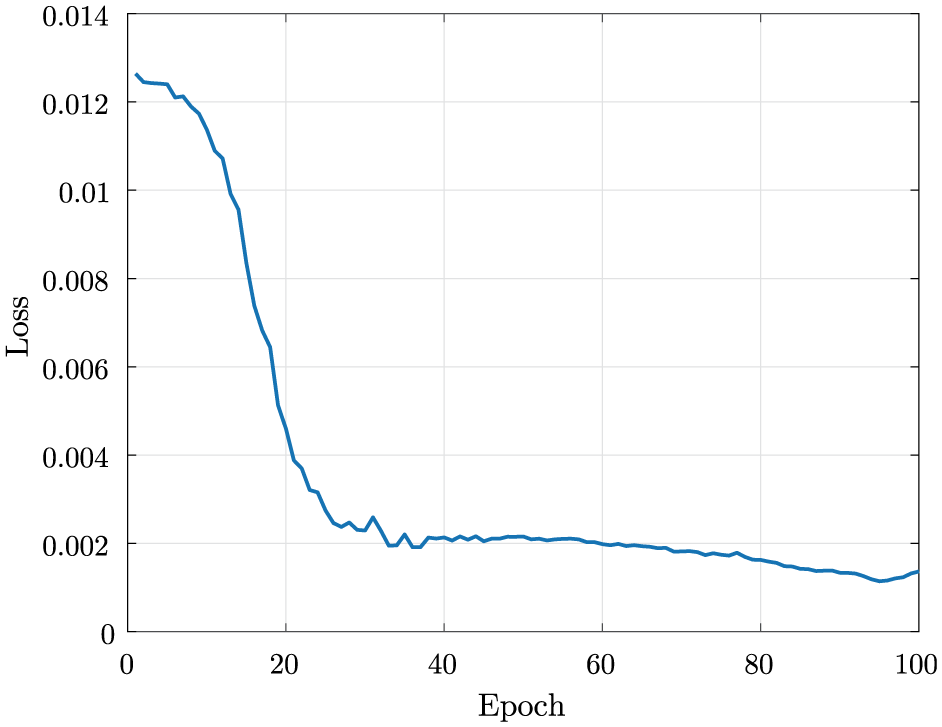
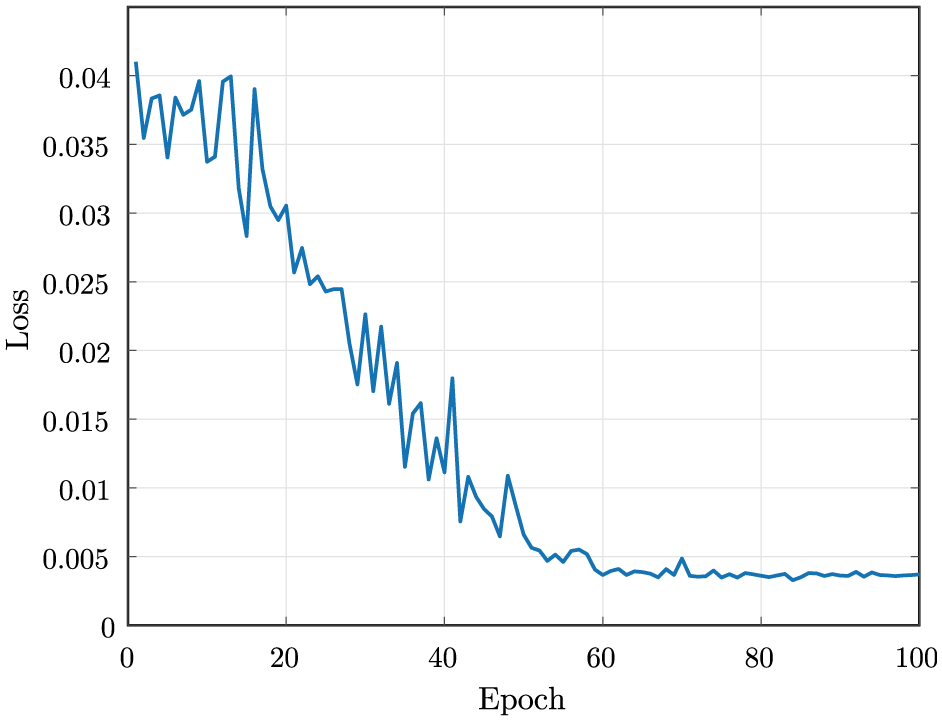
Training loss of the AAE model trained on case study I. AAE: adversarial autoencoder.
Figure 25 presents the reconstruction error obtained during the testing phase using the AAE-based methodology. It is evident that the reconstruction error for the simulated damage samples (i.e., modified bridge state with added mass) is significantly higher than that for the nominal state of the structure, indicating a variation in the bridge condition. Notably, all samples from the nominal bridge state were correctly classified as healthy, resulting in no false positives. Likewise, all samples from the modified bridge state were correctly identified as damaged, yielding no false negatives. These results demonstrate a perfect separation between true negatives and true positives, highlighting the potential of the proposed methodology for accurately assessing bridge condition through drive-by inspections.
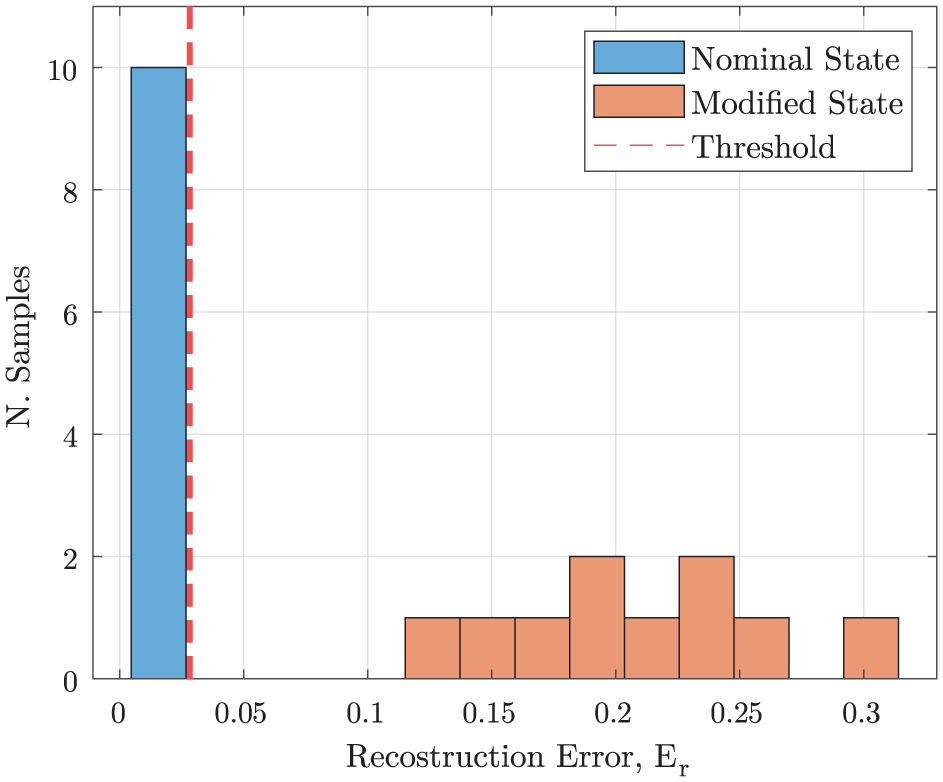
Reconstruction errors from healthy and simulated damage samples.
Finally, it is worth noting that, as reported in the study by Hurtado et al., 32 the AAE-based methodology is only capable of identifying damage and assessing its severity, based on the direct relationship between the reconstruction error and the extent of the damage. Identifying the type, source and location of the damage is beyond the scope of the presented methodology.
Bridge condition assessment using MP
This section examines the performance of the proposed MP method using experimental data obtained from the pedestrian bridge located at UNSW. As outlined in ‘Case study I: pedestrian Bridge at UNSW’ section, 49 vehicle passages were conducted, and the first singular value of the CPSD matrix was extracted for each run.
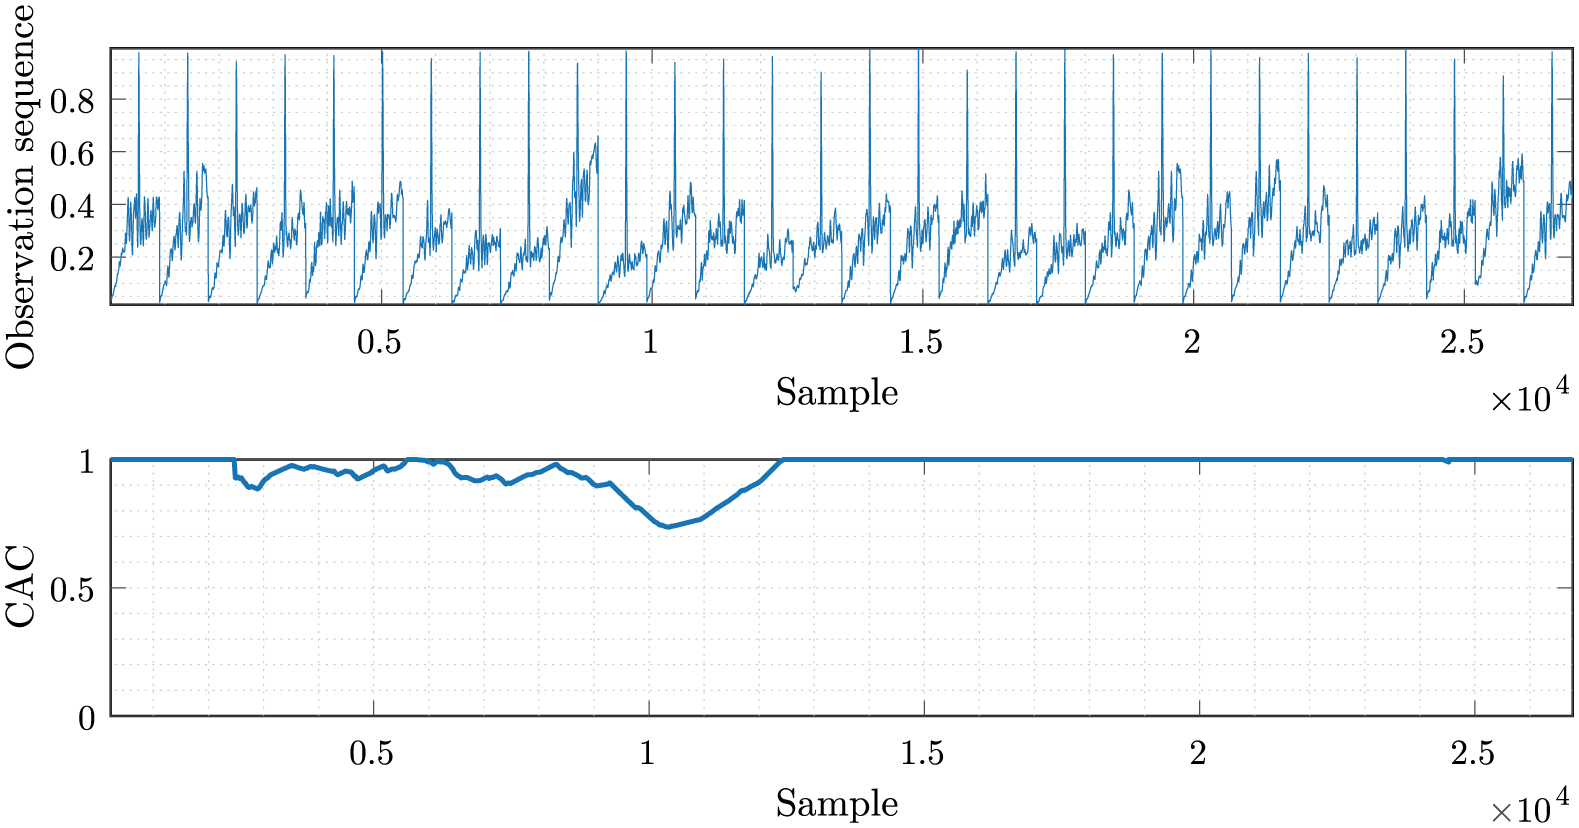
First, a case is studied in which every sample in the observation sequence corresponds to the benchmark state. This investigation aims to evaluate the robustness of MP to false positives. A new singular value sample is generated by averaging five randomly selected samples out of 49. This new sample consists of 900 points or spectral lines, covering the frequency range from 1 to 10
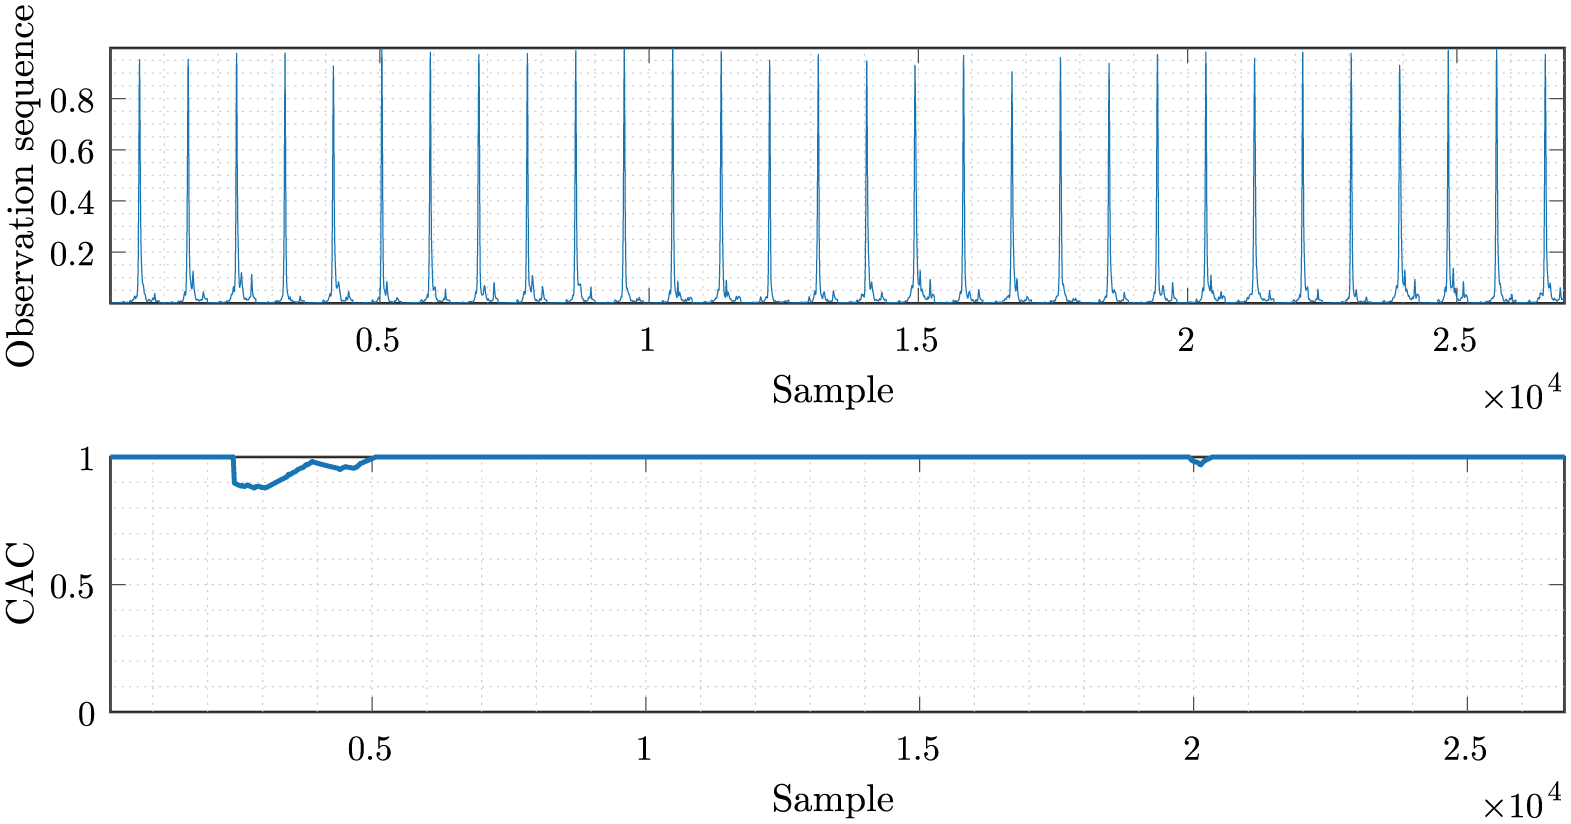
Observation sequence and corresponding CAC profile for the nominal state of UNSW Bridge. CAC: corrected arc crossings.
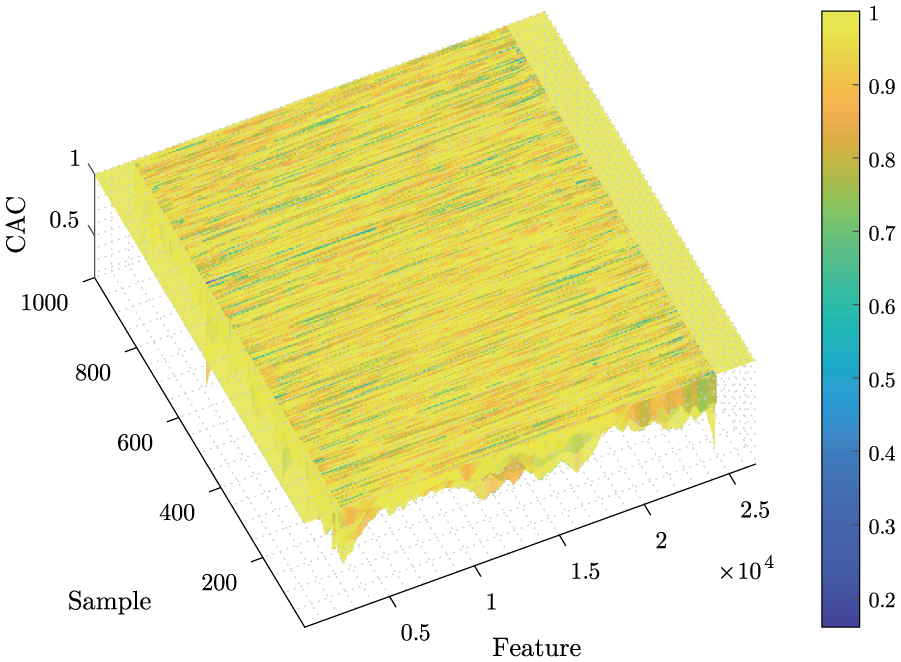
An extended assessment is conducted by repeatedly applying the random averaging and assembly procedure. In this way, 1000 observation sequences are obtained under the benchmark state for analysis. The CAC is computed for each sequence, and the results are shown as a three-dimensional surface in Figure 27. As illustrated, the surface remains close to the CAC value of one throughout all observation sequences, with only minor variations. This result confirms that the method produces stable outputs for the benchmark bridge condition.
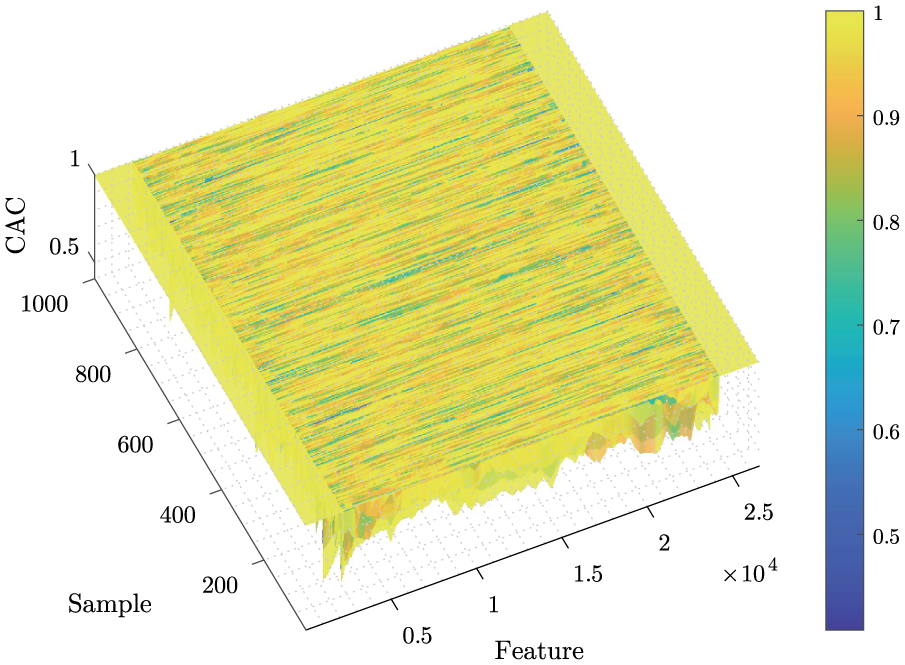
CAC profiles computed from 1000 randomly generated observation sequences using data from the UNSW Bridge. CAC: corrected arc crossings.
A second case is studied, in which the effectiveness of change point detection in identifying bridge state transitions is evaluated using an observation sequence that encompasses both benchmark and altered conditions. As described in ‘Methodology’ section, additional mass is added to the bridge to simulate a change in structural condition. An observation sequence, consisting of 20 samples from the benchmark condition and 10 from the damaged state, is established. This observation sequence is shown in the first row of Figure 28, with the corresponding CAC profile presented in the second row. A dashed line indicates the transition point between the two conditions. The CAC profile shows a clear minimum at the transition point, indicating that the method effectively detects the induced change.
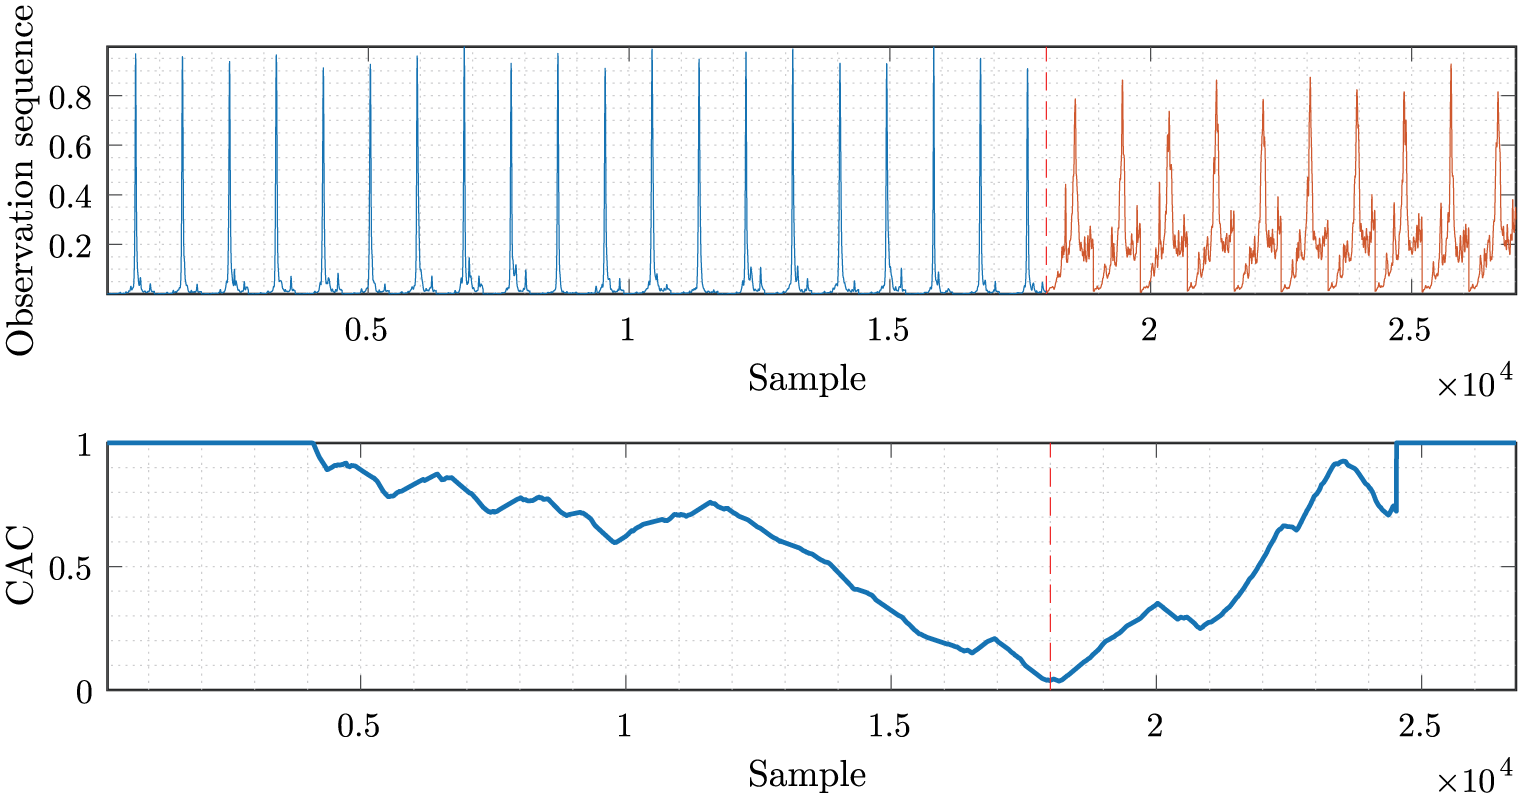
Observation sequence and corresponding CAC profile for the UNSW Bridge under benchmark and changed conditions. CAC: corrected arc crossings.
The consistency of the method in detecting change points is evaluated using 1000 observation sequences generated from both benchmark and damaged conditions. The corresponding CAC values from all sequences are formed into the surface illustrated in Figure 29. This surface displays a clear line-shaped minimum aligned with the transition point across all sequences, indicating the location of change. This result demonstrates the reliability of the MP method in detecting bridge state changes across multiple inspections.
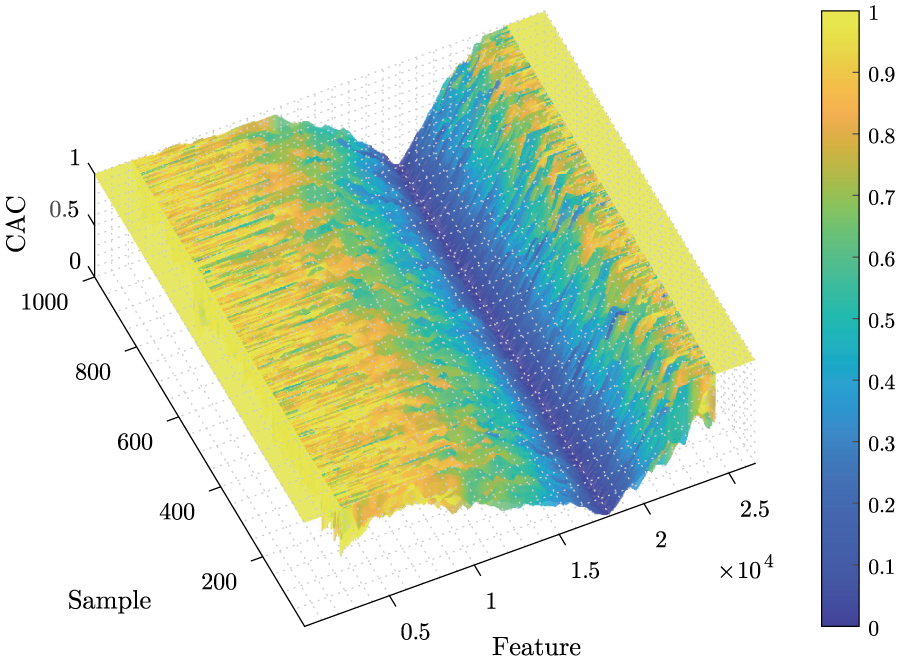
CAC profiles from 1000 observation sequences, including both benchmark and damaged conditions for the UNSW Bridge. CAC: corrected arc crossings.
Bridge condition assessment using AMFormer
This section presents the results obtained for case study I, based on the methodology introduced in ‘Transformer-based anomaly detection (AMFormer)’ section. The analysis aims to evaluate the performance of the proposed AMFormer-based anomaly detection framework in identifying bridge anomalies from VBI data. The complete pipeline combines transformer-based spectral reconstruction with Stiefel-manifold-driven data augmentation, enabling the network to generalise from limited experimental observations. By embedding the acceleration signals on the Stiefel manifold and generating physically consistent synthetic samples, the effective number of available passages for training is doubled, thereby improving the model’s representational diversity and mitigating overfitting due to data scarcity.
As mentioned previously, for this case, the experimental dataset comprised 39 healthy and 10 damaged vehicle passages. The augmentation procedure described in ‘Data augmentation using StiefelGen’ section was applied separately to both subsets, producing a twofold increase in the total number of training samples. This enriched dataset provided a more balanced and statistically representative input distribution for AMFormer training, enhancing its ability to learn discriminative spectral patterns associated with the bridge’s structural condition. Each sequence used for training and evaluation was composed of singular values filtered within the frequency range of
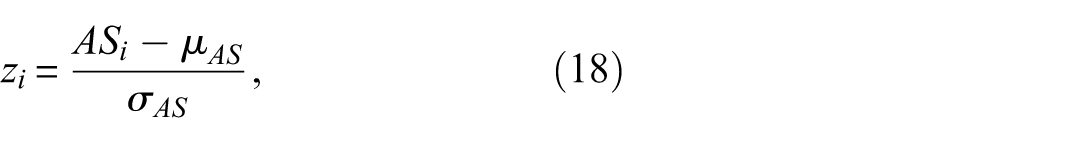
An illustrative example of the augmentation process is presented in Figure 30, which compares the normalised first singular values of an original and an augmented sample obtained from one of the vehicle-mounted sensors under the benchmark (healthy) state of the bridge. The two spectral signatures show a close spectral agreement, indicating that the StiefelGen procedure successfully preserves the dominant modal content of the original data while introducing minor stochastic variations. This confirms that the augmentation process generates physically consistent and diverse samples, thereby enhancing the model’s capacity to generalise from a limited number of real passages.
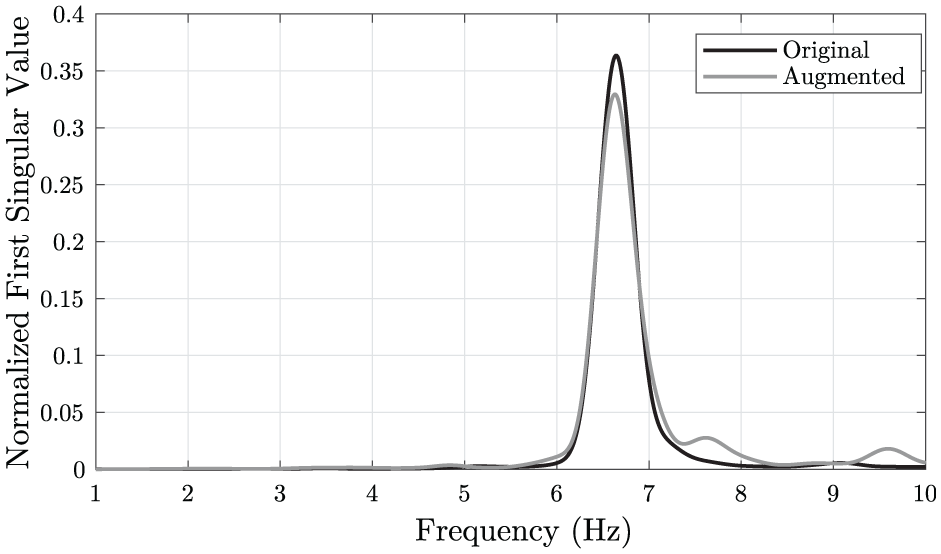
Comparison between the normalised first singular values of an original and an augmented sample from one sensor under the benchmark state of the bridge.
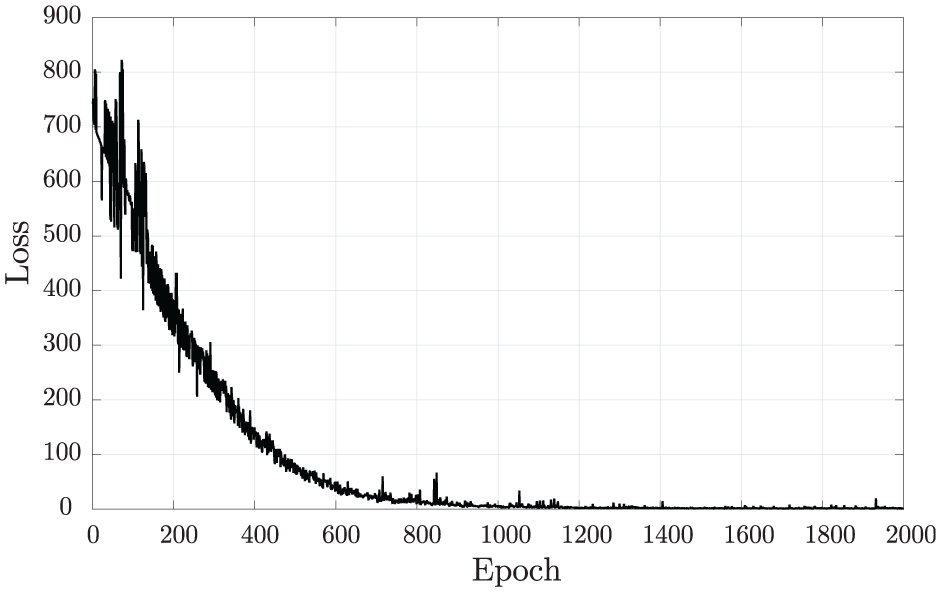
The training and validation loss curves shown in Figure 31 illustrate the convergence behaviour of the AMFormer model under the Active-MSE objective function. A smooth and monotonic decrease in the loss function is observed across epochs, indicating stable optimisation and effective learning of spectral dependencies.
AMFormer loss curve during the training process.
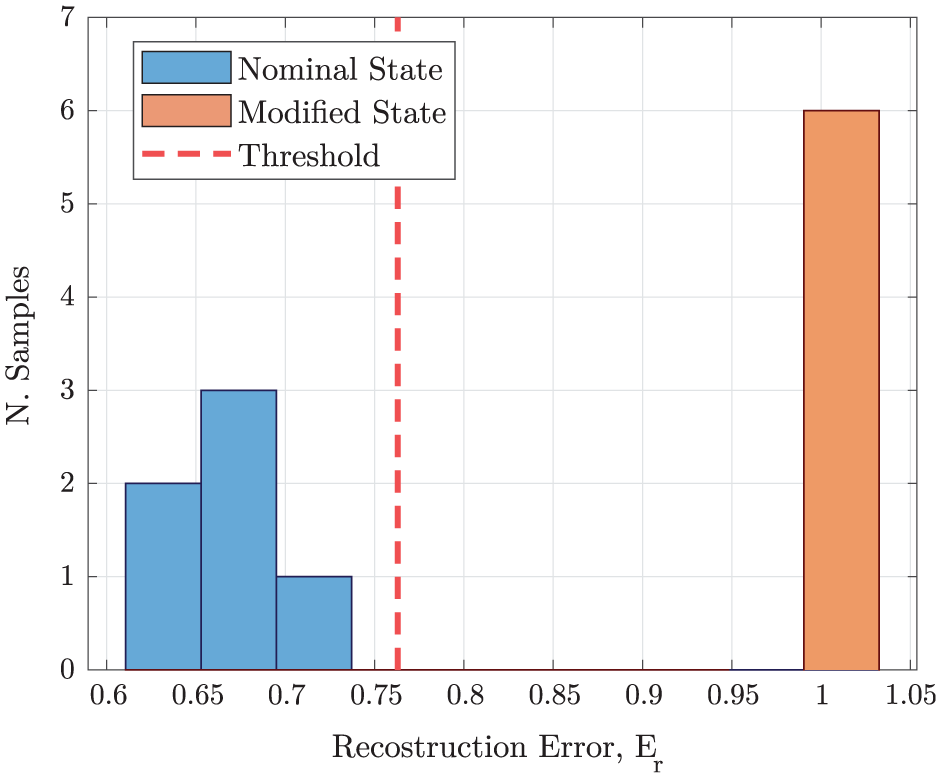
To evaluate the model’s capacity to discriminate between healthy and damaged bridge conditions, the normalised reconstruction errors were computed and are presented in Figure 32. The histogram reveals two clearly separated distributions: healthy passages exhibit small reconstruction errors concentrated near zero, while damaged passages display substantially higher error magnitudes. The MoM-based threshold successfully distinguishes between the two populations, validating the robustness of the anomaly detection criterion.
Normalised reconstruction errors from AMFormer testing.
Overall, these findings confirm that the proposed methodology can effectively assess the bridge condition even when only a limited amount of data is available. The combination of geometry-based data augmentation and transformer-based spectral learning allows the model to detect small changes in the vehicle–bridge interaction response, showing strong potential for practical and data-efficient structural health monitoring.
It is noted that the added-mass configuration used in ‘Case study I’ section represents a controlled and repeatable way to simulate a permanent change in structural characteristics. By contrast, transient live-load effects, such as the temporary presence of pedestrians or vehicles, would not consistently appear in repeated drive-by inspections and therefore would not be misclassified as damage.
Case study II
Bridge condition assessment using AAE
Following the procedure described in ‘Adversarial autoencoders’ section, this section presents the application of the AAE-based methodology to the second case study. As previously mentioned, multiple vehicle crossings were conducted. From these measurements, the first singular values of the CPSD derived from the four acceleration responses,
Training loss of the AAE model trained on case study II. AAE: adversarial autoencoder.
Reconstruction of a
Once the AAE is trained and the damage threshold (see ‘Adversarial autoencoders’ section) is defined using the training set (i.e., 0.069), the test set is passed through the network. Given the high mass of the structure and its operational condition, it was challenging to add sufficient mass to alter its local dynamic behaviour. Therefore, this case study focuses solely on identifying the nominal bridge state, without considering modified or damaged states. Figure 35 shows the reconstruction errors corresponding to the nominal test set.
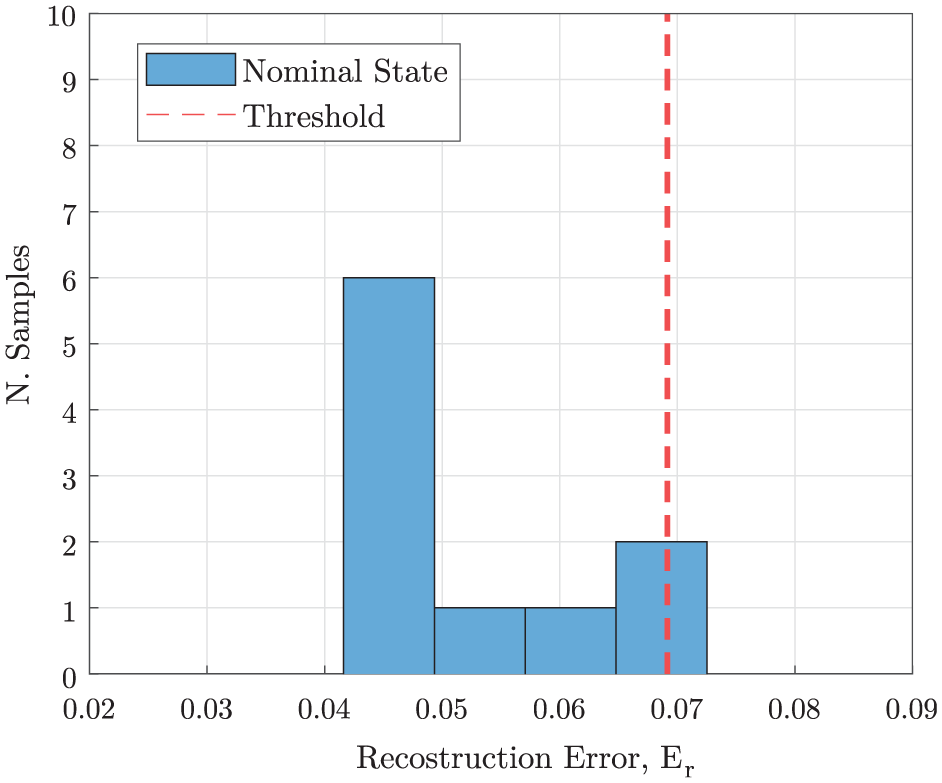
Reconstruction errors from the validation and test sets.
As illustrated in Figure 35, one out of ten samples in the test set of the nominal bridge condition exceeded the defined damage threshold. This result suggests that the AAE may not have fully learned the representative features of the bridge’s benchmark state. The limited number of available samples introduces uncertainty in the prediction and highlights the importance of using a larger dataset during the training phase. Although the method identified a false positive primarily due to the small number of samples used for training, the methodology still demonstrates potential for application in bridge anomaly detection by accurately reconstructing the healthy samples from the bridge.
Bridge condition assessment using MP
This section investigates the performance of the change point detection method presented in ‘Matrix profile’ section. The singular values obtained from the indirect approach presented in ‘Case study II: Bulli Colliery Bridge’ section are used to construct the observation sequences. To reduce the influence of noise, five singular value samples are randomly selected from a total of 39 samples and averaged to generate a new spectral sample. Each spectral sample contains 900 singular value points within the frequency range of 1–10 Hz. and is normalised between 0 and 1.
In this case study, the observation sub-sequence is constructed by assembling 30 samples, each generated by the averaging process mentioned previously. The complete subsequence, shown in the first row of Figure 36, represents a scenario in which all 30 inspections are conducted under benchmark conditions.
Observation sequence and corresponding CAC profile for the nominal condition of the Bulli Colliery Bridge.
The observation sequence has a length of 27,000 points (30 samples × 900 points). The MP method described in ‘Matrix profile’ section is then applied to calculate the CAC. The resulting CAC is shown in the second row of Figure 36. Although minor deviations from the constant value of one are observed in the CAC curve, no significant decrease is present. Since the observation sequence does not contain any change in bridge condition, the CAC is expected to remain close to one. The result confirms this expectation, suggesting that the bridge condition remains consistent throughout the observation period.
To further evaluate the robustness of the proposed method, 1000 independent observation sequences are generated, and the corresponding CACs are computed. As shown in Figure 37, the CAC profiles form a surface with a value of one. Since the bridge condition remains unchanged in all observation sequences, no change points are expected, and the CAC reflects this by maintaining a maximum value across the surface.
CAC profiles computed from 1000 randomly generated observation sequences using data from the Bulli Colliery Bridge. CAC: corrected arc crossings.
Small deviations of the CAC from unity were observed, which can be attributed to measurement noise and variability in excitation. This behaviour is consistent with previous findings in the literature.33,37
It is important to note that both direct and indirect bridge monitoring approaches face challenges associated with operational and environmental variability. In particular, live-load variations (e.g., vehicular traffic or pedestrian movement) can influence the measured responses and, consequently, the reconstruction error in data-driven methods such as the AAE. To mitigate these effects, the present experiments were conducted under controlled conditions, including partial lane closures and a constant vehicle speed, to ensure repeatability and minimise the influence of uncontrolled excitations. The proposed methodology is therefore most suitable for short- and medium-span bridges where controlled testing can be achieved. Future research will focus on incorporating larger datasets under varied traffic and environmental conditions to enhance the robustness of the approach for broader operational scenarios.
Conclusions
An electric, custom-built inspection car for drive-by bridge inspection was developed and instrumented with onboard accelerometers, and its performance was evaluated on two full-scale bridges in NSW, Australia (the UNSW Bridge and the Bulli Colliery Bridge). The first natural frequencies of both bridges were estimated using direct and indirect approaches; in each case, FDD was employed to extract the fundamental mode. Average values of 6.65 Hz (case study I) and 6.42 Hz (case study II) were obtained, confirming that fundamental modal frequencies could be accurately identified via drive-by techniques.
An AAE was applied to assess structural variation. In case study I, the nominal condition was intentionally altered by introducing localised added mass so that damage could be simulated and the method’s classification capability evaluated; in case study II, damage simulation was not undertaken because the structure’s high mass and operational constraints made measurable dynamic changes impractical, and characterisation of the nominal state with minimised false positives was prioritised. Structural variation was successfully identified in case study I, and the nominal state was accurately characterised in case study II. Additionally, the MP was applied to both case studies to detect change points; when bridges remained in benchmark states, corrected ACs stayed near unity with no significant minima, indicating an absence of false detections.
Beyond these approaches, an additional analysis was conducted using the AMFormer framework and the StiefelGen augmentation model. This recently developed transformer-based methodology was introduced to enhance anomaly detection performance under data-scarce conditions by learning spectral dependencies from vehicle–bridge interaction responses. The Stiefel-manifold augmentation procedure effectively expanded the available dataset, ensuring physical consistency and improving generalisation. Together, these methods provided a more robust and data-efficient strategy for identifying subtle variations in bridge dynamics.
Overall, the feasibility of drive-by inspection using a configurable inspection vehicle was demonstrated, providing a foundation for indirect bridge health monitoring. Practical limitations for full-scale implementation were noted: (i) applicability was largely confined to short- and medium-span bridges where speed, traffic and test conditions could be controlled (with possible partial lane closures); (ii) optimal performance required low, constant vehicle speed; (iii) environmental and operational variations were not investigated and (iv) the number of recordings was limited and performance under varying vehicle properties required further study. Future work was planned to extend testing to larger bridges and unrestricted traffic environments, to examine long-term patterns and environmental/operational effects, and to validate the methodology across a broader set of bridge types. The modular nature of the inspection vehicle was intended to enable exploration and optimisation of the design space for enhanced sensing performance. Additionally, the generalisability of the system is supported by the ability to adapt the sensing configuration to most short- and medium-span road bridges, where only minor adjustments to sensor layout, acquisition settings, or – depending on bridge characteristics – modifications to the vehicle’s dynamic properties may be required. Because low-speed operation is typically necessary for high-quality indirect measurements, practical deployment would likely rely on controlled testing conditions, such as off-peak operation or temporary partial lane closures, to minimise traffic disruption and enable routine use in road networks.
Footnotes
Acknowledgements
The authors express their gratitude to the Australian Research Council (ARC) for its support through the Discovery Early Career Researcher Award initiative, grant number DE210101625. This research also received funding from the ARC Industrial Transformation Research Programme (IH210100048). The authors additionally thank the Transport New South Wales teams for their assistance and support during the experimental testing.
Declaration of conflicting interests
The authors declared no potential conflicts of interest with respect to the research, authorship, and/or publication of this article.
Funding
The authors received no financial support for the research, authorship and/or publication of this article.
Data availability Statement
The data and codes supporting this study are available from the authors upon request. The datasets are not publicly available due to institutional and project-related restrictions, but can be shared subject to the necessary approvals.