
Abstract
Helical gears are common in rotating machines, offering smoother operation and better durability compared to spur gears due to their continuous engagement and higher contact ratios. However, these advantages present significant challenges in fault detection, particularly in the early stages. Although advanced methods exist for fault detection, most are designed for spur gears, overlooking the complexities associated with helical gear dynamics. This research sheds new light on the complex physical phenomena associated with localized tooth faults in helical gears while proposing a sensitive fault detection strategy grounded in physical justification and extensive experimentation. The first study presents a new modeling approach for localized tooth breakage faults in helical gears, building on an existing validated dynamic model. This approach, validated experimentally, utilizes the multi-slice method to address the three-dimensional, time-variable contact line. For the first time, we refute the premise that fault severity in helical gears is necessarily correlated with the size of the damaged region. Instead, we provide a physically justified fault characterization through analysis of the gear mesh stiffness (GMS) and vibration signals. The second case study proposes a novel health indicator (HI) designed specifically for detecting localized tooth breakage faults in helical gears, relying on sensitive spectral analysis and energy-based feature extraction. This new HI is tested on vibration data measured through extensive controlled-degradation tests on helical gears, both in healthy conditions and with various severities of tooth breakage faults. The performance of the proposed HI is compared against traditional methods, showing significant superiority both in early and in more advanced stages of the fault. Our findings demonstrate the superiority of the new HI over traditional methods and provide crucial insights into the complex dynamic behavior of helical gears, offering practical value for improving reliability and safety in various engineering applications, such as in automotive, aerospace, and industrial machinery, and also paving the way for advanced fault severity estimation.
Keywords
Introduction
Helical gears offer a promising alternative to the traditional spur gears, as they enable smooth and efficient operation in harsh regimes. These attributes are enabled due to their unique design, particularly the tooth helix angle, which makes the gears engage more gradually and continuously, allowing for higher contact ratios. Faults in helical gears, such as tooth breakage, pitting, cracks, wear, and more, can lead to catastrophic accidents and should therefore be detected promptly. The vibration signature of helical gears has been investigated over the years through experimentation and dynamic modeling.1,2 Nevertheless, early detection of faults in helical gears remains an intricate endeavor.3,4
While many studies have been dedicated to developing dynamic models for gears,2,5–8 most of them have focused on spur gears. Unlike the planar pressure line in spur gears, the contact line in helical gears is three-dimensional, making the calculation of time-variant gear mesh stiffness (GMS) more complex. This issue has been addressed in the literature, either by finite element modeling,9–12 or by the multi-slice approach in analytical lumped-parameter models.13–16 However, the majority of published studies have not validated their model experimentally and require a high computational cost. Several studies have been dedicated to validating dynamic models for healthy helical gears17–19 and for modeling tooth faults in helical gears, such as wear20–22 and cracks.23–26 Nonetheless, most effort has been invested in the fundamental dynamic of healthy helical gears, hindering tackling tooth faults modeling and conducting in-depth physical investigations to allow for the development of signal processing and feature extraction techniques to monitor helical gears. Consequently, to the best of our knowledge, fault detection in helical gears has not been addressed using dynamic modeling.
Gear fault diagnosis usually encompasses fault detection, classification, and severity estimation.1,4 However, although fault diagnosis has progressed significantly over the years, primarily through synchronous averaging,27–31 most of the effective methods and condition indicators suggested are mainly for monitoring spur gears, relying on an impulsive response generated during the interaction with the fault.3,32–36 The response generated by interaction with localized faults is compensated by continuous contact and high contact ratio in helical gears, resulting in a much weaker response compared to spur gears that are often masked by normal characteristics in the vibration signal. As a result, the mechanical advantage of helical gears in quieter and smoother operation introduces serious diagnostic challenges for early detection that have not been thoroughly studied. In recent years, cyclostationary analysis has gained attention for its ability to detect subtle, periodic features in vibration signals that are often obscured in traditional analyses. 37 By focusing on second-order cyclostationary analysis, researchers have successfully distinguished between different gear wear mechanisms, such as fatigue pitting and abrasive wear, and monitored their progression over time.37,38 Despite these advancements, the application of cyclostationary analysis to helical gear monitoring remains limited. Thus, further research is needed to adapt and validate these techniques for the unique characteristics of helical gear dynamics.
In summary, although progress has been made, there are still research gaps in the modeling and fault detection of helical gears. These gaps include: (1) limited experimental validation of dynamic models specifically for faulted helical gears and (2) a need for health indicators (HIs) that are sensitive and specifically designed to capture the subtle fault manifestations unique to helical gear dynamics.
In the current study, we delve into helical gear monitoring across two case studies: The first case study involves dynamic modeling of tooth breakage faults in helical gears using a platform of a validated dynamic model for healthy gears. The second case study compares traditional HIs and proposes a novel HI based on spectral analysis and meaningful feature extraction for early detection of broken tooth (BT) faults in helical gears. The effectiveness of the new fault detection algorithm is evaluated through controlled-degradation tests on the gears. The second section presents the controlled-degradation test apparatus and experimental program. The third section introduces the existing framework of a gear dynamic model and the validation of a new helical tooth fault modeling approach. The fourth section describes the novel fault detection algorithm, while the fifth section compares its performance with conventional features for gears. The sixth section concludes and summarizes both case studies.
Controlled-degradation tests in helical gears
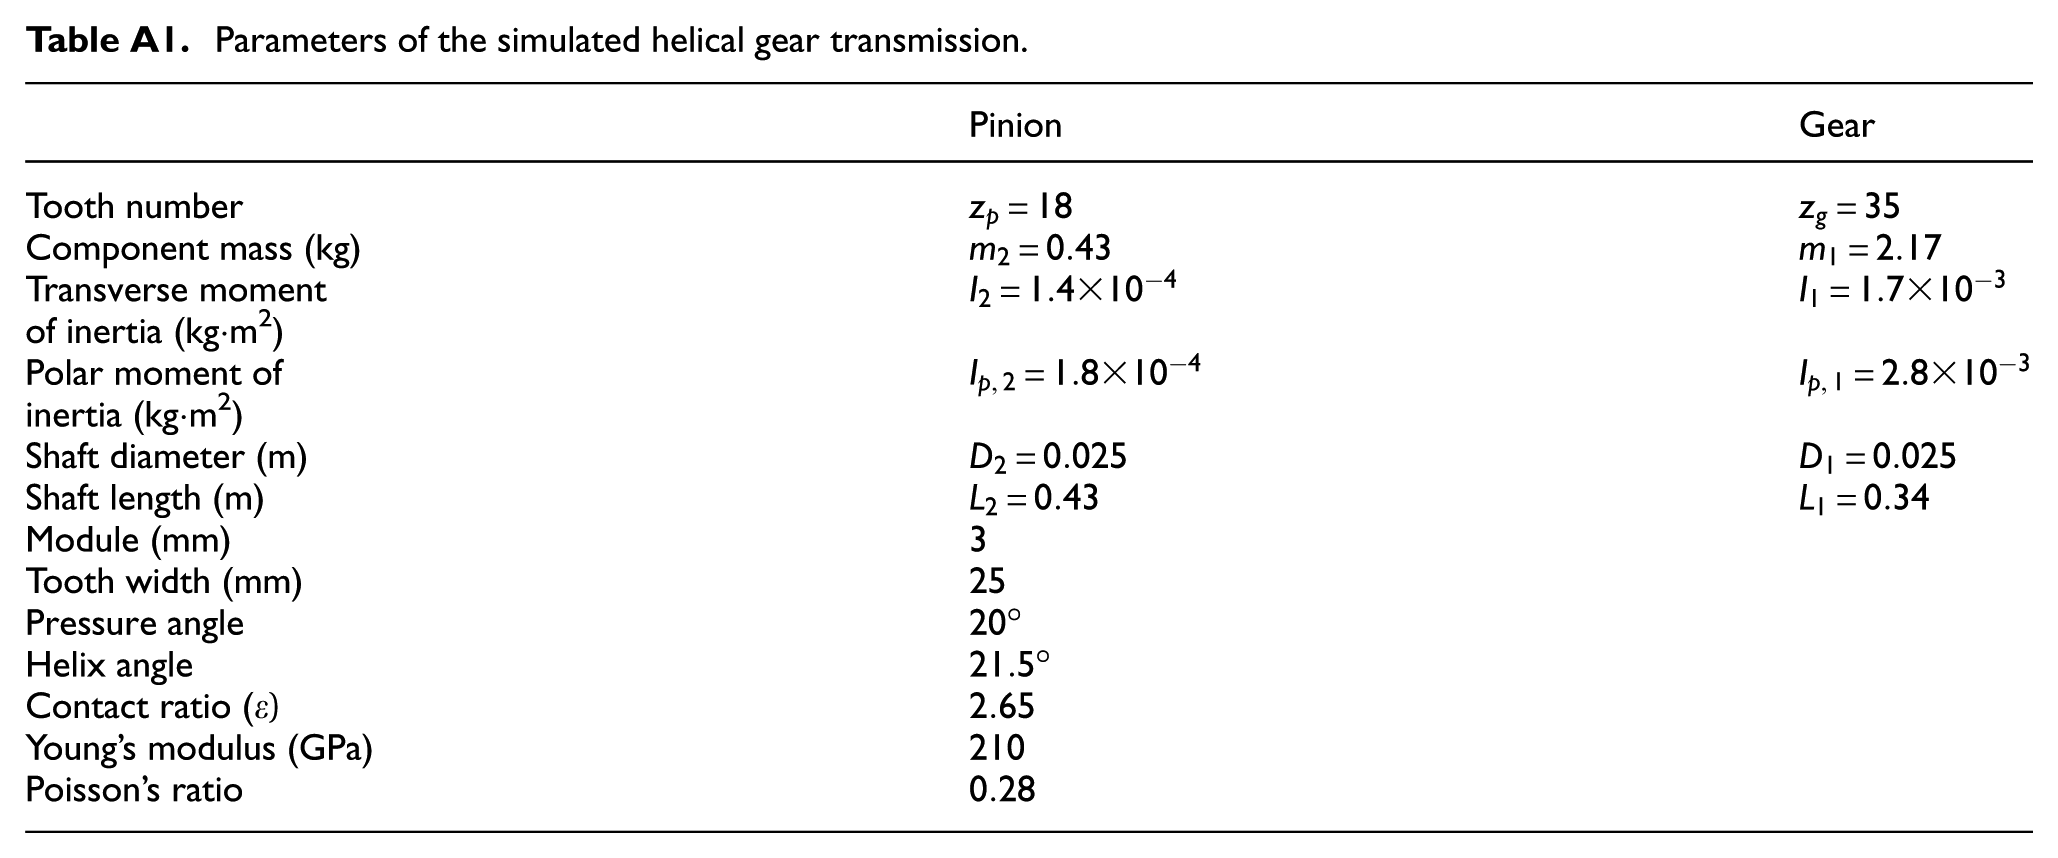
Controlled-degradation tests monitor health degradation over fault severity, rather than over time, such as in endurance tests. Even though these tests do not necessarily require prior knowledge about the degradation rate over time, they are still crucial as they allow absolute control over fault size and shape, and this is particularly relevant for validating dynamic models. We conducted an extensive controlled-degradation test of helical gears, monitoring tooth breakage faults over fault severity. The test apparatus is illustrated in Figure 1, and it comprises an open single-stage helical gearbox (helix angle = 21.5°). The driving pinion (z p = 18teeth) is connected to the driving motor, while the driven gear (z g = 35teeth) is connected to the output shaft and subjected to a constant torque applied by a hydraulic pump. Both wheels were manufactured with fine surface roughness, following the DIN7 standard. Appendix A summarizes more parameters of the inspected gearbox. A three-axial piezoelectric accelerometer is mounted onto the support brackets to measure vibration data, and a magnetic pick-up speed tachometer is mounted for speed measurement. Localized tooth breakage faults are seeded gradually to the output gear at 11 different severities, presented in Figure 2, as follows: four severities of chipped-tooth faults (namely, CT1, CT2, CT3, and CT4), expressed by partial removal of material from the tooth width (W) and height (H); six severities of BT faults (namely BT1, BT2, BT3, BT4, BT5, and BT6), expressed both by chipping (similar to CT4) and tip loss; and a missing tooth (MT), expressed by the removal of an entire tooth.
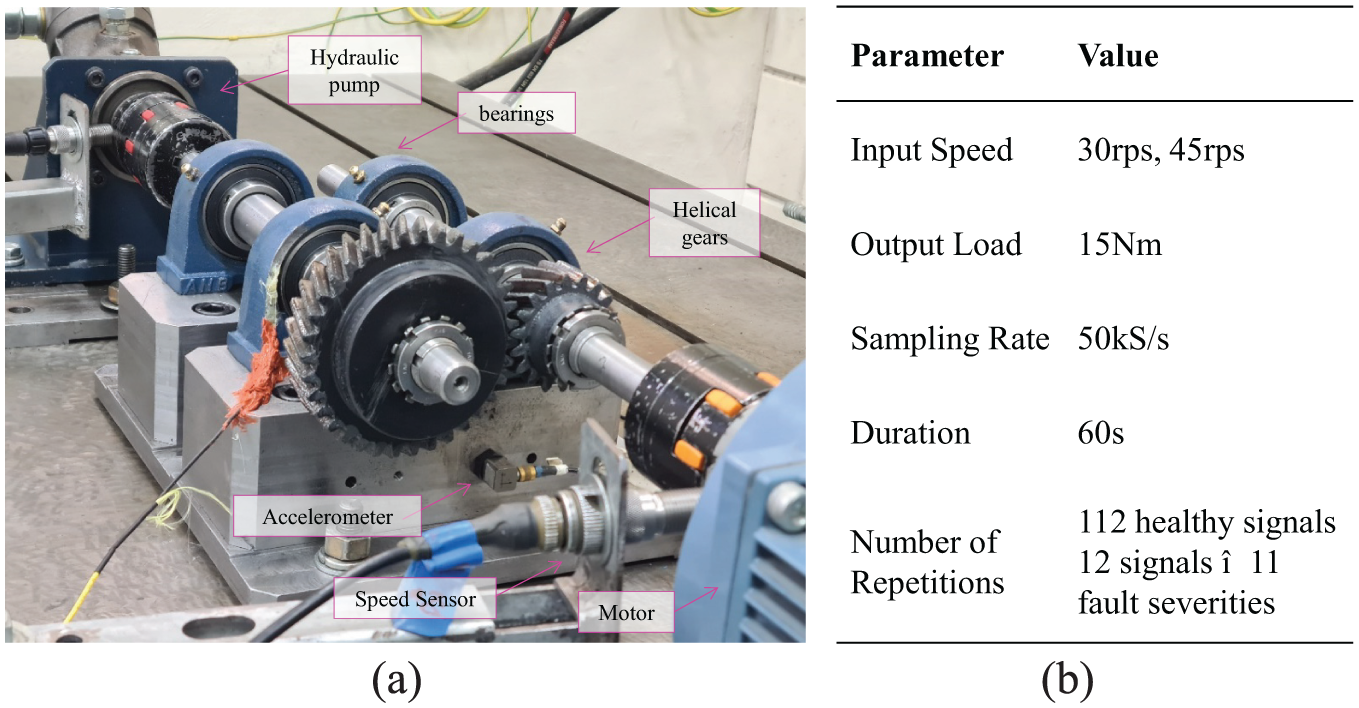
Controlled-degradation test: (a) test rig and (b) experimental setup.
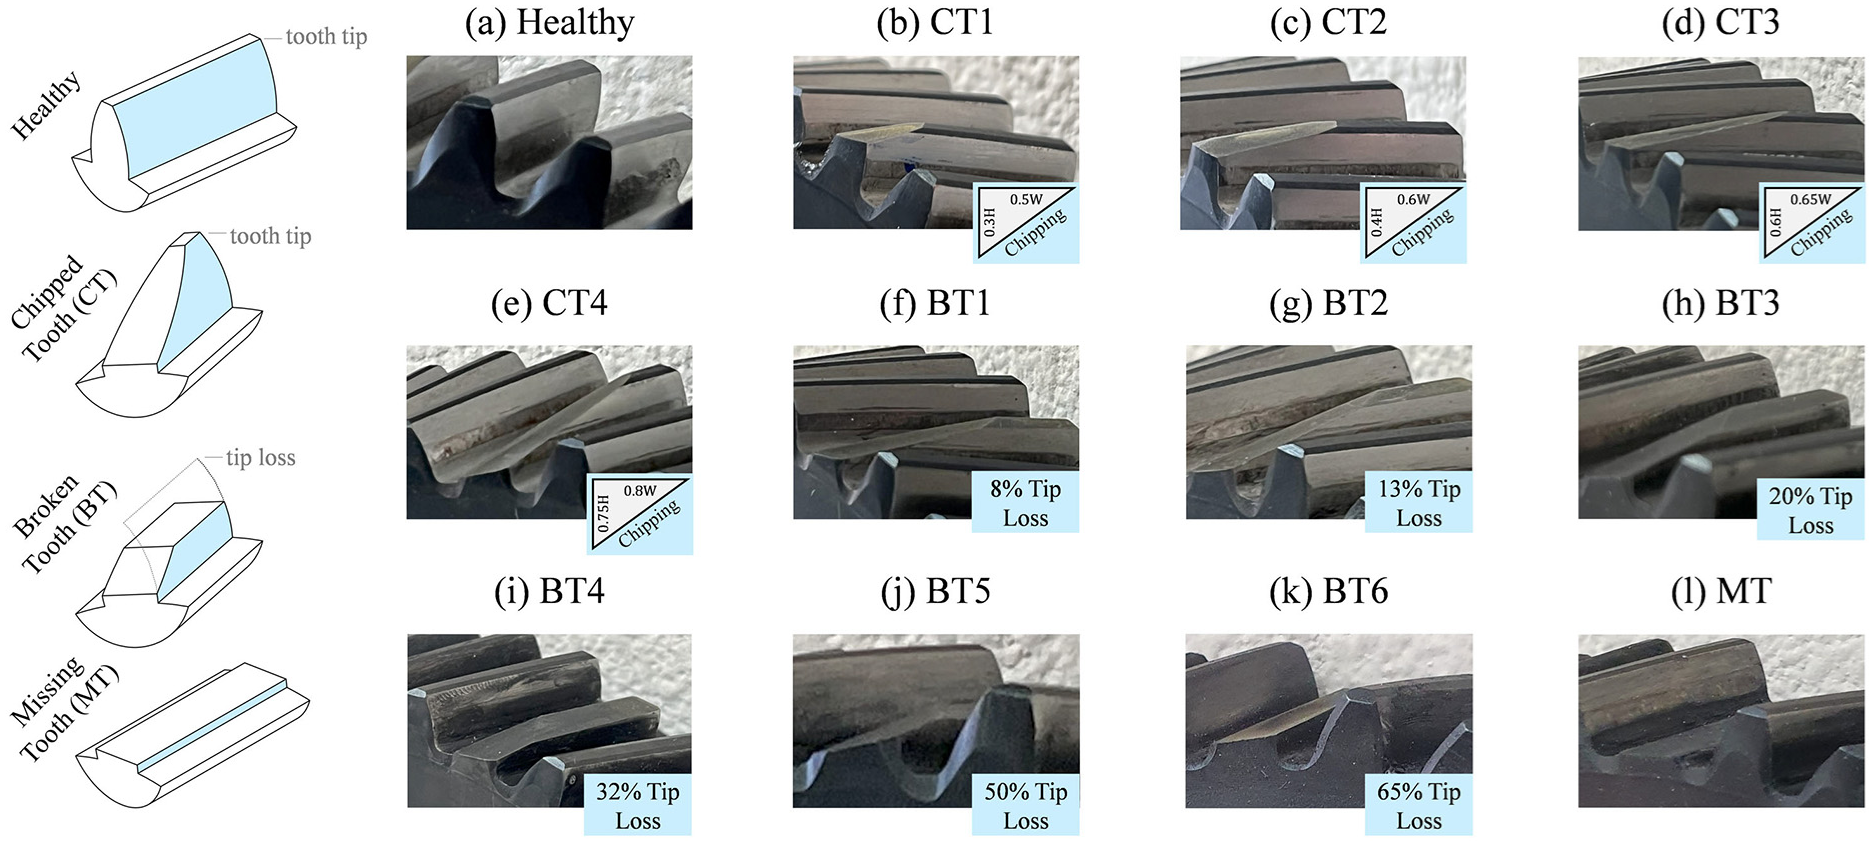
Tooth breakage faults in the experiment. (a) Healthy, (b) CT1, (c) CT2, (d) CT3, (e) CT4, (f) BT1, (g) BT2, (h) BT3, (i) BT4, (j) BT5, (k) BT6, and (l) MT.
Dynamic model for tooth breakage faults in helical gears
The first case study addresses the complexities associated with dynamic modeling of the intricate patterns manifested by tooth breakage faults in helical gears. We utilize a dynamic model for helical gears suggested in previous work that was validated experimentally. 17 In this case study, we first introduce the existing framework of the validated dynamic model for healthy helical gears. Then we describe the new tooth breakage fault modeling approach by in-depth investigation of the vibration signal and the time-variant GMS. Finally, we validate the new modeling approach experimentally with measured data from controlled-degradation tests.
Framework for dynamic modeling of helical gears
The existing framework for dynamic modeling of helical gears is thoroughly explained in the study by Cohen et al. 17 This model was originally constructed for spur gears, 39 with augmentation to helical gears using the multi-slice method. According to this method, the helical tooth is segmented into thin slices along the tooth width, treating each slice as a spur tooth.
A block diagram of the core steps in this model is presented in Figure 3, and can be explained as follows:
Step 1: Model parameters—Configurate the model with the desired tooth pair, operating conditions (speed and load), surface roughness, health status, and more.
Step 2: Healthy tooth profile—Generate the involute profile of a healthy spur gear and calculate contact properties such as the initial contact and contact ratio for each slice.
Step 3: Manufacturing errors—Generate profile errors for each tooth slice according to the desired precision grade, 40 considered in the model as a displacement input along the contact line.
Step 4: Tooth faults—Generate the damaged tooth profile according to the desired fault.
Step 5: GMS—Calculate the equivalent time-variant GMS for each slice, using contact analysis and beam theory principles.
Step 6: Multi-slice—Combine the contribution of each slice properly, including the GMS, profile errors, and so on.
Step 7: Euler–Lagrange components—Formulate the nonlinear equations of motion, as shown in Equation (1), where

Step 8: Numerical solution—Solve the nonlinear equations of motion numerically.
Step 9: Simulated signal—Derive the simulated vibration signal from the numerical solution.
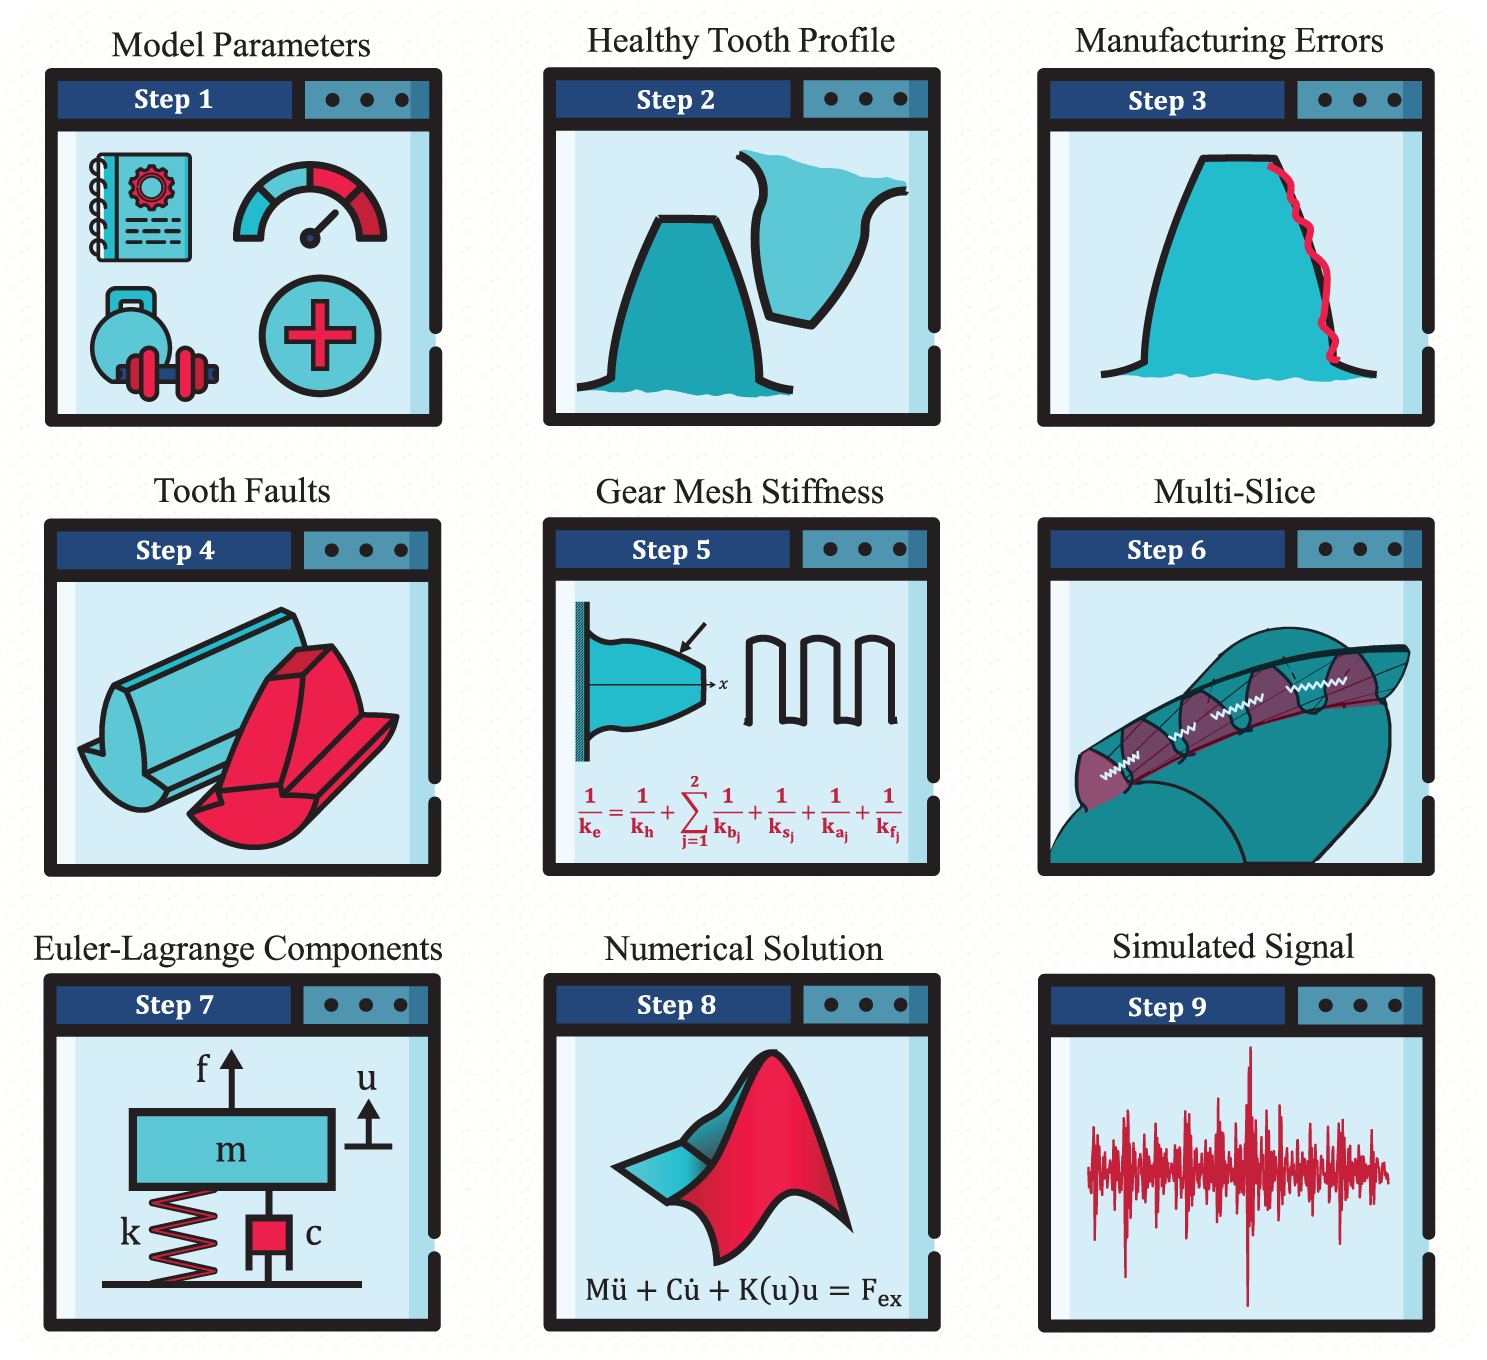
Block diagram of the dynamic model of helical gears.
Tooth breakage fault modeling approach
Tooth breakage faults affect the GMS in two main ways: chipping alters the tooth width along the tooth axis (X), and tip loss reduces the tooth height. These factors are relatively straightforward to model in spur gears. 41 In these gears, the contact line is two-dimensional and constant, so chipped regions only reduce tooth width while maintaining contact. However, tip loss eliminates entire regions from contributing to the mesh, potentially causing zero GMS if the damaged area intersects the pressure line in a single-meshing pair region. Figure 4(b) illustrates tooth breakage in spur gears, showing how the contact line (indicated by magenta dashed lines) remains constant, and how the tooth width varies between two time steps (denoted as 1 and 2) due to breakage.
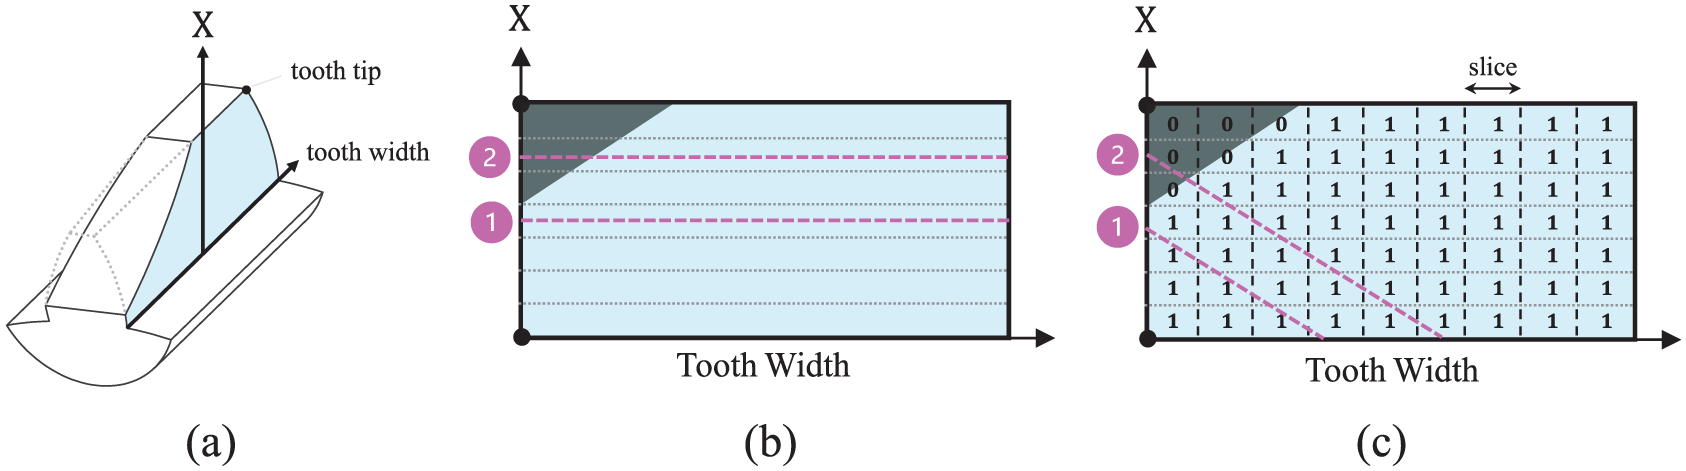
Comparison of tooth breakage modeling: (a) BT illustration, (b) spur gear, and (c) helical gear.
In helical gears, implementing these considerations is significantly more complex due to the three-dimensional and variable contact line. The multi-slice method divides the helical tooth width into thin slices, treating each as a spur tooth. Each slice has a similar equivalent stiffness along the x-axis. The multi-slice method considers the variable three-dimensional pressure line, and for each time step, determines which slices participate in the mesh and where each slice intersects the pressure line along the x-axis. 17 We suggest a novel tooth breakage modeling approach, leveraging the multi-slice method for simplifying complex calculations of the GMS. The damaged helical tooth is constructed and discretized to align with the slice segmentation. A binary matrix of 0 and 1 s is created, with 0 s for damaged regions and 1 s for healthy regions. This matrix multiplies the equivalent stiffness of all slices at each time step before summation along the variable pressure line, ensuring that only healthy regions contribute to the overall stiffness. Figure 4(c) illustrates the variable pressure line in helical gears and the suggested modeling approach using the multi-slice method and a binary matrix to denote damaged regions. It shows that, for two different time steps, the same slice may or may not contribute to the equivalent stiffness, depending on whether it intersects the pressure line and whether it is healthy at the intersection point along the x-axis.
From the moment a new tooth pair engages until it separates and exits the pressure line, ε/z gearmesh (GM) cycles occur (where ε is the contact ratio and z is the number of teeth). This means that the cycle duration of the equivalent stiffness for each pair is ε/z, as shown in Figure 5(a). After calculating the equivalent stiffness of a single tooth pair, whether in healthy or faulty states, the total GMS is determined by summing the contributions of all pairs in the mesh over time, according to a proper contact analysis along the pressure line, as shown in Figure 5(b) and (c).
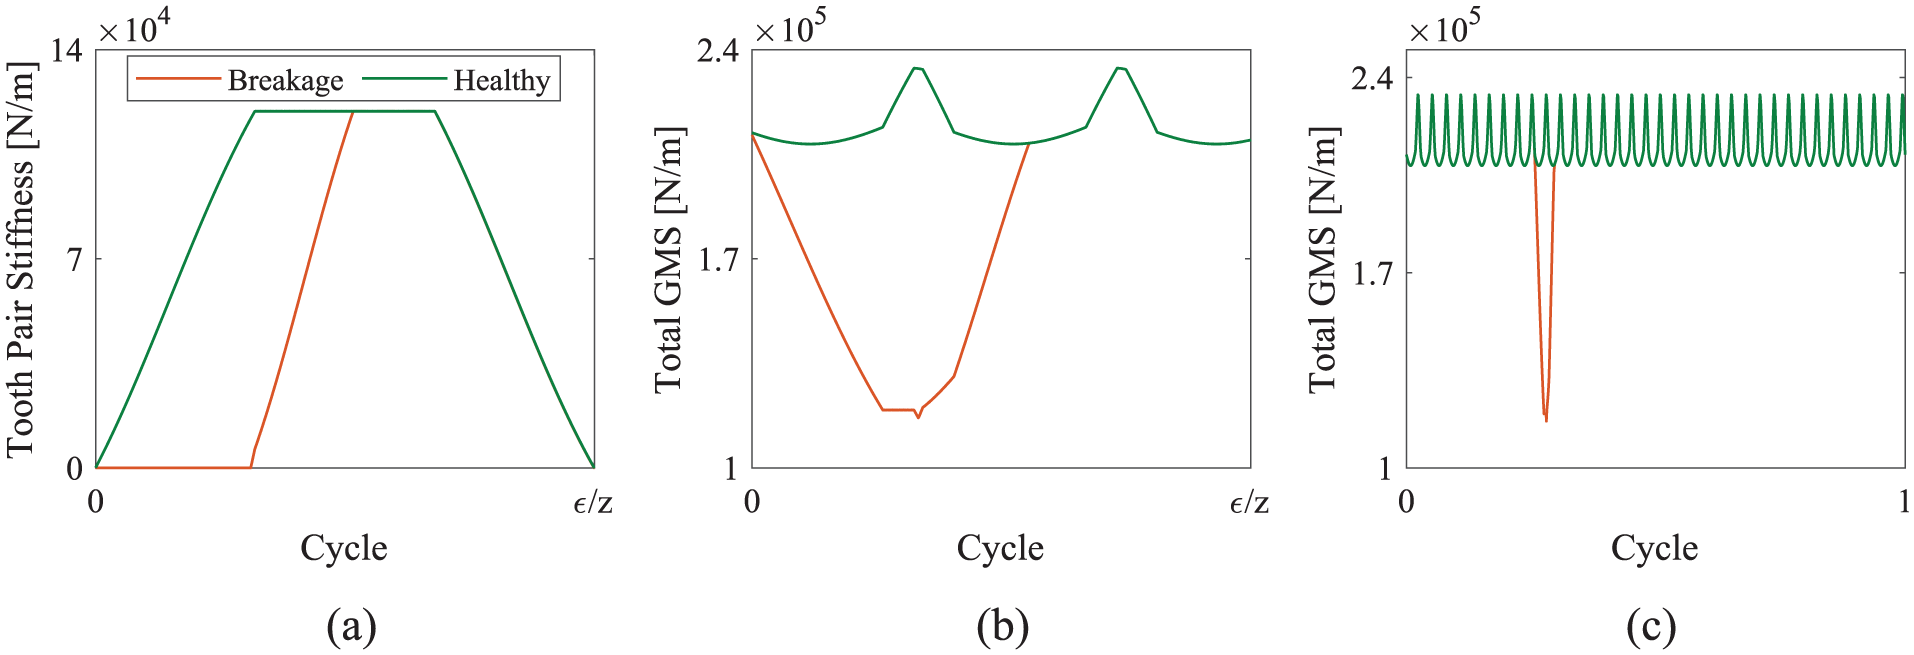
Effects of tooth breakage on the GMS: (a) equivalent stiffness of a single tooth pair, (b) GMS from engagement to separation of a BT pair, and (c) total GMS for a single cycle.
Model-based investigation of tooth breakage faults in helical gears
Tooth breakage faults clearly affect the GMS. However, it is important to understand how these effects manifest in the vibration signature. We analyze the effects of tooth breakage on the GMS and compare them to the synchronous average (SA) signals for all inspected faults, as shown in Figure 6. To allow a pure investigation of tooth breakage faults, vibration signals are generated for an ideal tooth profile. Each health status class appears with a distinctive color for coherence, including healthy (green), CT (yellow), BT (red), and MT (black).
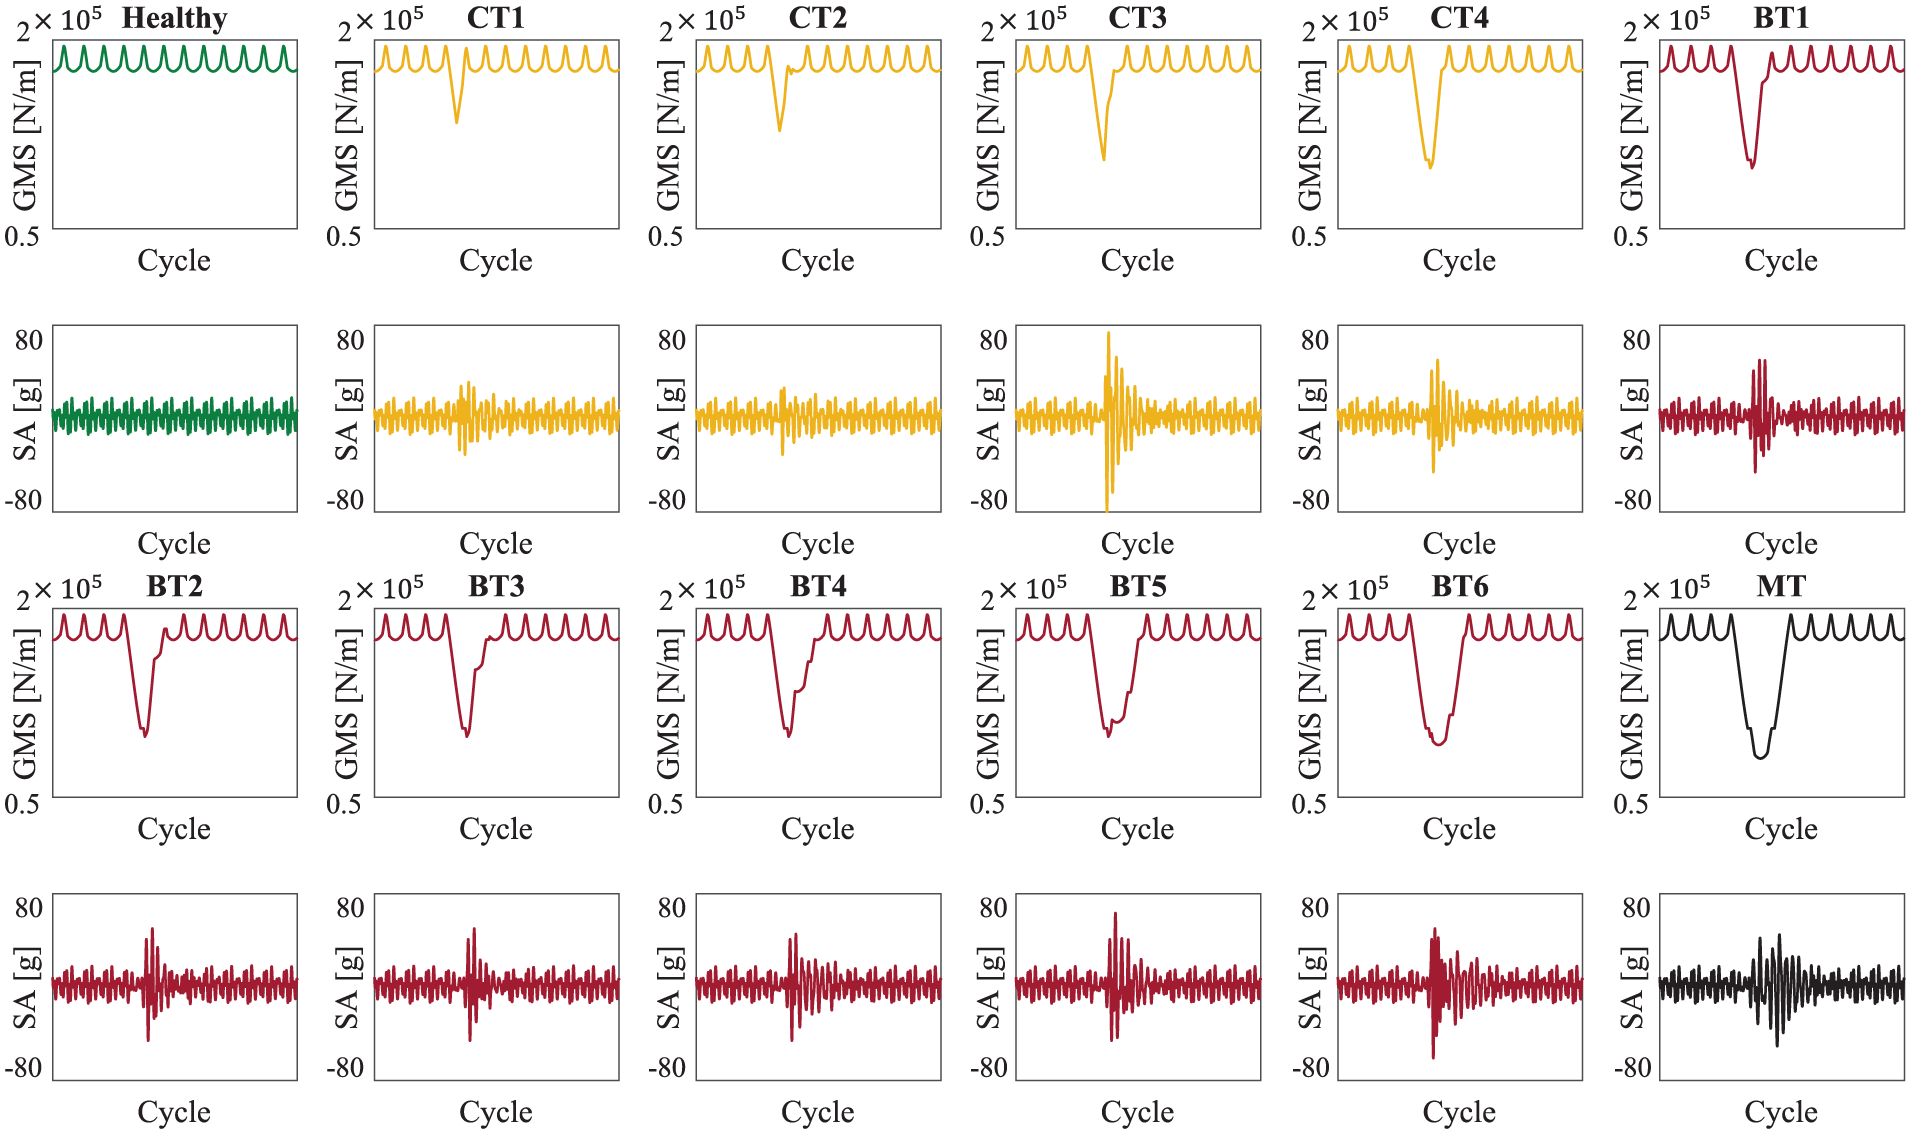
Relationship between the GMS and the SA signal.
The faults presented in Figure 6 are sorted from the least to the greatest amount of damage, and, as expected, there is a clear correlation between the material removed from the tooth and the decrease in GMS. The equivalent stiffness sums up the contribution of all slices, and since the novel modeling approach eliminates the contribution of damaged regions, the GMS naturally decreases as the damaged region increases. Surprisingly, this observation is not correlated with the dynamic behavior of the vibration signal. In spur gears, the impulsive vibration signal in healthy operation arises from the discontinuity of the GMS during tooth engagement and separation. 42 In contrast, helical gears do not exhibit this behavior. Healthy helical gears generate a weak response during normal operation, slightly amplified, whereas GMS is minimal. While in spur gears, a higher number of meshing tooth pairs leads to greater stiffness, in helical gears, the variable pressure line length dominates GMS behavior, 17 regardless of the number of meshing tooth pairs. For example, in a transmission with a contact ratio of approximately 2.65, the GMS reaches its minimum when three tooth pairs intersect the pressure line.
The dynamic behavior of tooth breakage faults exhibits significant differences between spur and helical gears. Two phenomena dictate BT faults: a reduction in GMS increases flexibility, amplifying vibrations, and when the BT exits the pressure line, it significantly impacts the GMS as the contact region sharply increases. In spur gears, the contact ratios are typically between 1 and 2, and the discontinuous GMS signal causes a cyclic impulsive response even in normal operation. If the tooth is broken when only a single pair bears the mesh, it would result in loss of contact, which would generate a sharp and amplified impulse. 42 The greater the tip loss, the higher the momentum gained before returning to contact, resulting in a stronger response. However, in helical gears, the contact ratios are typically above 2, and the GMS signal is continuous, so loss of contact cannot occur due to localized tooth faults. As expected, an impulsive response is generated when the fault exits the pressure line (see Figure 6), but this is not necessarily correlated with fault severity. The intensity of the response depends both on a reduction in GMS and on the length of the segment from the pressure line to which the damaged tooth contributes after the fault exits. This length varies with parameters like chipping geometry and tip loss (see Figure 2), but it is not necessarily correlated with them. For example, the angle of the chipped region may affect more than the percentage of the chipped region of the tooth. Thus, it is incorrect to claim exclusively that greater tip loss or a larger chipped region always results in a sharper and more amplified impulse. This understanding indicates that fault severity does not directly correlate with its size. This insight is evident in vibrations, as presented in Figure 6, where the impulse magnitude and shape are not monotonous with the decrease in GMS or increase in fault size. In spur gears, the correlation between dynamic response and fault geometry allowed for the development of fault severity methods. 42 This study focuses on the characterization of the dynamic behavior of broken teeth in helical gears and the development of fault detection methods, while further research is needed to determine the relationship between fault geometry and severity.
Experimental validation
The novel modeling approach in this study was validated experimentally, using the controlled-degradation test presented in Figure 1. This validation relied on a spectral analysis of the SA across health statuses, shown in the spectrograms in Figure 7, and a trend comparison of common condition indicators 4 such as root mean square (RMS) (normalized by the mean value of a healthy status) and kurtosis from the difference signal, presented in Figure 8.
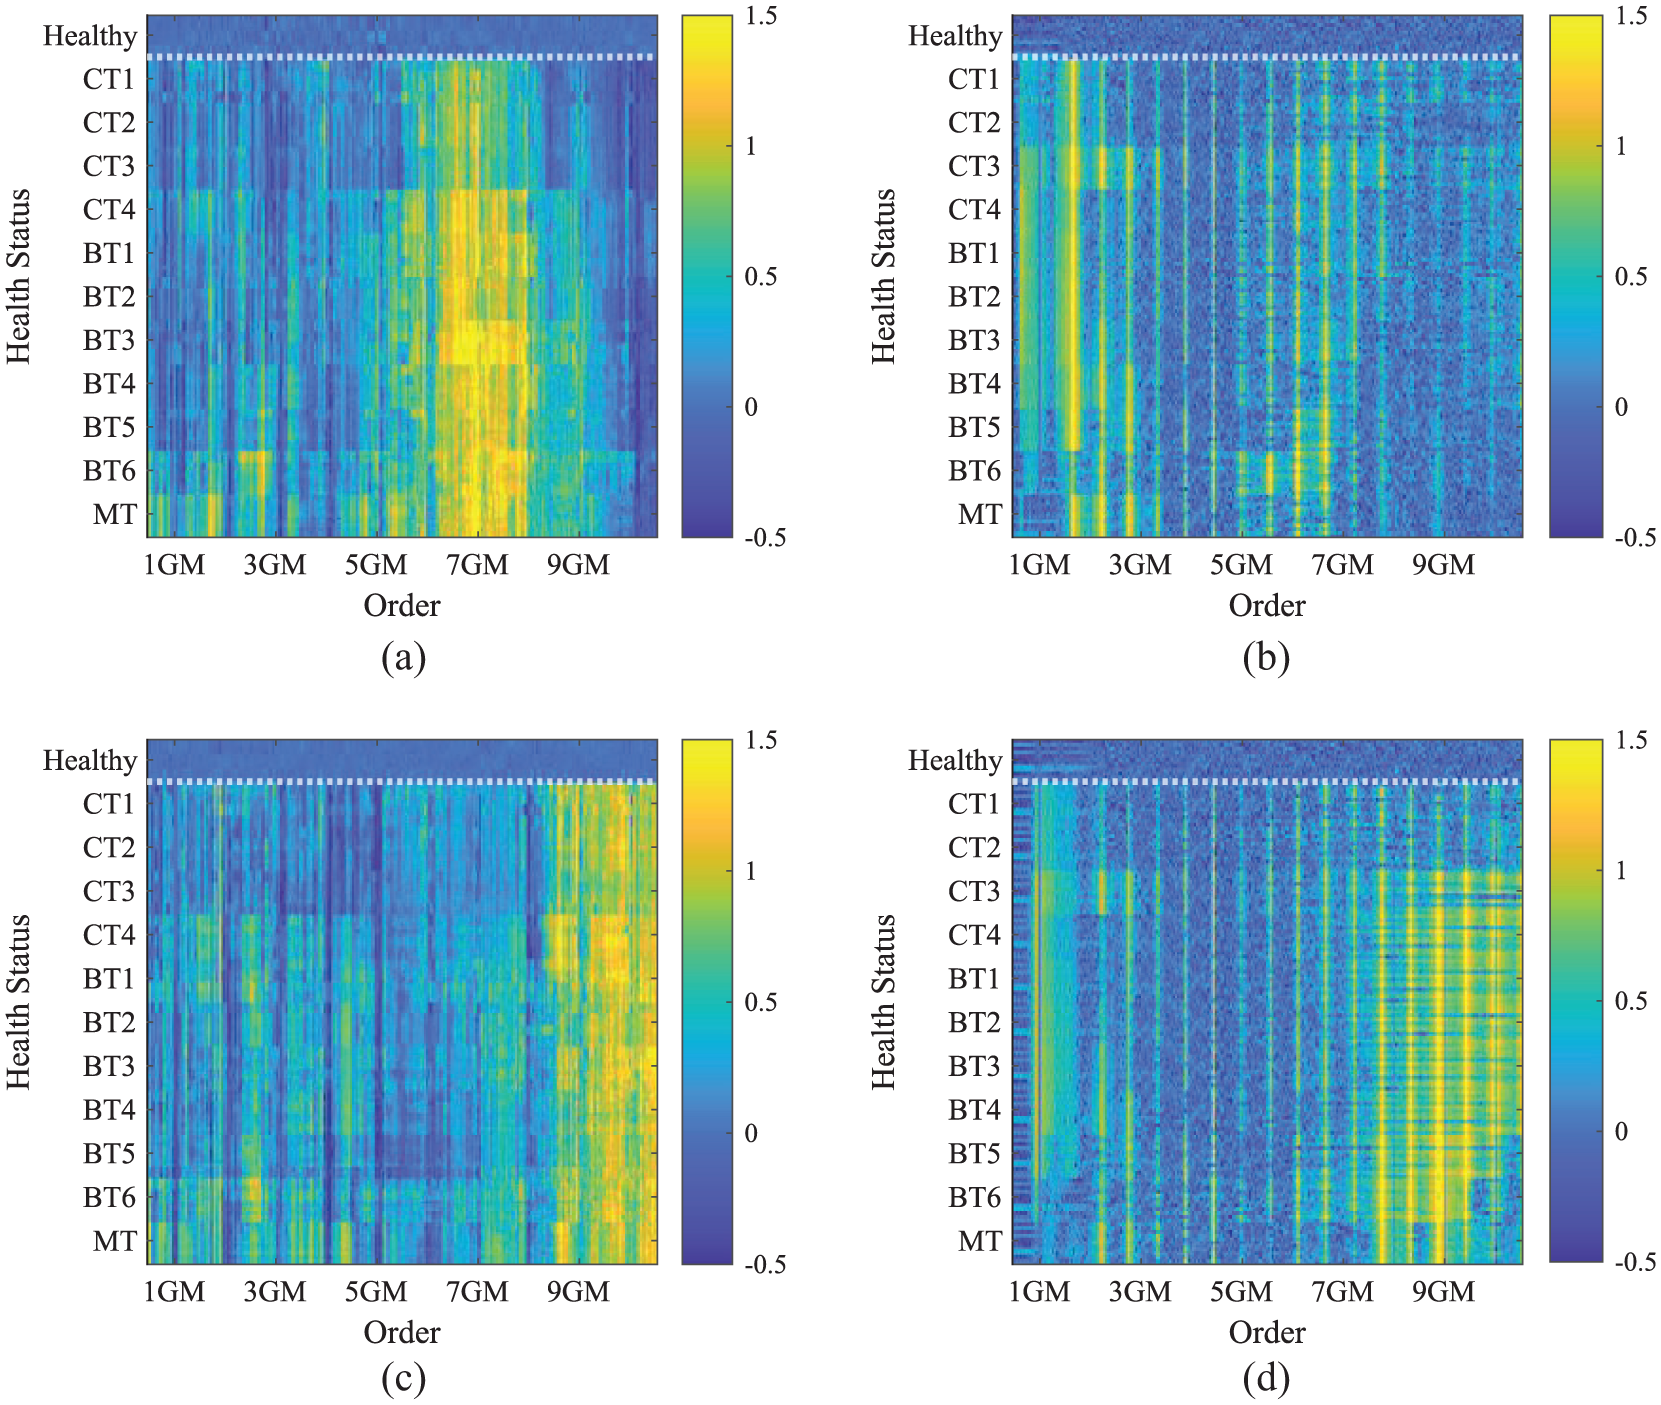
SA spectrum analysis: (a) 45 rps (experiment), (b) 45 rps (simulation), (c) 30 rps (experiment), and (d) 30 rps (simulation). White dashed lines separate healthy from faulty statuses. The color bar shows the spectral energy normalized by the mean spectrum of a healthy state (in a logarithmic scale).
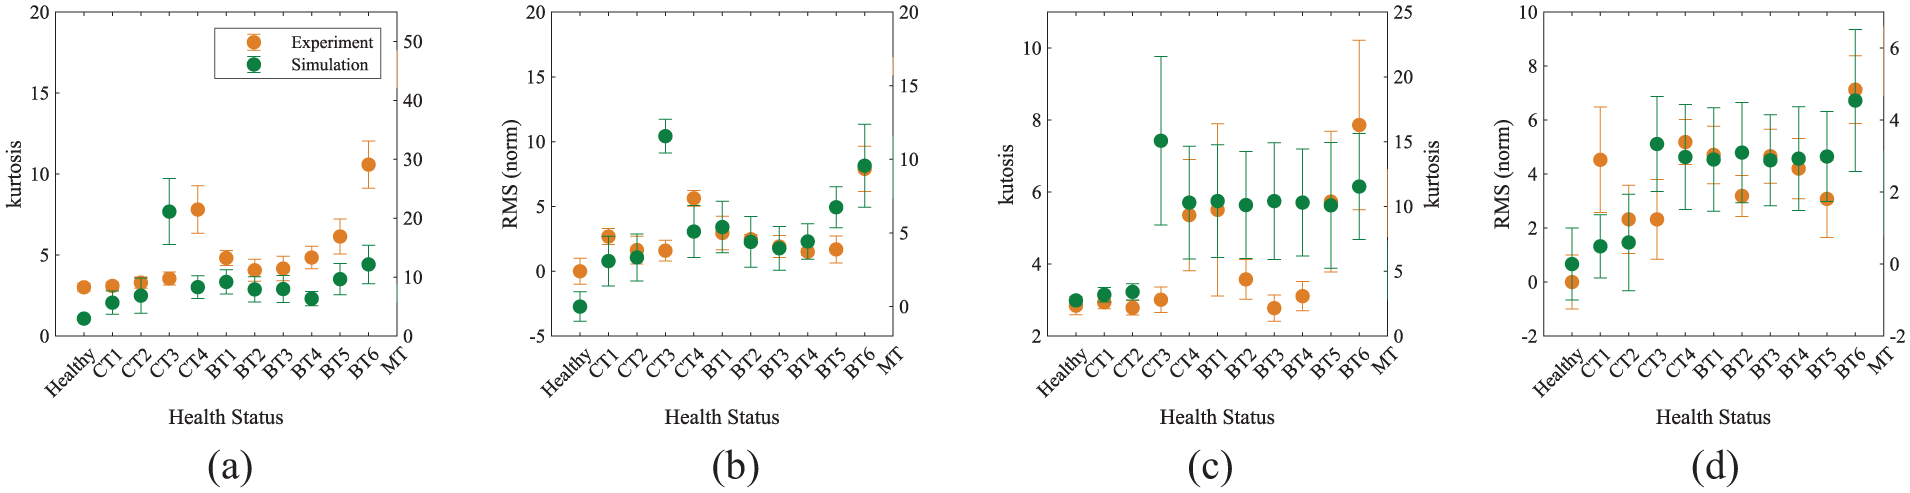
Trend analysis of common condition indicators extracted from the difference signal across health status: (a) kurtosis at 45 rps, (b) normalized RMS at 45 rps, (c) kurtosis at 30 rps, and (d) normalized RMS at 30 rps. The dot represents the mean, with vertical lines indicating the variance of all the records in the same status. Each figure appears with two vertical axes, left for the experiment and right for the simulation.
The spectra in Figure 7 were normalized by the mean spectrum of a healthy state to enable a proper comparison between the simulation and experiment. For both simulated and experimental results, the fault amplified the spectrum at modulation sidebands around the gearmesh harmonics, while the energy at the gearmesh harmonics remained unaffected by the fault, as expected from localized gear tooth faults.43–45 Although the spectral variation is clear between healthy and faulty states, it is not monotonous with health status, aligning with the physical investigation conducted previously. Fault manifestations are clearer at certain order bands, but these bands and the degree of spectral energy concentration differ somewhat between the simulated and experimental results. These variations are attributed to differences in measurement noise, transmission paths, 46 and boundary conditions not fully replicated in the numerical model. Nonetheless, the close alignment in qualitative trends and dynamic behaviors confirms that the model effectively captures the physical phenomena associated with localized tooth breakage faults. In addition, these bands vary with speed because frequency is normalized by rotational speed during angular resampling, leading to different representations of structural frequencies in the order domain. 27 The trend analysis in Figure 8 shows a correlation between simulation and experiment for both features and rotational speeds. Kurtosis, which highlights shape-based phenomena such as impulsive responses, remains low in most fault statuses, but peaks at CT3/CT4, consistent with the physical investigation in Figure 6. The normalized RMS shows a trend and value correlation between simulation and experiment across health degradation, and as expected from the spectral analysis, this trend is not monotonous with health status. The MT fault was more pronounced in the experiment, both in RMS and kurtosis, likely due to structural differences. Overall, the qualitative trend analysis reveals similar behavior between the simulation and experiment, verifying the novel modeling approach’s ability to simulate the general dynamic response of tooth breakage faults in helical gears.
HI for fault detection in helical gears
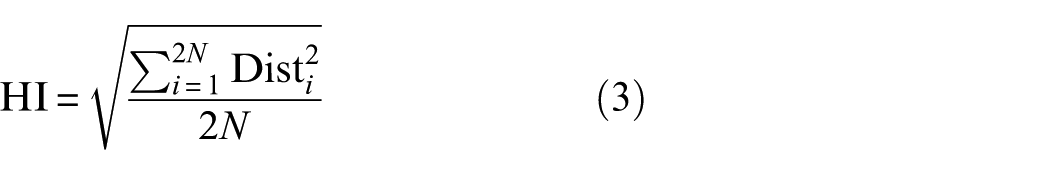
Gears operate in harsh environments and generate loud vibration signatures in both healthy and faulty conditions (unlike bearings, for example), making fault detection more challenging, especially for incipient faults.4,5 Helical gears, which are inherently quieter and smoother than spur gears, have weaker fault manifestations that can be easily masked by normal vibrations. Traditional fault detection algorithms, designed for localized tooth faults, mostly in spur gears, rely on a fusion of features extracted from the SA domain.3,32,41,43 These algorithms may struggle to detect either incipient or even more developed faults in helical gears. Fault detection algorithms typically use unsupervised learning to detect novelties by learning the healthy population’s manifold. 43 This requires an in-depth understanding of the healthy data. We propose a sensitive HI based on a comprehensive feature extraction technique that is novel for detecting localized tooth breakage faults in helical gears. This technique builds on insights from the physical investigation, following two main guidelines: (1) Extracted features should focus on energy metrics (such as RMS and spectral energy), rather than on shape-based metrics (such as kurtosis) since tooth faults in helical gears may not produce sharp impulsive responses; (2) the fault is emphasized in certain order bands in the spectrum, which are unknown and related to the background spectrum. Extracting features from the entire signal might mask fault information. Instead, the spectrum is divided into segments associated with gearmesh harmonics, aiming to capture a fault’s behavior in specific parts. For example, in Figure 7(a), analysis around the seventh gearmesh harmonic would likely yield more fault information than that around the third harmonic. The construction of this HI is illustrated in Figure 9, and it can be described step-by-step as follows:
Angular resampling: The signal is resampled from the time domain to the cycle domain to ensure a consistent number of samples in each shaft’s cycle.
Synchronous averaging: The SA signal and its spectrum are calculated.
SA segmentation: The spectrum is divided arbitrarily into segments of consecutive order bands, each associated with a different gearmesh harmonic.
SA filtering: In each segment, the gearmesh harmonic and its two close pairs of sidebands are filtered out to emphasize impulsive responses. The filtered segment is then transformed back to the cycle domain, similar to the difference signal calculation.
Feature extraction: Energy-based features are extracted from each segment, including the RMS of the filtered segment in the cycle domain and the spectral energy of each order in the segment.
Feature engineering: The extracted features are standardized relative to the healthy status using the z-score as presented in Equation (2). The standardized spectral energy is aggregated into a single feature, resulting in each segment contributing two features: the standardized RMS and the equivalent standardized spectral energy. Each sample is, thus, represented by 2N features, where N is the number of gearmesh harmonics within the bandwidth.
HI construction: The HI is calculated as the RMS of all features (see Equation (3)).
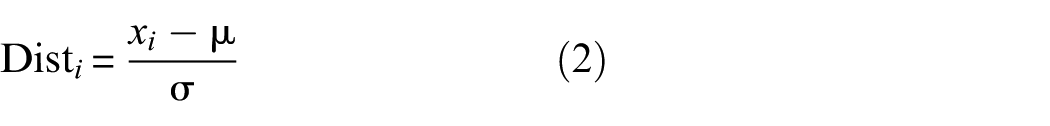
Where
A block diagram for the proposed fault detection algorithm in helical gears.
Results
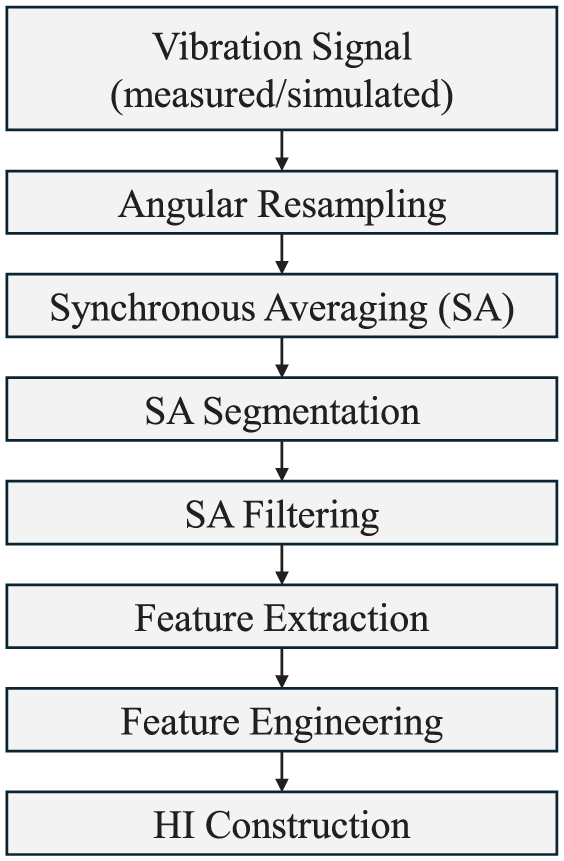
In this section, we examine the novel sensitive HI for the detection of localized tooth breakage faults in helical gears using the measured dataset from the controlled-degradation test. As explained previously, traditional HIs usually rely on features extracted from the entire SA, while the proposed HI relies on a sensitive set of features extracted from selective segments in the SA spectrum. Figure 10 compares the original difference signal with the augmented signals obtained by inverse transformation of each selective segment based on the GM harmonics, as explained in the fourth section.
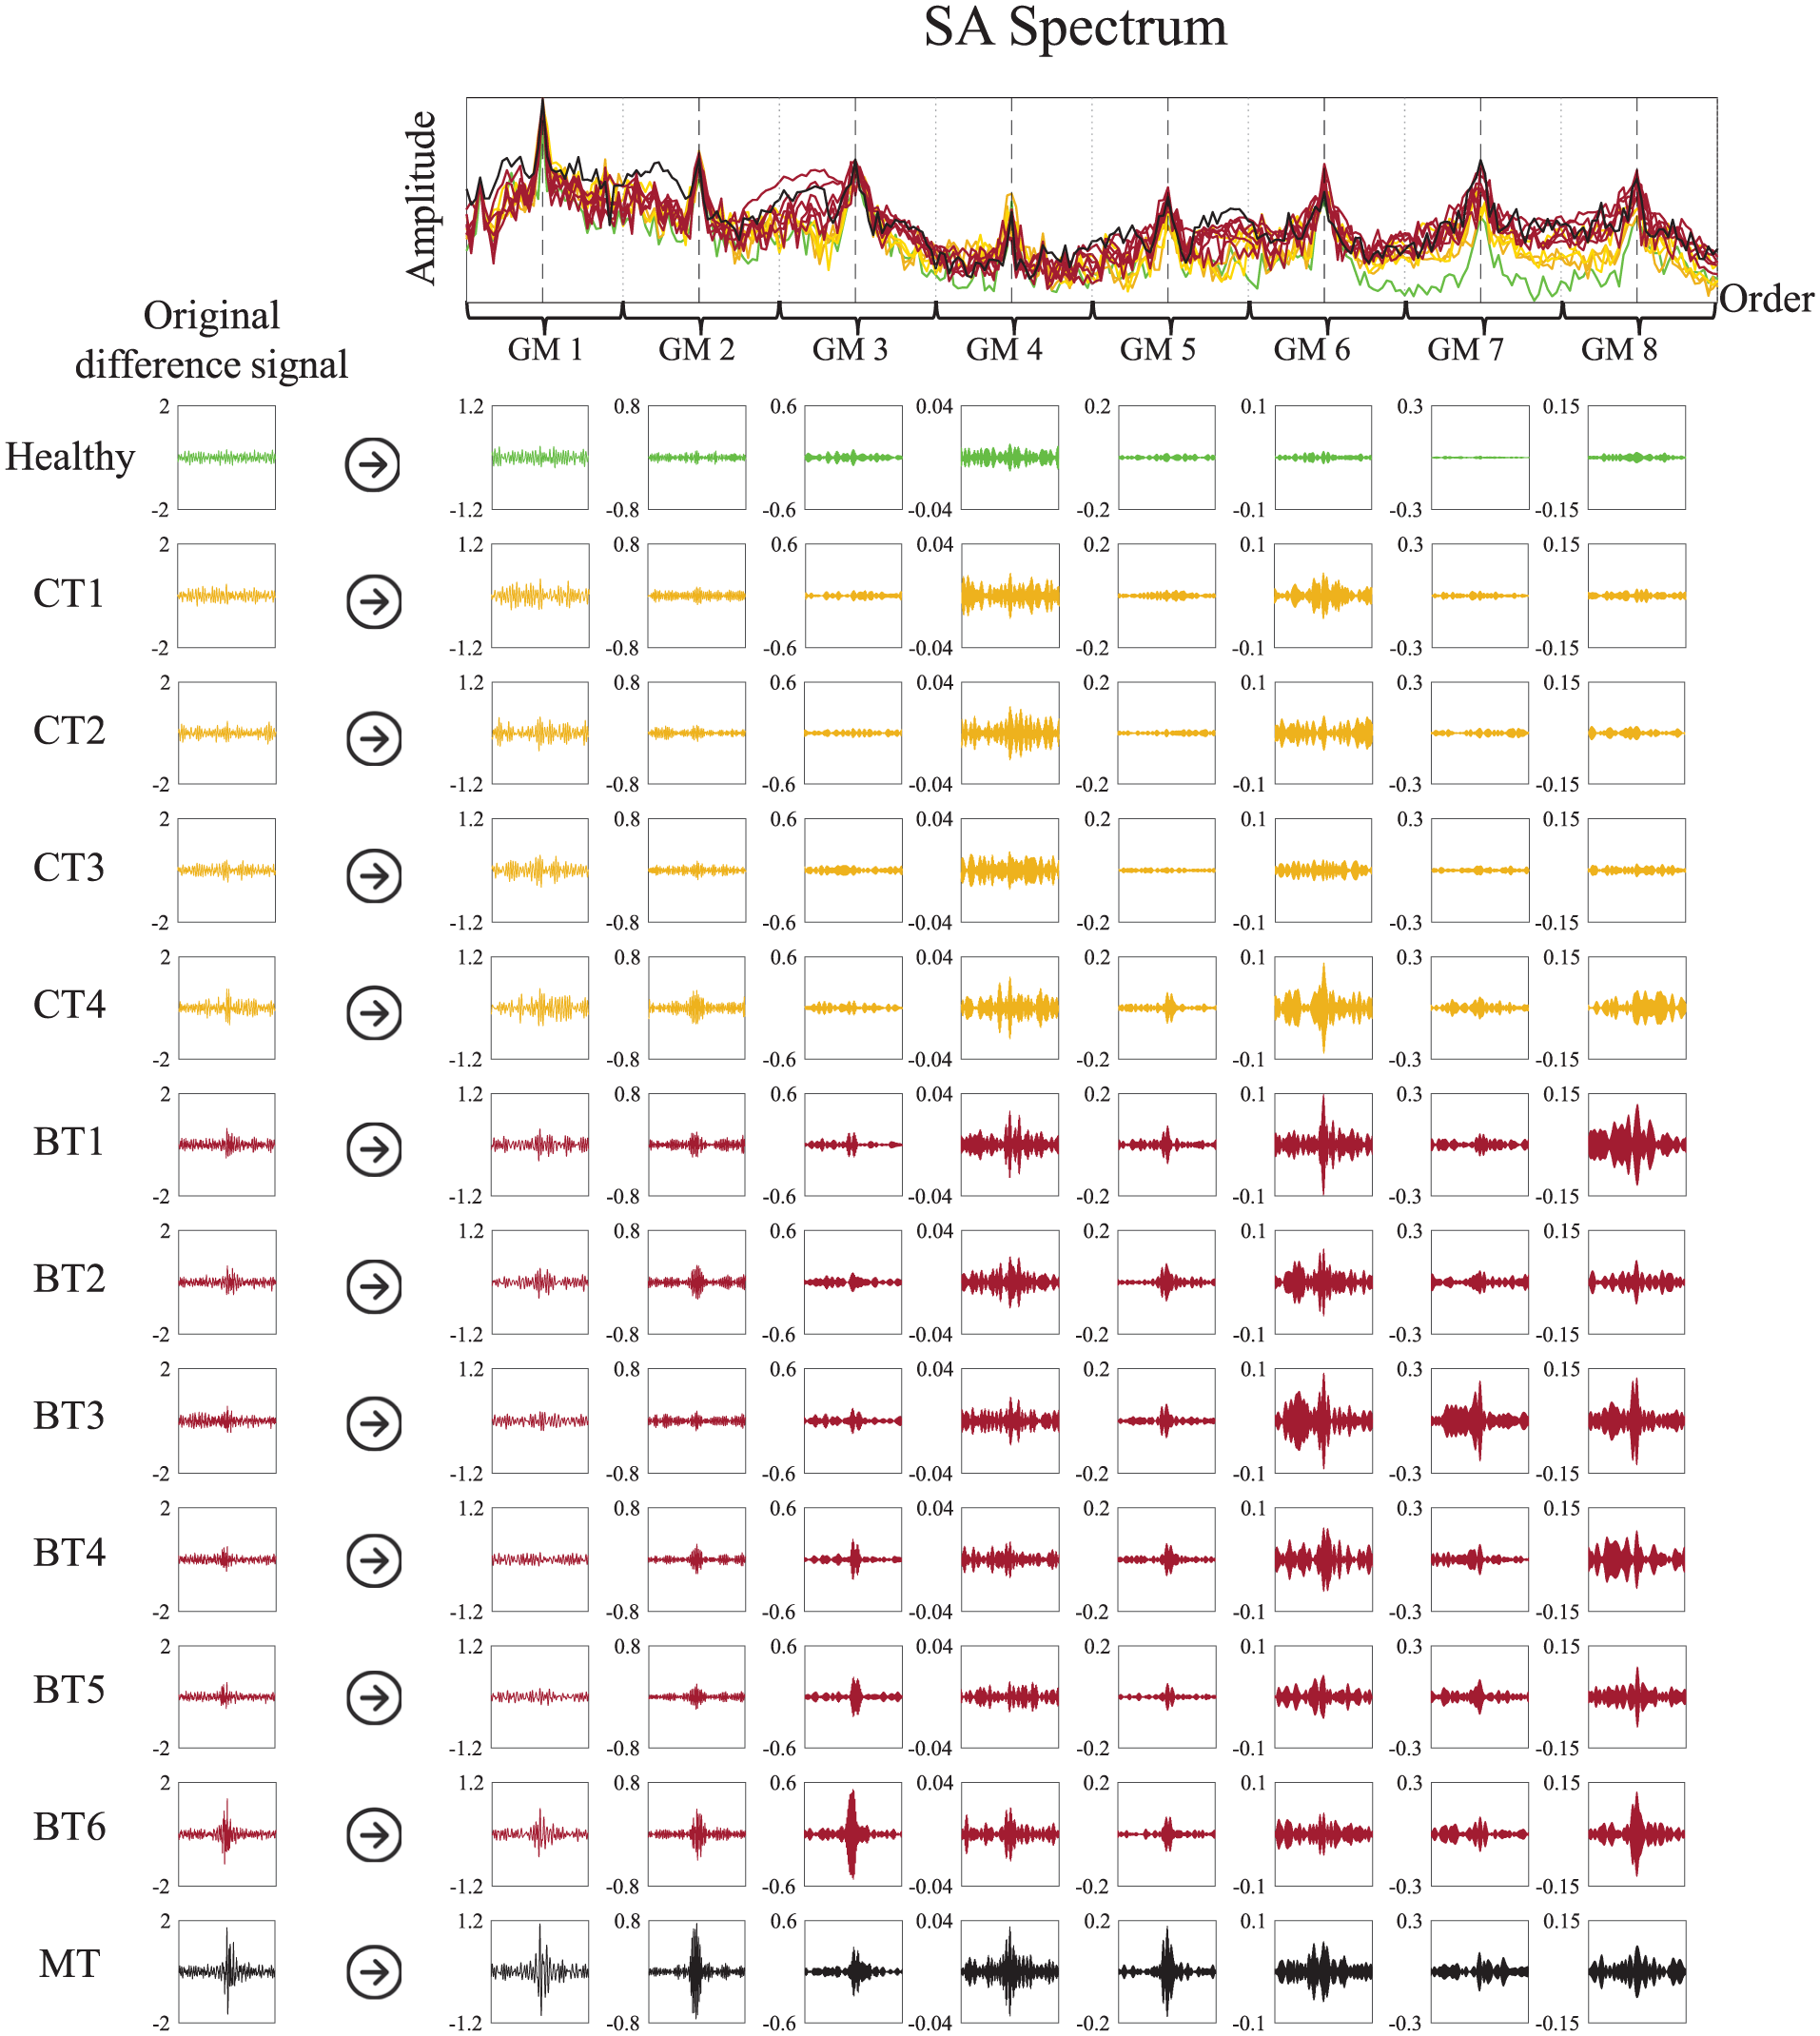
Fault expression in the original difference signal and its segmentation by the GM harmonic in the measured data. The x-axis represents the cycle, and the y-axis represents the signal amplitude with a similar scale across columns.
When examining each of the original difference signals (left column in Figure 10), it becomes apparent that most of the chipped-tooth faults, including CT1, CT2, and CT3, are difficult to distinguish from a healthy status. This difficulty arises because neither an impulsive response nor significant energy variations are observed. However, weak impulse responses with slight energy variations can be detected for CT4 and most of the BT faults, including BT1 through BT5. The first significant impulsive response appears at BT6 and is more noticeable in the MT faults. From analyzing the original difference signals from the experiment, we can conclude that fault detection would be challenging, particularly for smaller chipped-tooth faults, when relying solely on traditional energy-based or shape-based features extracted from the entire difference signal. Furthermore, the original signals align with the GMS analysis presented in Figure 5 for an ideal gear. These difficulties in recognizing fault patterns in the measured signals highlight the challenge of monitoring small faults in helical gears, as they manifest with energy levels similar to background noise. In contrast, the augmented segments decomposed from the SA spectrum exhibit different behaviors that emphasize fault manifestation, validating the proposed strategy. Similar to the analysis of the original difference signal, most of the CT faults do not generate sharp impulsive responses in the selected segments. However, certain bands in the spectrum are amplified, leading to sharp increases in energy levels, such as around the sixth gearmesh harmonic, which can be observed both in the spectrum in the order domain and in the segment in the cycle domain. We can recognize mixed patterns of weak impulse responses masked by significant energy increases. This observation is consistent across all faults, allowing for a clear distinction from the healthy status. Additionally, as in the difference analysis, more distinct impulses can be recognized starting from the CT4 fault and beyond, but unlike the dynamic behavior of the difference signal, these impulses appear more sharply and are amplified, spanning several segments. The observed behavior of the augmented segments aligns much more clearly with the GMS analysis in Figure 5, further validating the new modeling approach. The comparison between the original difference signals and the segmented difference signals provides solid justification for the proposed sensitive HI for two main reasons: first, fault patterns can be recognized more easily in certain regions of the spectrum, especially in the early stages; second, shape-based features do not provide crucial information for incipient faults, affirming the selection of energy-based features in the HI for fault detection.
We compared the performance of the proposed sensitive HI with that of a traditional HI. The traditional HI was constructed in a manner similar to the sensitive HI (see Equation (3)), but it involved extracting four features from the entire difference signal and its envelope. These features included the RMS and kurtosis of the difference signal, as well as the RMS and skewness of the envelope of the difference signal.3,32–36 For both the proposed and the traditional HIs, the healthy measured data were partitioned 90–10% between training and test datasets, respectively. The test dataset (both healthy and faulty) was standardized by the mean and variance estimated for the healthy training set before aggregation. Figure 11 compares the proposed HI with the traditional HI, each standardized according to the training set HI for both speed levels. The green and red horizontal dashed lines represent HI thresholds of
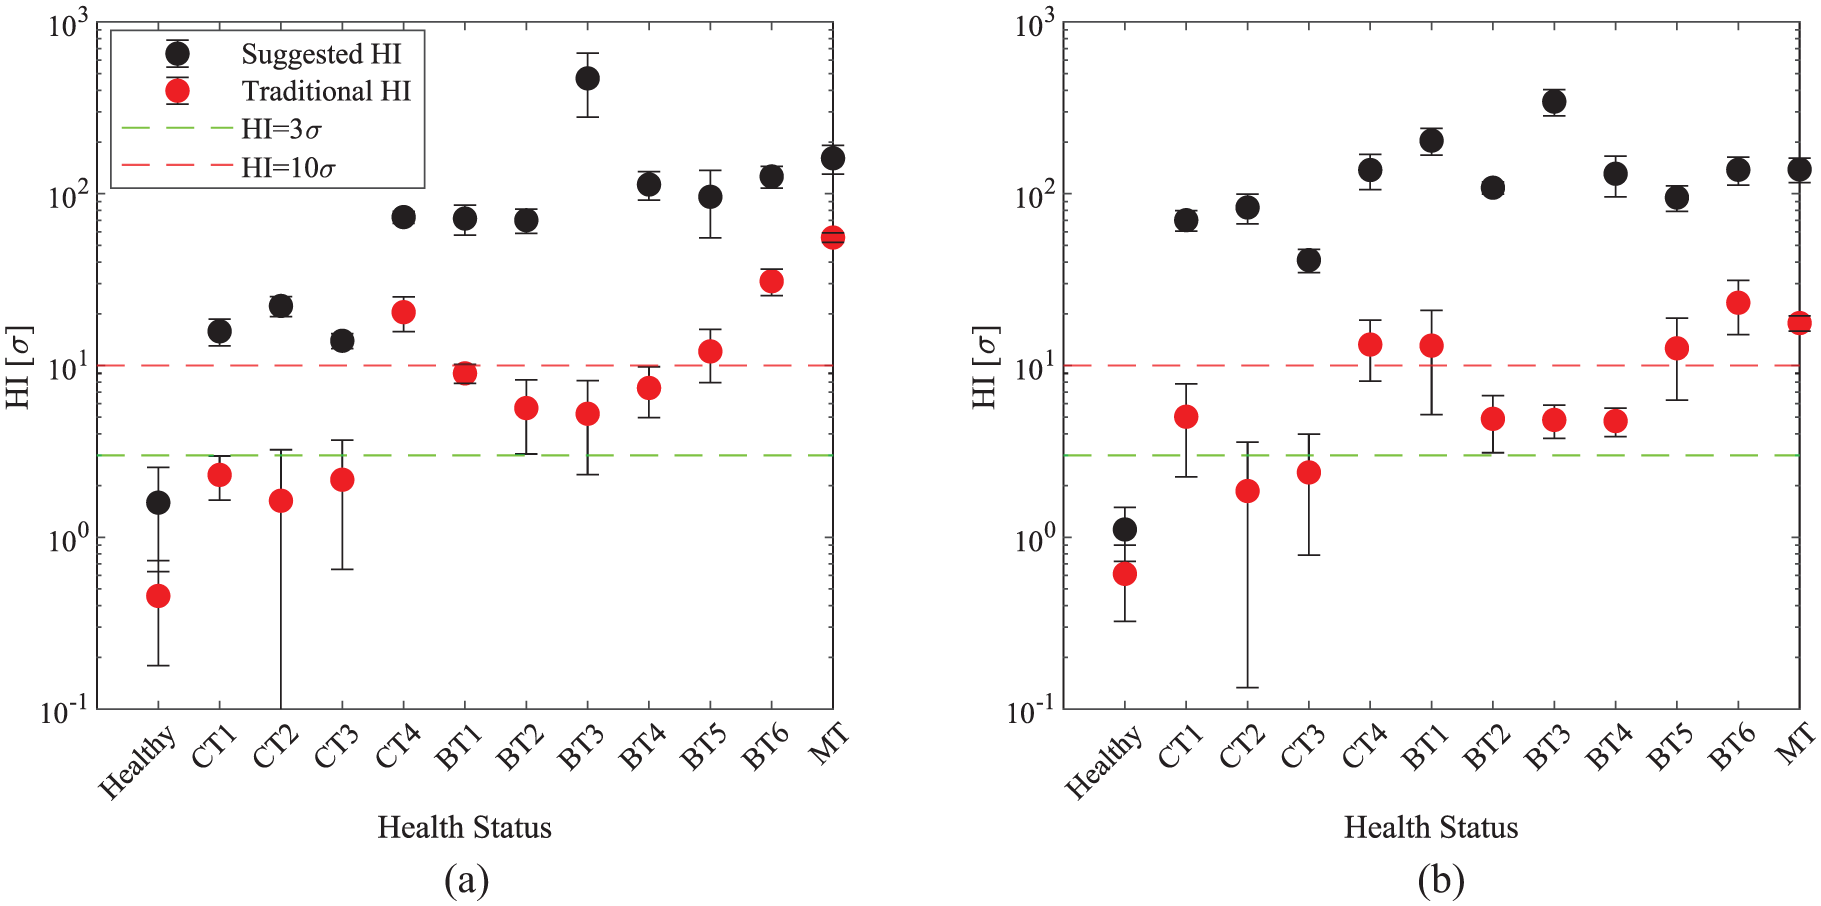
Performance of the suggested HI versus the traditional HI: (a) 45 rps and (b) 30 rps. Note that the x-axis is logarithmic. HI: health indicator.
As shown in Figure 11, the proposed HI demonstrates significantly superior detection capabilities compared to the traditional HI consistently across fault severity and rotational speed. The traditional HI struggles to detect most of the CT faults, whereas the proposed HI identifies them clearly and more significantly, with standardized HI values exceeding 10σ at 45 rps and even 100σ at 30 rps. Furthermore, for some of the allegedly larger faults, such as BT1 through BT3, where the proposed HI reaches maximum values, the traditional algorithm performs poorly. The results illustrate the superiority of the proposed HI, which extracts sensitive features based on energy variations, over the traditional HI, which relies on both energy-based and shape-based features extracted from the entire difference signal and its envelope. These traditional features not only may fail to provide useful information for detecting incipient faults, but can also obscure the weak patterns they generate.
Summary
Helical gears offer significant advantages in operational smoothness and efficiency compared to spur gears, but they present challenges for fault detection due to their quieter and more complex vibration signals. This study addressed these challenges, making two key contributions. First, we introduce a novel modeling approach for localized tooth breakage faults in helical gears utilizing the multi-slice method to account for the three-dimensional, time-variant contact line. We validated this approach experimentally through extensive controlled-degradation tests on helical gears, including tests on healthy gears and 11 different severities of localized tooth breakage faults. This validation relied on a trend analysis of common condition indicators for gears and a qualitative comparison in the SA domain. The dynamic model enables a comprehensive investigation of how tooth breakage affects time-variant GMS. Our work is novel as we refute the premise that fault severity necessarily correlates with the size of the damaged region or the number of tooth pairs intersecting the pressure line. Instead, we explain and justify the relationship between fault geometry and dynamic behavior, where the contact length and the angle of the fault play a pivotal role. Second, we proposed a novel, sensitive HI for early detection of localized tooth breakage faults in helical gears based on advanced feature extraction and engineering techniques. Traditional fault detection methods, often designed for spur gears, extract features from the entire SA and rely heavily on energetic impulsive responses, which are less evident in helical gears or tend to be obscured by other noise sources as the physical investigation concludes. The proposed novel HI augments traditional feature extraction by selectively segmenting the spectrum and extracting solely energy-based features to address the challenge of weak fault manifestations. We evaluated the proposed HI using data from controlled-degradation tests, demonstrating its superiority over traditional methods, not only in detecting incipient faults, but also in monitoring faults in more advanced stages. This work addressed the complexities of monitoring helical gears and laid the groundwork for future research. Future work could focus on three key directions: (1) further exploring the relationship between fault geometry and the dynamic response to enhance fault severity estimation; (2) extending the dynamic modeling framework, along with experimental validation, to investigate other common gear fault types such as pitting and wear; and (3) validating and improving the proposed HI to ensure its sensitivity and robustness in detecting these additional fault types. These efforts will contribute to a more comprehensive and reliable fault diagnosis strategy for helical gears.
Footnotes
Appendix A
Parameters of the simulated helical gear transmission.
| Pinion | Gear | |
|---|---|---|
| Tooth number | ||
| Component mass (kg) | ||
| Transverse moment of inertia (kg·m2) | ||
| Polar moment of inertia (kg·m2) | ||
| Shaft diameter (m) | ||
| Shaft length (m) | ||
| Module (mm) | ||
| Tooth width (mm) |
|
|
| Pressure angle |
|
|
| Helix angle |
|
|
| Contact ratio ( |
|
|
| Young’s modulus (GPa) |
|
|
| Poisson’s ratio |
|
Acknowledgements
We gratefully acknowledge the invaluable support of the Pearlstone Foundation. Omri Matania is supported by the Adams Fellowships Program of the Israel Academy of Sciences and Humanities.
Declaration of conflicting interests
The authors declared no potential conflicts of interest with respect to the research, authorship, and/or publication of this article.
Funding
The authors received no financial support for the research, authorship, and/or publication of this article.
Declaration of generative AI and AI-assisted technologies in the writing process
During preparation of this work, the authors used ChatGPT 3.5 exclusively to improve readability and language. After using this tool, the authors meticulously reviewed and edited the content as needed, and take full responsibility for the content of the publication.