
Abstract
This study experimentally and numerically explores the effect of initial stresses on the generation of combinational harmonics due to the nonlinear mixing of low-frequency
Introduction
Metallic plate-like structures have been extensively used in different types of high-value engineering assets such as aircraft, warehouses and oil tanks. These high-value assets operate in various environments and are typically subjected to loading cycles with different magnitudes. The service life of structures can be significantly affected by changes in the service environment, such as temperature changes which can be characterized as changes in initial stress. 1 Therefore, it is crucial to monitor such stress changes during operation.
Conventional stress monitoring methods, such as bulk-wave inspection techniques, 2 strain gauges and digital image correlation (DIC) 3 can only monitor a limited area of the structure and often require downtime for instrumentation and access to the critical area of the component. The latter can impose significant costs and reduce the efficiency of the operation.
Over the last decades, guided wave inspection techniques have been widely used in the field of structural health monitoring (SHM) and nondestructive evaluation (NDE). Early studies of guided waves were based on linear features, such as the time of flight (ToF), the amplitudes of reflected and/or transmitted waves from various forms of damage.4–7 However, the linear features of the guided waves have relatively limited sensitivity to microscale defects or material degradation that characterize early-fatigue damage, and they are not sensitive to initial stress 8 or pre-stress.
In recent years, many studies have focused on non-linear guided-wave techniques, which provide an improved sensitivity for detecting and monitoring microscale defects and material degradation characteristic of early stage damage, 9 based on the non-linear features associated with material non-linearities 10 and contact acoustic nonlinearity (CAN). 11 The generation of higher harmonics is one of the most commonly used non-linear features.12,13 However, one of thottlenecks that limits the practical implementation of higher harmonics is the influence of unavoidable non-damage-induced non-linearities, such as instrumentation non-linearity and background noise. In addition, imperfect contact between the actuating/receiving transducer and the specimen could also contribute to a certain level of non-linearities due to CAN. 14 Distinguishing unavoidable non-damage-induced non-linearities from damage-induced nonlinearities is necessary in practical applications, but this is very challenging.
To address the limitation of higher harmonics generation, the generation of combinational harmonics due to ultrasonic wave mixing phenomenon has attracted significant research interest, which is immune to non-damage induced non-linearities. Li et al. 15 investigated the effect of synchronism on the combinational harmonic generation associated with two collinear Lamb waves mixing. Hasanian and Lissenden 16 studied the condition of internal resonance of the mixing of ultrasonic-guided waves in a plate. Compared with non-collinear and counter propagating guided wave mixing techniques, collinear-guided wave mixing technique provides a relatively large size of mixing zone, which is beneficial for defects detection/monitoring in a large-scale area. On the other hand, combinational harmonics have been used to assess different types of defects, such as low-speed impact damage, 17 localized material degradation, 18 fatigue cracks,19,20 delamination21,22 and debonding. 23 Hughes et al. 24 investigated wave mixing of edge-guided waves, and found that the amplitudes of the second harmonics are small when excited as part of a dual-frequency input, relative to separate single-frequency inputs, suggesting that energy is being transferred to the combination harmonic frequency. They also found that the amplitude of the sum frequency combinational harmonic exhibited the clearest trend of a linear increase with propagation distance compared with the second harmonics and difference frequency combinational harmonic, thereby indicating a key advantage of wave mixing for measurement of material nonlinearity.
The present work aims to investigate the effect of uniaxial and biaxial prestress on combinational harmonics arising from the non-linear mixing of Lamb waves due to dual frequency inputs. In contrast, most recent studies on the effect of stress on non-linear responses of guided waves have mainly focused on the second harmonic,25–27 while the research on combinational harmonics 28 remains limited. The objective of the present work is to assess the performance of the sum combinational harmonic generated by Lamb-wave mixing to monitor the stress state in plate-like structures. This study will include a comparison with the measured results based on the acoustoelastic effect, which was investigated for stress monitoring in the literature.29,30 The outcomes of the current study can be very helpful for improving the accuracy of current and future SHM systems.
The article is structured as follows: Section ‘Theoretical background’ summarizes some analytical results for bulk-wave mixing in the presence of prestress based on a 5-constant hyperelastic constitutive equation derived from Murnaghan’s strain energy function. These results provide a benchmark for validating the computational procedure employed later, as well as providing a guide to what can be expected for Lamb wave mixing in the presence of initial stress, for which analytical results are not currently available. An experimental study employing a uniaxial tensile stress is presented in section ‘Experimental evaluation’, and a computational study of Lamb wave mixing in the presence of a biaxial prestress is presented in section ‘Numerical case study’. Finally, the findings and conclusions of this study are summarized in section ‘Discussion and conclusions’.
Theoretical background
This section presents analytical results for bulk-wave mixing in a prestressed medium, including the associated change in wave speed and the relative non-linearity parameter
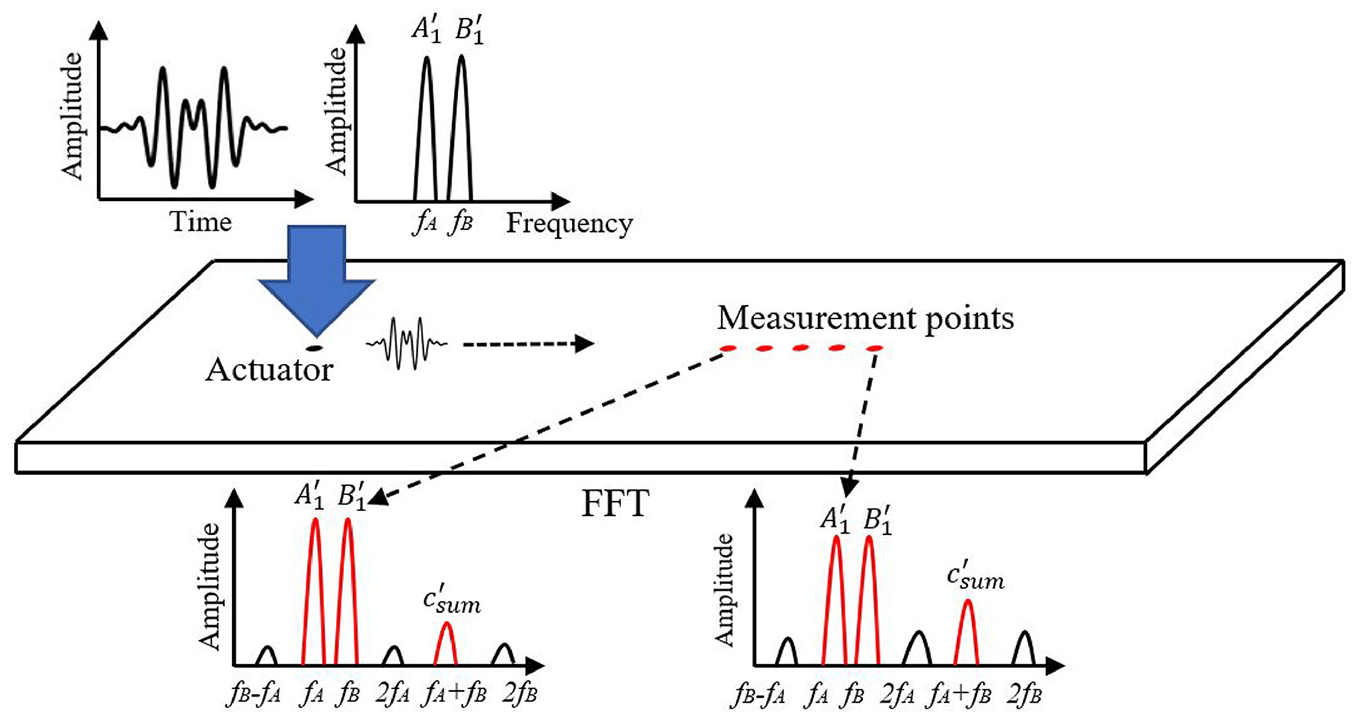
Schematic of generation of combinational harmonics due to ultrasonic waves mixing.
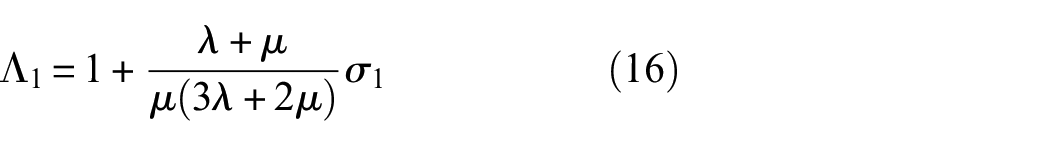
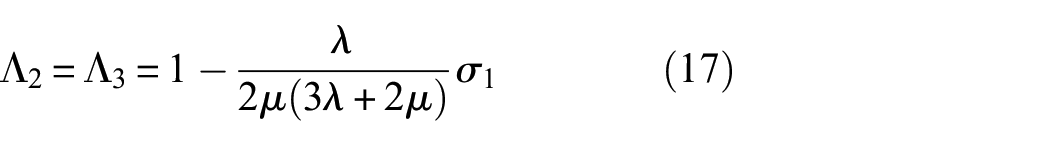
The relative non-linearity parameter
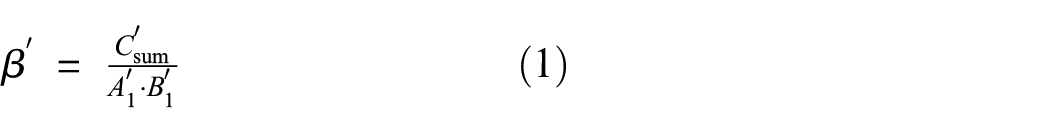
where
Equation of motion
The deformation of a material is described by the deformation gradient tensor
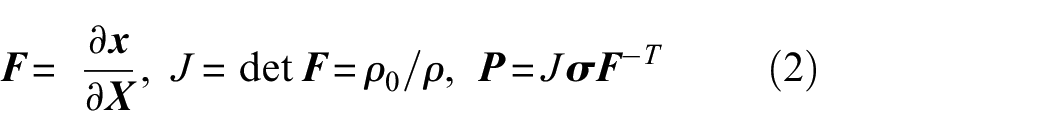
where
In the presence of an initial stress, the total deformation experienced by the material can be regarded as a combination of individual deformations.
33
We can consider a material that first undergoes a deformation described by the tensor

Using Equation (3), the Piola–Kirchhoff stress referred to the basis of the initially stressed state, denoted

The equation of motion (without body forces) relative to the initially stressed state is
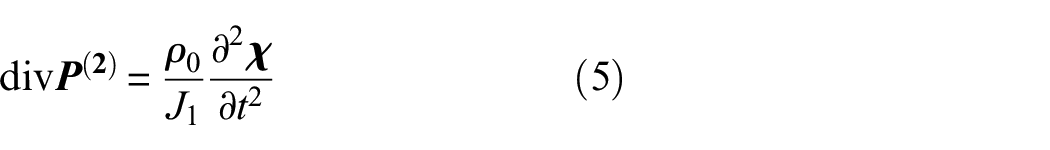
where
Non-linear wave propagation in initially stressed media
If the initial stress is uniform, the right stretch tensor

This diagonal form indicates that the deformation is aligned with the principal axes, and there is no shear component in the initial stress state. A longitudinal plane wave is subsequently imposed upon this prestressed medium. The associated deformation is a one-dimensional (1D) motion

with all other components zero and where
A hyperelastic material characterized by the Murnaghan strain energy function can be written as
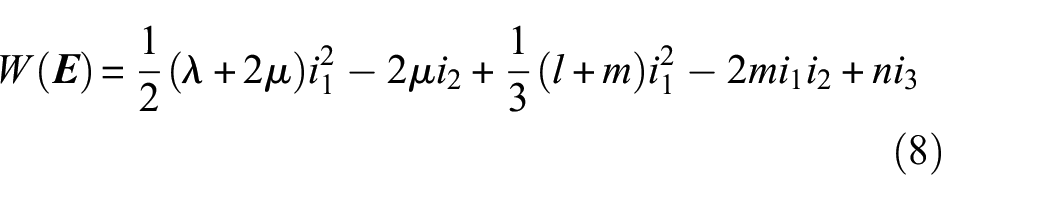
where
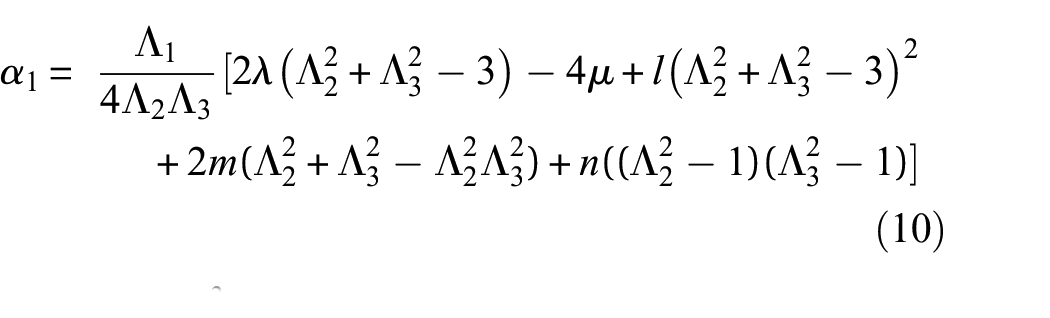
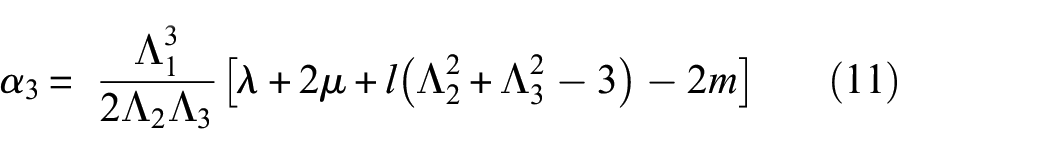
where the coefficients
Acoustoelastic effect on wave speed
Considering the first-order displacement consisting of a mixed wave containing the two frequencies
Undertaking a regular perturbation analysis based on the parameter
If there is no pre-stretch,
Substituting Equation (15) into Equation (14), the first-order estimate for the wave speed c is presented as
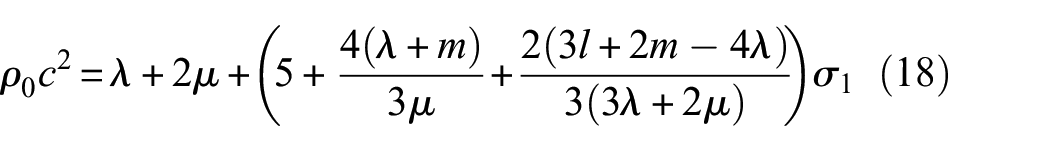
It agrees with the corresponding results in Destrade and Ogden
34
though the results in that work were presented in terms of the density in the initially stressed state
Change of material non-linearity induced byprestress
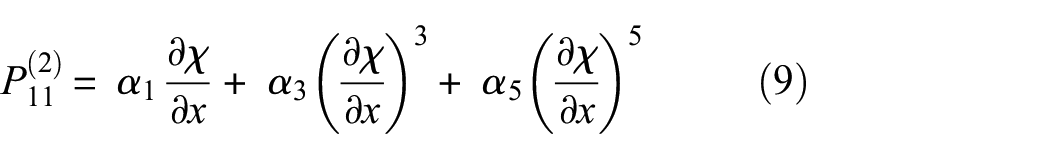
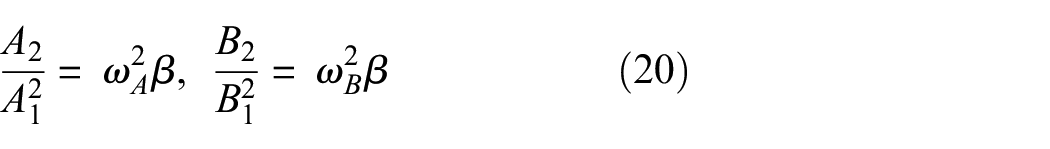
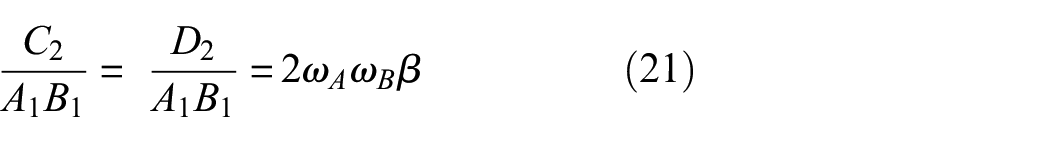
Continuing with the analysis of wave mixing as defined in Equation (14), the second-order terms in Equation (13) allow the determination of the displacement amplitude of the second harmonic component
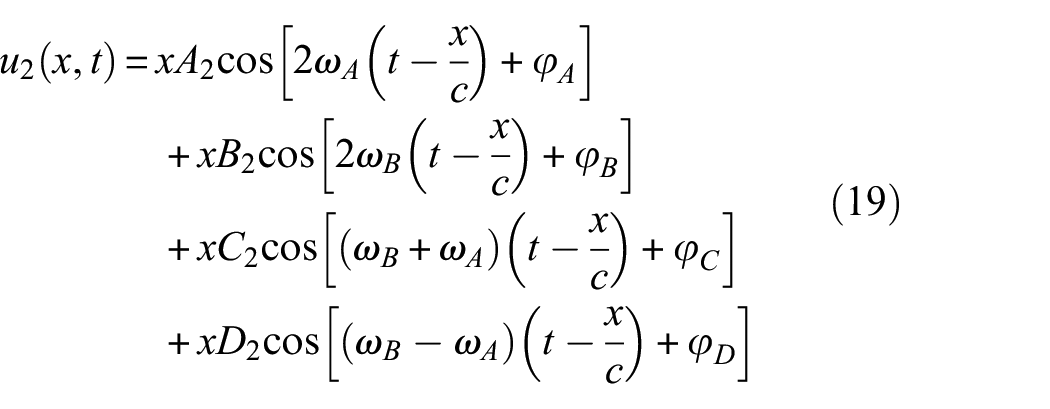
where


where the non-linearity parameter
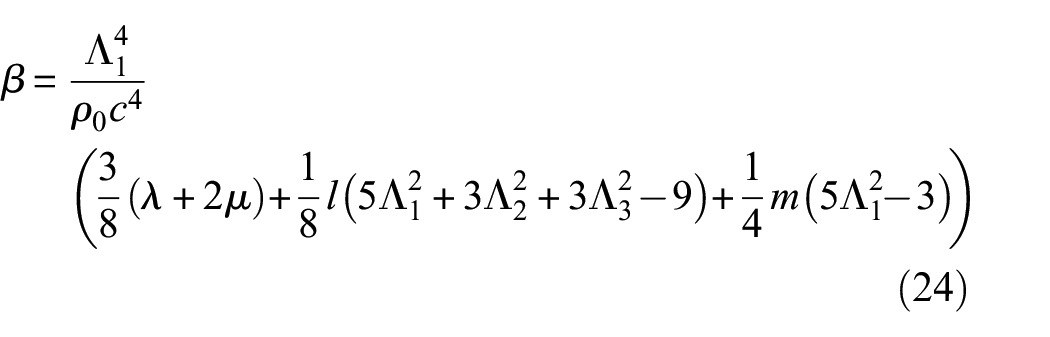
with the wave speed
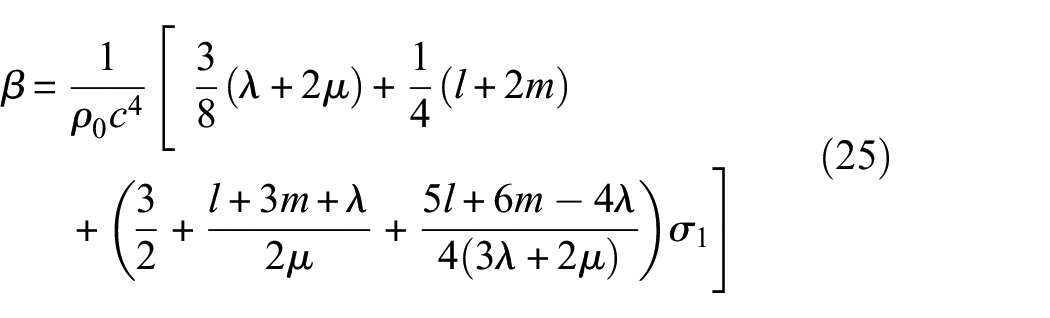
If
The parameter
Experimental evaluation
This section describes the procedures and details of the experimental study of stress effects on combinational harmonic generation and discuss the main findings from the experimental study.
Uniaxial tension test
A dogbone-shaped plate-like specimen was subjected to a uniaxial tensile prestress in an electrohydraulic testing machine (INSTRON 1342) as illustrated in Figure 2(a). The specimen was made from a 1.6 mm thick aluminium alloy (7075-T651) plate, with an elastic modulus of 70.76 GPa. The in-plane dimensions of the specimen are
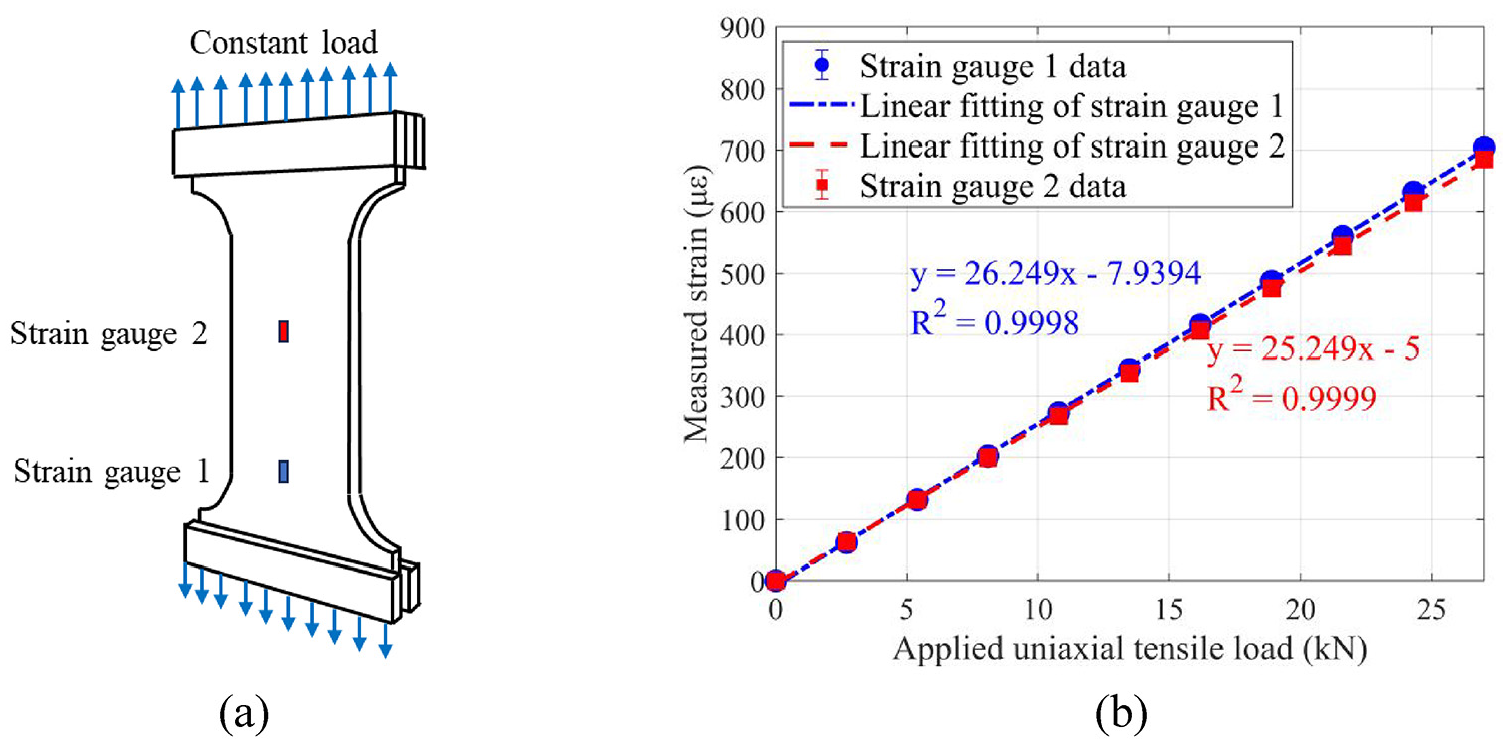
(a) Schematic of strain gauge location and (b) applied tensile force versus measured strain in the proposed excitation and measurement area for ultrasonic testing.
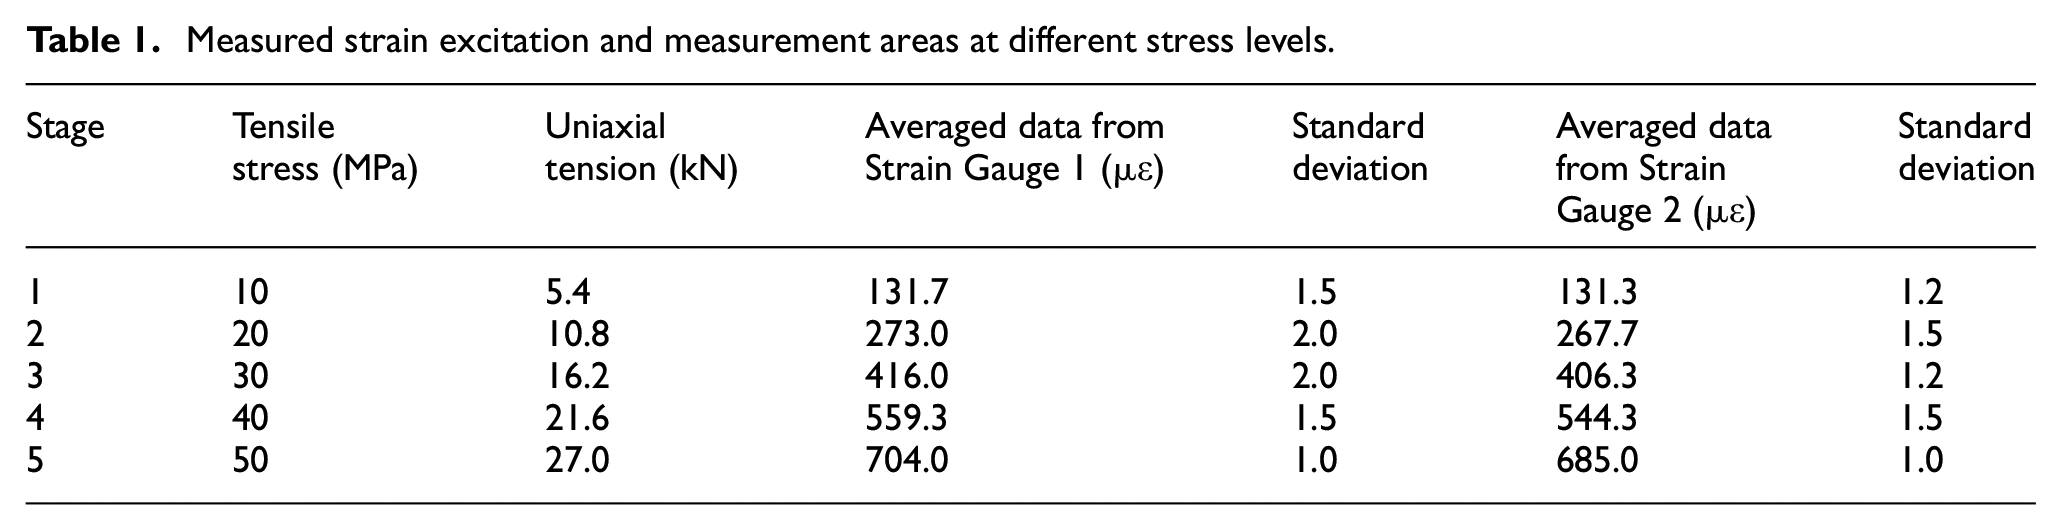
Measured strain excitation and measurement areas at different stress levels.
Actuating and measuring Lamb waves
Figure 3 schematically shows the experimental setup for actuating and measuring Lamb waves. First, a signal generator (National Instrument PXle-5412) was used to generate the Hann-windowed input tone-bursts. The choice of centre frequencies and number of cycles for these tone bursts are discussed in the next subsection. The tone-burst signal was amplified by a signal amplifier (Ciprian HVA-800-A). Next, the amplified signal was sent to a piezoceramic transducer (PZT) (Ferroperm Pz 27), which was bonded to the surface of the aluminium plate using conductive epoxy.
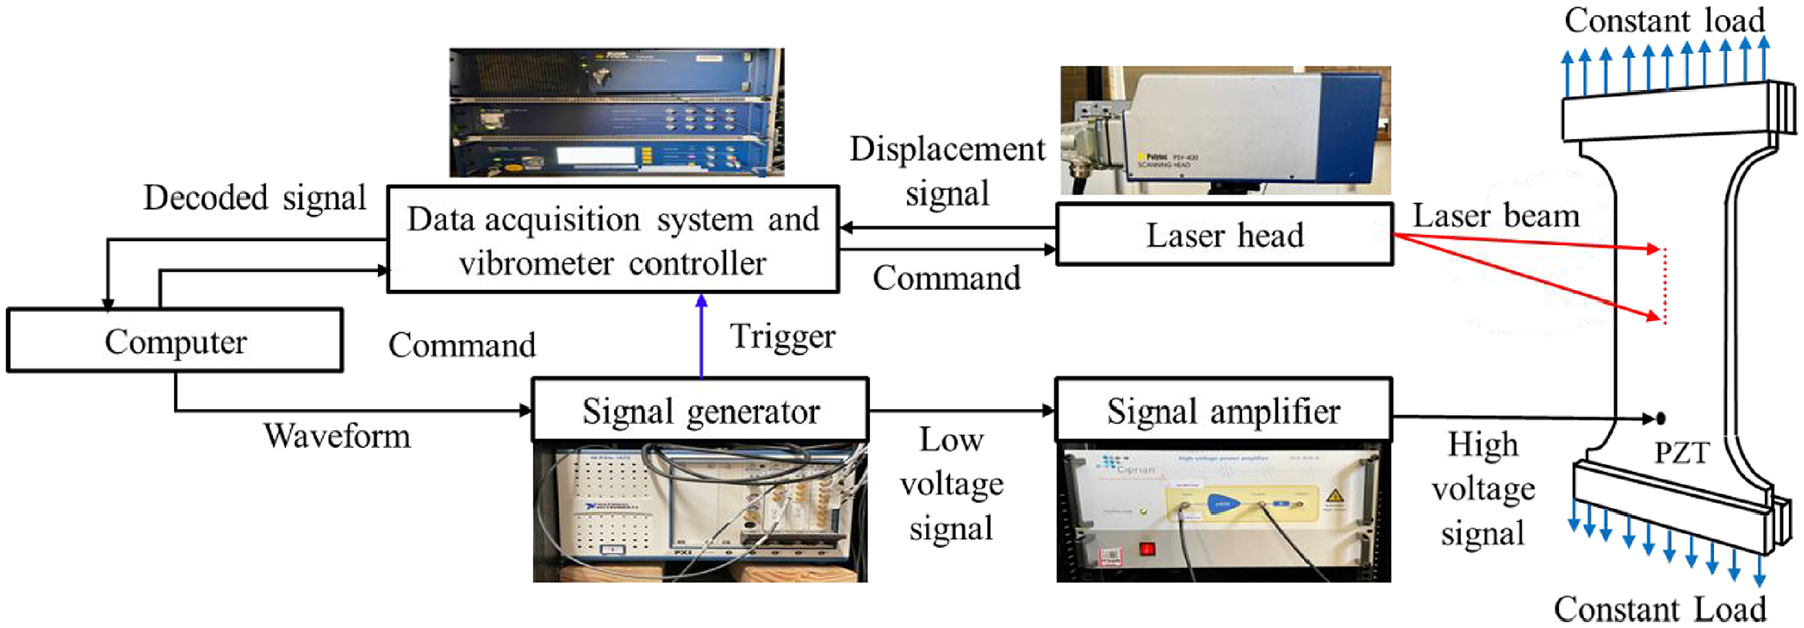
Schematic of the experimental setup for actuating and measuring Lamb waves.
The out-of-plane displacements at the measurement points were measured by a scanning laser Doppler vibrometer (Polytec PSV-400-M2-20) in 1D mode. The measurement distance between the laser head and the specimen was fixed at 1 m. Each measured signal was obtained at a sampling frequency of 25.6 MHz. To improve the accuracy of the measurement, the measured signals were averaged by 500 acquisitions. To enhance the signal-to-noise ratio, the measurement area was polished by sandpaper and then coated with a thin layer of aluminium base coat reflective paint. Furthermore, a low-pass filter with a cut-off frequency of 800 kHz was applied to the measured signals. Figure 4 shows the experimental setup of the specimen under uniaxial tension test.
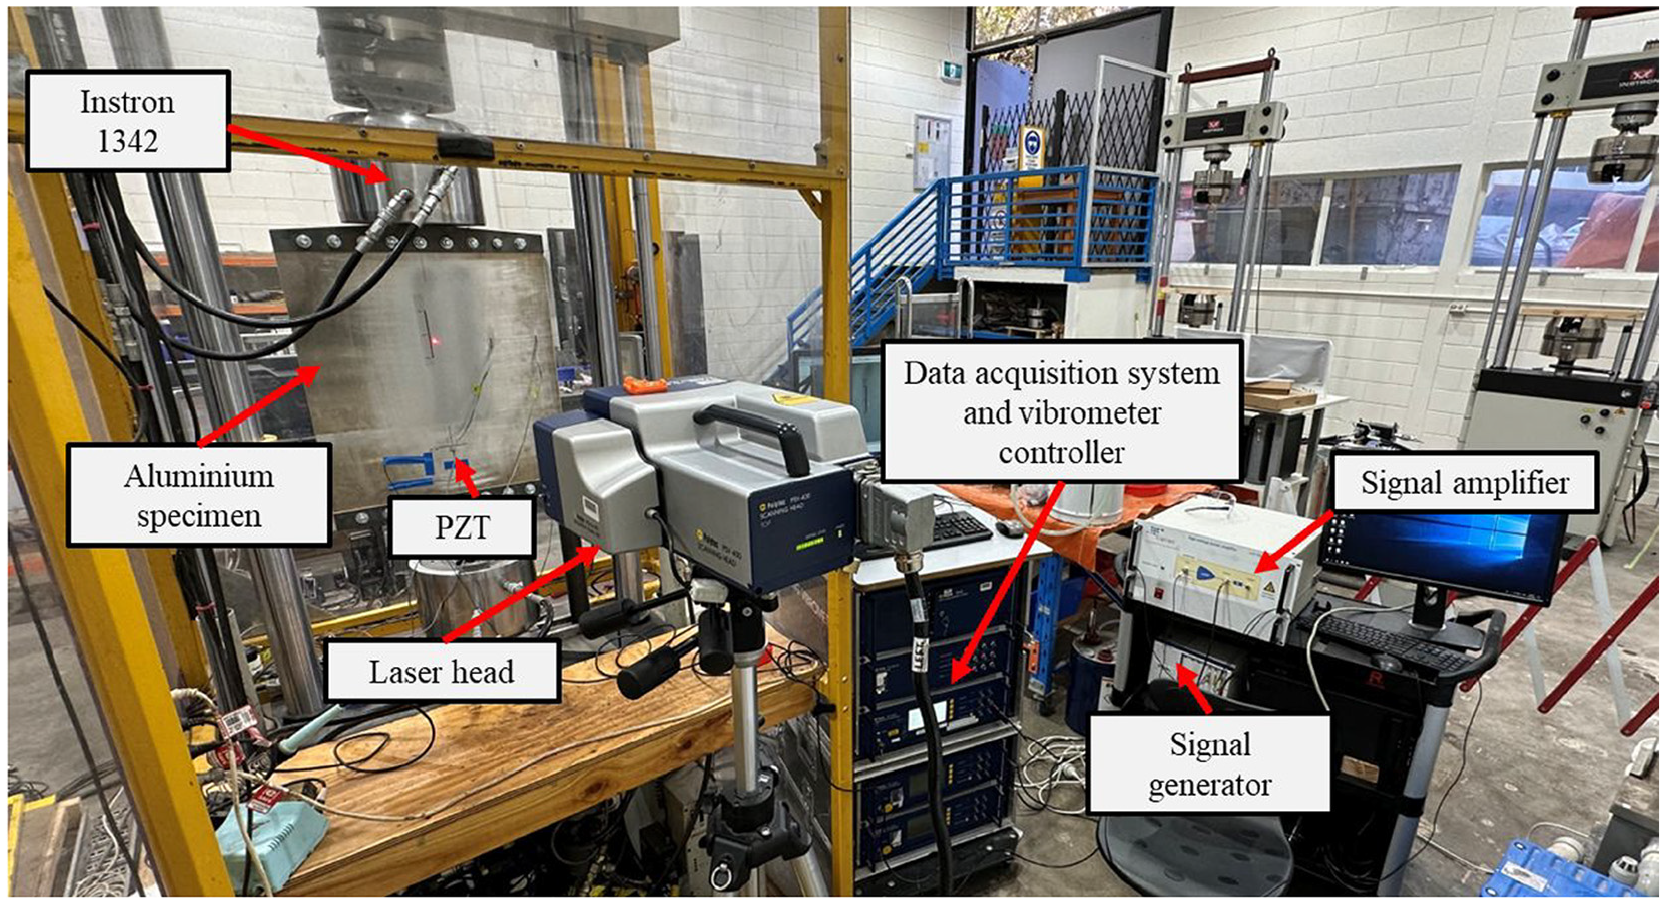
Experimental setup of the specimen under uniaxial tension test.
Determination of Lamb wave mode and input signal
As a basis for selecting a suitable Lamb wave mode for the present investigation, Figure 5(a) and (b) show the phase velocity and group velocity dispersion curves of Lamb waves propagating in a 1.6 mm thick aluminium 7075-T651 plate, respectively.
29
It can be observed that the change of phase and group velocity of fundamental symmetric Lamb wave mode (
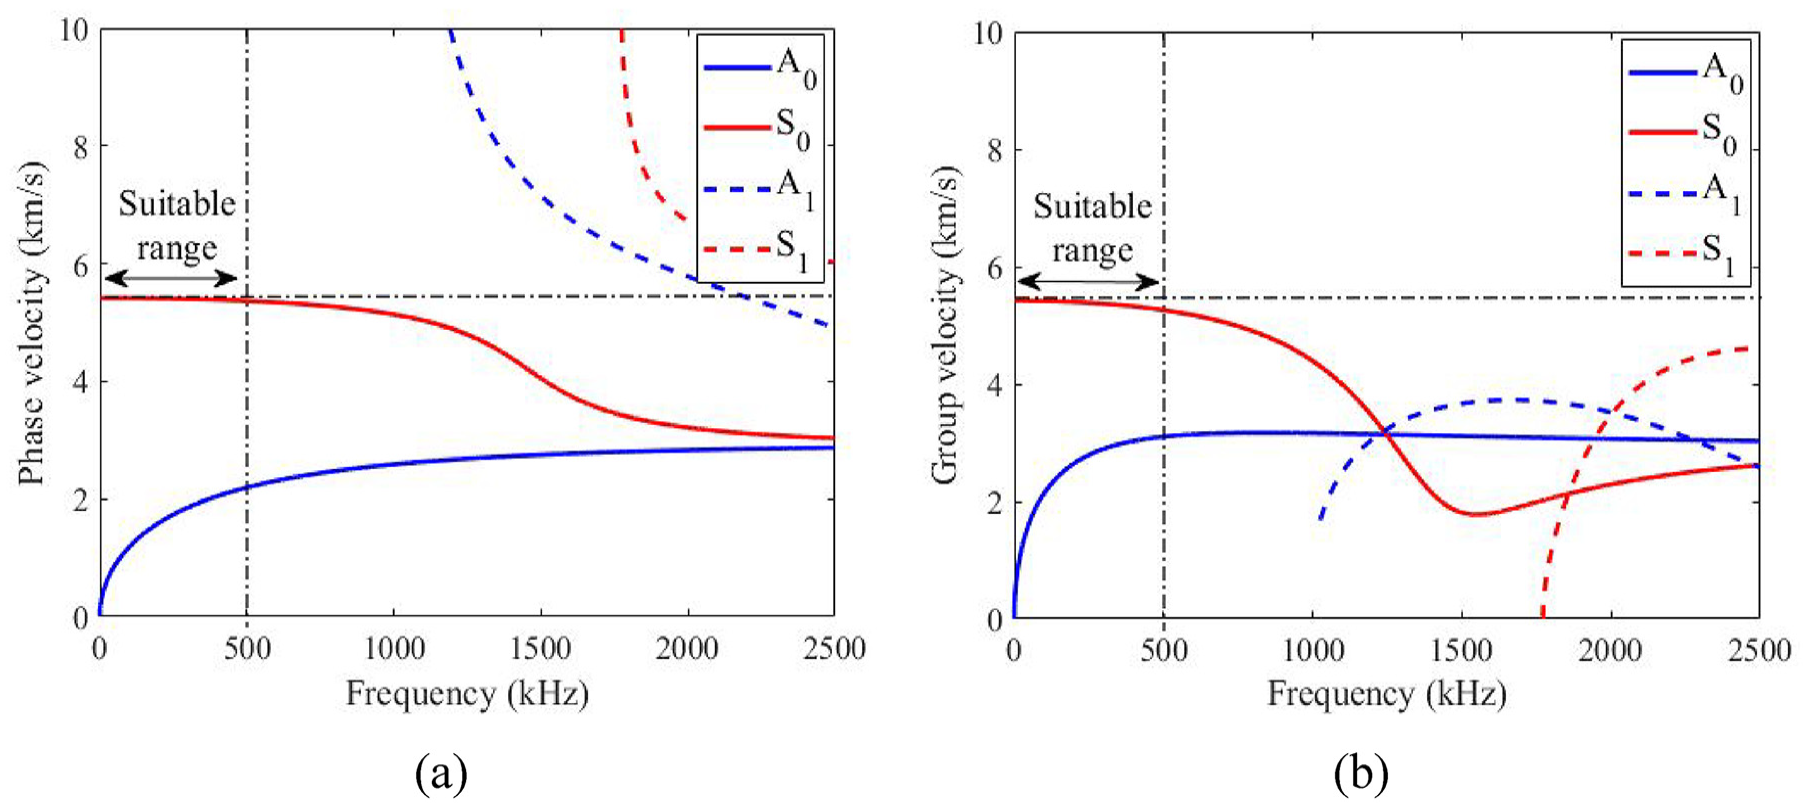
(a) Phase velocity and (b) group velocity dispersion curve of Lamb waves propagation in 1.6 mm thick aluminium 7075-T651.
To select optimized excitation frequencies for the generation of combinational harmonics, a mode tuning experiment was conducted. Six-cycle Hann-windowed tone bursts, with centre frequencies ranging from 150 to 350 kHz in steps of 10 kHz, were generated by a PZT. The excitation voltage was fixed at ±200 V. Figure 6 shows the resulting amplitude of the excited
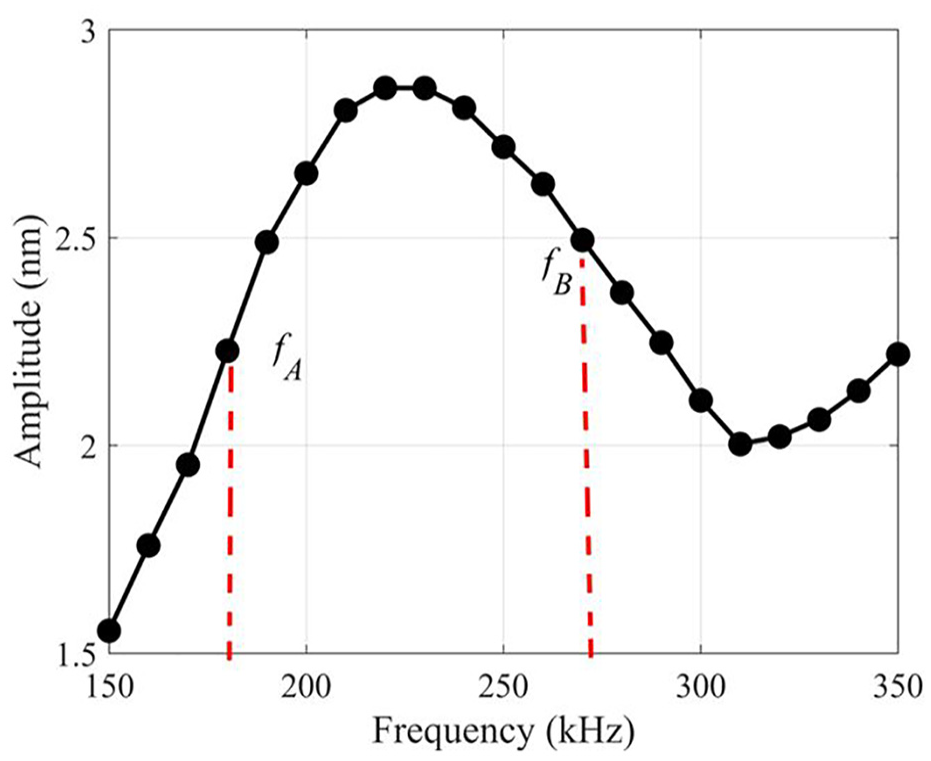
Mode tuning curve of S_0 generated by PZT.
The number of cycles of the two input tone bursts (
When the
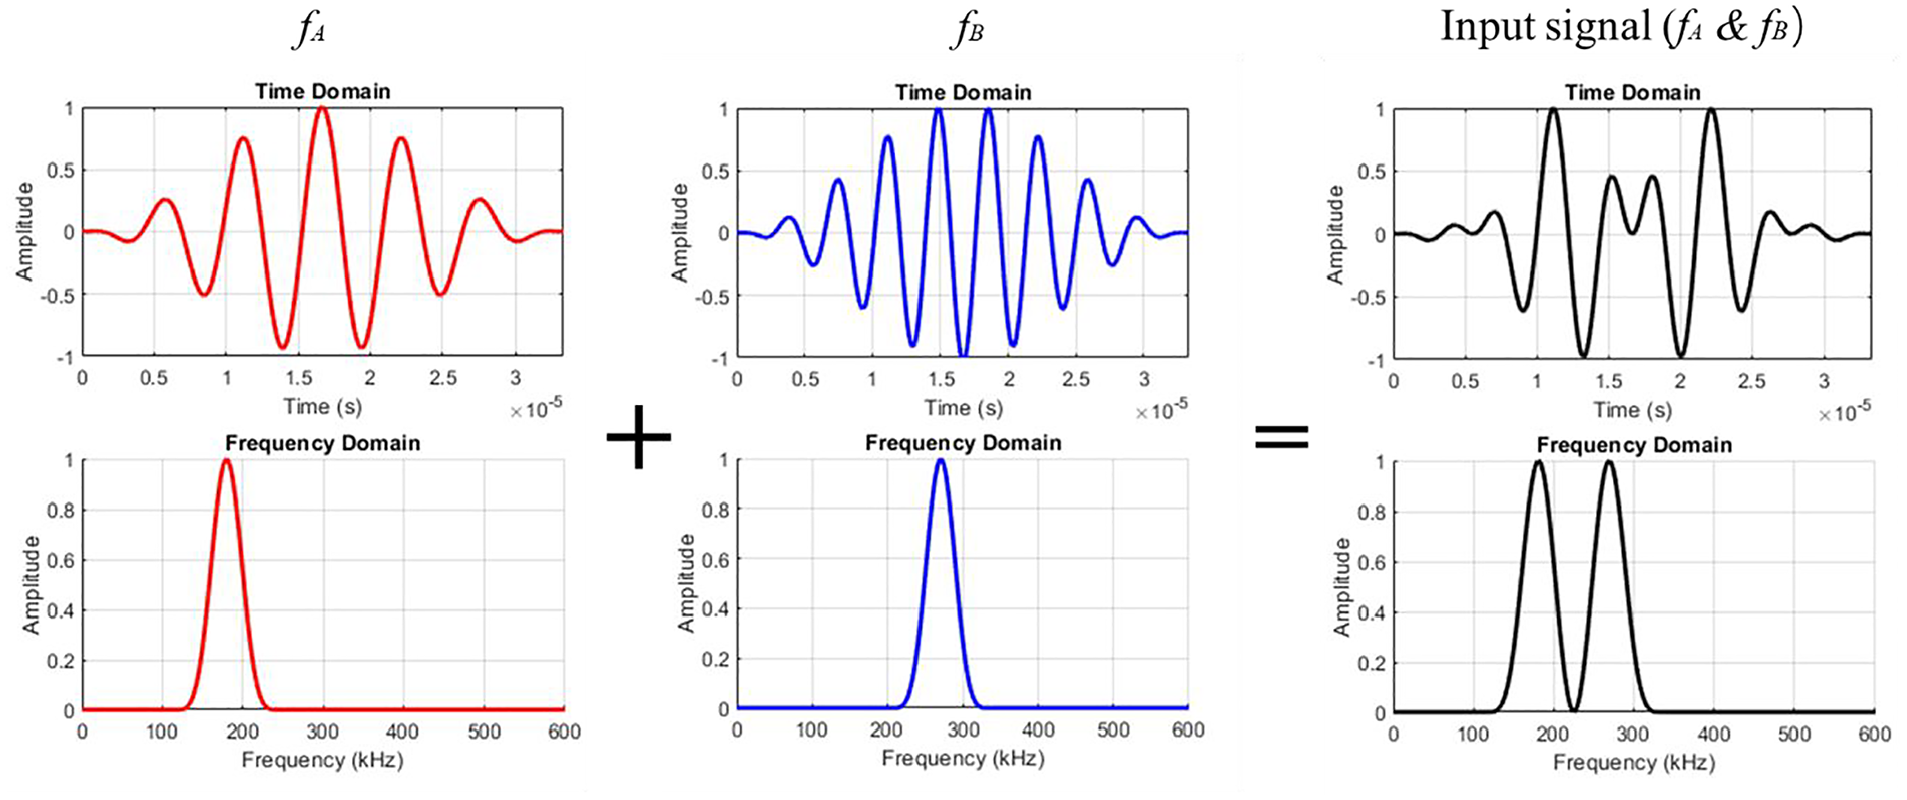
Schematic of the input signal used in this study.
Experimental results of ultrasonic-guided wave testing
Determination of input power and ascertaining the source of non-linear response
In this section, the determination of input power for ultrasonic testing and the evaluation of the source of non-linear responses in the experiment is discussed. To select an optimized input power level, the input signal was tested at voltage levels of 40, 80, 120, 160 and 200 V. The out-of-plane displacement was measured at 200 mm from the edge of the PZT. The amplitude of the combinational harmonic at the sum frequency was found to be linearly proportional to the product of the amplitudes of two fundamental harmonics as illustrated in Figure 8(a). In the subsequent test, the excitation voltage was fixed at 200 V because no obvious errors were observed at this input power level as shown in Figure 8(a) and a high input power is beneficial for enhancing the non-linear response.
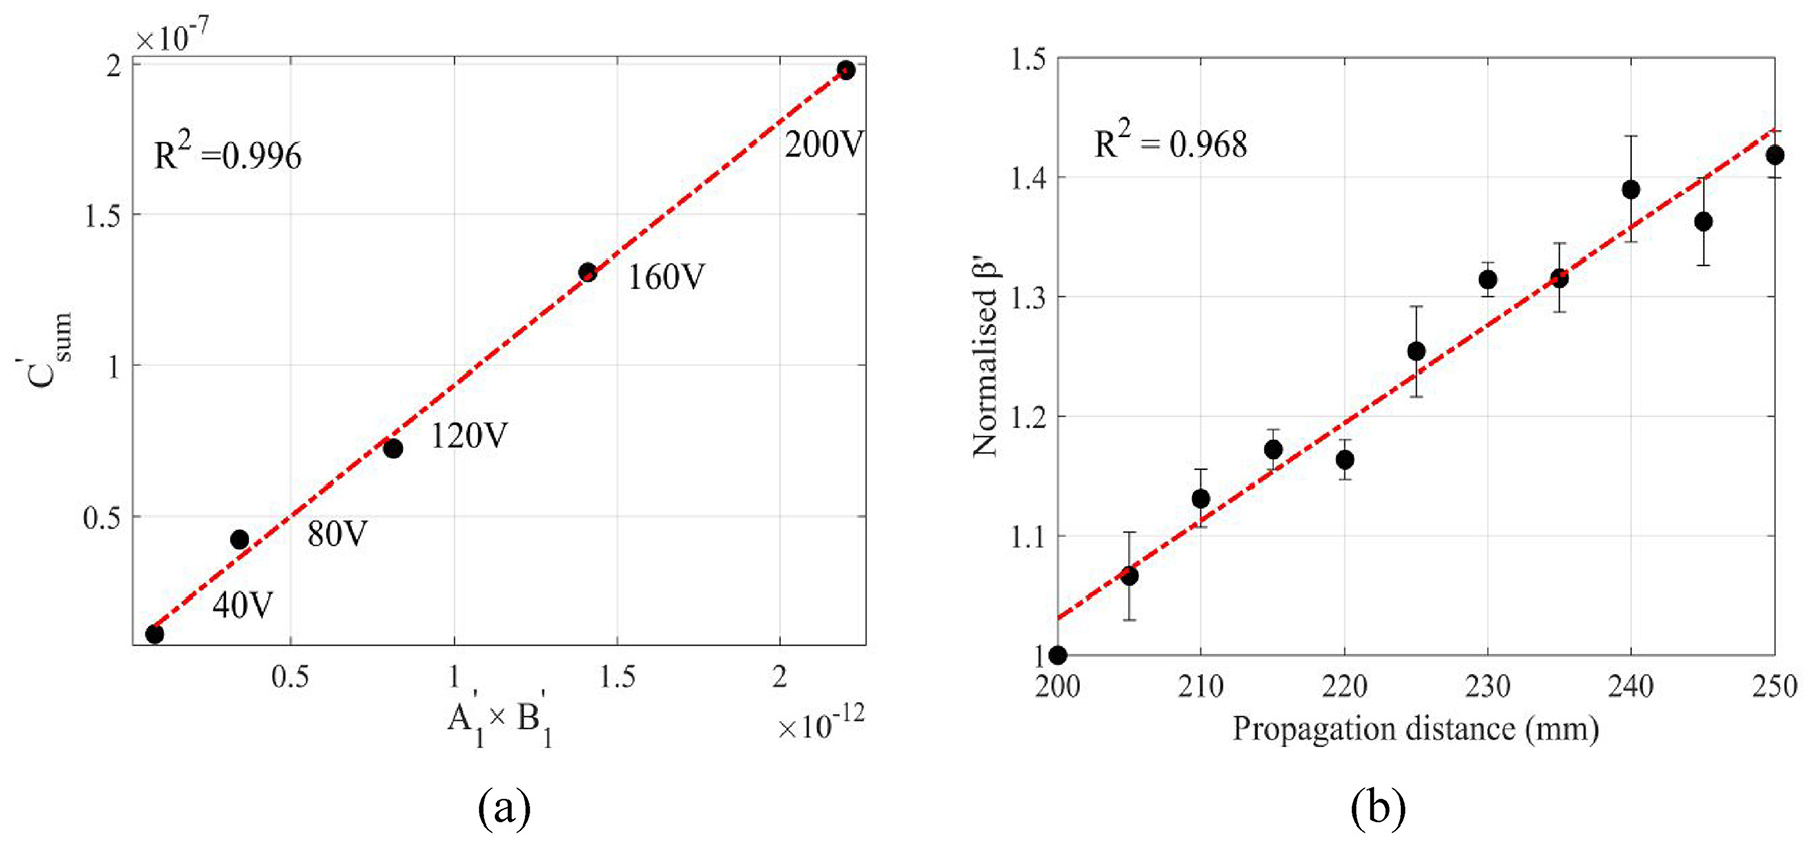
(a) Linear fitting of the amplitude of sum combinational harmonic (
To investigate the relationship between the
Assessment of uniaxial tensile stress using linear and non-linear features of
In this section, the data collected at the measurement point 200 mm away from the edge of the PZT in different uniaxial tensile stresses is discussed. During the assessment, the uniaxial tension provided by INSTRON is based on the results of the uniaxial tension test described in section ‘Uniaxial tension test’. The specimen was loaded from 0 to 50 MPa with 10 MPa intervals. In each stage, four sets of data were collected and then averaged.
Figure 9 presents the measured time-domain out-of-placement displacement signals at different tensile stress levels. It can be observed that both
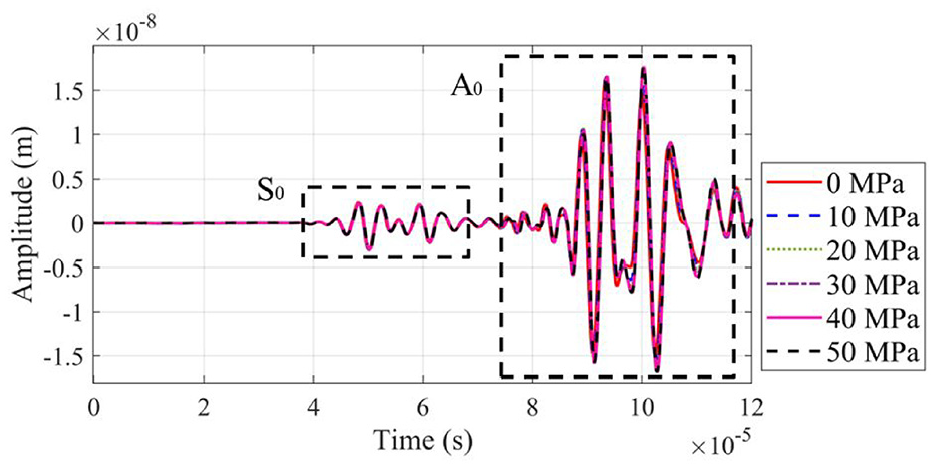
Experimentally measured time domain signals at different tensile stress levels.
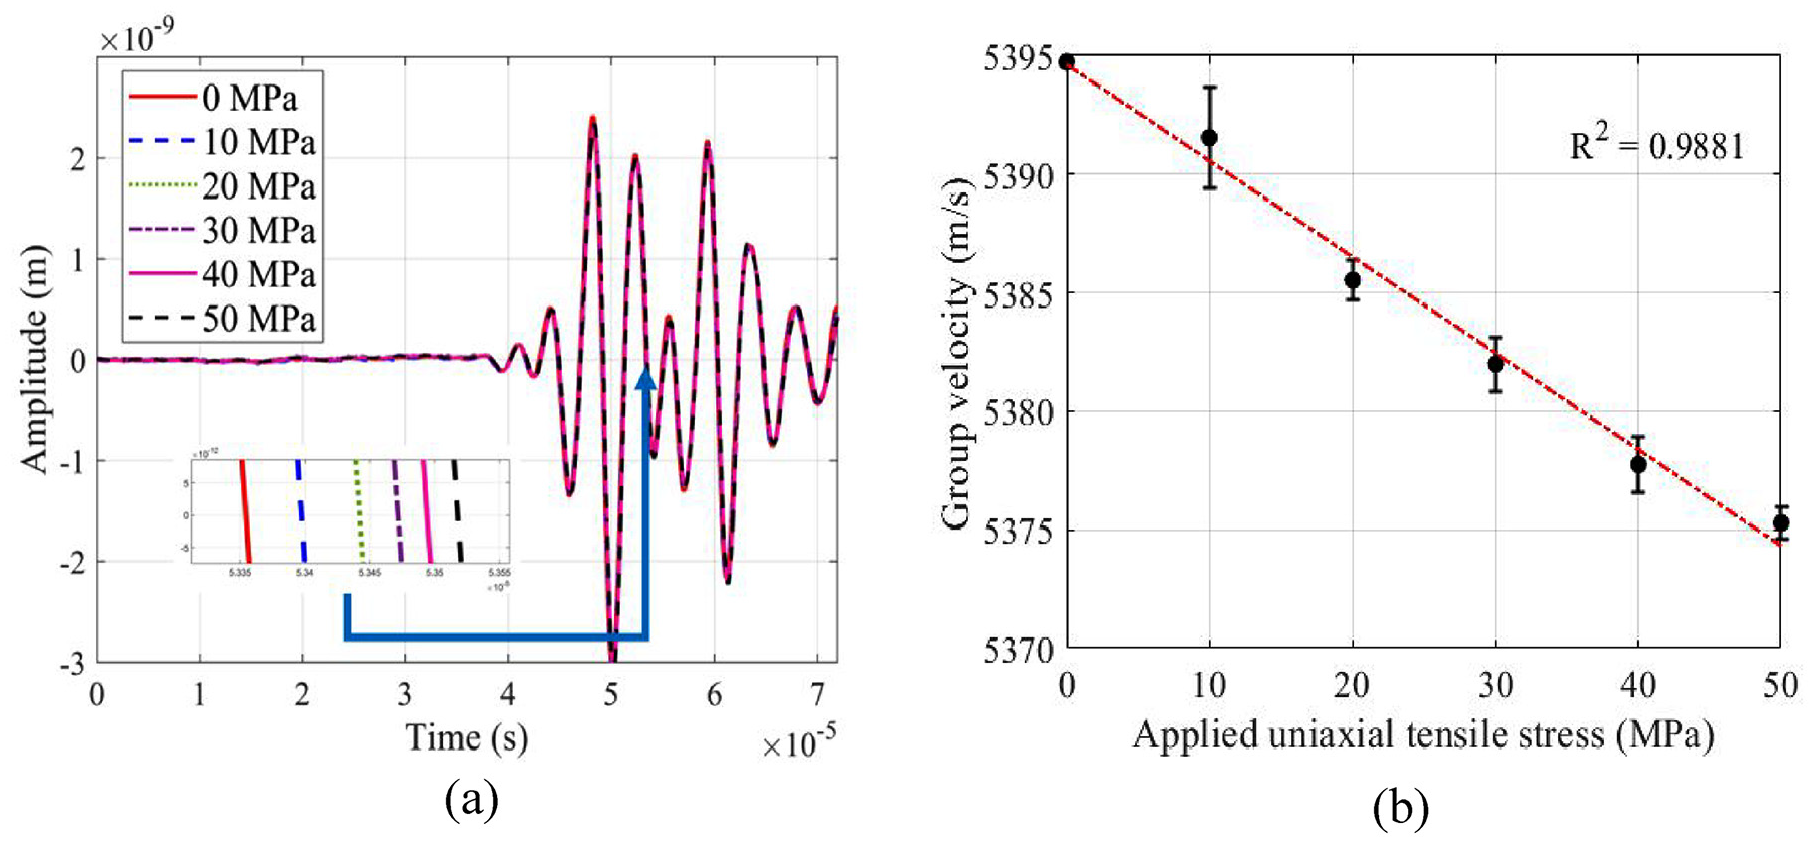
(a) Measured time domain signals of
Figure 11(a) shows the corresponding frequency domain data. In contrast to the acoustoelastic effect, the effect of applied tensile stress on the amplitude of the sum combinational harmonic can be clearly observed in the frequency domain. Figure 11(b) presents the relationship between
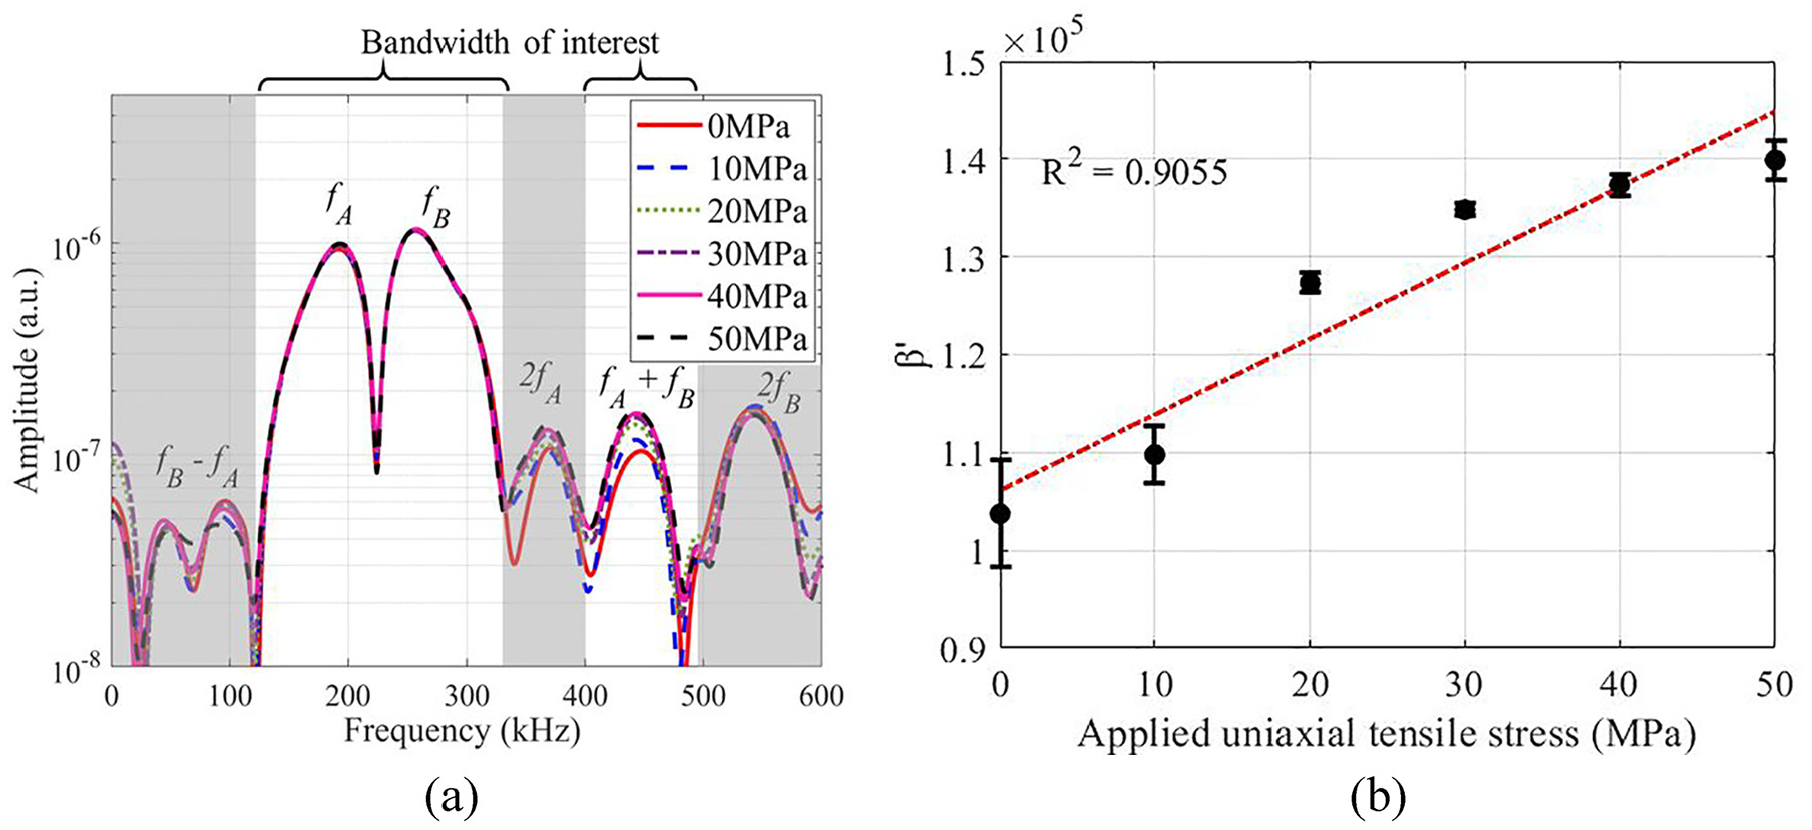
(a) Measured frequency domain signals at different tensile stress levels and (b) relative nonlinearity parameter at a propagation distance of 200 mm versus applied uniaxial tensile stresses.
Numerical case study
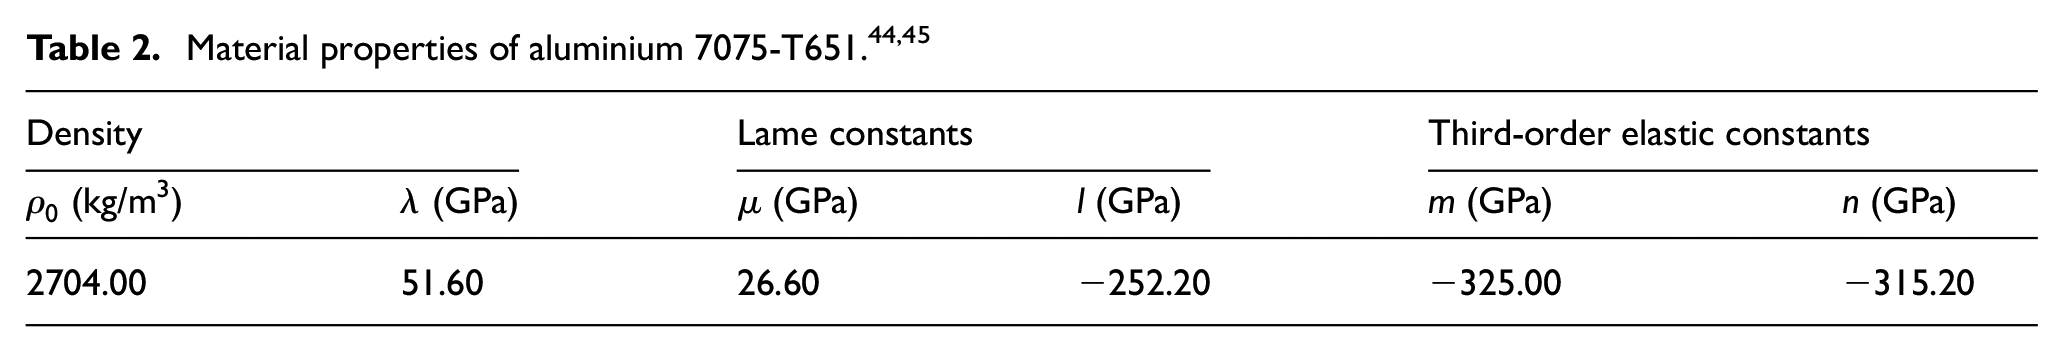
In this section, a two-step procedure is employed for modelling the effect of an initial prestress, coupled with material non-linearity, on (i) wave speed, and (ii) the amplitude of the mixed-frequency non-linear response due to multiple frequency inputs. Material nonlinearity is modelled by a 5-constant hyperelastic constitutive equation with the parameter values listed in Table 2, and it is implemented through a VUMAT subroutine in ABAQUS/Explicit.27,32,43 This two-step FE approach is first investigated for longitudinal bulk-wave motion in section ‘Stress effect on longitudinal-bulk waves mixing’, and the results are compared with the analytical predictions in sections ‘Acoustoelastic effect on wave speed’ and ‘Change of material nonlinearity induced by prestress’ for validation purposes. The same approach is then applied to investigate the effect of a biaxial prestress on
Stress effect on longitudinal-bulk waves mixing
A quasi-1D FE model was first developed for simulating longitudinal bulk wave by applying symmetric boundary conditions (YSYMM,
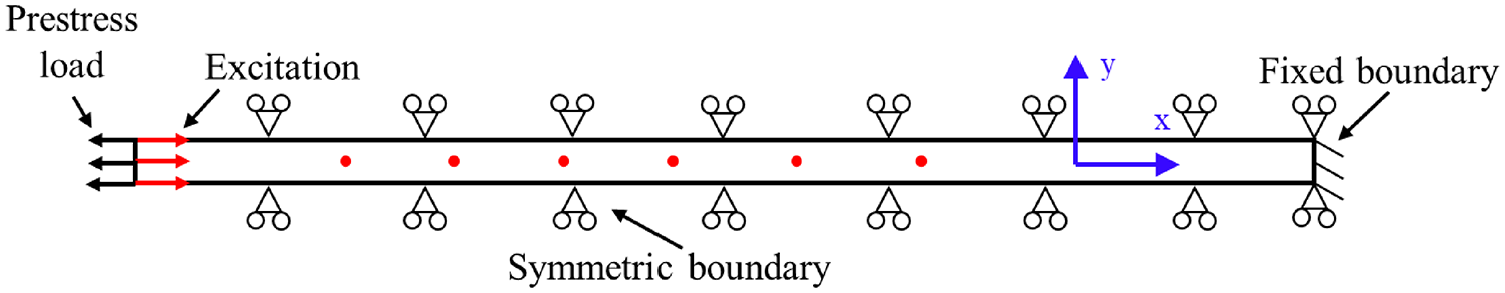
Schematic of FE model for simulating longitudinal bulk wave.
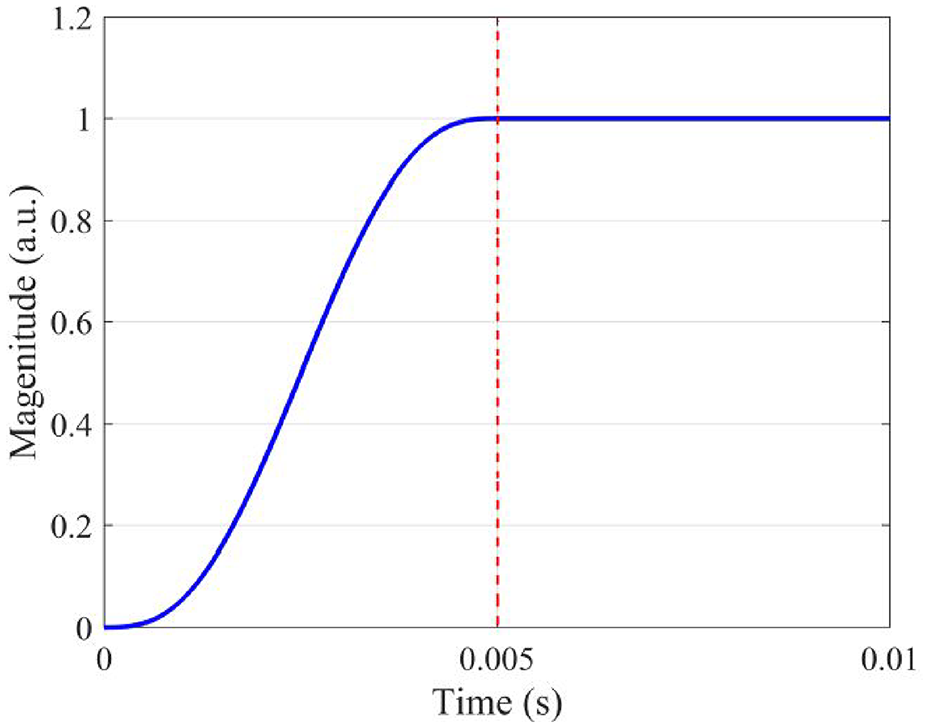
To model pre-stress in the explicit dynamic simulation, the simulation was done in two steps. In Step 1, a quasi-static analysis was employed to model a gradually increasing applied load that reaches a specified plateau value as indicated in Figure 13. This approach minimizes the influence of the transient effect induced by the applied pre-stress.
27
Once the desired pre-stress level was achieved, a longitudinal bulk wave was generated in Step 2 by applying 5 μm displacement (
Quasi-static loading curve in Step 1 (prestress) of the simulation.
The results of FE models with linear and non-linear material properties are compared. The linear FE model accounts only for linear material properties and does not incorporate material nonlinearity characterized by the third-order elastic constants. In contrast, the non-linear FE model includes both linear material properties and the third-order elastic constants, allowing for a more comprehensive analysis. The results of linear and non-linear FE simulations are first compared under the stress-free condition. Data from the first measurement point is used for comparison. Figure 14(a) and (b) compare the linear and non-linear FE results in the time and frequency domain, respectively. In the time domain, no significant difference between linear (red solid line) and nonlinear FE (blue dot-dash line) results can be observed. In the frequency domain, apart from primary excitation frequencies (
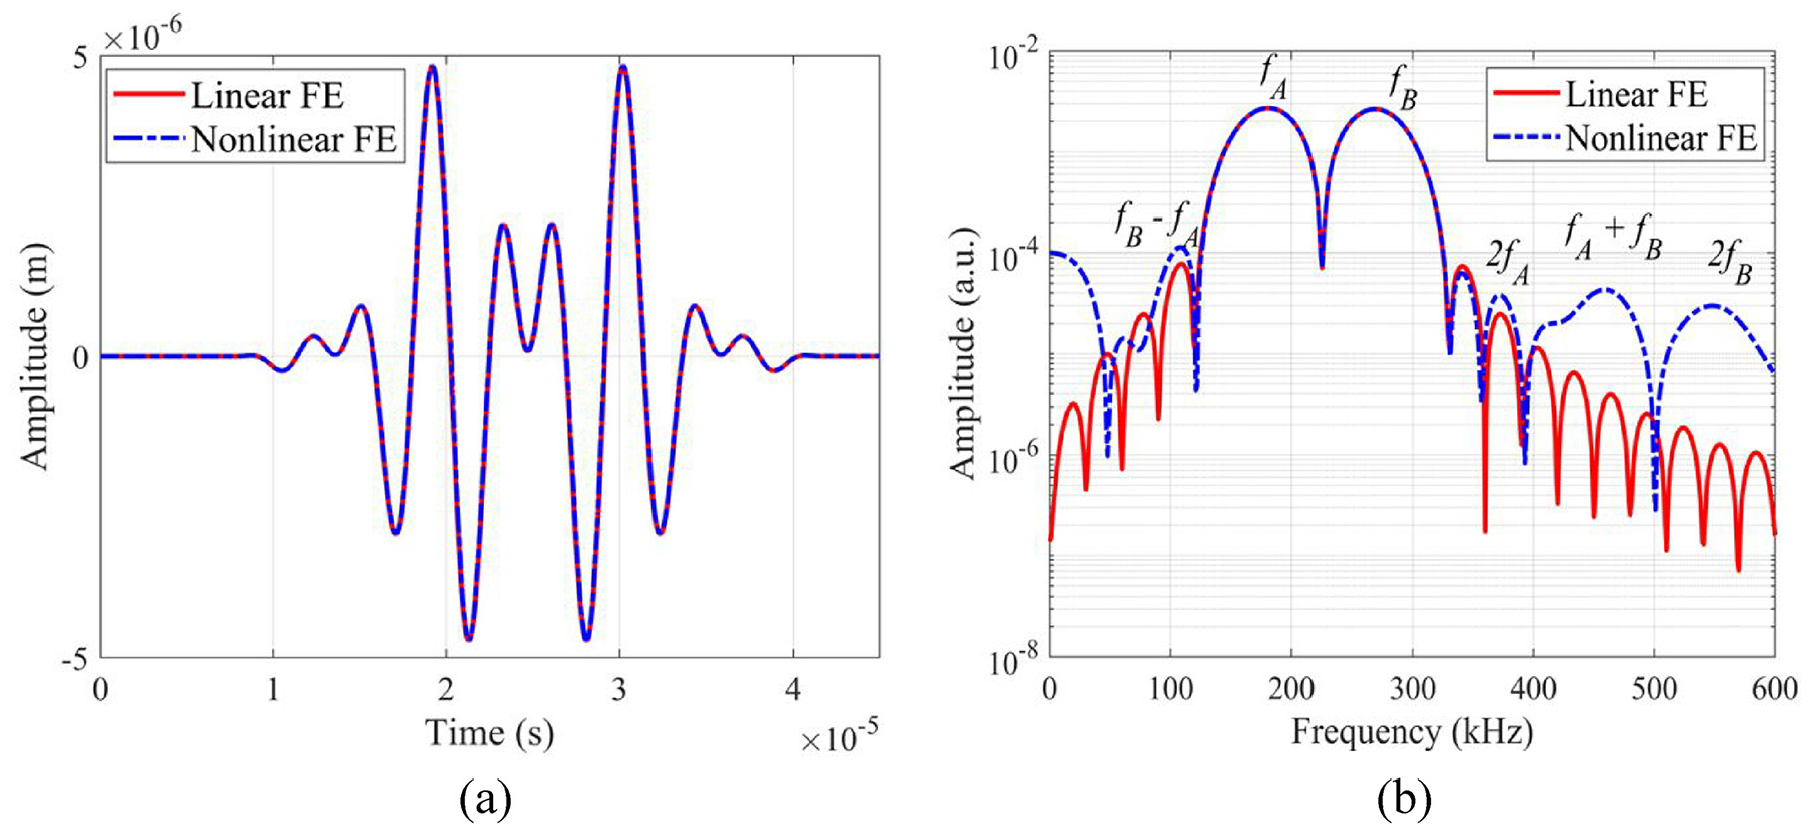
Comparison of linear material and non-linear material properties FE results in (a) time and (b) frequency domain.
Figure 15(a) and (b) present the stress effect on linear and non-linear FE simulated results. The red solid line represents the collected signal in the absence of prestress, while the blue dashed line represents the response in the presence of a 200 MPa uniaxial tensile stress, which is parallel to the wave propagation direction. The phase shift due to the stress effect cannot be observed from the linear FE results as shown in Figure 15(a), confirming that there is no change of wave speed due to a prestress within the framework of linear elasticity. In contrast, compared with the signal collected from the stress-free condition, the phase shift due to the applied prestress can be seen in the longitudinal bulk-wave signal simulated by the nonlinear FE model, which can be observed more clearly in the zoom-in view of Figure 15(b).
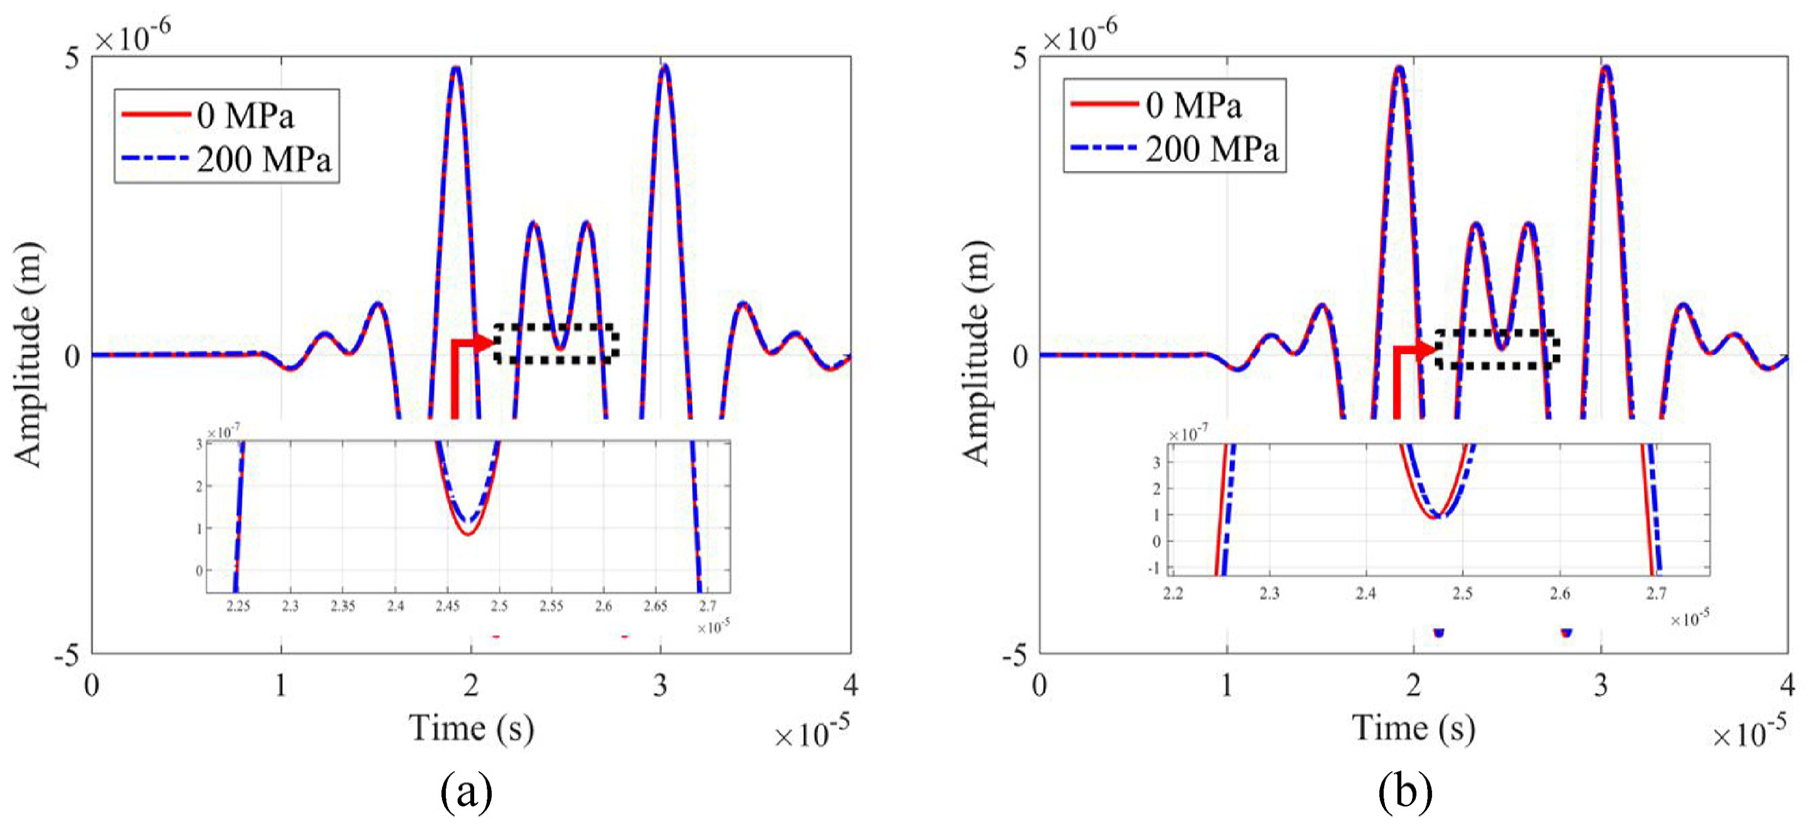
Comparison of time domain signals with and without stress effect simulated by FE model with (a) linear and (b) non-linear material properties.
Figure 16(a) compares the theoretical solution for the wave speed (Equation (14)) with non-linear FE simulation results for various tensile stress levels, whereas Figure 16(b) compares the theoretical non-linearity parameter given by Equation (24) with the non-linear FE simulation results obtained at the first measurement point for various tensile stress levels. It can be observed that the theoretical solution results agree with the non-linear FE predictions. This demonstrates that the effect of prestress on the linear and non-linear features of ultrasonic wave can be successfully simulated by VUMAT with the implementation of Murnaghan’s hyperelastic material model.
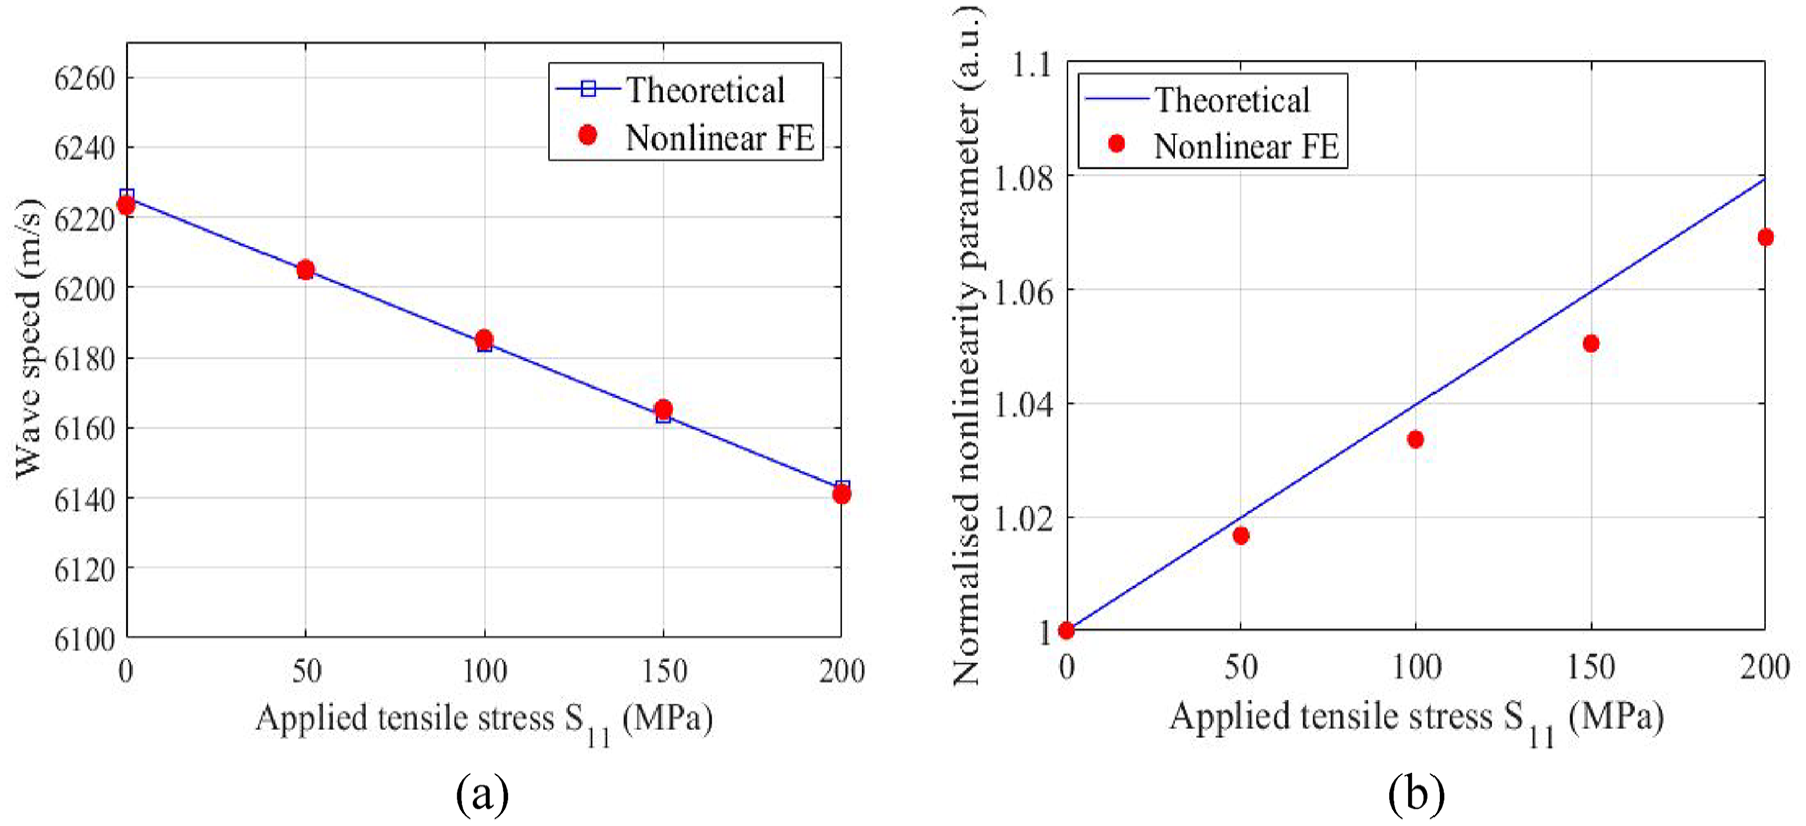
Comparison of theoretical and non-linear material properties FE results of the change of (a) longitudinal bulk wave speed, and (b) normalized
3D FE simulation of
in a prestressed plate
This section describes the 3D FE model for investigating the stress effect on the combinational harmonics of
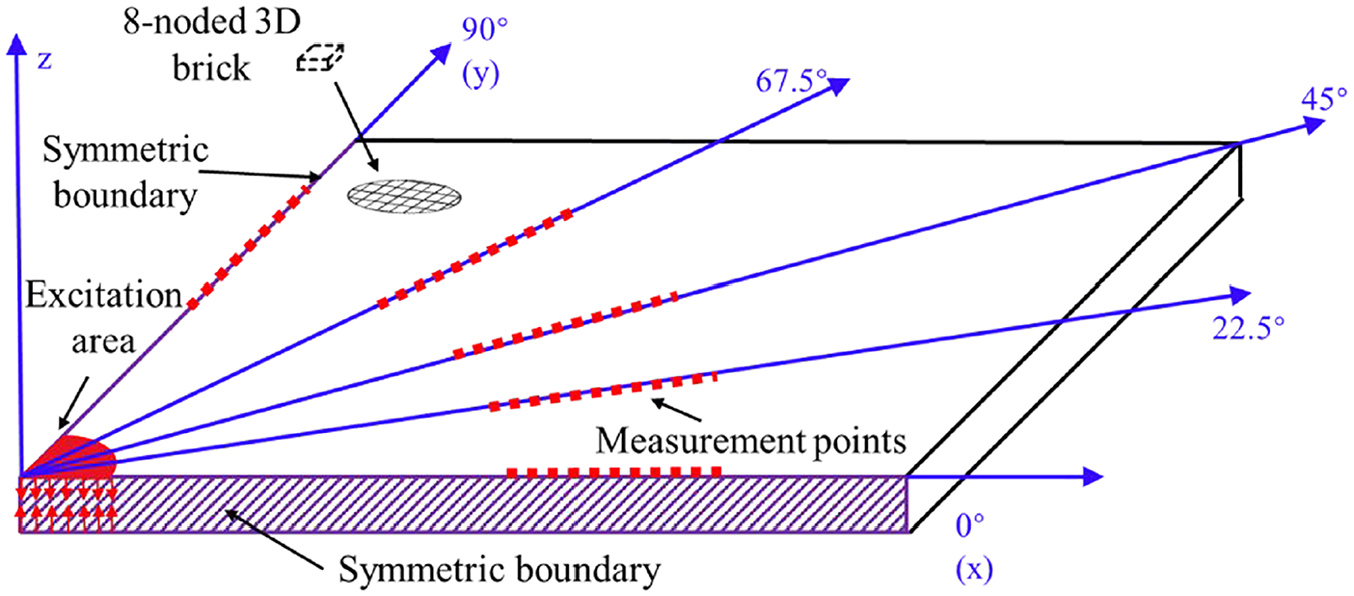
Schematic of 3D FE model for simulating propagation of
Figure 18(a) and (b) compares the numerically calculated and experimentally measured time and frequency domain signals from the first measurement point in the initial condition, respectively. The red solid line represents the experimentally measured data, while numerical calculated results of the nonlinear FE is labelled as the blue dot-dash line. To directly compare nonlinear FE and experimental data, both numerical and experimental data were normalized by their absolute maximum value, respectively. Figure 18(a) indicates that the FE calculated and experimentally measured data have a similar pattern and arrival time of the
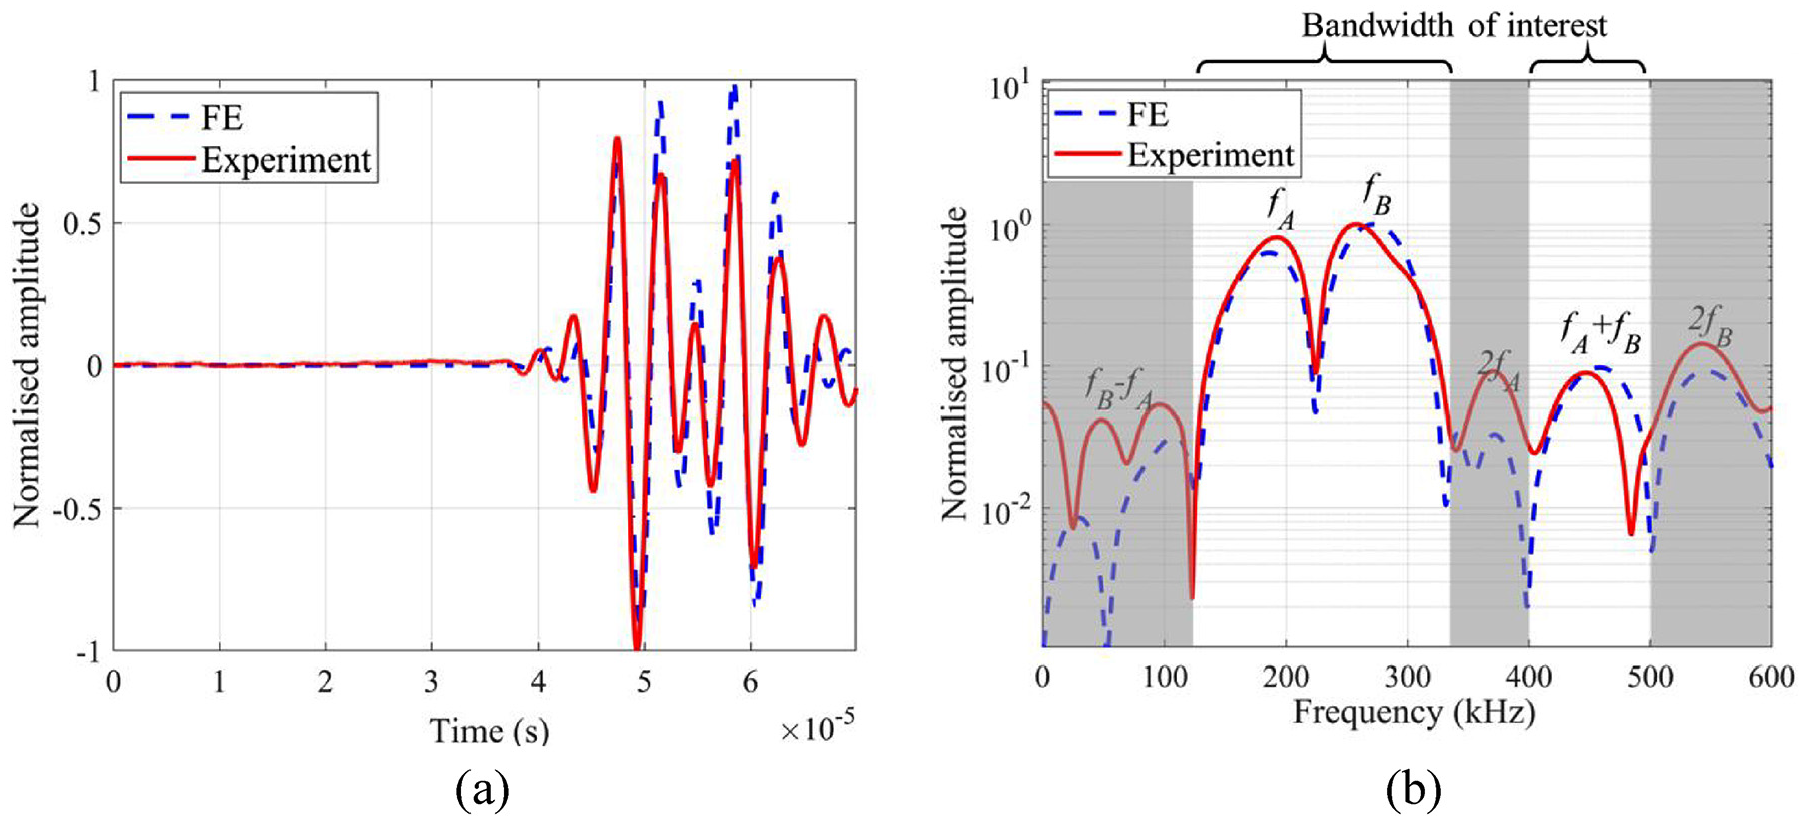
Comparison of experimental and non-linear FE results in (a) time and (b) frequency domain.
Parametric study using 3D FE model
Effect of biaxial prestressed conditions
In this section, the effect of different biaxial prestress combinations and various stress magnitudes on the wave speed and
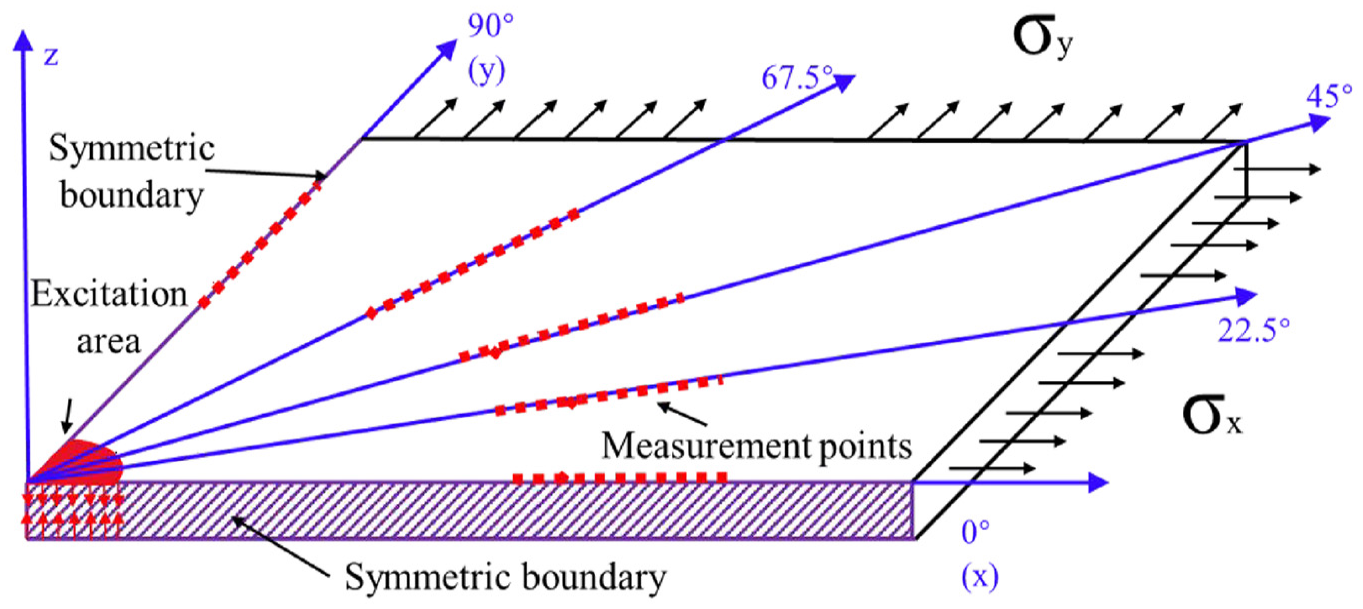
Schematic of 3D FE model for simulating propagation of
Summary of biaxial pre-stress combinations
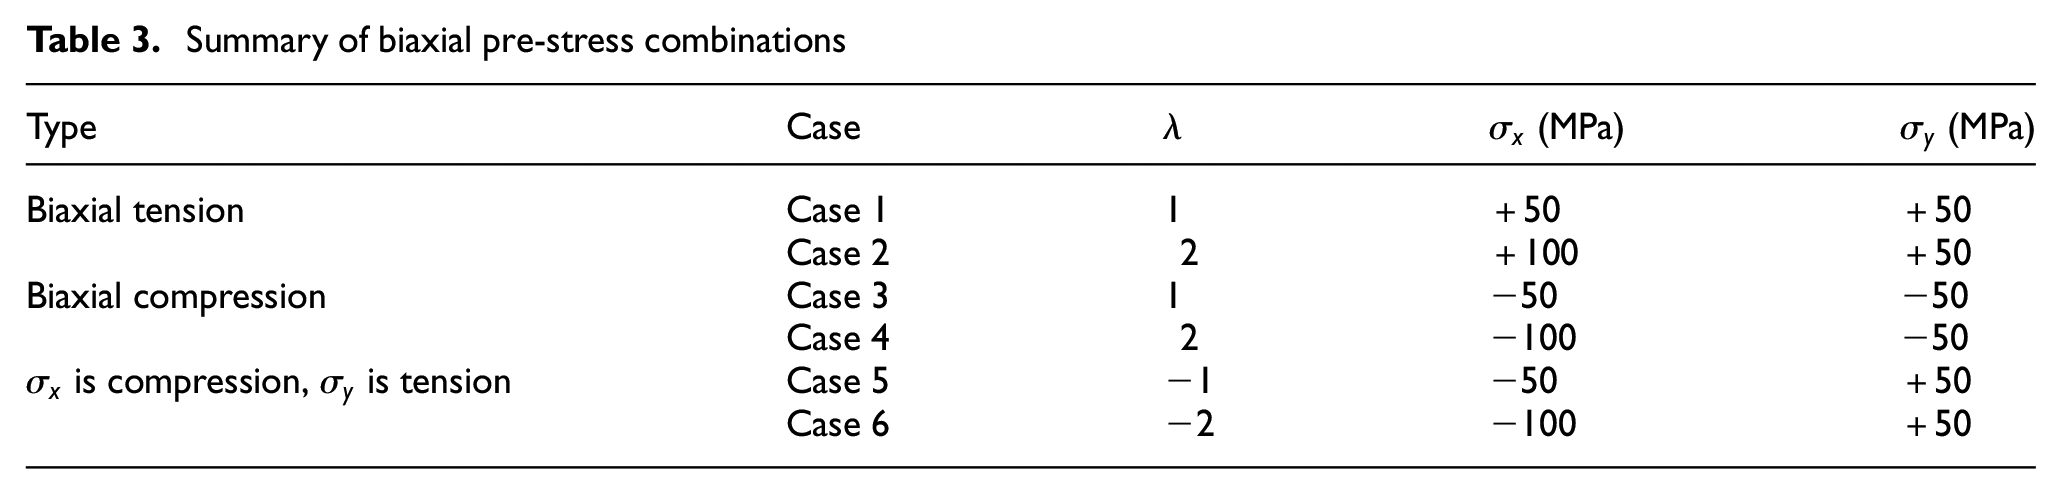
The effect of biaxial stresses on both the wave speed and
Figure 20(a) to (c) show the normalized
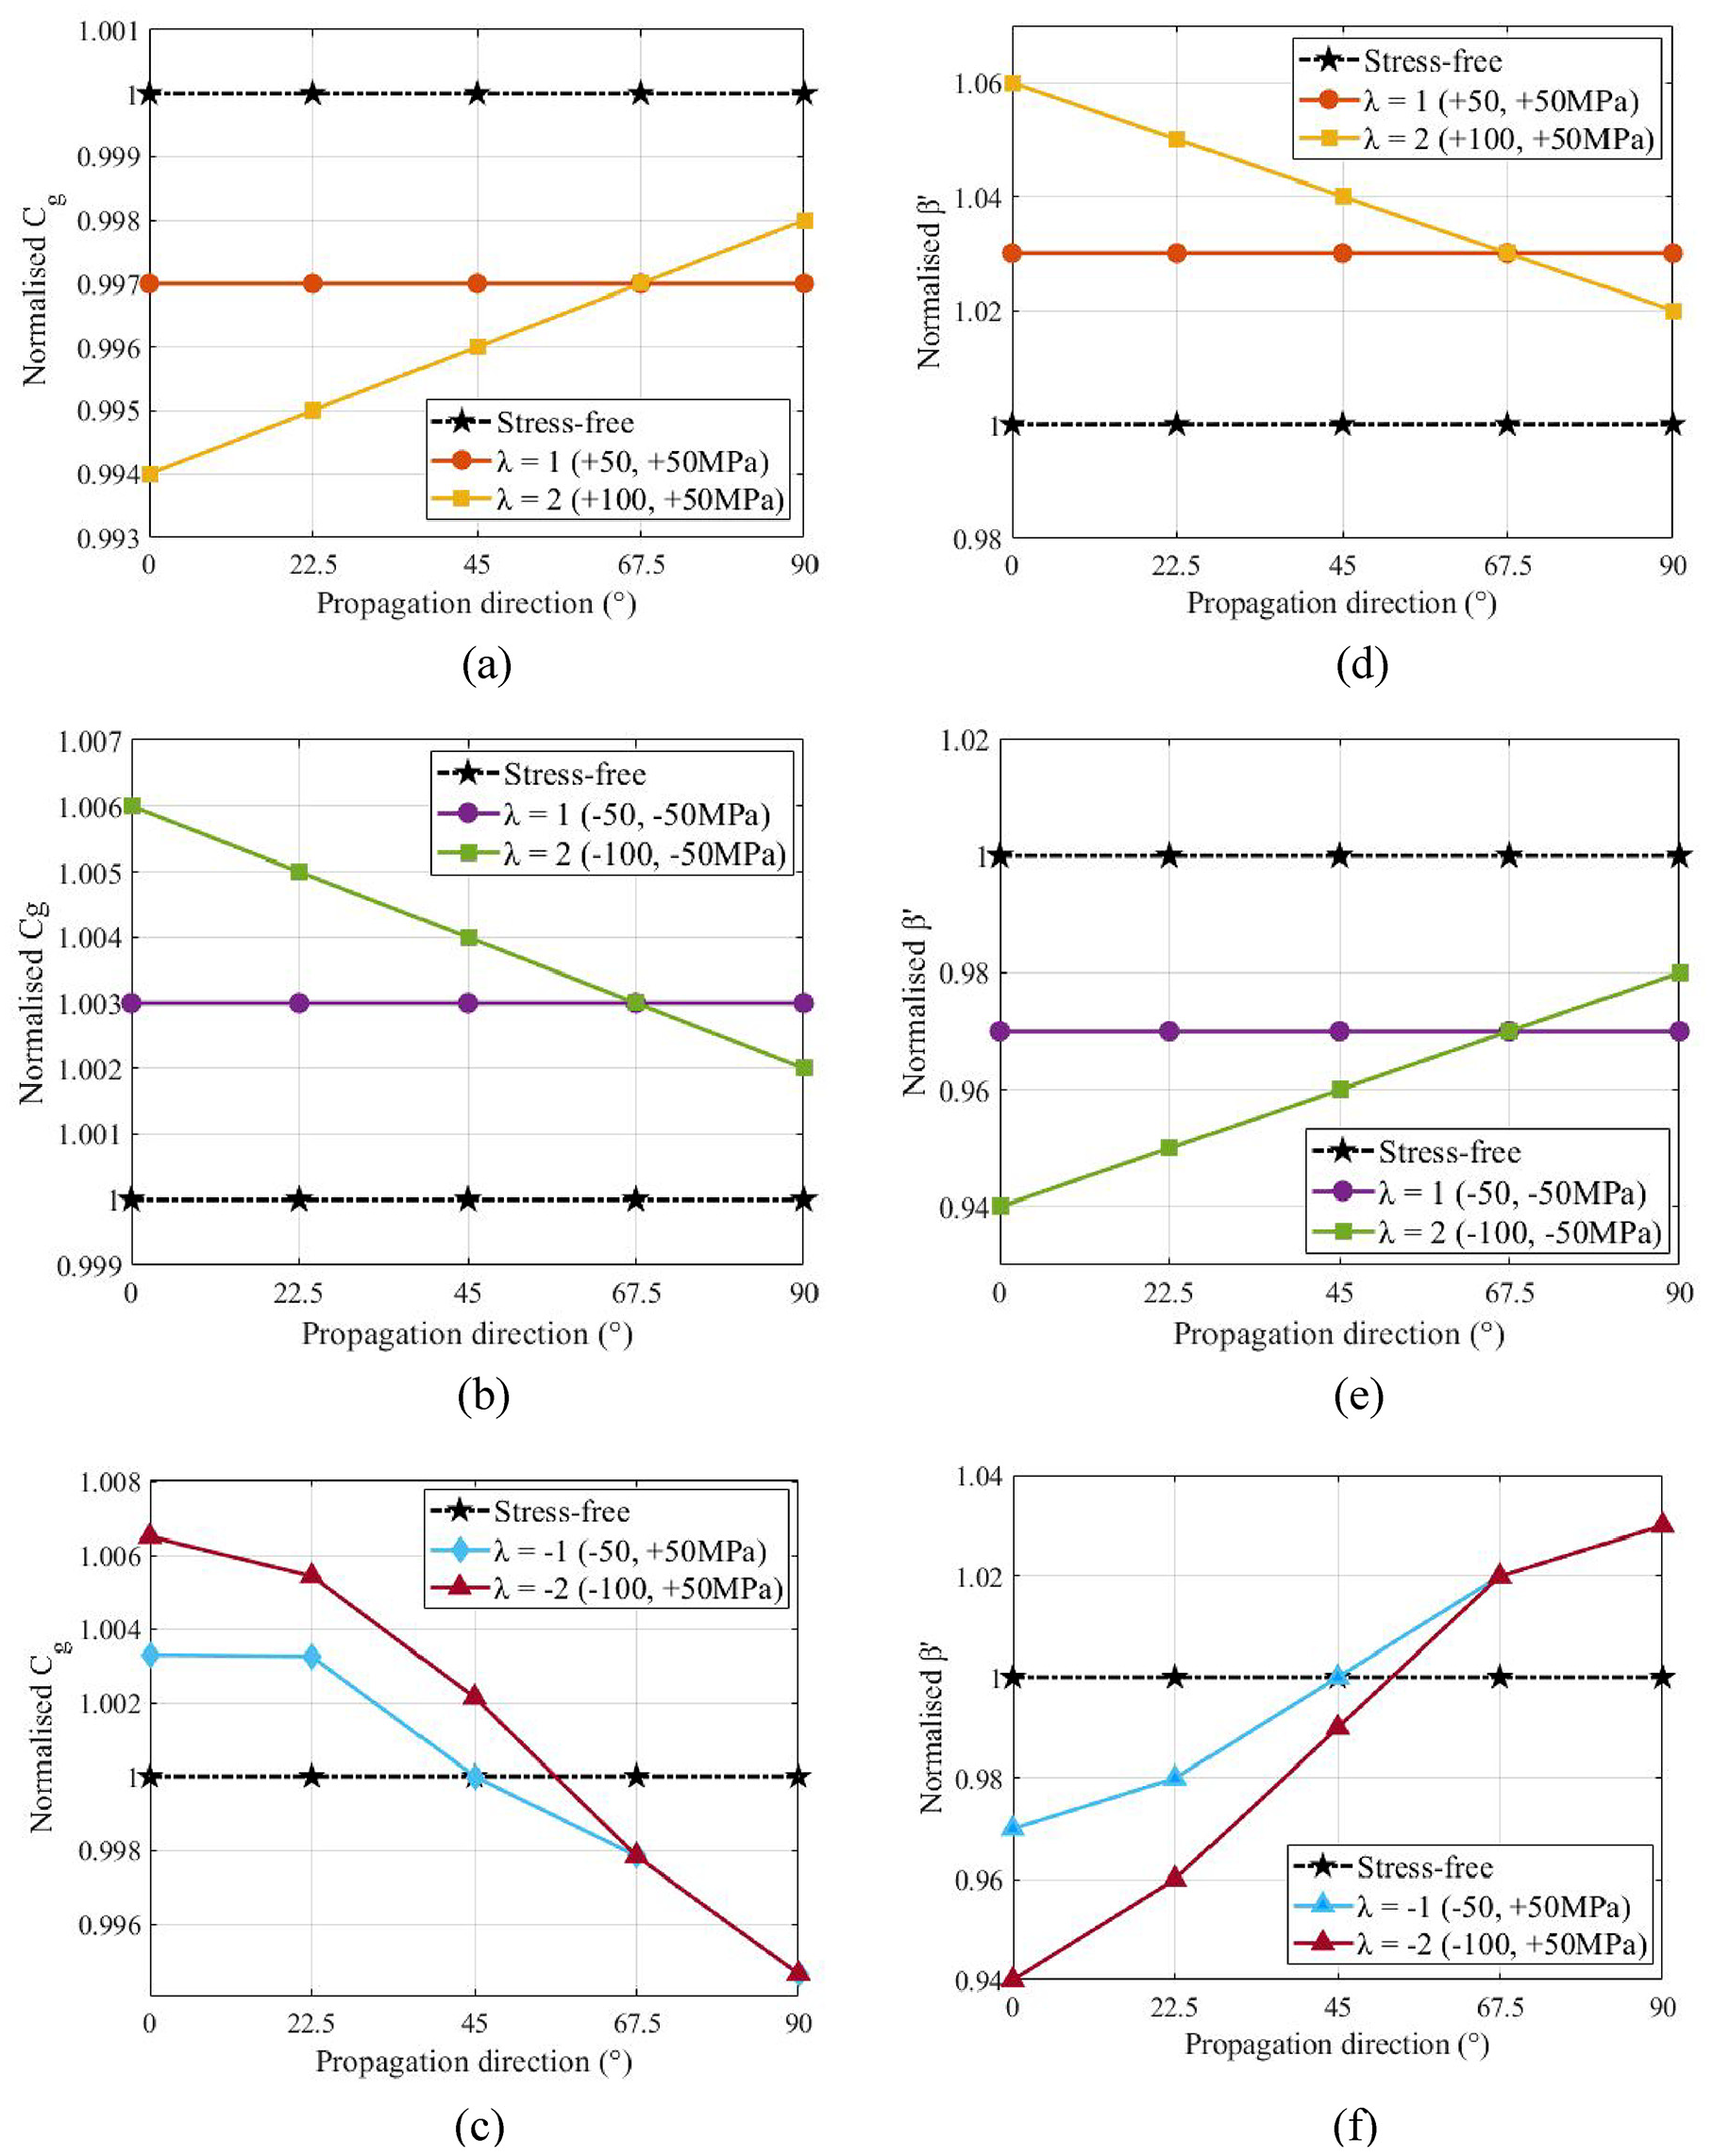
Normalized wave speed of (a) biaxial tension, (b) biaxial compression, (c) combination of tension (in 90° direction) and compression (at 0° direction), and normalized
Figure 20(d) to (f) presents the normalized
Discussion and conclusions
This study has investigated the effect of initial stresses on the generation of combinational harmonics due to non-linear
The change in wave speed due to initial stress aligns with the studies on the acoustoelastic effect in the literature. Gandhi et al.
30
analytically and experimentally investigated the acoustoelastic effect on the propagation of
In the numerical study, material non-linearity was modelled through a 5-constant hyperelastic constitutive equation, derived from Murnaghan’s strain energy function. The results from a quasi-1D FE model have showed good agreement with the corresponding theoretical predictions, thereby providing a validation for the two-step computational procedure. The same procedure was then applied to a 3D FE model for simulating the propagation of
Furthermore, it is worthwhile to note that an inverse method proposed by Shi et al. 47 could be utilized to estimate the magnitudes of arbitrary biaxial stress by analysing the change of phase velocity as a function of propagation angles. It is anticipated that this method could be useful for reconstructing biaxial stress state based on the change of combinational harmonics since the effect of biaxial prestress on wave speed is inversely proportional to the corresponding changes in non-linearity parameter as shown in Figure 20.
Despite the encouraging results, it is important to note that several factors shall be also taken into account when developing a robust stress monitoring system for future in-situ applications. In the experimental setup, the use of a laser vibrometer requires precise optical conditions and accurate alignment, which limits its suitability for in-situ monitoring. It needs further research to address these challenges and improve the practicality of the proposed method. Additionally, the current work assumes that the aluminium specimen is isotropic. However, anisotropy could also be introduced due to the material texture, which develops during the rolling process in manufacturing. 49 These factors should be taken into account in future analyses to ensure accuracy of the measured results under real-world conditions.
In summary, the outcomes of this study have demonstrated the feasibility of using combinational harmonics of low-frequency
Footnotes
Declaration of conflicting interests
The author(s) declared no potential conflicts of interest with respect to the research, authorship, and/or publication of this article.
Funding
The author(s) disclosed receipt of the following financial support for the research, authorship, and/or publication of this article: This work was funded by the Australia Research Council (ARC) under grant numbers DP210103307 and LP210100415. The supports are greatly appreciated.