
Abstract
Laser-induced graphene (LIG) enables the creation of cost-effective sensing devices via one-step laser scribing on organic substrates. This work aims to demonstrate the feasibility of LIG as an embedded damage sensor in structural composite materials. LIG was produced on an inexpensive cork substrate using a low-power blue light laser engraving system. The LIG was characterised to establish the relationship between the LIG’s physical properties and the lasing parameters. Using the lasing parameters which offer the optimal LIG properties, a LIG mesh pattern lased on the cork substrate was embedded in a glass fibre composite laminate as the damage-sensing core material to assess its sensing capability for impact damage. By measuring the electrical resistance change in the LIG mesh pattern consisting of a series of horizontal and vertical channels before and after impact loading, it was able to define the location of internal damage and its damage size, validated by X-ray computed tomography results. It is demonstrated that the test data can be used to train a machine learning algorithm to develop a simple damage-sensing system with a high accuracy rate of 94.3%, which significantly reduces the manual effort for large-scale composite structural health monitoring. This simple damage sensing system can be used to monitor internal impact damage in composite structures, such as off-shore wind turbine blades, which are inaccessible for inspection by conventional non-destructive testing.
Keywords
Introduction
Fibre-reinforced polymeric (FRP) composites have been widely used in aerospace, marine and renewable energy applications for decades due to their lightweight, high specific strength and exceptional corrosion resistance. 1 However, failure of FRPs can be complicated and catastrophic, therefore, requiring damage detection as early as possible. Structural health monitoring (SHM), which identifies undesirable structural changes and damage that improve material reliability and collects data for life cycle management, is becoming increasingly popular among researchers. 2 SHM systems for early damage detection is especially crucial for internal damage that is not visible, as timely interventions could prevent progressive failure and ensure operational safety. Multiple techniques, such as optical fibres, 3 acoustic emission testing4,5 and resistance-based sensing, have been investigated to detect and locate damage in FRPs, specifically for delamination and crack growth. Among these methods, SHM using resistance-based sensing by embedded graphenic nanomaterial6–10 generally requires only an inexpensive and simple probing tool such as a digital multimeter, providing a straightforward approach for detecting non-visible internal damage. After Lin et al. demonstrated the capacity to create graphene nanostructures on commercial polyimide (PI) substrates in 2014, 11 laser-induced graphene (LIG) has attracted significant interest as an in situ graphene generation method. In comparison to conventional chemical vapour deposition (CVD) 12 or carbon nanomaterials doping methods, 13 the LIG method offers a substantial reduction in graphene synthesis time and manufacturing cost. While the CVD method requires expensive vacuum equipment or high temperatures (>1000°C), nanomaterial doping necessitates more chemical interventions and prolonged dispersion processes. In light of this, LIG could pave the way for economical embedded smart sensing applications, particularly for FRP structural components produced on a massive scale.
LIG has been extensively studied in a variety of sensing applications as electrochemical sensors, moisture sensors and triboelectric sensors. However, using it for strain and damage sensing has gained more attention.14–16 Several types of LIG strain sensors have been developed on PI films by CO2, visible and ultraviolet laser systems.17–19 LIG typically has a unique three-dimensional (3D) conductive porous nanostructure. Therefore, LIG subjected to compression and tension can give a decrease or increase in electrical impedance, as the carbon–carbon contact that makes up the LIG is pressed into contact or pulled apart. Groo et al. developed a piezoresistive LIG interlayer for strain sensing using the constant-pressure rolling transfer technique to transfer the LIG from PI to glass fibre prepreg.16,20 It has also been demonstrated that the polymeric composite itself can be used as LIG precursors, as both the epoxy resin matrix and the polymeric or organic reinforcement fibres can be directly converted to graphene/graphite. 21 Nasser et al. used aramid fibres to generate LIG with enhanced interlaminar performance and investigated the electrical resistance change of the composites under strain and ballistic impact.22,23 Furthermore, it is also possible to create laser-induced graphitic structure by multiple laser scanning on glass fibre epoxy prepreg before and after curing to make multifunctional composites. 24 However, most works primarily focused on strain-sensing applications rather than impact damage detection. When it is subjected to impact loading, there will be disintegration of the carbon–carbon contact network caused by impact damage, leaving a permanent increase in electrical resistance. This irreversibility in the electrical resistance can be used as an indicator for the presence of damage, even after the loading is removed. However, a single LIG sensor can only indicate the presence of in-plane damage, but not the extent of damage. Therefore, by arranging them in a mesh pattern or network, a damage map can be developed to show the severity of the damage. In this work, the versatility of the LIG synthesis process via laser irradiation allows the production of bespoke LIG networks or patterns according to the needs, which can be used to identify the location of the damaged area and its size. The LIG network can then be embedded in the composite material as an internal damage sensor, for example following an exterior impact event.
On the selection of LIG precursor, previous research shows that the most common substrates used for the synthesis of LIG are PI films, 25 PI papers 26 and other polymers such as polyetherimide and polysulfide.27–30 However, PI films are typically thin and they exhibit substantial irreversible thermal deformation after laser irradiation and poor compatibility with the resin matrix in composite materials. On the other hand, PI papers offer improved thermal stability and compatibility with resin due to their porous structure, but they are more expensive due to their more complicated manufacturing process, compared to PI films which are manufactured by direct extrusion. Recent research has demonstrated that the majority of biodegradable carbon-based precursors can be transformed into amorphous carbon and then to graphene using multiple lasing methods, offering a sustainable and eco-friendly way to synthesise LIG.31,32 In this study, as a proof of concept, cork is chosen to be the sustainable and biodegradable substrate for LIG synthesis, aligning with previous investigations that demonstrated good LIG quality in both piezoresistive and capacitive sensing applications.33–35 Cork is inexpensive and easily available. It has a uniform porous structure, which allows the formation of 3D LIG structures with customisable thickness under different lasing parameters. 36 The porous structure of cork facilitates effective infiltration by the resin matrix when employed as a core material in a sandwich composite structure, resulting in better compatibility with the composite matrix.37–39 Its porous nature also enables efficient dissipation of pyrolytic gases, allowing intricate LIG patterns to be designed without thermal deformation. In principle, any other substrates can be used provided that they are compatible with the resin matrix and thermally stable.
This study presents a new approach for using the cork-derived LIG as damage sensor in a fibre-reinforced composite. The properties of LIG on a cork substrate after irradiation by a commercial blue laser engraver are firstly characterised to assess its viability as a sensing element following selected lasing parameters. The morphology, graphitisation quality and electrical properties of the synthesised LIGs were then investigated to find the lasing parameters that offer a good balance between graphitisation quality and LIG geometry. Subsequently, the LIG on cork substrate was embedded into a glass fibre-reinforced epoxy composite to demonstrate its damage sensing capability in a drop weight impact test for internal damage detection and damage area estimation, validated against results from X-ray computed tomography (CT). It is also demonstrated that the LIG sensor can be used in conjunction with a machine learning (ML) algorithm to process the data more efficiently and accurately especially for borderline data.
Experiments
LIG synthesis and characterisation
Before laser treatment, the 1 mm thick agglomerated cork paper was wiped with isopropyl alcohol and dried at room temperature. It was then taped down on a wooden board and placed in a commercial laser engraver unit (GKTOOLS, FB03). The communication between the laser engraver and the PC was done via the LaserGRBL v4.8.0 control software (open source). The laser head was designed to emit a focused blue laser beam (λ = 445 nm, laser spot diameter = 0.2 mm.) with an adjustable power range from 0 to a full power of 2500 mW. The horizontal line-by-line tracing approach is used for all patterns in characterisation and sensing tests as shown in Figure 1(a). To limit the number of parameters, the laser focal distance, scanning speed and pattern resolution were fixed at 19.5 cm, 16.7 mm/s and 300 dot per inch (dpi), respectively, based on the recommended setting imposed by the hardware constraints. The line density of the scanning was set at 2 lines/mm to avoid irreversible thermal deformation and burnt marks on the substrate under multiple scans. In this study, the variables for LIG generation that required optimisation were reduced to two, that is, laser power and number of laser scans, as they can be easily manipulated using the control software. These characteristics are adequate to optimise the LIG structure, providing high electrical conductivity for sensing purposes and good porosity for integration with epoxy resin, as will be demonstrated in ‘Microstructural and electrical properties of LIG’ section. To determine the optimal laser parameters for subsequent LIG pattern design, the geometrical characteristics of the LIG such as line gap and cross-sectional profile were investigated. This was then combined with its electrical properties to identify the optimal lasing parameters. For convenience, the LIG samples prepared on cork paper were named based on the processing parameters, that is, scanning time (1–3 times) and power (0.63, 1.25, 1.88, 2.50 W, which is 25%, 50%, 75%, 100% power, respectively), for example, LIG-2T-1.88 refers to LIG fabricated with 2 times scanning and 1.88 W power. As illustrated in Figure 1(b), two LIG patterns were created for characterisation. The square-shaped (10 mm × 10 mm) LIG patterns were lased for sheet resistance (SR) measurement, while the rectangular (40 mm × 3 mm) LIG patterns were for LIG microstructural characterisation. All laser treatments were processed under normal room conditions. Silver conductive paste was applied on the opposite edges of the LIG pattern to facilitate copper wire connection for resistance measurement.
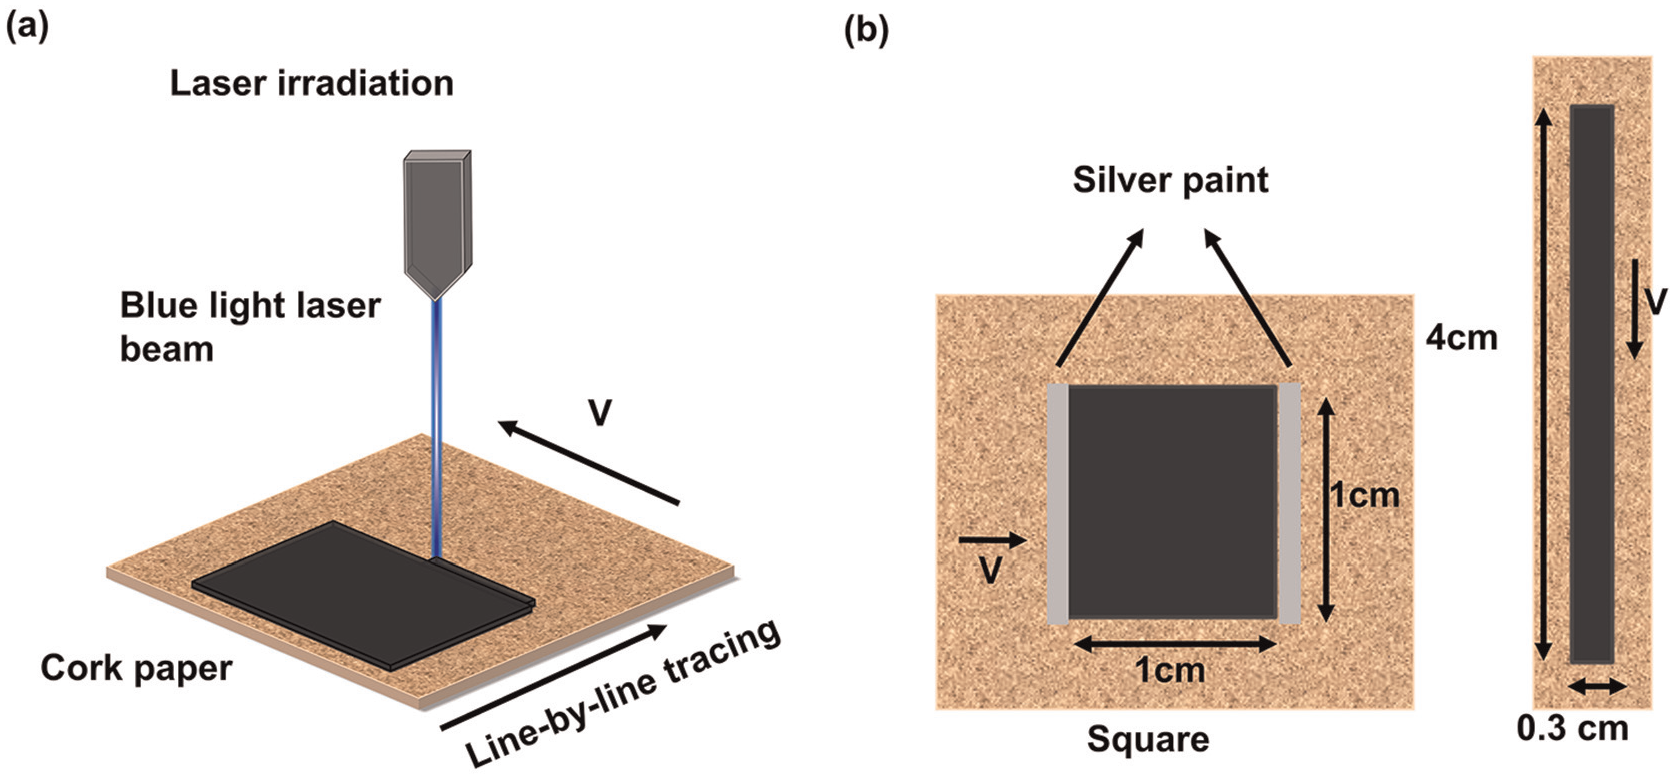
(a) Laser irradiation on a cork paper substrate, where the morphology and quality of the LIG can be designed by tuning the laser power (P), scanning speed (v) and lasing pass number (n). (b) The square and rectangular LIG patterns (viewed from top) used for sheet resistance measurement (left) and microstructural characterisation (right) respectively (v direction indicates the scanning direction for each pass).
The surface and cross-section morphology of LIG were investigated via field emission scanning electron microscopy (SEM, HITACHI SU8000). Horiba XploRA PLUS Raman microscope was employed with a 532 nm excitation laser at the power of 5 mW to measure the chemical structures and carbonisation level of the LIG. A 3D laser scanning confocal microscope (Alicona G4 Infinite Focus) was used to characterise the geometry of LIG lines. The surface resistance of the LIG electrodes was determined by a handheld digital multimeter (Fluke 175). All measurements were carried out directly on the LIG on top of the cork paper.
Fabrication of LIG damage-sensing composites
Following the characterisation work in ‘LIG synthesis and characterisation’ section, the laser parameter setting which gives the optimal LIG properties was used to produce LIG mesh patterns before they were embedded as the sensing layer in the glass fibre-reinforced epoxy composite plates. The 10 cm × 10 cm mesh pattern consisted of nine horizontal and nine vertical 1.5 mm width LIG channels with the dimensions as shown in Figure 2(a). The distributed cork-LIG networks achieve two-dimensional (2D) damage mapping with 3–9 mm sensing resolution. The design of the mesh pattern featured a higher mesh density in the central region, where larger deformation and damage are expected to happen during impact tests, while preventing cluttering the pattern with too many channels. The LIG sensing network is embedded at the mid-thickness of the composite plate to give a good estimation of the overall internal damage severity. Due to its intricate conductive network, it is sensitive to slight alteration of the LIG network caused by inter-ply delamination after impact loading. The terminals of each channel were connected to 0.1 mm thick copper strips for electrical resistance measurement. As shown in Figure 2(b), the cork paper with the LIG mesh pattern was directly placed as the core material between two face sheets each consisting of six plies of S-913 unidirectional glass fibre/epoxy prepreg (HexPly; USA: Hexcel Corporation, Stamford) arranged in a cross-ply (0°/90°) configuration. The cork paper with 12 layers of prepregs were then vacuum bagged and cured in the autoclave at 120°C and 7 bar for 60 min following the prepreg manufacturer’s recommendation. During the curing process, the excess resin was allowed to flow and infiltrate into the porous cork paper substrate, bonding the cork paper to the glass fibre composite face sheets. Figure 2(c) and (d) displays the LIG on cork paper before and after it was embedded in the composites. A total of nine plates of the LIG self-sensing composites, each measuring 14 cm × 14 cm, were manufactured for the drop weight impact test. Six of the plates were used for providing training data to the ML model (discussed in ‘LIG sensor working concept and data processing with ML’ section) and the remaining three plates for model validation purposes. The impact energy applied on the composite plate specimens was generated by a drop tower impact system (CEAST 9350, Instron) using a standard hemispherical indenter (16 mm diameter). All composite plates were placed on a support plate with a central 40 mm diameter hole. The impact energy of 10 J was applied on the six training plates, while 10, 12 and 15 J were applied on the three test plates. The resolution of the predicted damage size is given by the separation of the LIG channels. Figure 2(e) shows composite specimens with post-impact damage. The internal damage of the composites was evaluated using a Nikon XTEK 225 kVp micro-focus X-ray CT system. The CT images were reconstructed by the VGSTUDIO 2022 software (Volume Graphics) with a voxel size of 75 μm/pixel for the x- and y-axes, and 50 μm/pixel for the z-axis.
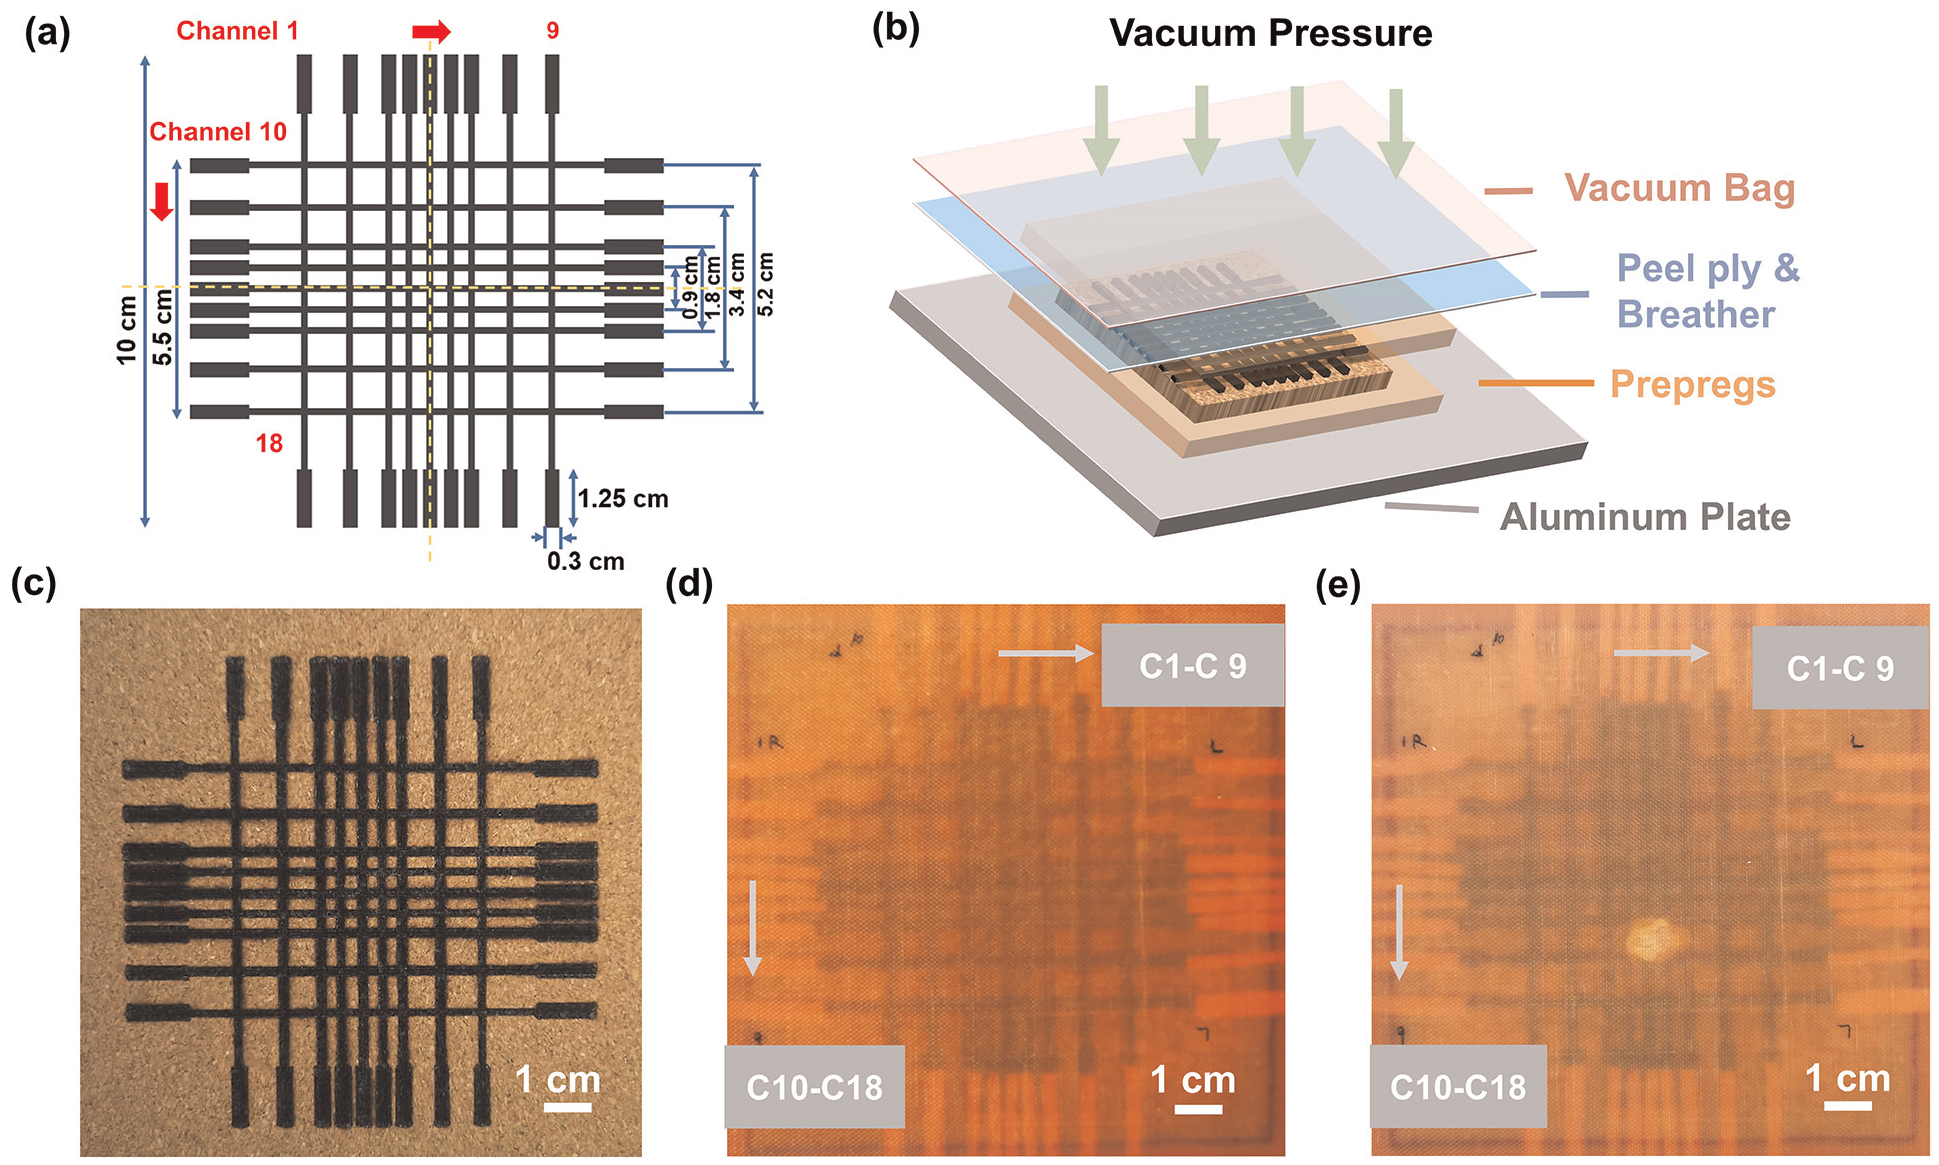
(a) The LIG mesh pattern design with 18 channels. (b) The cork paper with the LIG mesh pattern embedded between two glass fibre composite face sheets in a vacuum bag. (c) The cork-LIG mesh before embedded in the composite plate. (d) Composite plate with embedded LIG mesh before impact damage. (e) Discoloration of the composite plate with embedded LIG mesh showing damage after impact.
LIG sensor working concept and data processing with ML
The working concept of embedding a LIG layer to locate the damage affect area in composite materials is inspired by previous graphene-based sensor designs. 9 The epoxy resin fills up the LIG pores and offers mechanical support to the otherwise fragile LIG microstructure. The LIG channels will give a change in electrical resistance due to the disintegration of the microstructure and debonding from the cork substrate following a drop weight impact event. The vertical and horizontal channels beneath the point of impact serve as indicators along the x- and y-axes, respectively, providing precise information of the damage location. However, the LIG channels around a small neighbourhood of the impact zone can also be affected as the delamination propagates. The impact damage can cause different amounts of resistance change in the LIG channels, depending on the location and energy of the impact on the LIG mesh pattern. When the damage occurs at the edge of the plate, there are fewer intact channels around the neighbourhood of the affected channels to serve as alternative electrical routes for resistance measurement, resulting in a significant increase in resistance. In contrast, affected channels in the centre of the plate are surrounded by more intact channels which are closely packed, giving a smaller increase in resistance. Moreover, real-world impact scenarios can be more intricate with complex geometries, making it challenging to characterise damage at different severity levels. Therefore, the main challenge is to distinguish between LIG channels whose electrical resistance changes result from direct impact damage and those marginally affected by propagated delamination in the adjacent areas. To this end, a simple ML approach, was adopted to offer a more adaptive and efficient solution for damage assessment, especially for discerning the subtle variations in resistance change between damaged and non-damaged channels which are influenced by the specific location of the damage.
In this study, the k-nearest neighbours (KNN) model was selected due to its minimal parameter tuning requirements and the limited training data obtainable from experiments.40,41 The KNN algorithm is a non-parametric, instance-based learning method that classifies new instances based on their similarity to existing instances in the training dataset. 42 Compared to more advanced models, such as Convolutional Neural Networks, KNN employs lazy learning, deferring model construction until a new instance requires classification which makes it computationally efficient for small datasets and less susceptible to overfitting. Following the impact test, the nine composite plates were divided into two groups: a training group of six plates to provide training data for the KNN algorithm and a test group of three plates serve as new cases for model validation. To evaluate the sensing capability of the multichannel LIG mesh design, each of the six plates was impacted at a different location having different LIG channel densities. The resistance of each channel from each plate was measured three times before and after the impact to minimise measurement errors. After that, the resistance changes of each channel were fitted to a normal distribution, with the mean (μ) and standard deviation (std) calculated for each plate. For simplicity, a damage threshold was established at 1 std of resistance change determined from the results of impact test at 10 J. The damage threshold of 1 std is chosen here as the standard deviation is a common concept in statistics to determine what constitutes an outlier and what does not. The channels are diagnosed as damaged when their resistance change exceeds the damage threshold value. In practice, the value of the damage threshold can be adjusted depending on the required conservatism. Nevertheless, challenges arise from two primary sources. First, the inherent material variability of the cork paper substrate as a bio-derived material can lead to slight variation in LIG quality and therefore the initial electrical resistance reading can vary from plate to plate. Second, different impact scenarios at different energy levels and impact locations can affect how damaged channels influence their neighbouring channels. For example, more extensive damage can substantially increase the mean value of resistance change across the plate and heavily skew the dataset, therefore, neglecting the resistance changes of moderately damaged channels (i.e. erroneously treating them as undamaged when they should be considered as damaged) under the enlarged standard deviation range. The main objective of using the KNN model was to distinguish more adaptively the damage status of the LIG channels as either damaged or non-damaged under different impact scenarios. The use of ML models such as the KNN model eliminates the need to establish new resistance change thresholds for different impact scenarios. Furthermore, the model can also be easily adjusted to meet the desired level of conservatism for specific applications.
To ensure accurate model training and mitigate potential classification biases, data preprocessing techniques were implemented prior to model construction. Any resistance changes of the LIG channel exceeding 2 MΩ (about 60 times more than the typical initial resistance reading), were confidently identified as a completely broken channel and were excluded from the calculation as it could heavily distort the normal distribution of the results. The decimal scaling normalisation, and oversampling were employed to improve the comparison of data points from six training plates and to speed up the learning process. 43 To further improve the prediction accuracy of the algorithm, a hyperparameter tuning process was undertaken through the grid search algorithm. 44 The hyperparameters subjected to optimisation includes the k values, which determine the number of nearest neighbours considered for data processing; the distance threshold, which determines the maximum distance a data point can be away from its nearest neighbours to be considered in the same class; the distance metrics, which quantify the dissimilarity between data points through different distance function, and the weight function, which is responsible for assigning relative importance to the KNN. The logic behind weighted KNN is to give more weight to nearby data points and less weight to distant points, thereby improving the prediction performance. The remaining three composite plates from the test group were employed to validate the predictions made by the KNN model, after comparing the results with the X-ray CT images. The impact damage detection workflow for these plates is summarised in Figure 3. The electrical resistance change (△Ri), average plate resistance change (△Raverage), relative resistance change (△Ri − △Raverage) and the standard deviation of plate resistance change (std i ) were selected as input features (f) to the KNN model. The KNN algorithm and data processing code in this study were implemented using Python 3.9 and the Scikit learn package for ML. The matplotlib and cv2 package was used to create visualisation. 45
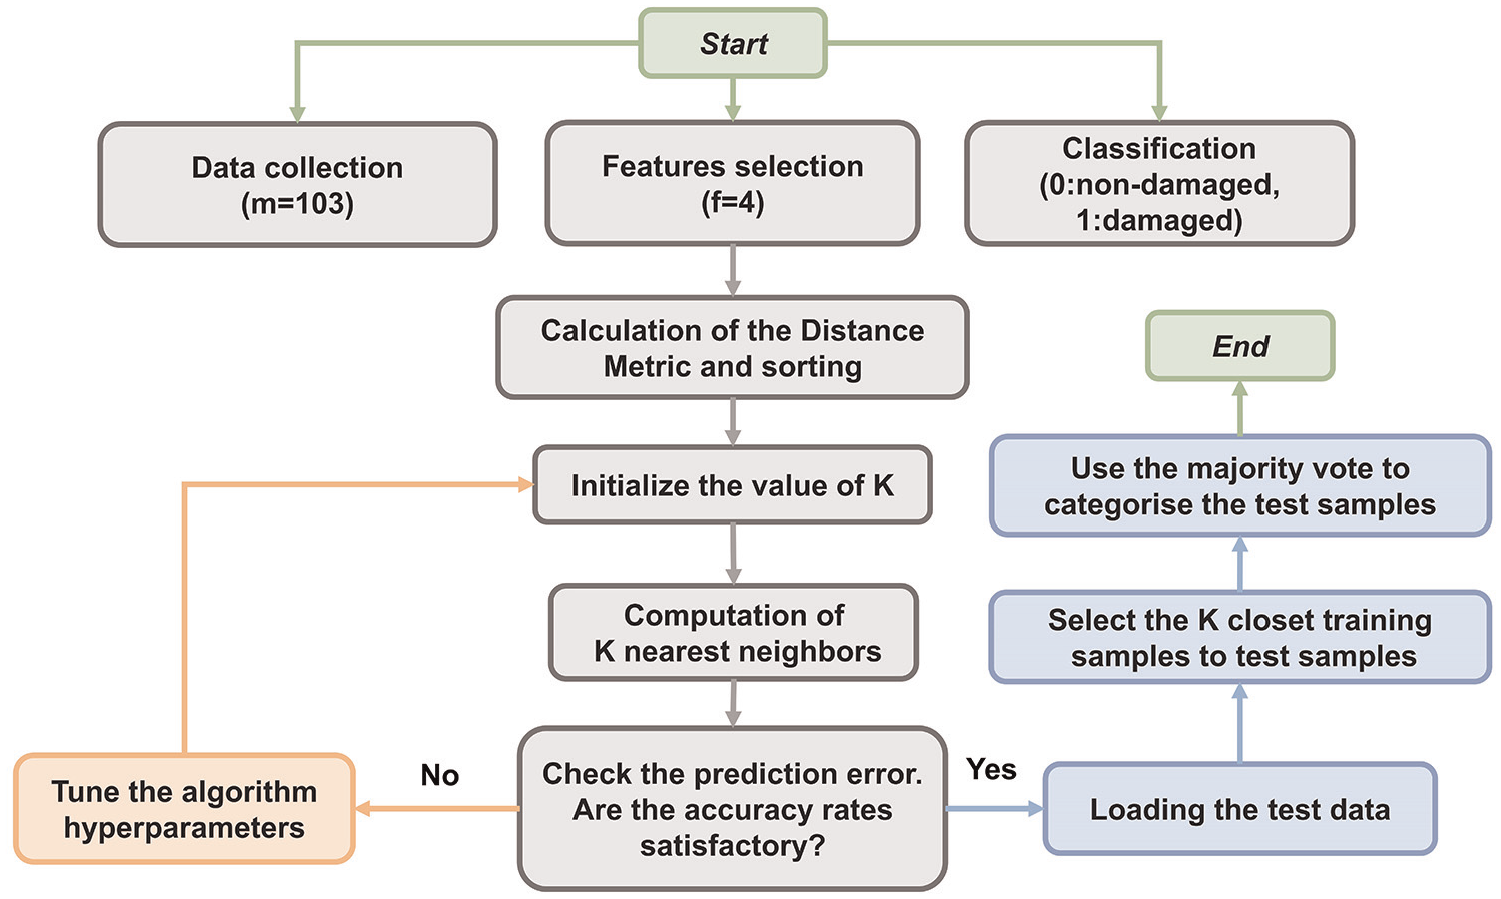
Flowchart depicting the process of applying the KNN model to predict outcomes for new test samples. The steps for model training are coloured grey, while the steps for model validation are in blue.
Results and discussion
Microstructural and electrical properties of LIG
In order to determine the optimal laser parameters, the characterisation results of LIG including its microstructure, graphitisation level and area electrical conductivity are discussed in this section. It is essential to ensure the creation of a LIG pattern with uniform quality. Minimising the gap between adjacent laser scanning paths was the first step to achieving a continuous LIG surface, which is necessary for developing consistent electrical conductivity and reliable sensing capabilities. Figure 4 shows the microscope and SEM images of the LIG pattern geometry. Line-by-line lasing was used to create a LIG region of finite width. Prior research indicates that increased laser power and the number of scans expand the carbonised area on the substrate and improve the graphene quality.46,47 The microscope image in Figure 4(a) reveals a distinct gap between LIG lines when using a single pass scan at 2.5 W (100% power). In contrast, a uniform overlap between adjacent LIG lines can be achieved via a second pass of lasing, despite at a reduced energy level (50% power). Therefore, the multipass laser scanning method was employed in this study for two purposes: primarily, it enhances the graphitisation of amorphous carbon, and additionally, it facilitates the generation of cork-derived LIG with uniform microstructure. However, multipass lasing can cause permanent thermal deformation of the cork substrate. Figure 4(b) shows that the lasing path of the third pass no longer aligns with the original path, leading to a significant increase in linewidth but with no further carbonization; hence, the third time scanning and above were not considered. Figure 4(c) and (d) shows the SEM images of the cork-LIG microstructure from the top view produced using different number of lasing passes and power. Figure 4(c) illustrates the transformation of the regular cell structure of the cork into a more irregular porous structure of LIG in the LIG-1T-1.25 W sample, which is attributed to the gas release. The cork area that stays intact between the LIG is bounded within the two yellow dashed lines in the images. The two-pass lasing at the lower 1.25 W power manages to close the LIG line gap further, as shown in Figure 4(d). By increasing the laser power to 1.88 W, in Figure 4(e), the width of the single-pass LIG lines increases with decreasing gap between them, but not sufficient to close the gap fully. Lastly, having two-pass lasing at the higher 1.88 W power in Figure 4(f) successfully transformed all cork to porous LIG structures without any visible cork remaining, resulting in the formation of fully interconnected LIG lines.
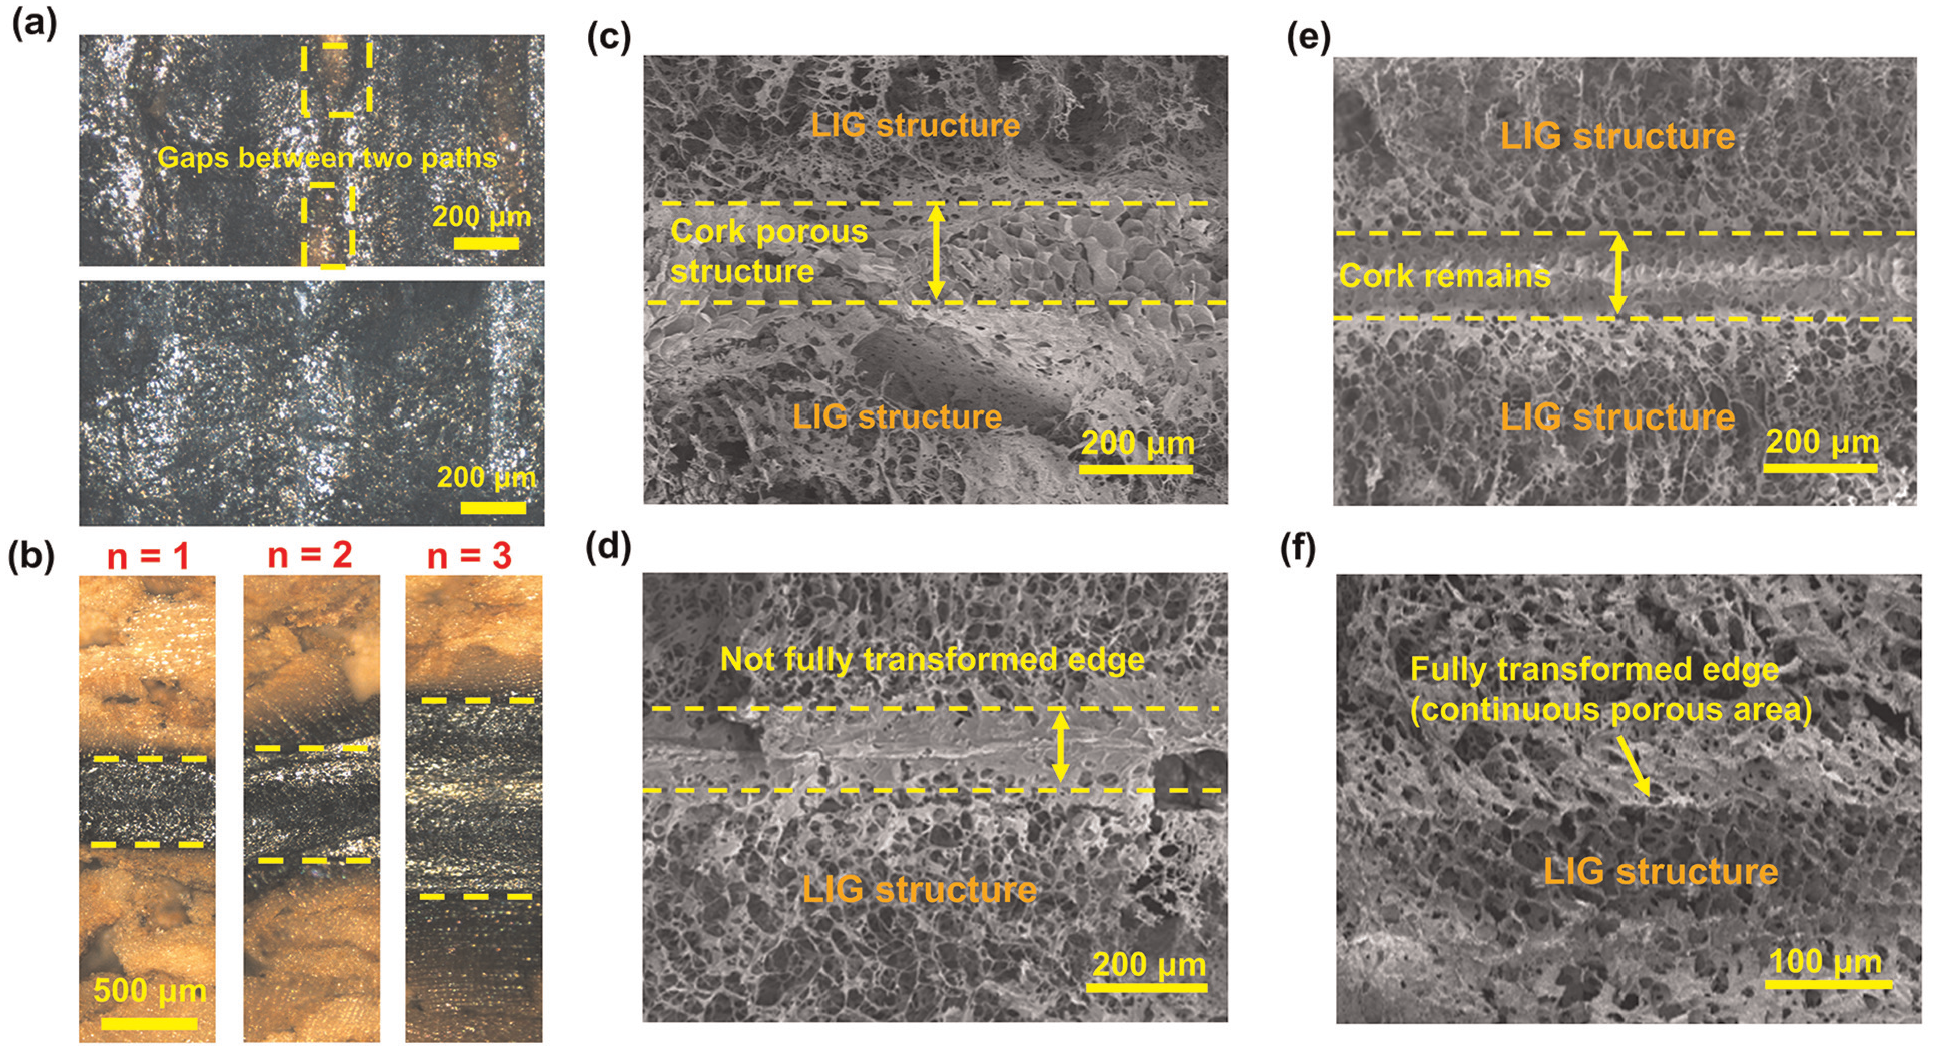
Microscope and SEM images of LIG microstructure (viewed from top). (a) The microscope images of LIG pattern under one-time scanning with 100% power (top) and two-time scanning with 50% power (bottom). (b) The LIG single line pass at 50% power under n = 1–3 times scanning (left to right). The SEM images of (c) sample LIG-1T-1.25. (d) Sample LIG-2T-1.25. (e) Sample LIG-1T-1.88. (f) Sample LIG- 2T-1.88.
To develop the correlation between LIG morphology and the laser parameters at the irradiation area, it is necessary to quantify the irradiation energy encompassing all the lasing parameters. The dynamical fluence energy F (J/mm2), which estimates the energy injected into the scanning path encased by the laser spot, can be calculated as follows in equation (1):
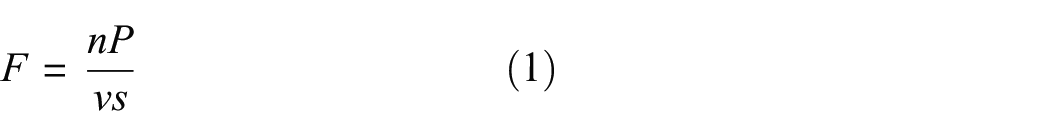
which is a function of laser power P, number of scanning pass n, scanning speed v and laser spot radius s. The cross-section profile of each LIG line under different dynamical fluence energy is shown in the SEM images in Figure 5 and is well described by a Gaussian distribution. The Gaussian profile of the carbonised area follows the hardware laser beam’s intensity Gaussian distribution; therefore,the thermal energy spatial distribution and material ablation on the cork substrate equally adheres to this profile. For F = 0.75 J/mm2 (Figure 5(a)), the carbonization area shows a concave curve with the lowest depth. With increasing F values, the carbonised cross-section curve displays a sharper edge, and the overall depth of penetration increases substantially (Figure 5(b)–(d)). Fifteen representative points on each cross-sectional profile were used and fitted with a Gaussian distribution (the yellow curves in the figure), enabling the calculation of geometrical parameters such as line width w, depth D and arc tilt angle θ (at half Dmax; Figure 5(e)). The results confirm that the carbonised LIG profile conforms with the Gaussian irradiance profile of the laser beam. The cross-sectional images demonstrate how irradiation energy (F) relates to the LIG line profile. By adjusting laser parameters, it is possible to increase both depth Dmax (from 230 to 510 μm) and line width w (from 440 to 780 μm). However, the arc tilt angle is more closely related to the laser power than the number of scans. The higher laser power results in a steeper slope and the second pass at the same laser power significantly increases the depth of the contour while maintaining a similar arc tilt angle. This study of LIG geometry and laser parameters provides a design guideline to obtain the optimum LIG geometry to fit certain applications given a cork substrate thickness.
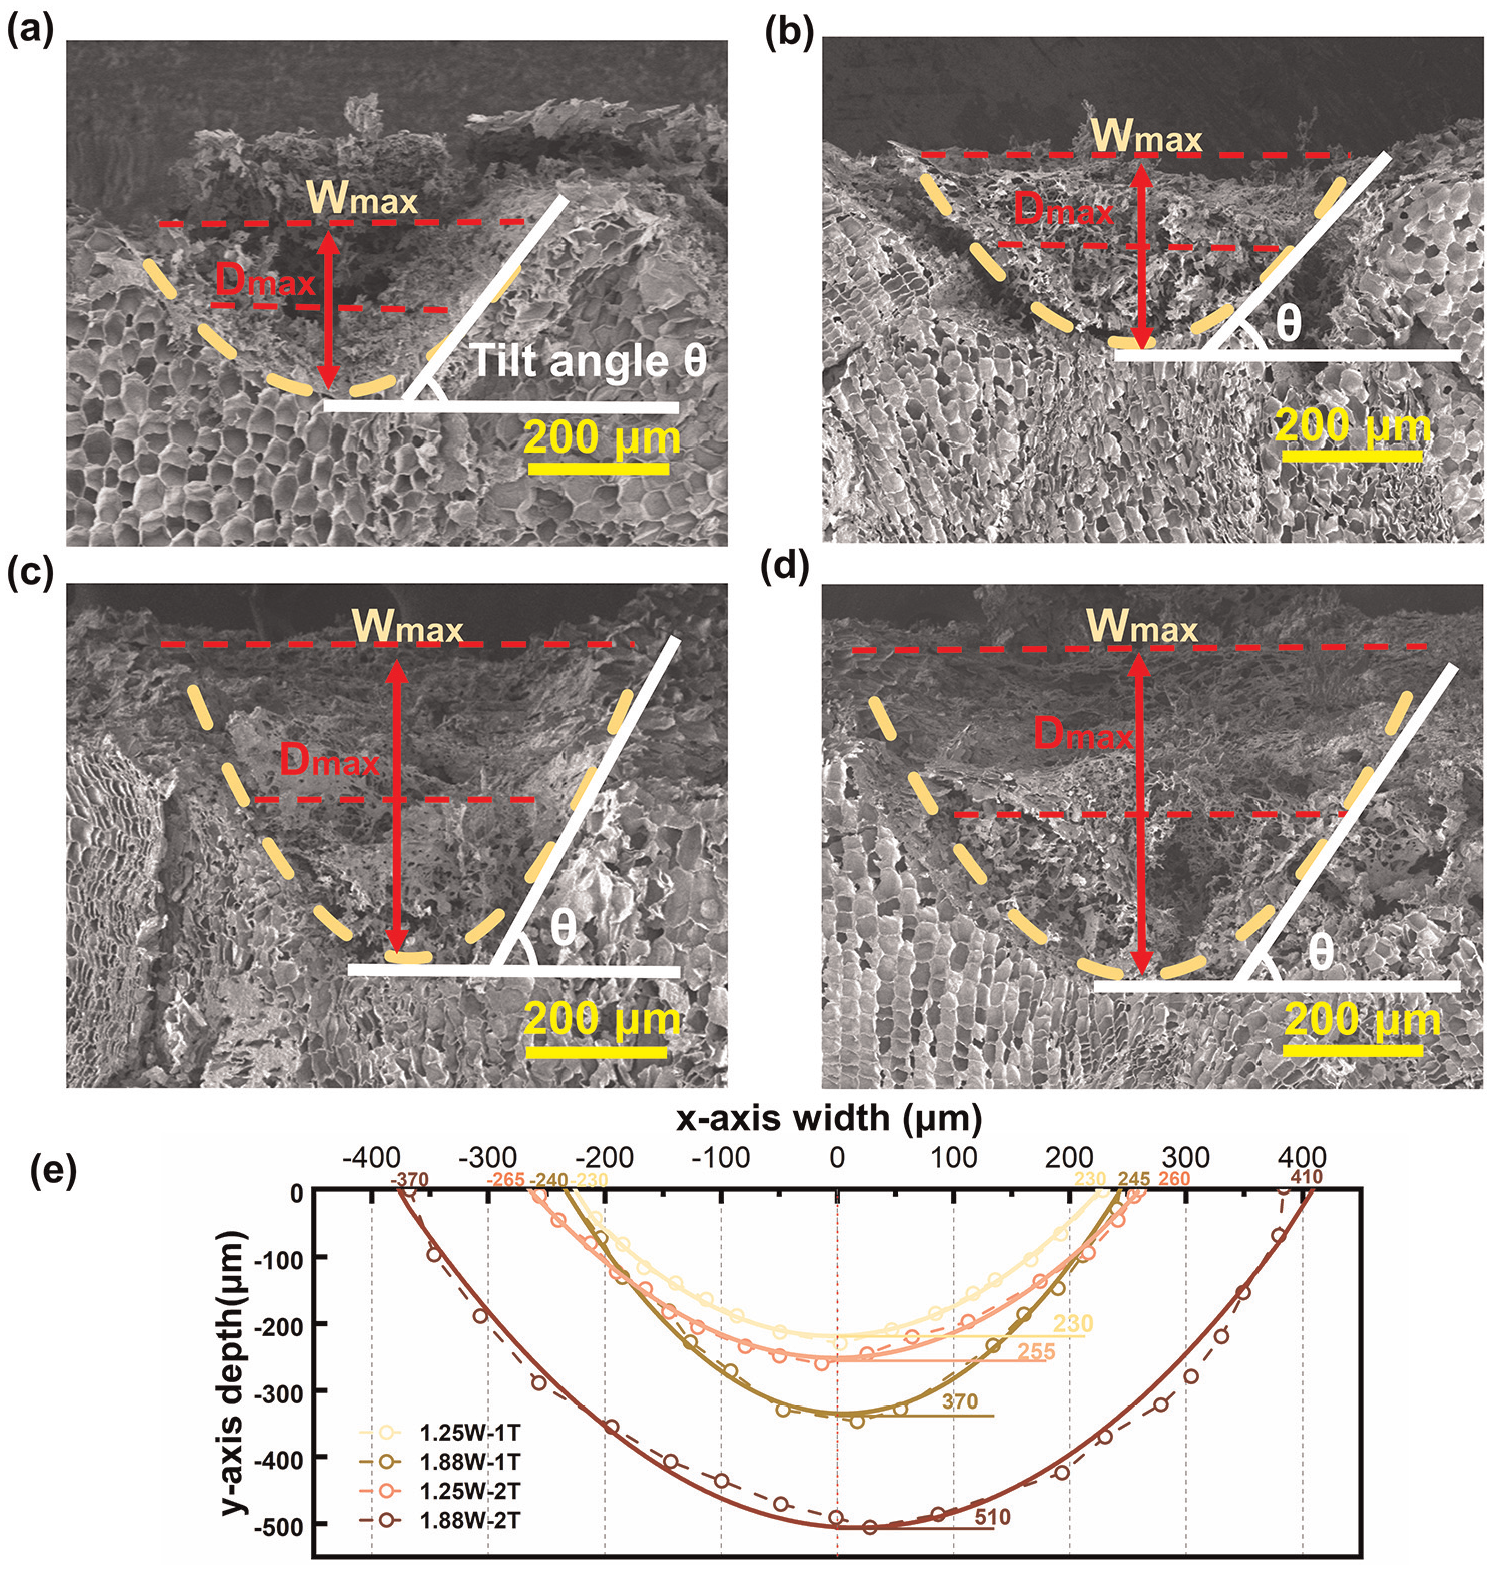
SEM images showing the cross-section of single LIG lines and the relationship with F values. (a) LIG-1T-1.25, F = 0.75 J/mm2. (b) LIG-2T-1.25, F = 1.5 J/mm2. (c) LIG-1T-1.88, F = 1.13 J/mm2. (d) LIG-2T-1.88, F = 2.25 J/mm2. (e) Comparison of the LIG cross-section profiles with varying laser energy at a constant scanning speed of 16.67 mm/s. The profile is fitted using a Gaussian distribution.
Raman spectroscopy is commonly applied for identifying and analysing the structure of graphene materials. 48 With the lasing power fixed at 1.25 W, the results of Raman spectroscopy reveal a distinct change in the LIG structure from a single pass up to three passes, as shown in Figure 6(a). The characteristic peaks of the D, G and 2D peaks, located at 1350, 1580 and 2700 cm-1, respectively, indicate the presence of graphene in each of the three samples. Between the first to third time lasing passes, the decrease in ID/IG ratio in the second pass indicates reduced defect density and improved sp2 crystallinity in the graphene structure. Simultaneously, the increasing I2D/IG ratio suggests a transition towards fewer graphene layers and enhanced electrical property. The slightly leftward shift (red-shift) of the 2D peak typically signifies reduced strain on the graphene lattice. These spectral changes altogether indicate the evolution towards higher-quality, less-defective graphene with fewer layers and diminished external perturbations for the second laser passes. After the second lasing, there is a noticeable increase in the I2D/IG ratio and significant growth in the 2D peaks, indicating that the additional scanning can improve the quality of the graphene. However, the broader 2D peaks and the increased ID/IG ratio after the third pass of lasing indicate a rise in the LIG structural defects. It again confirms that two lasing passes give the optimum graphene structure.
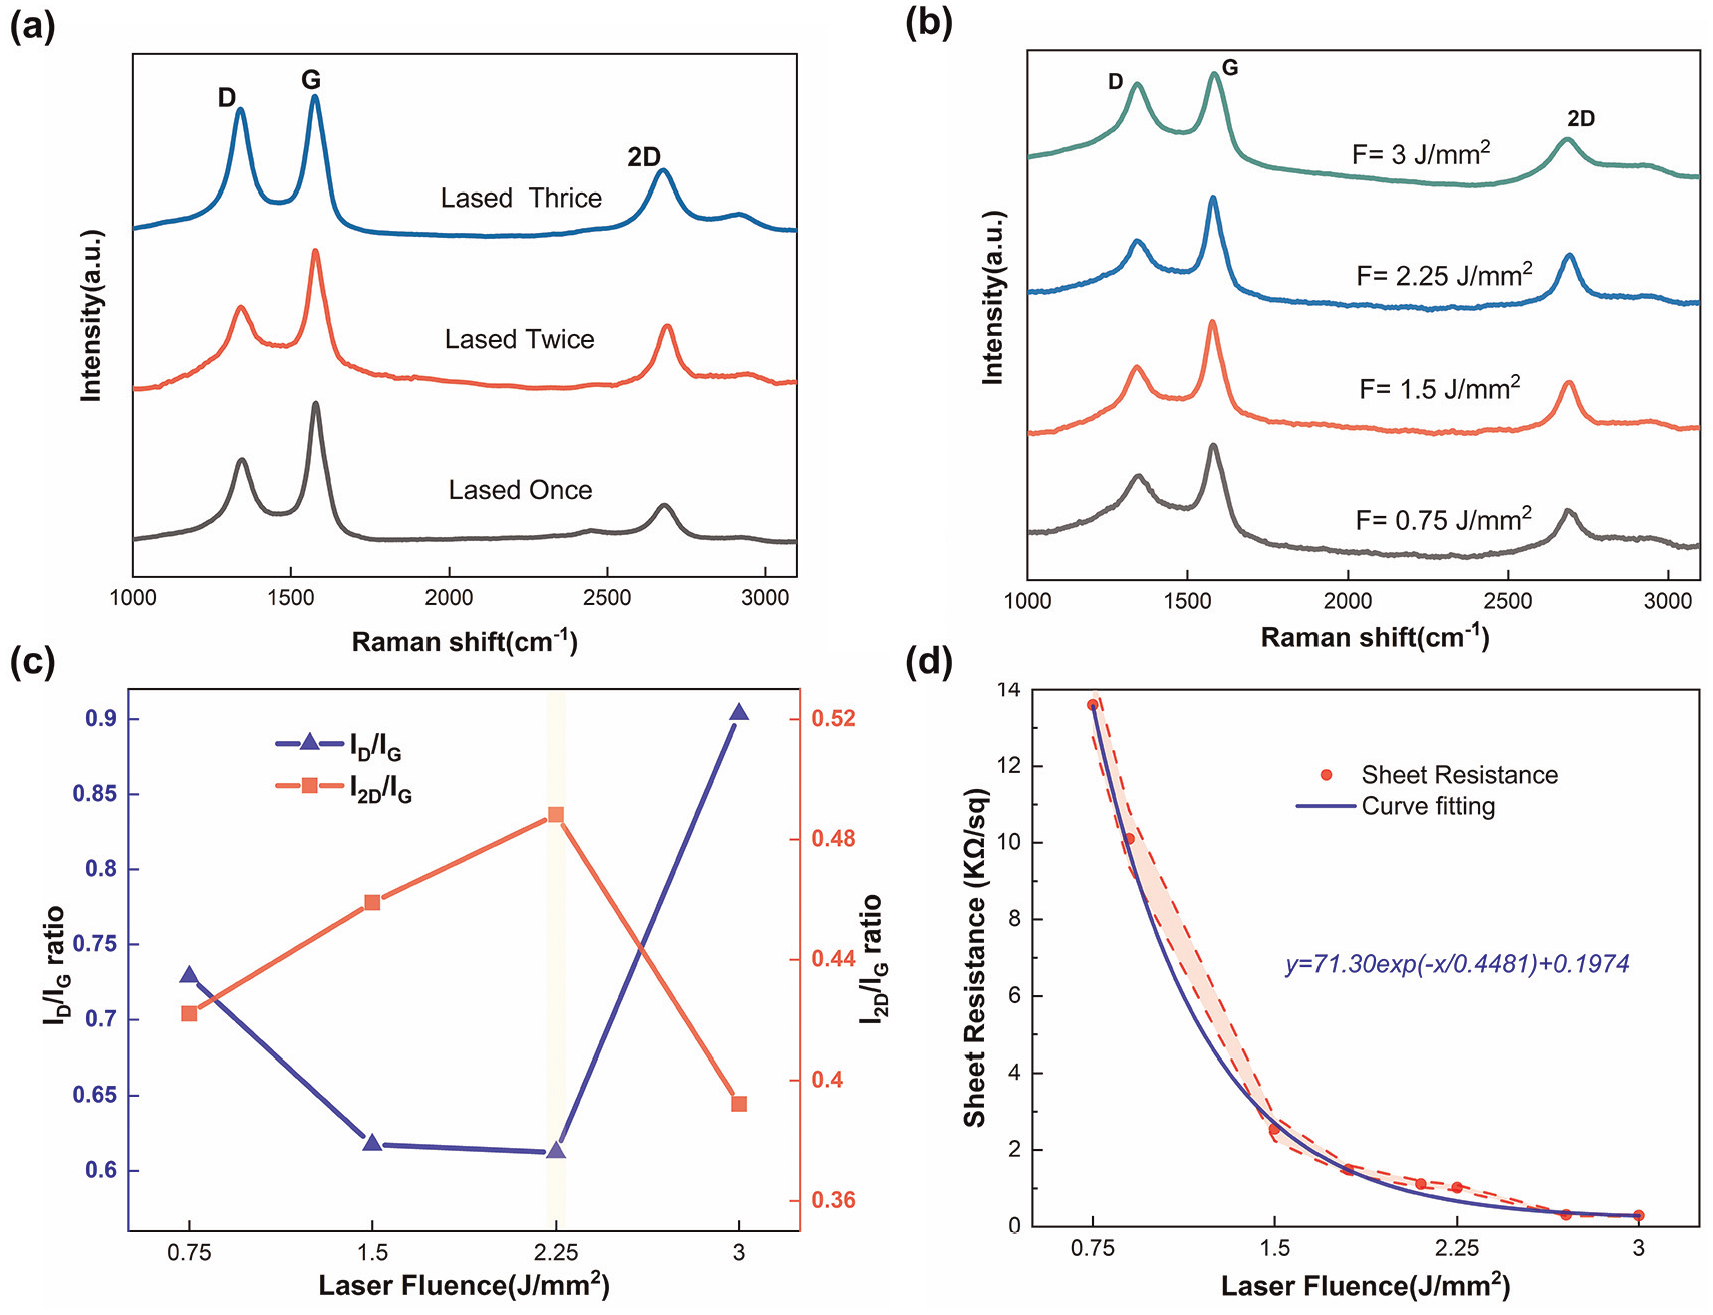
(a) Raman spectra of one lasing pass, two lasing passes and three lasing passes on cork paper at the power of 1.25 W; (b) Raman spectra of LIG processed under two-time lasing with varied F value; (c) ID/IG and I2D/IG ratios of LIG at different F values; (d) empirical relation between sheet resistance of LIG and laser fluence. (The red region between the dashed lines represents the error domain.)
Figure 6(b) compares the representative Raman spectra of LIG generated at fluence ranging from 0.75 to 3 J/mm2 (referring to lasing power from 0.625 to 2.5 W) for two lasing passes, while Figure 6(c) summarises the corresponding intensity peak ratios as a function of laser fluence. The decreasing ID/IG intensity ratio and the increasing I2D/IG intensity ratio from 0.75 to 2.25 J/mm2 indicate the creation of graphene materials with fewer structural defects and fewer layers. As the fluence energy reaches 3 J/mm2, greater structural defects and additional graphenic layers appear, revealing that the 2.25 J/mm2 energy fluence produces graphene of the highest quality among the four chosen fluence values. The exponential relation between SR and laser energy fluence is depicted in Figure 6(d). Within the range of fluence values investigated in this study, an empirical relation SR = 71.30exp(−F/0.4481) + 0.1974 can be defined after curve fitting. The electrical conductivity improves with increasing laser fluence as more sp 2 carbon bonds break and sp 3 carbon bonds are produced. Nevertheless, there is no significant change in SR after 2.1 J/mm2. At higher laser fluence, the SR only decreases slightly, but its ID/IG ratio increases indicating increasing structural defects in the graphene, and therefore a lower LIG quality. So any further decrease in SR after 2.25 J/mm2 is simply due to the increase in the thickness of lower quality LIG. At the optimal point where F = 2.25 J/mm2, a good balance of the electrical conductivity, the quality of the characteristics and the degree of substrate distortion is achieved. Consequently, the LIG used in the mesh pattern for damage detection was synthesised at F = 2.25 J/mm2 achieved by having two lasing passes at the power of 1.88 W, that is LIG-2T-1.88.
Damage sensing of LIG in composites
The advantage of LIG production from cork paper via a laser engraving process is that it allows bespoke designs of complex patterns for large-scale sensing with thermal stability. The initial electrical resistance reading of the LIG in the cork layer when incorporated as a core material within composite laminate also remains stable (fluctuating within 0.8%) when left unloaded in the room environment for 5 days. The embedment of cork within the composite matrix mitigates the influence of ambient conditions on the electrical characteristics of cork-LIG, thereby conferring a stable initial baseline for subsequent damage-sensing applications. This section demonstrates the impact sensing capability of a 2D LIG mesh pattern with 18 independent channels, as described in the experimental section (‘Fabrication of LIG damage-sensing composites’ section). Following the characterisation study in ‘Microstructural and electrical properties of LIG’ section, the combination of lasing parameters in LIG-2T-1.88 was selected to create the LIG mesh pattern on the cork paper before being embedded as the damage-sensing layer in the glass fibre composites. Following the impact event, damage such as interlaminar delamination especially at the interface between the cork core layer and the composite face sheet can be observed through the translucent nature of the glass fibre composite plates. Damage in the form of crack opening and graphene pull-out perturbs the LIG microstructure, hence increasing the electrical resistance. When the change in electrical resistance of the LIG channel exceeds the damage threshold value of 1 std, as described in ‘LIG sensor working concept and data processing with ML’ section, it is used as an indicator of damage in the LIG channel. Knowing the number of damaged channels and their spacing in the horizontal and vertical directions, similar to x- and y-coordinates in a Cartesian coordinate system, one can uniquely determine the position of the impact damage and the damage size. Figure 7 displays the resistance change for each channel of the six plates, along with the corresponding threshold line used to distinguish the damaged channels. Four out of the six plates (Meshes 1–4) were impacted in the middle with a 4.5 mm LIG channel spacing, whereas the remaining two (Mesh 5 and 6) were impacted near the edge of the plate with channels having an 8–9 mm channel spacing. The channels with resistance changes that exceeded the threshold are highlighted in beige in the figure indicating damaged channels.
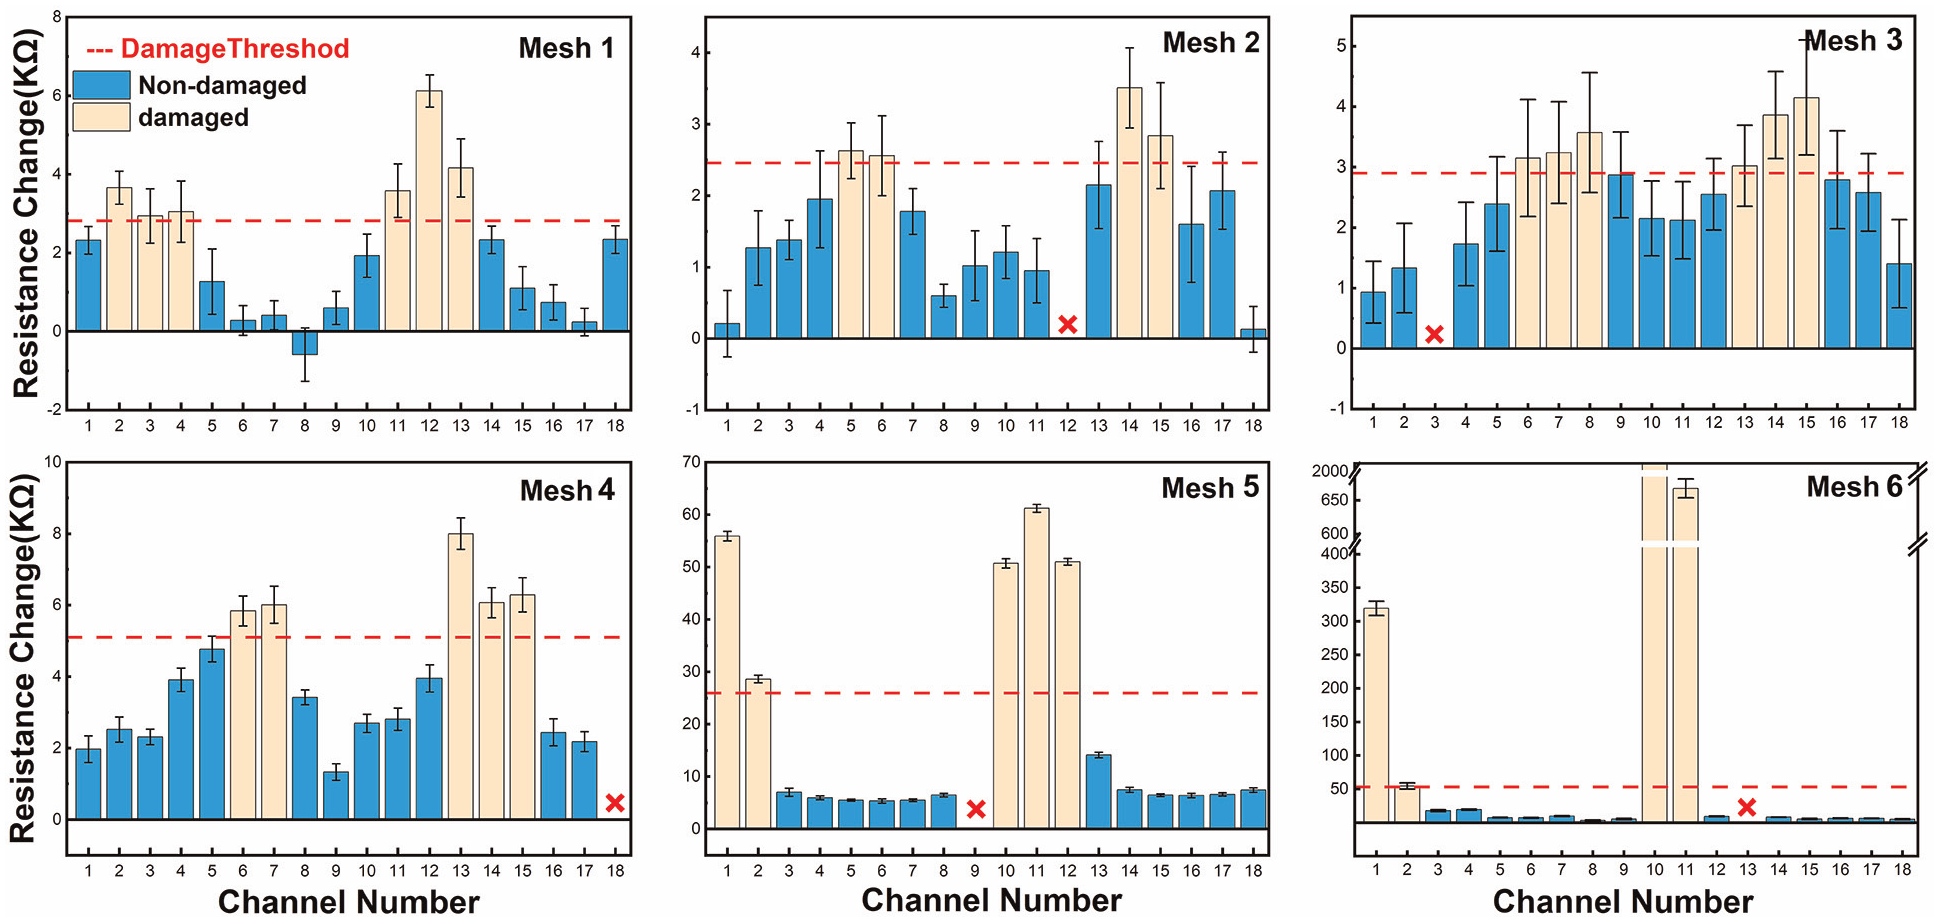
The channel-by-channel resistance change of the LIG mesh after the impact event of 10 J of six composite plates. Meshes 1–4 were impacted in the centre of the plate, while meshes 5 and 6 at the edge of the plate. The red dash lines show the damage threshold (1 std) calculated by normal distributions. The red cross represents the disconnected damaged channels.
The results of channel resistance changes can be translated to a 2D damage heatmap to indicate the damage location and its size on the composite plates. Each horizontal and vertical LIG channel was assigned a binary number for damage condition classification after impact, that is 0 when undamaged and 1 when damaged. Damage heatmaps were generated by summing the binary values at the location where the horizontal and vertical LIG channels intersect, as shown in Figure 8 (right). The intersection points having values equal to 2, therefore, marking the damaged area and its frequency of appearance on the plate can provide an estimate of the damage size. The damage-sensing capability of the LIG channels was assessed by comparing the damage heatmaps with the scan results of X-ray CT of the same specimens. The CT images of the plates were reconstructed focusing on the interface between the top face sheet and the cork layer, therefore, offer the direct visualisation of the internal damage. The CT images were converted to grayscale representations before further processing. To enhance the visualisation of the CT results, the damaged or delaminated regions were highlighted in red utilising the masking function (cvtColor) in the VGSTUDIO software. This masking process capitalised on the discrepancy in the grayscale values between the solid and air regions (i.e. delamination opening) within the plates. The comparison reveals a strong correlation between the electrical resistance heatmap and the presence of damaged channels observed in the CT images, confirming the sensing capability of the resistance-based LIG mesh for detecting impact damage. It is worth to highlight that at this stage the damage classification of the LIG channels was all processed manually using the simple standard deviation damage threshold without the KNN model. The good agreement between the measured and CT scan results shows that 1 std is a sensible choice.
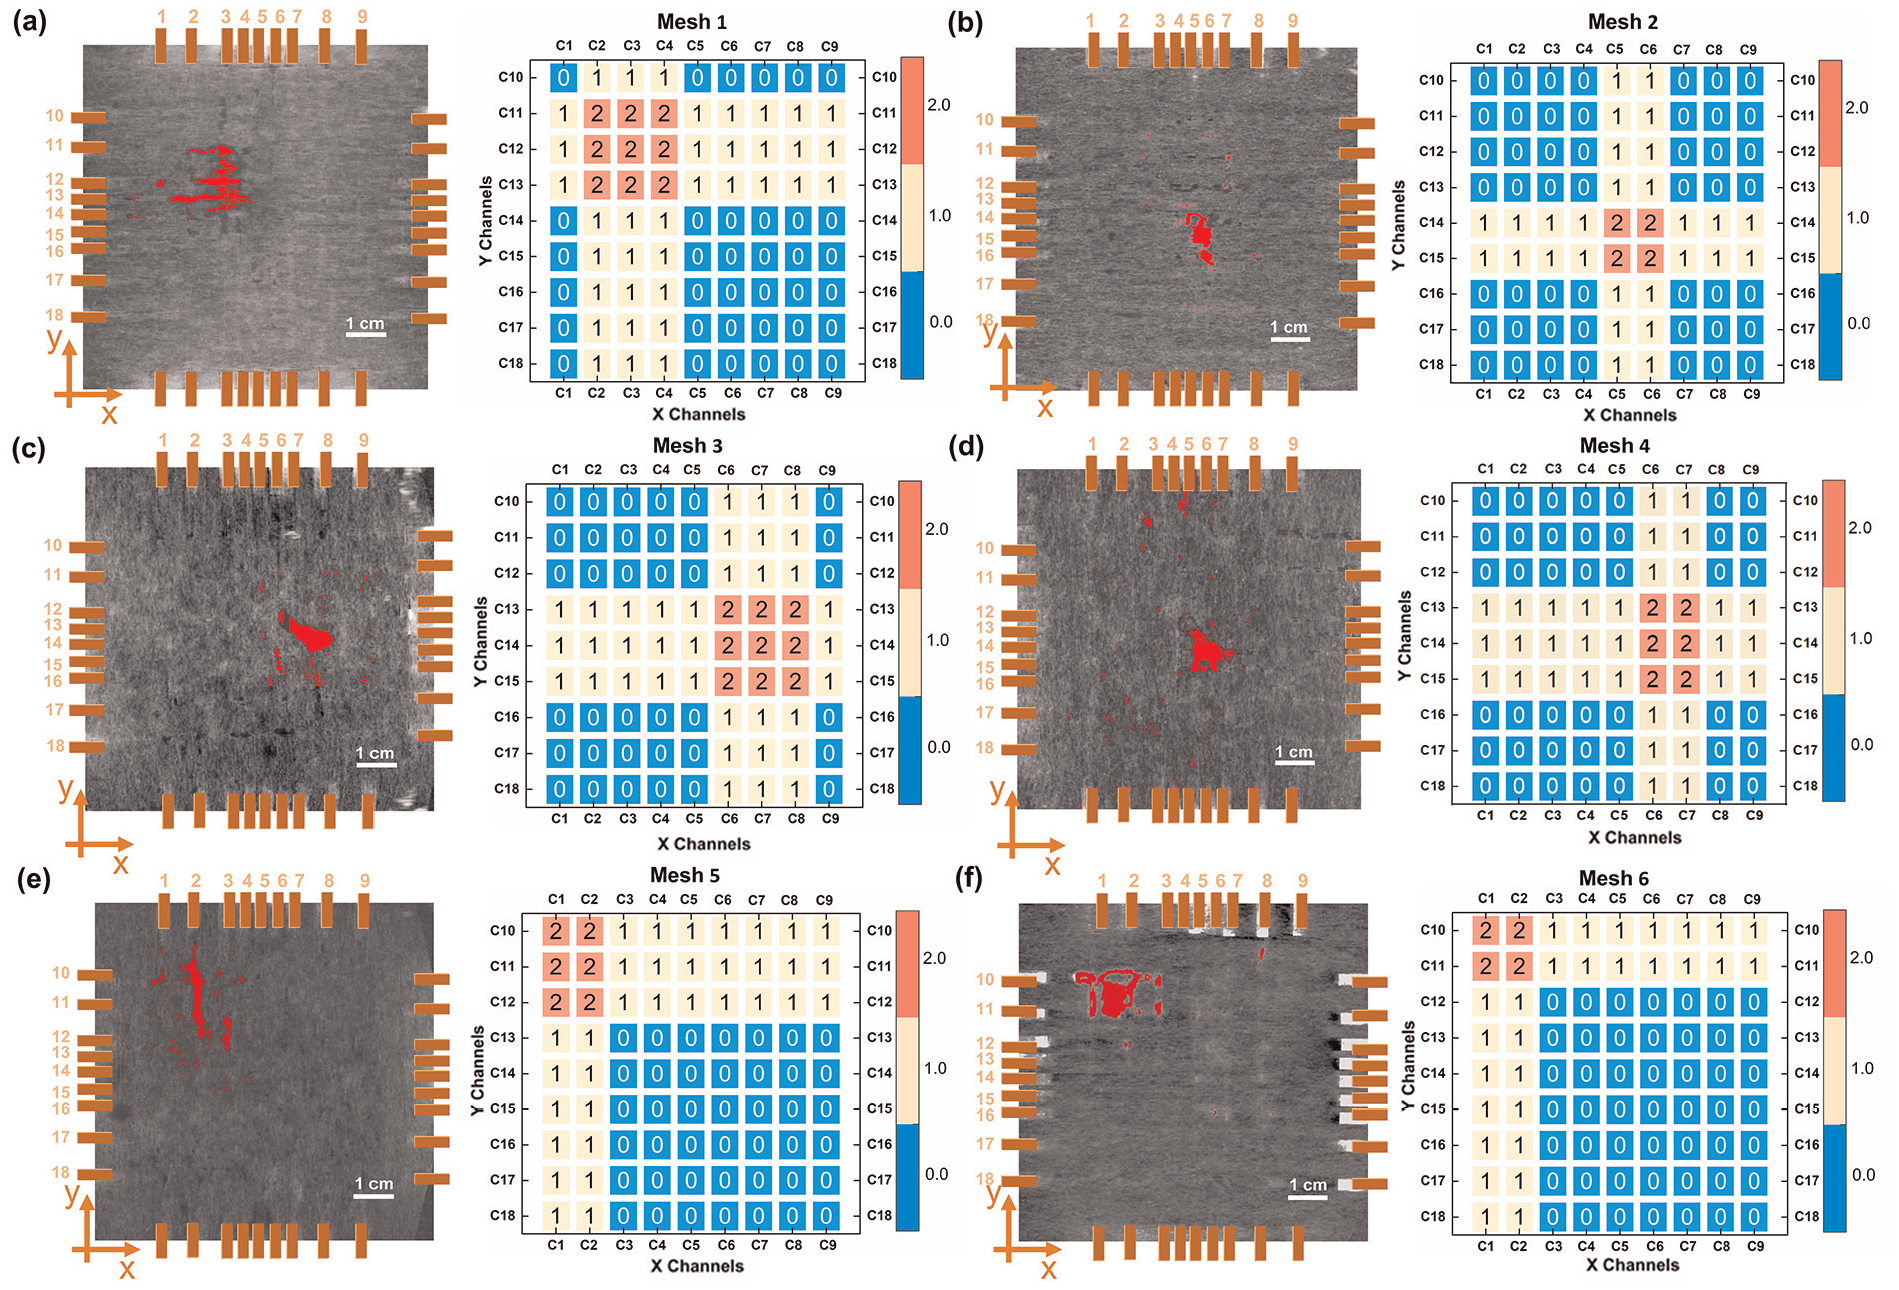
The damage heatmaps (right) generated based on channel-by-channel resistance change and compared against X-ray CT images (left) for (a) Mesh 1, (b) Mesh 2, (c) Mesh 3, (d) Mesh 4, (e) Mesh 5, (f) Mesh 6. The delaminated regions are highlighted in red in the CT images.
Performance of KNN model prediction
The mesh design of the LIG channels can be integrated with ML algorithms to develop a non-destructive monitoring for composite structural health when facing different impact scenarios in real life. Since the damage status of each LIG channel is classified into a binary outcome, either damaged or non-damaged, a straightforward classification objective can be posed. All the input parameters and definitions used in the model training are summarised in Table 1. The synthetic minority oversampling technique (SMOTE) was then used to synthesise additional minority samples and adjust the imbalance between damaged and undamaged channels; therefore, the model will be balanced without inclination to predict the damaged channels as non-damaged. 49 The output of the model was the prediction result in the form of a binary value of 0 or 1, which indicates a non-damaged or damaged channel. The accuracy score of the KNN model can be determined by comparing its predictions to the X-ray CT results of the three validation plates.
The training inputs for the KNN model and the data pre-processing methods before the model training.
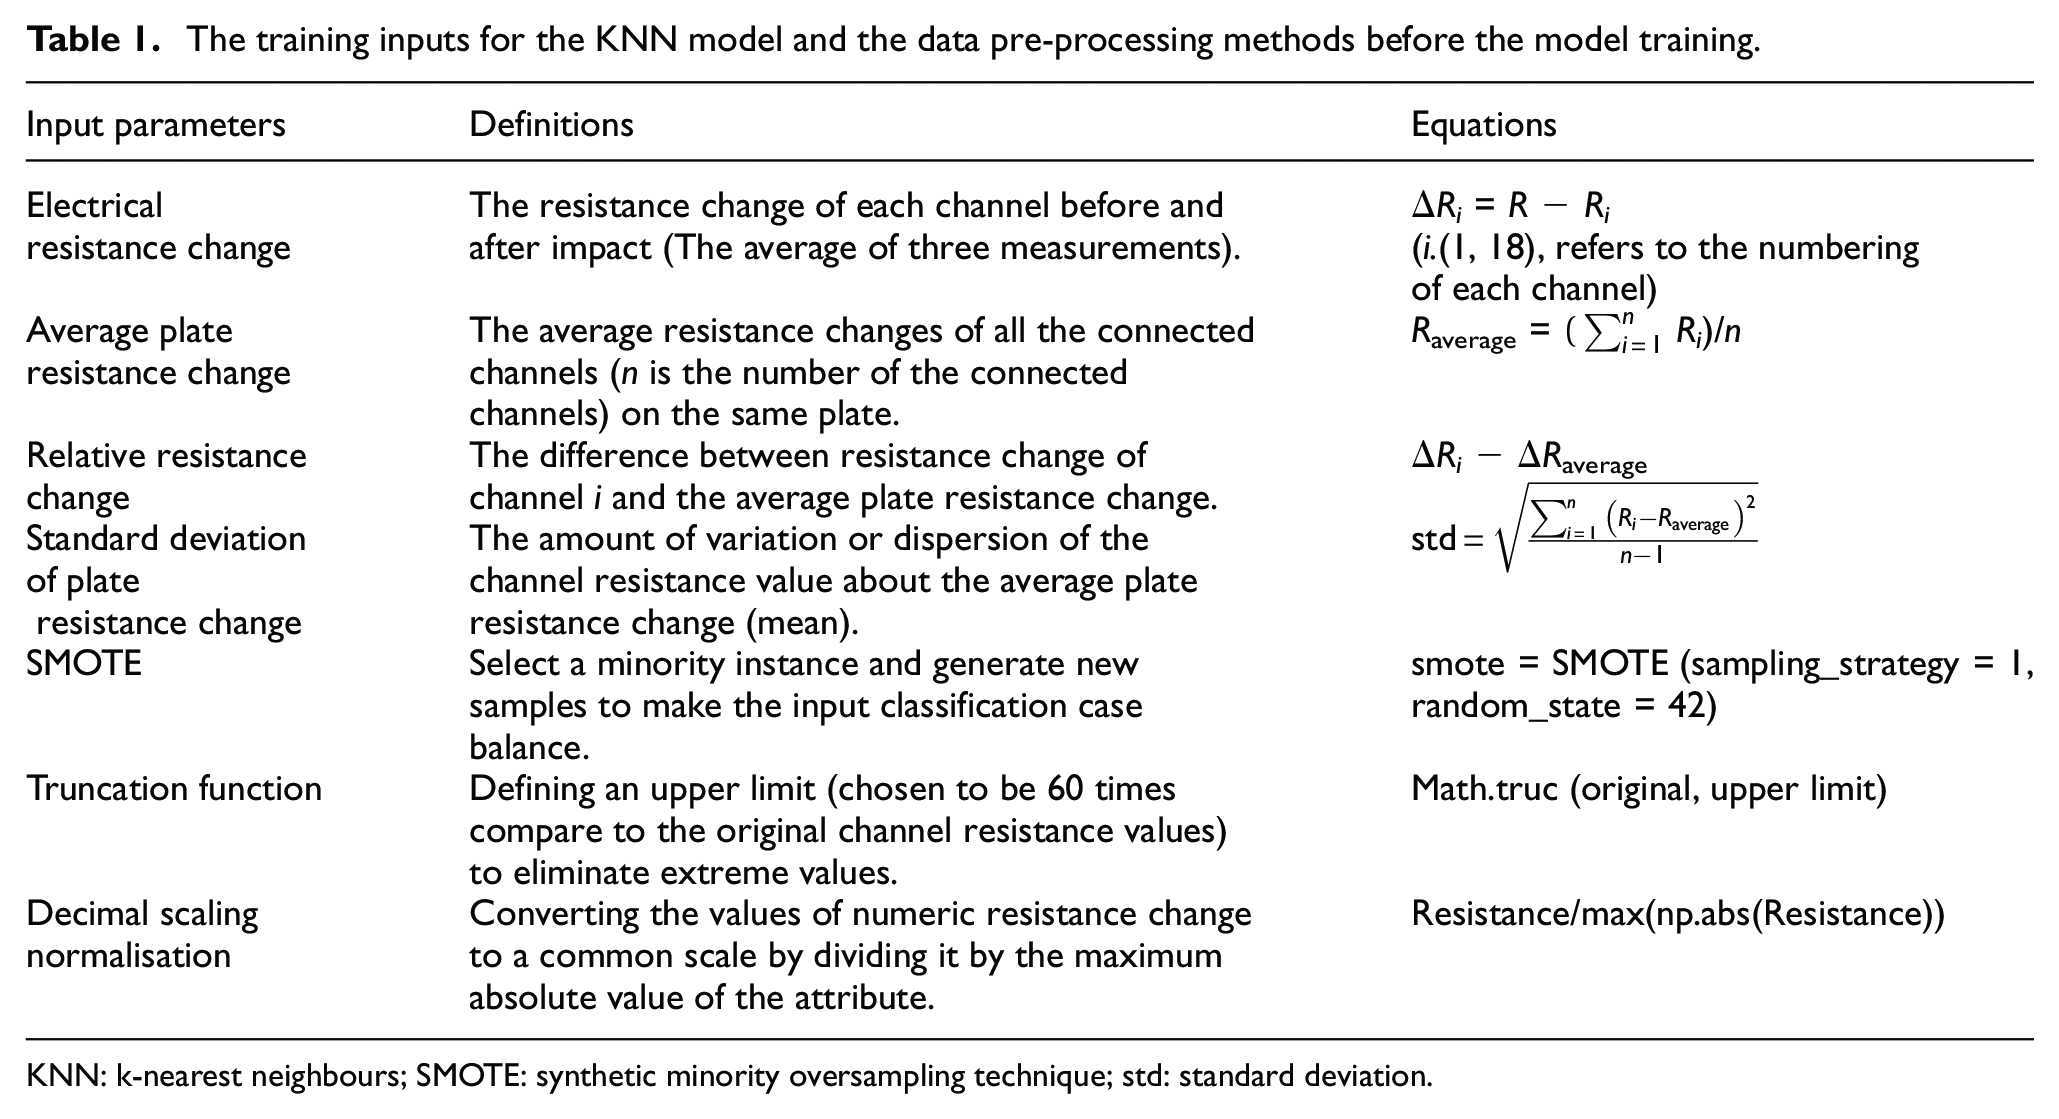
KNN: k-nearest neighbours; SMOTE: synthetic minority oversampling technique; std: standard deviation.
The training accuracy is calculated based on the mean accuracy of a 10-fold cross-validation test against various values of K neighbours. A total of 103 data points (m) were collected from the six plates discussed in the previous section for training purpose. Figure 9 depicts the training accuracy with different hyperparameters in the KNN model. After optimising the hyperparameters of the KNN model through the grid search method, the K values = 5 were selected with a distance threshold set at 0.4, using the Euclidean distance metric and Gaussian Kernel weighting method. 44 This configuration was determined based on the criteria of maximising the overall accuracy while minimising the false negative (FN) rate, which corresponds to cases where the presence of damage was not detected. To evaluate the KNN model’s predictive performance on new cases, especially across various impact energies, it was tested against three additional plates (i.e. Mesh 7, Mesh 8 and Mesh 9) with impact energies of 10 and 12 J applied at the centre and 15 J at the edge of the plates.
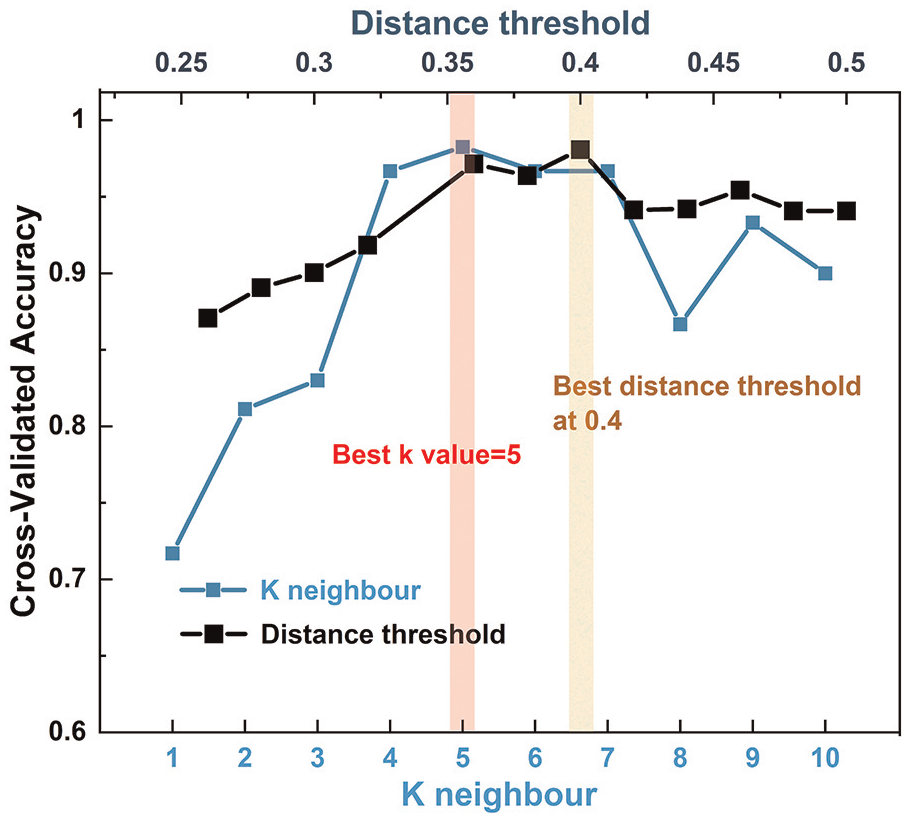
The 10-fold cross-validation test accuracy at different k values and distance thresholds.
The prediction results by the KNN model for the test (validation) cases are shown in Figure 10, compared against the results predicted by the manual statistical approach using the fixed 1 std as the damage threshold. Table 2 summarises the performance of the KNN model using the classical statistical framework of a confusion matrix, 50 showing 3 false positives (FP = 3) and 0 FN (FN = 0). From a risk mitigation perspective, it is preferable for the model to err on the side of FP predictions rather than FN. FP predictions, while potentially leading to unnecessary inspections, pose a lesser risk compared to the potential consequences of FN, which fail to detect the presence of damage and can result in catastrophic failure or outcomes. To facilitate result visualisation, the CT scan results were also converted into the same damage heatmap in Figure 10. For the test case of 10 J, both manual statistical and ML approaches give 100% agreement with the CT scan results in terms of damage location and size. This is expected as the manual statistical approach has already been proven in ‘Damage sensing of LIG in composites’ section for the impact energy of 10 J, while the KNN model was trained using datasets of the same impact energy level of 10 J. In the case of 12 J, both the manual statistical approach and the KNN model overestimate the extent of damage, treating the undamaged LIG channels areas in close proximity to impact zone as damaged. However, at the highest impact energy level of 15 J, the manual statistical approach underestimates the damage area resulting in two LIG channels with FN, while the KNN model continues to slightly overestimate the damage area. Overall, the KNN model demonstrated greater reliability and consistency in damage area estimation across varying impact energies, especially in identifying damage in high-energy impact scenarios from the conservative perspective.
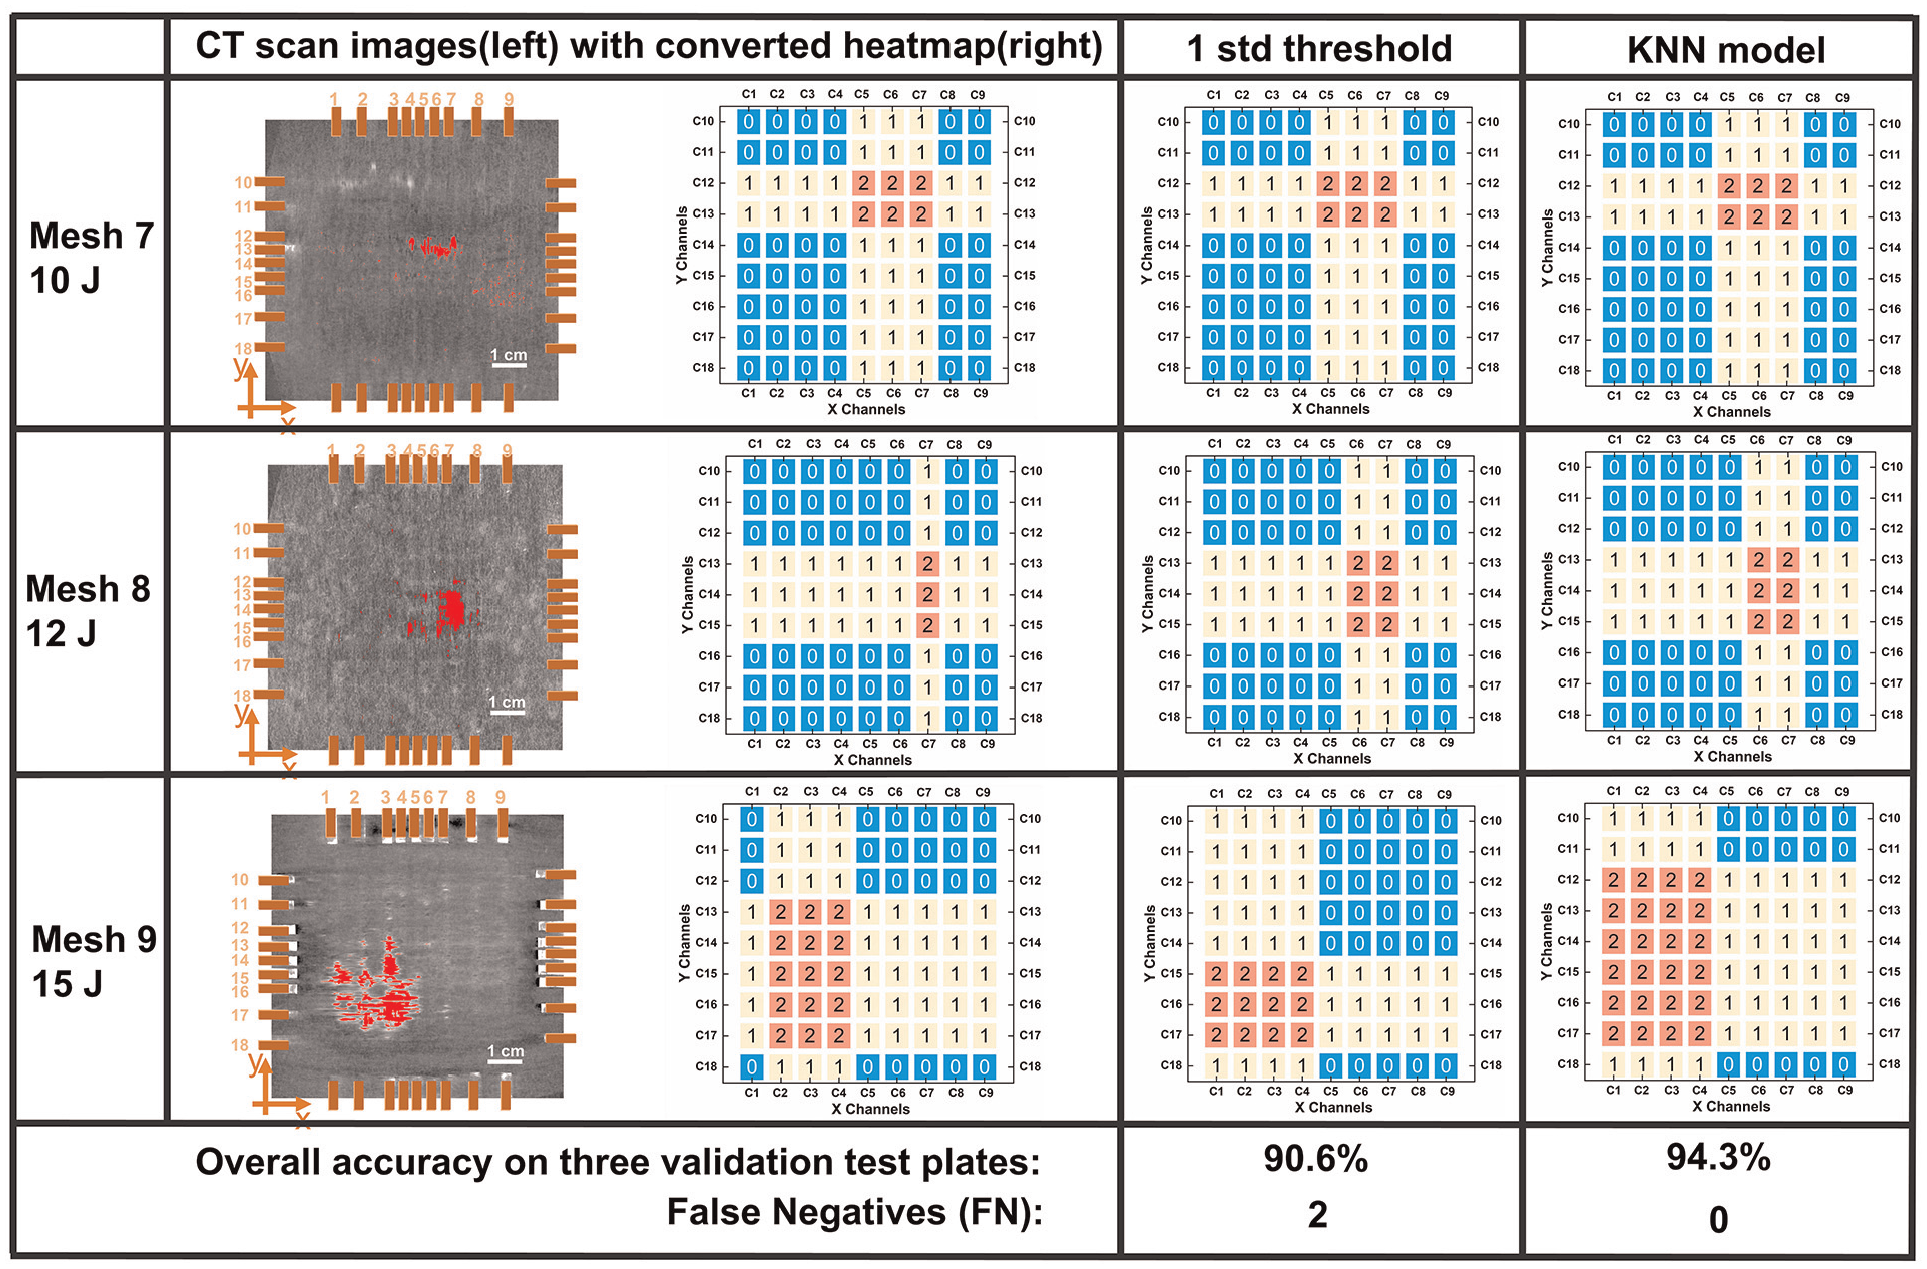
The three validation test plates after impact damage at different energies. First column – CT scan images with the actual damage area highlighted in red and converted heatmap based on the CT scan results; second column – prediction by the 1 std threshold method; third column – prediction by the KNN model.
The confusion matrix result reporting TP, TN, FP and FN for the KNN model evaluation.
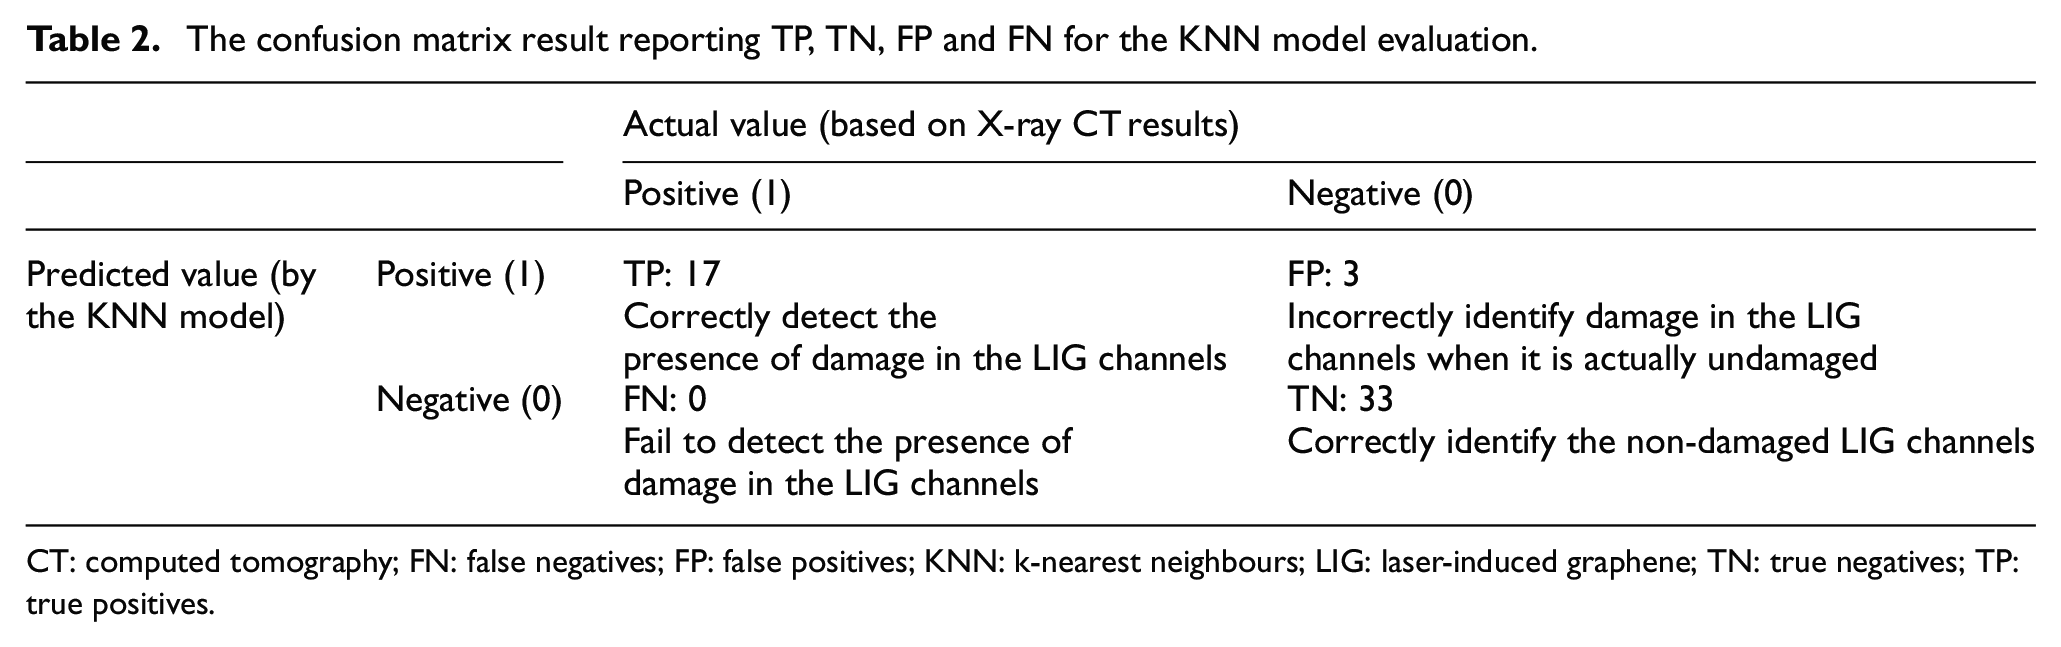
CT: computed tomography; FN: false negatives; FP: false positives; KNN: k-nearest neighbours; LIG: laser-induced graphene; TN: true negatives; TP: true positives.
Figure 11 shows the data distribution of the training dataset and the prediction results for test (validation) datasets on the same plot. Each data point corresponds to one channel, and the erroneous prediction by the KNN model is highlighted in maroon (those data points with a cross). The KNN’s strength lies in its ability to better handle individual outliers compared to a rigid threshold. As a result, KNN tends to establish localised thresholds that adapt to specific data regions, rather than applying a global threshold across the entire dataset. This adaptive approach allows KNN to capture nuanced variations in new cases with higher accuracy. Overall, the KNN model demonstrated a high level of predictive performance, with an impressive overall accuracy rate of 94.3%. The algorithm successfully identified all damaged channels. However, the model also incorrectly identified three healthy channels as damaged channels (FP points in maroon colour). These were the borderline data points belonging to LIG channels with resistance changes close to the damage threshold value due to the greater impact energy compared to the training dataset. The recall rate and precision for the damaged channel are 1 and 0.85, respectively, while the F1-score is 0.919, which represents the harmonic mean of the binary model’s precision and recall.51,52 The use of a ML algorithm such as the weighted KNN model reduces the reliance on human effort in manually sorting the resistance changes and subjective judgement in determining the damage status, especially when dealing with a huge amount of real-time data obtained from a huge composite structure which can have a complicated LIG pattern design. The accuracy of the model can be improved further when more training data sets are provided under various loading scenarios and damage severity. To enhance fault tolerance and assure structural safety in real-world applications, the model can be adjusted to be conservative depending on the damage tolerance level of the structure, for example by assigning all borderline data points to the ‘damaged’ category.
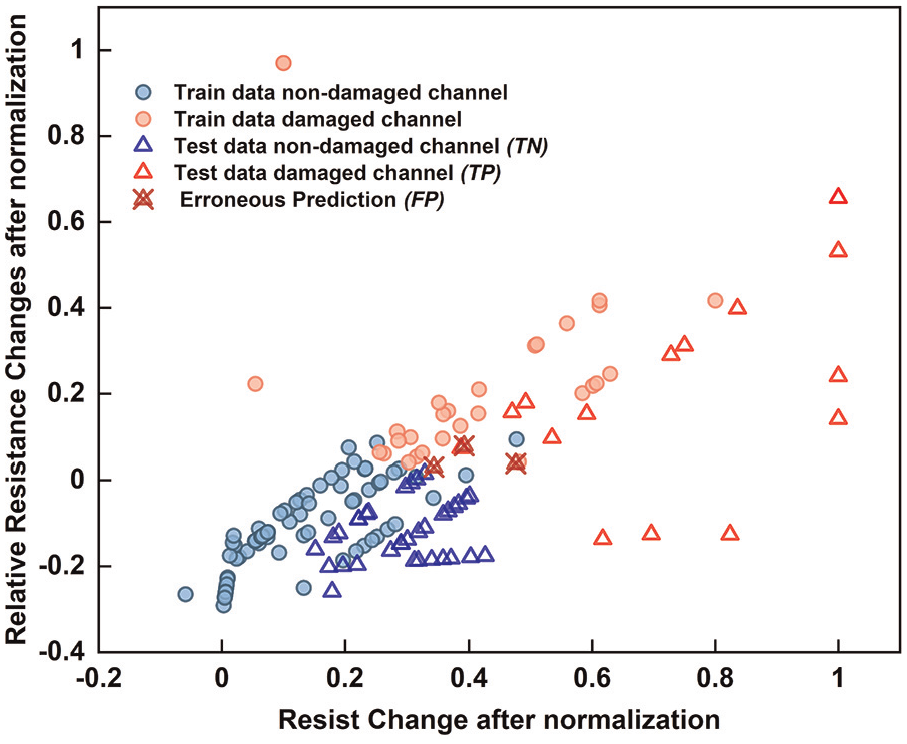
The data distribution of the resistance changes after scaling. Blue and red colour representing the non-damaged and damaged channels in both the training and validation datasets. Data points of erroneous prediction are highlighted in maroon.
Conclusions
Cork-derived LIG can be produced by an inexpensive commercially available low-power blue light laser engraving system. Cork substrate, when subjected to multiple laser scanning, transforms amorphous carbon to graphite structure without thermal deformation and can be embedded as the core material in a composite panel. By fitting the LIG profile using a Gaussian distribution, the relationship between LIG morphology and energy fluence F value can be obtained, which can be used to estimate the LIG physical parameters such as the LIG line width and depth as required by the application. A LIG mesh pattern lased on the cork substrate was then embedded in a glass fibre composite laminate as the damage-sensing core material to demonstrate its sensing potential and sensitivity for impact damage. The mesh pattern of LIG was designed to enable unique identification and estimation of impact damage size solely by electrical resistance change through a series of intersecting horizontal and vertical LIG channels. A weighted KNN model was trained using the 10 J impact test results validated by X-ray CT images. The trained model was used to predict the damage severity of various impact energies and achieved an accuracy rate of 94.3%. The sensing performance of the LIG mesh design and the accuracy of the KNN model prediction demonstrated a potential low-cost approach for monitoring structural damage in large-scale composite structures. The work presented here can be extended to different LIG pattern designs on different substrates with more sophisticated machine-learning techniques. The LIG pattern and its line density can be easily upscaled with cost-effective laser engravers and customised according to the area of interest.
In real applications for large structure, it is not feasible to apply the mesh to cover the whole area. The LIG mesh can be applied selectively at strategic or critical locations depending on the local loading conditions (e.g. compression loading is more sensitive to delamination damage compared to tensile loading) and geometric conditions (e.g. thickness, stacking sequence and proximity to local reinforcement like stiffeners or edges).53–55 For example, considering a wind turbine composite blade, it is more sensible to apply the damage sensing system at the compression side of the blade root which is more critical compared to the blade tip. Unlike strain sensing, impact damage sensing does not necessarily require real-time data acquisition. Real-time monitoring can be done by having a DAQ system onboard, while the data can be processed and stored either on-site or wirelessly off-site. Alternatively, the LIG sensing network can also be probed at any user-defined time interval or following the routine maintenance schedule, which can minimise the size of real-time data storage. However, it is inevitable that the data acquisition system will be more complicated for a bigger coverage area. The binary data used in this study will make the data acquisition process more manageable. To further boost the system’s efficiency on large datasets, the DAQ system can adopt established standardised data logging interfaces and formats.
The required resolution of the LIG sensing mesh can be modified or scaled accordingly based on the local critical damage size which can be determined experimentally or numerically using Finite Element Analysis (FEA), 54 and the required damage tolerance level of the composite structure. Given that composite structures are typically designed conservatively with some safety factor, they can have sufficient residual strength such that minimal or no repair is required if the impact damage is smaller than the sensing resolution. However, the damage can propagate and grow to a critical size over time which can affect the load-carrying capability of the structure. Therefore, it is essential to have a SHM sensing system that allows critical damage to be found and repaired in time. Future research trajectories could focus on enhancing model precision through comprehensive data collection and refined model training. Augmenting the training dataset with additional test samples for different impact energy levels and impact scenarios would enable more robust handling of discontinuities and outliers, mitigating overfitting concerns when employing more advanced ML algorithms in the future. The development of a hybrid ML algorithm, for example, the neural network can potentially incorporate both classification and regression components with better accuracy. Overall, the developed LIG-embedded sensing composite system can pave the way for SHM in engineering structures regardless of shape and size.
Footnotes
Declaration of conflicting interests
The author(s) declared no potential conflicts of interest with respect to the research, authorship and/or publication of this article.
Funding
The author(s) disclosed receipt of the following financial support for the research, authorship and/or publication of this article: The authors acknowledge the funding from Ministry of Higher Education (MoHE) under the Fundamental Research Grant Scheme (FRGS; FRGS/1/2021/TK0/USMC/03/4) and the PhD studentship from University of Southampton Malaysia and School of Engineering, University of Southampton. The authors also acknowledge the µ-VIS X-Ray Imaging Centre at the University of Southampton for provision of tomographic imaging facilities, supported by EPSRC grant EP/T02593X/1.