
Abstract
Offshore wind turbines are large structures that operate in harsh marine environments and are susceptible to structural damage over time. Continuous monitoring of wind turbine’s structural health is crucial for early damage detection and prevention of catastrophic failures. This study proposes a methodology for the detection of bolt loosening in the jacket support structure of offshore wind turbines. Bolt connections can self-loosen over time due to dynamic loading and vibrations of the turbine structure, and if left undetected, this loosening can lead to joint fatigue and failure. Visual inspections have limitations for detecting bolt loosening, especially in hard-to-access areas such as submerged parts. Vibration-based structural health monitoring enables continuous automated detection. This work uses vibration data acquired from a laboratory model of a downscaled wind turbine under various simulated healthy and damaged conditions. The methodology uses principal component analysis to transform the data and calculate the Mahalanobis distance of the new measurements with respect to a baseline healthy data set. Distances that exceed a statistically determined threshold indicate abnormal behavior and damage. One key advantage of the proposed technique is that it only requires vibration data from the undamaged (healthy) structure to establish the baseline model and thresholds. The vibration data under damaged conditions are used exclusively for testing the methodology and demonstrating its performance. In fact, the technique shows excellent detection accuracy for incipient bolt-loosening damage with minimal false alarms.
Keywords
Introduction
Offshore wind energy is a crucial and sustainable alternative that significantly contributes to reducing carbon emissions.1,2 The transition to renewable energy sources, such as offshore wind, is driven primarily by environmental concerns and the urgent need to address climate change. 3 Offshore wind has a much smaller impact on the environment compared to conventional generation of electricity based on fossil fuels.4,5 Energy security and independence are also key motivations for transitioning to renewable energy sources like offshore wind. The vulnerability of power plants to attacks varies with technologies, but offshore wind energy and photovoltaic energy are less susceptible.6,7 Consequently, investments in wind turbines (WTs) have increased, leading to technological advancements that allow for the installation of larger turbines in deeper waters, thereby enhancing capacity. 8 However, with increasing turbine size and capacity, the performance and safety of WTs have become serious concerns. Over the years, structural damage and component failures have led to catastrophic accidents, decreasing trust in technology.
Structural health monitoring (SHM) is a key technology that can help address some of these concerns. ISO standards and national codes should specify the appropriate monitoring methods, sensor placement, evaluation of health conditions based on collected data, maintenance strategy planning, and remaining life prediction for specific buildings or structures. 9 SHM is a valuable diagnostic technique for detecting damage and assessing the condition of offshore structures such as WTs. 10 Vibration-based SHM, which involves monitoring the structure of a WT in real time, can provide early warning signs of potential damage, thereby minimizing maintenance costs and preventing catastrophic accidents. 11 SHM detects damage or deterioration in a structure through its response to external stimuli or physical events. 12 Its primary objective is to ensure the safety, reliability, and performance of a structure by identifying damage before it reaches a critical point. 13 SHM deploys sensors and data acquisition systems to collect information and perform data analysis, improving knowledge and reducing maintenance costs. Over the past two decades, SHM has become a significant research topic integrating various engineering fields such as sensor technology, materials science, artificial intelligence and machine learning, 14 data science, and structural engineering.
WTs are massive structures designed to harness wind energy and operate under harsh weather conditions, which cause them to undergo significant mechanical stresses.15,16 These operational conditions can lead to structural damage or material failure, potentially causing catastrophic accidents, revenue loss, and environmental damage.17,18 Neglecting SHM can result in severe consequences, including equipment failure leading, costly repairs, maintenance, and downtime. 19 Offshore fixed supports are employed to withstand WTs, providing stability to various environmental conditions.
Implementing an SHM system in WTs can enhance their safety and longevity. 20 By continuously monitoring the structure of a WT, SHM can identify damage progression, track performance changes, and assist operators in proactive maintenance scheduling. This system is cost-effective as it reduces maintenance costs by detecting damage early and preventing it from reaching critical levels. Additionally, SHM implementation can improve energy efficiency by monitoring turbine performance and identifying minor issues that can hinder optimal energy production.
Detecting damage to the jacket structure of WT is essential for ensuring its safety and longevity. 20 While visual inspection techniques are commonly used to detect surface-level damage such as cracks, corrosion, and deformation, they may not suffice for detecting internal damage or damage in hard-to-reach areas. Therefore, nondestructive testing (NDT) techniques, such as ultrasonic testing and X-ray radiography, are often employed. These NDT techniques allow for quantitative defect analysis and can detect early-stage damage, preventing catastrophic failure. SHM techniques that involve continuous monitoring of the structure’s condition using vibration sensors can also detect jacket structure damage by identifying changes in vibration modes. Vibration-based SHM has been applied for damage identification in offshore platforms and could potentially be used for WT jacket structures. However, current SHM techniques still cannot diagnose marine structure integrity in real time, though ongoing research aims to address this limitation.
Recent research has explored various techniques for SHM of offshore platforms and maritime structures. For instance, Kim et al. 21 used a cosine similarity measure to compare signals and identify damage, but this method can be computationally intensive with large datasets and less effective with similar damage patterns. Ye et al. 22 employed finite-element modeling to design an SHM system for an offshore jacket platform, providing valuable insights but facing limitations in computational cost and performance evaluation due to the complexity of offshore jackets. Zonzini et al. 23 applied edge computing to improve vibration-based SHM through local processing, but edge devices may have constrained resources for complex machine learning models needed to optimize systems.
Despite the advances in SHM techniques, research focusing on the early detection of bolt loosening in offshore WTs remains limited. However, early detection of bolt loosening is crucial, as loose bolts can deteriorate rapidly and lead to joint failure with severe consequences. If not detected early, loose bolts can cause increased vibration and dynamic loads on the turbine structure, accelerating fatigue damage and bolt self-loosening, potentially leading to catastrophic structural failure. Therefore, ongoing research is critically needed to develop robust bolt-loosening detection techniques that can identify damage in its early stages. Some recent significant contributions in this area include Wang et al. 24 methodology for monitoring bolt connection looseness using entropy-based active sensing and genetic-algorithm-based least squares support vector machines. Yuan et al. 25 developed a near-real-time bolt-loosening detection using mask and region-based convolutional neural networks. In addition, Sun et al. 26 proposed a vision-based detection of bolt loosening using YOLOv5. While these studies are relevant, limitations persist in computation, modeling, and practical application, as most methodologies are based on supervised approaches requiring labeled data with healthy and damage cases for training. However, in real-world applications, access to data from damaged structures is rare.
The proposed methodology in this study utilizes principal component analysis (PCA) and Mahalanobis distance for bolt-loosening detection, effectively addressing the aforementioned limitations. While several studies have utilized PCA and Mahalanobis distance for SHM, our approach distinguishes itself in several key aspects. Unlike the methodology presented by Sarmadi et al., 27 which focuses on energy-based damage localization under ambient vibration and nonstationary signals using ensemble empirical mode decomposition, our method exclusively employs vibration data from the undamaged structure, simplifying the baseline establishment process. Additionally, our approach dynamically updates the PCA projection with each new diagnostic dataset, enhancing sensitivity to minor bolt loosening, a feature not present in the static PCA models used by Bellino et al. 28 for time-varying systems. Furthermore, compared to Yanez-Borjas et al., 29 which relies on statistical time features and autocorrelation function denoising, our methodology integrates a comprehensive laboratory validation on a scale model of a WT, simulating various structural states to demonstrate its effectiveness in different conditions. This dynamic, data-driven approach ensures reliable performance.
This approach not only addresses these differences but also enhances the overall SHM process. By only requiring vibration data from the healthy structure to establish a baseline, thereby reducing computational requirements, PCA transforms the data into principal components, reducing dimensionality for more efficient edge computing resources. The distance-based damage detection technique is also robust to varying damage patterns compared to cosine similarity methods. Notably, this methodology can be developed and applied without needing data from damaged cases, which is a significant advantage over previous supervised learning techniques. By adopting optimization approaches such as this PCA-based methodology, SHM solutions can enable earlier damage detection, timely maintenance, and improved safety of offshore and maritime structures.
This paper is organized as follows. Section “Experimental setup” describes the experimental setup, including the lab-scale WT model and sensor instrumentation. Section “Hypothesis” presents the hypothesis and motivation behind the proposed methodology. The damage detection approach is detailed in section “Damage detection methodology,” covering data acquisition, preprocessing, PCA-based transformation, and statistical threshold for damage classification. The results demonstrating the performance of the technique in the lab turbine data are shown in section “Results and discussion”. Finally, section “Conclusions” provides concluding remarks and directions for future work.
Experimental setup
To carry out this study, a scale replica of a jacket WT was used. With a height of 2.7 m, this structure is made up of three main parts: the nacelle, the tower, and the substructure.
The nacelle, positioned at the upper part of the WT, is made up of a beam 1 m long and 0.6 m wide. At the far left of the nacelle is a Data Physics GW-IV47 (Riverside, CA, USA) inertial shaker model that is powered by different drive signals. These signals are generated by a function generator (GW INSTEK AF-2005, New Taipei City, Taiwan) and provide different white noise amplitudes (factors of 0.5, 1, and 2) to simulate wind speeds from different operating regions of a real WT.
The tower has been divided into three sections that are joined by flanges. With a length of 1.67 m and a diameter of 0.239 m, the tower provides the necessary support for the nacelle.
The jacket substructure, located in the lower part of the structure, is the main component studied in this work. It is made up of 32 S275JR steel bars, DC01 LFR steel plates, along with bolts and nuts tightened to a torque of 12 Nm. The substructure is divided into four levels, each having bars of varying lengths, as depicted in Figure 1. This unique and intricate deck substructure is the focus of our research.
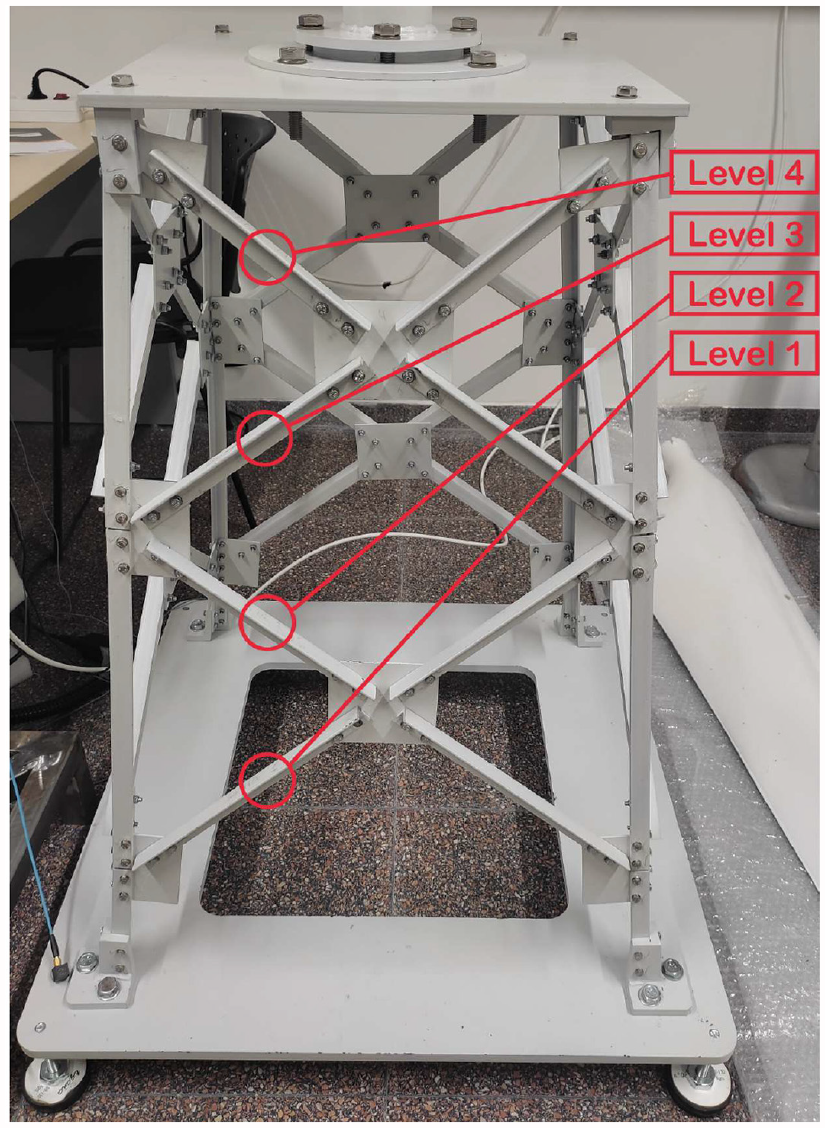
Jacket structure levels of WT.
The laboratory setup does not encompass all the environmental and operational conditions (EOCs) encountered by offshore WTs, but it provides a controlled environment for replicating specific dynamic conditions. In particular, the shaker induces vibrations that simulate the dynamic loading conditions imposed by the wind forces that act on the rotor blades. Notably, the design and validation of this test bench is a significant contribution of E Zugasti’s PhD thesis 30 titled “Design and validation of a methodology for wind energy structures health monitoring” (2014). Additionally, similar test benches have been employed in various studies,31–34 reinforcing its credibility for proof-of-concept validation of SHM methodologies.
In order to conduct a comprehensive analysis of the dynamic behavior of the structure, eight triaxial accelerometers (model 356A17; PCB R Piezotronic, Depew, NY, USA) are strategically placed 30 at various locations within the WT structure, as shown in Figure 2. These accelerometers are capable of measuring vibrations at different frequencies and amplitudes, thus providing valuable data for analysis.
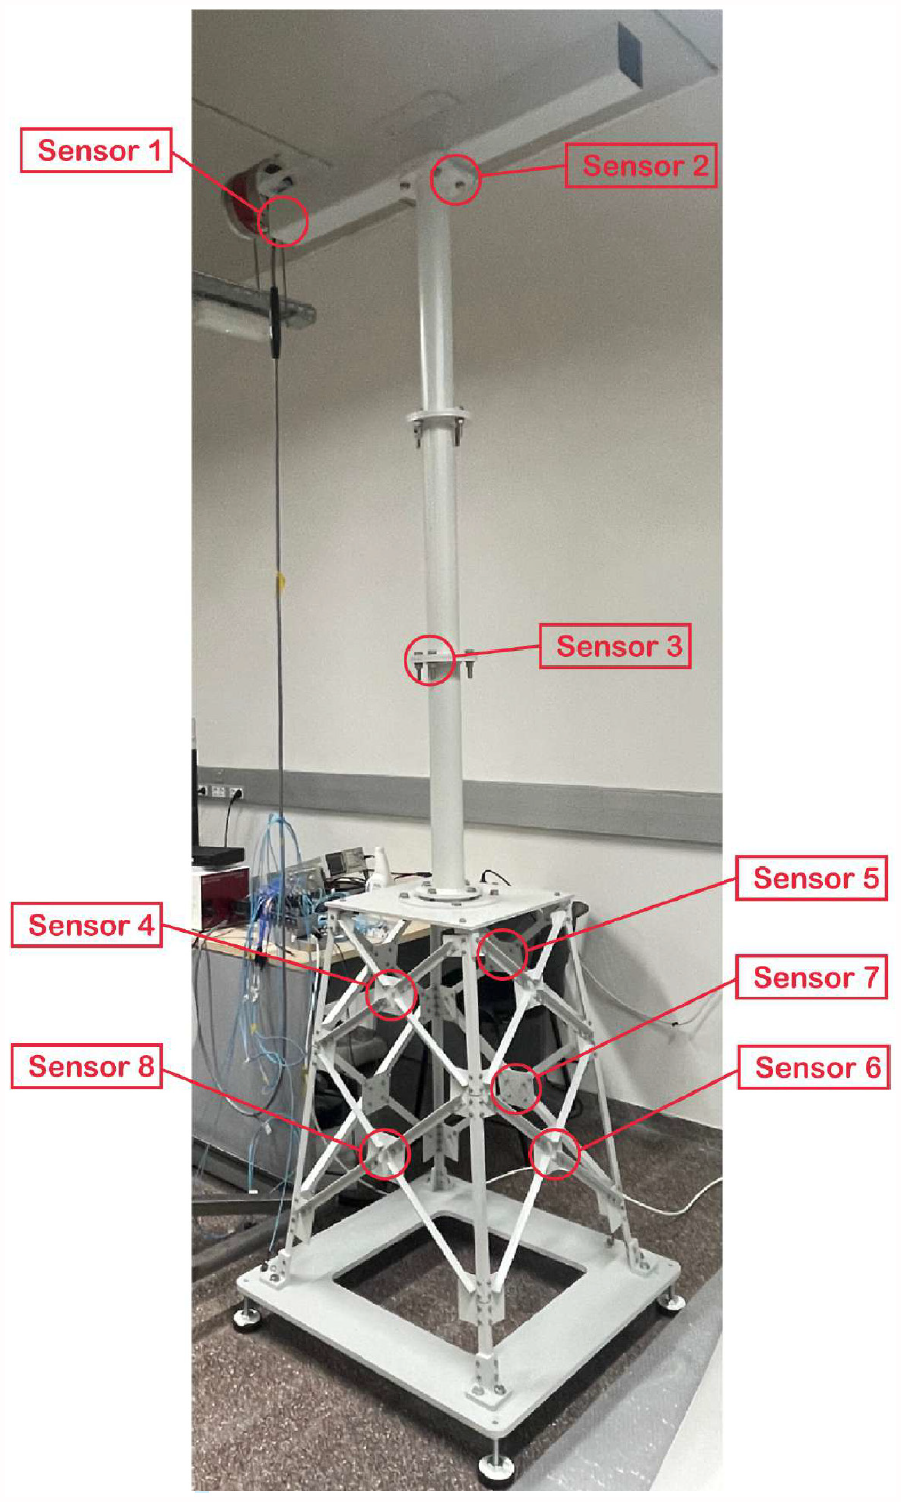
Location of the sensors (accelerometers) in the structure.
Since the accelerometers are triaxial, they capture vibrations in three different directions, resulting in a total of 24 vibration signals. To ensure accurate and precise data acquisition and processing, six input modules NI 9234 model National Instruments (Austin, TX, USA) are used, housed in a chassis (cDAQ model).
The experimental setup, as described in Puruncajas et al., 10 involves a meticulous arrangement of the accelerometers and data acquisition modules to capture complete vibration data from the WT structure. This measurement setup provides a wealth of data to analyze the dynamic response of the WT structure, helping to better understand its behavior and performance under different conditions.
The main objective of this research is to develop a robust strategy to detect different magnitudes of loosened bolts in the WT jacket structure. In order to achieve this, different structural states are simulated at multiple levels of the WT jacket, including levels 1, 2, 3, and 4. These states encompass a variety of conditions (to establish an exact torque on the bolt, a torque wrench is used), including:
Healthy: refers to the normal undamaged state of all the jacket structure bars where the bolts are tightened at a torque of 12 Nm.
Loose bolt at 9 Nm: representing a specific type of damage where the bolt is tightened at a torque of 9 Nm.
Loose bolt at 6 Nm: representing a specific type of damage where the bolt is tightened at a torque of 6 Nm.
Without bolt: indicating the absence of a bolt that is typically used to connect the bars, resulting in a compromised connection.
The selected torque levels represent specific reductions in the preload applied by the bolts. By systematically reducing the torque to 75% (9 Nm), 50% (6 Nm), and 0% (completely loose) of the fully torqued value (12 Nm), it can analyze the impact of various levels of bolt looseness on the structural behavior of the WT model.
The selection of 12 Nm as the fully torqued value for the bolts is based on the design and validation work from Zugasti’s PhD thesis. 30 The bolts used are standard M8 bolts (8-mm diameter). The derivation of the torque value is based on the following formula (see ISO 898-1:2013, which specifies mechanical and physical properties of bolts):

where
T = tightening torque in Nm.
k=nut factor (0.3 for plain/dry, which is our case).
D=nominal diameter of bolt in mm (8 mm in our case).
P = target clamping preload in kN (for M8 bolts, a preload of around 5 kN is within the standard practice for ensuring optimal performance. This preload corresponds to approximately 70% of the yield strength of a typical grade 8.8 M8 bolt, which is a common practice to balance strength and durability without risking bolt failure).
This torque value corresponds to a specific preload that ensures consistent tightening without excessive stress on the bolt itself.
Each type of damage is associated with a unique bolt in each experiment, which can be located at different levels of the jacket-type support. The manipulated bolt is always located in the inner part of the central union at each level, as depicted in Figure 3.
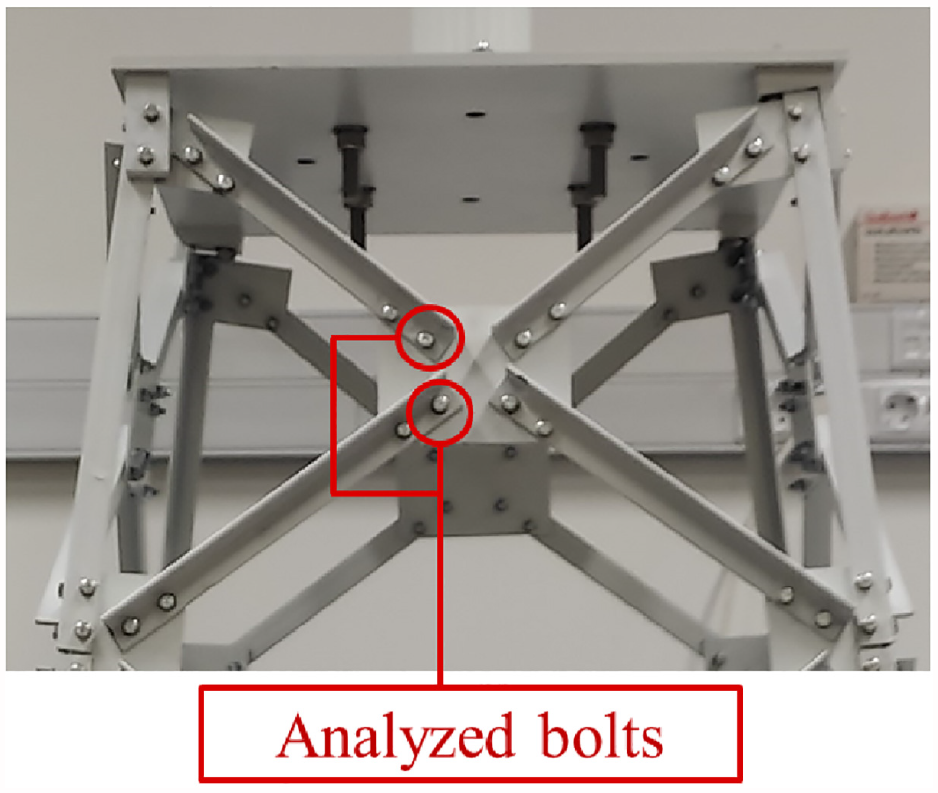
Analyzed bolts at levels 3 and 4.
Thus, the proposed approach uses a downscaled replica of a jacket-type offshore WT and focuses on the structural health of the jacket substructure under different wind speeds and bar conditions.
The dataset acquired and analyzed in this work is shared in a public repository following the FAIR guidelines. 35
Hypothesis
This section presents the research hypotheses that guide the development of this study on detecting damage in the jacket structure of a WT.
In the context of damage or fault detection, PCA is commonly used to create a low-dimensional representation of healthy baseline data, onto which new data can be projected for diagnosis purposes; see Vidal et al.36,37 However, this standard approach does not fully exploit the potential of PCA. By only using healthy data to construct the PCA projection, the directions of maximum variance may separate different (normal) operational regions but do not necessarily maximize the distinction between healthy and faulty states.
In this work, it is hypothesized that a PCA projection, computed simultaneously on healthy baseline data (acquired with the pristine structure) and new diagnostic data, would enhance fault detection. If the new data to diagnose represent a healthy state, it would be projected proximate to the healthy baseline data along the principal component axes. On the contrary, when the new data come from a damaged structure, the joint PCA projection would separate it from the healthy baseline in directions that maximize the variance between the two datasets.
Therefore, an online PCA approach is proposed, which recalculates the PCA projection for each new diagnosis, including both healthy baseline data (acquired with the pristine structure) and the new diagnostic data. This online updating of the PCA subspace is expected to optimize the separation between healthy and faulty states, thereby fault detection performance. It should be noted that, in this work, every time a diagnosis is required about the structural condition, a new PCA projection is computed with healthy data (previously acquired from the pristine structure) and the new diagnostic data. In the following paragraphs, the hypothesis is fully explained.
The online PCA approach involves the acquisition of two initial healthy datasets from the pristine WT structure. The first dataset,
For each new diagnosis, two test datasets are collected. Test dataset 1
Two scenarios are presented in Figures 4 and 5 to illustrate the proposed methodology.
In Figure 4, the expected scenario of the methodology is described when the structural state to diagnose is healthy. After projecting
Figure 5 depicts the case where new data to diagnose are obtained from a damaged WT structure. In that scenario,
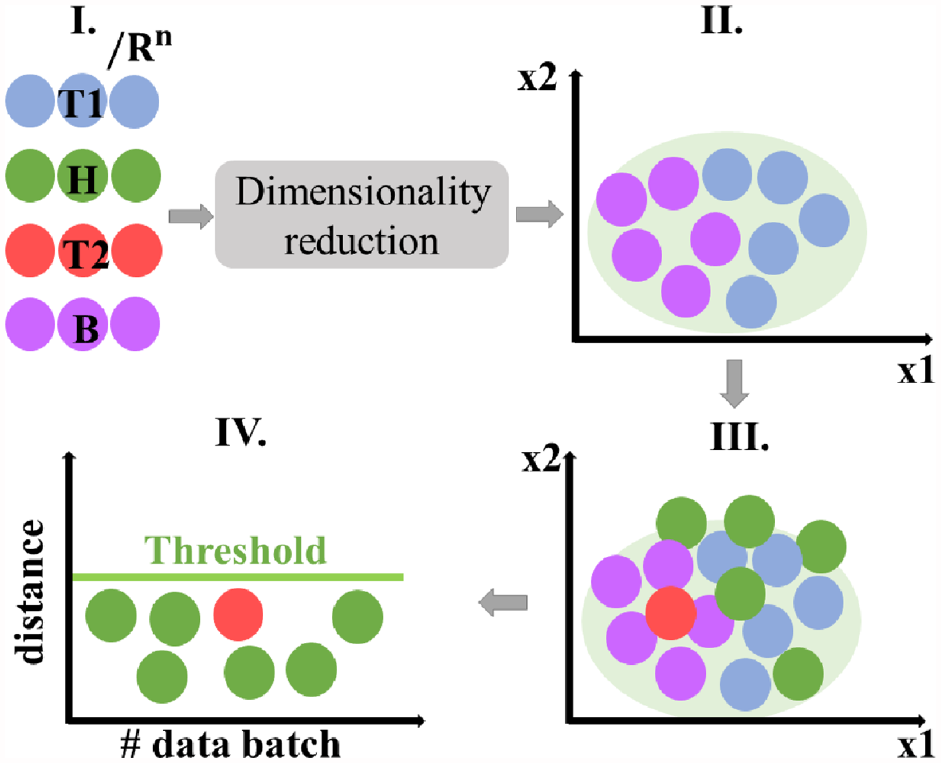
Steps I to IV for the expected scenario with data from a healthy structure.
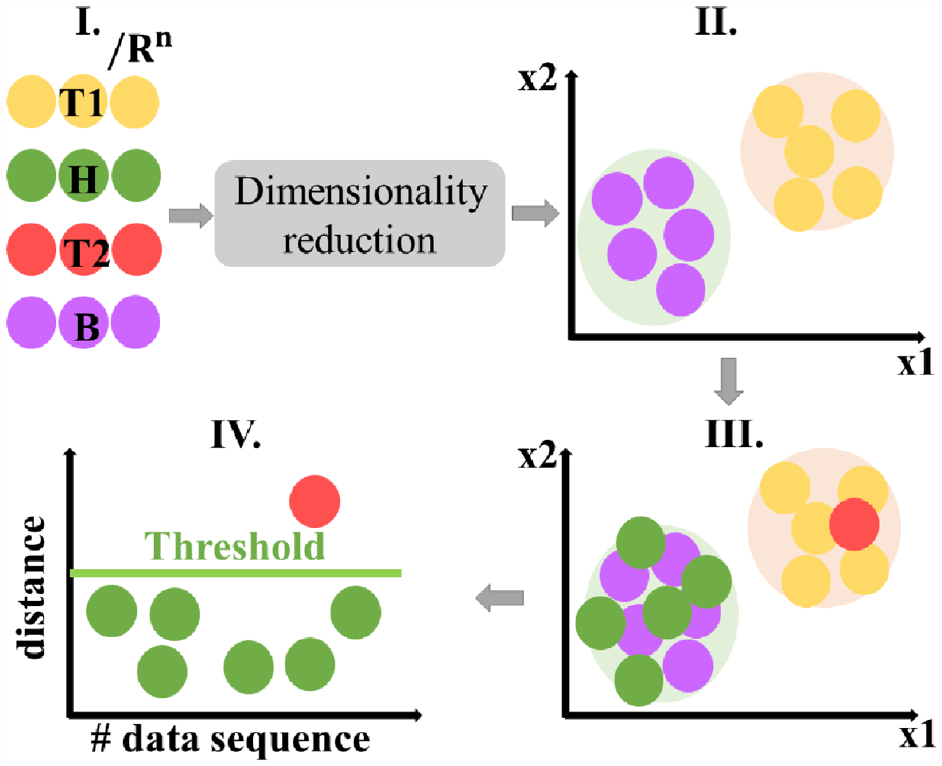
Steps I to IV for the expected scenario with data from a damaged structure.
Damage detection methodology
In this section, the key parts of the methodology are outlined. Initially, the data are acquired and then divided into different sets and reshaped. Subsequently, a PCA-based data transformation procedure is performed. Then, the Mahalanobis distance of the threshold dataset is calculated with respect to healthy data in order to detect damage.
Data acquisition
This section describes how data are obtained from experiments performed by simulating different conditions and structural states.
A total of 492 experiments are performed, considering 3 different WN amplitudes, 4 structural states, and 4 levels of the base structure. The distribution of the total number of experiments for the three WN amplitudes is as follows:
Twenty healthy experiments with all the bolts in the base tightened at 12 Nm, adding up to 60 experiments.
Twelve experiments for each of the 4-bar levels with the first type of damage, represented as one loosened bolt at 9 Nm, summing up to 144 experiments.
Twelve experiments for each of the 4-bar levels with the second type of damage, represented as one loosened bolt at 6 Nm, summing up to 144 experiments.
Twelve experiments for each of the 4-bar levels with the third type of damage, represented as an absent bolt, adding up to 144 experiments.
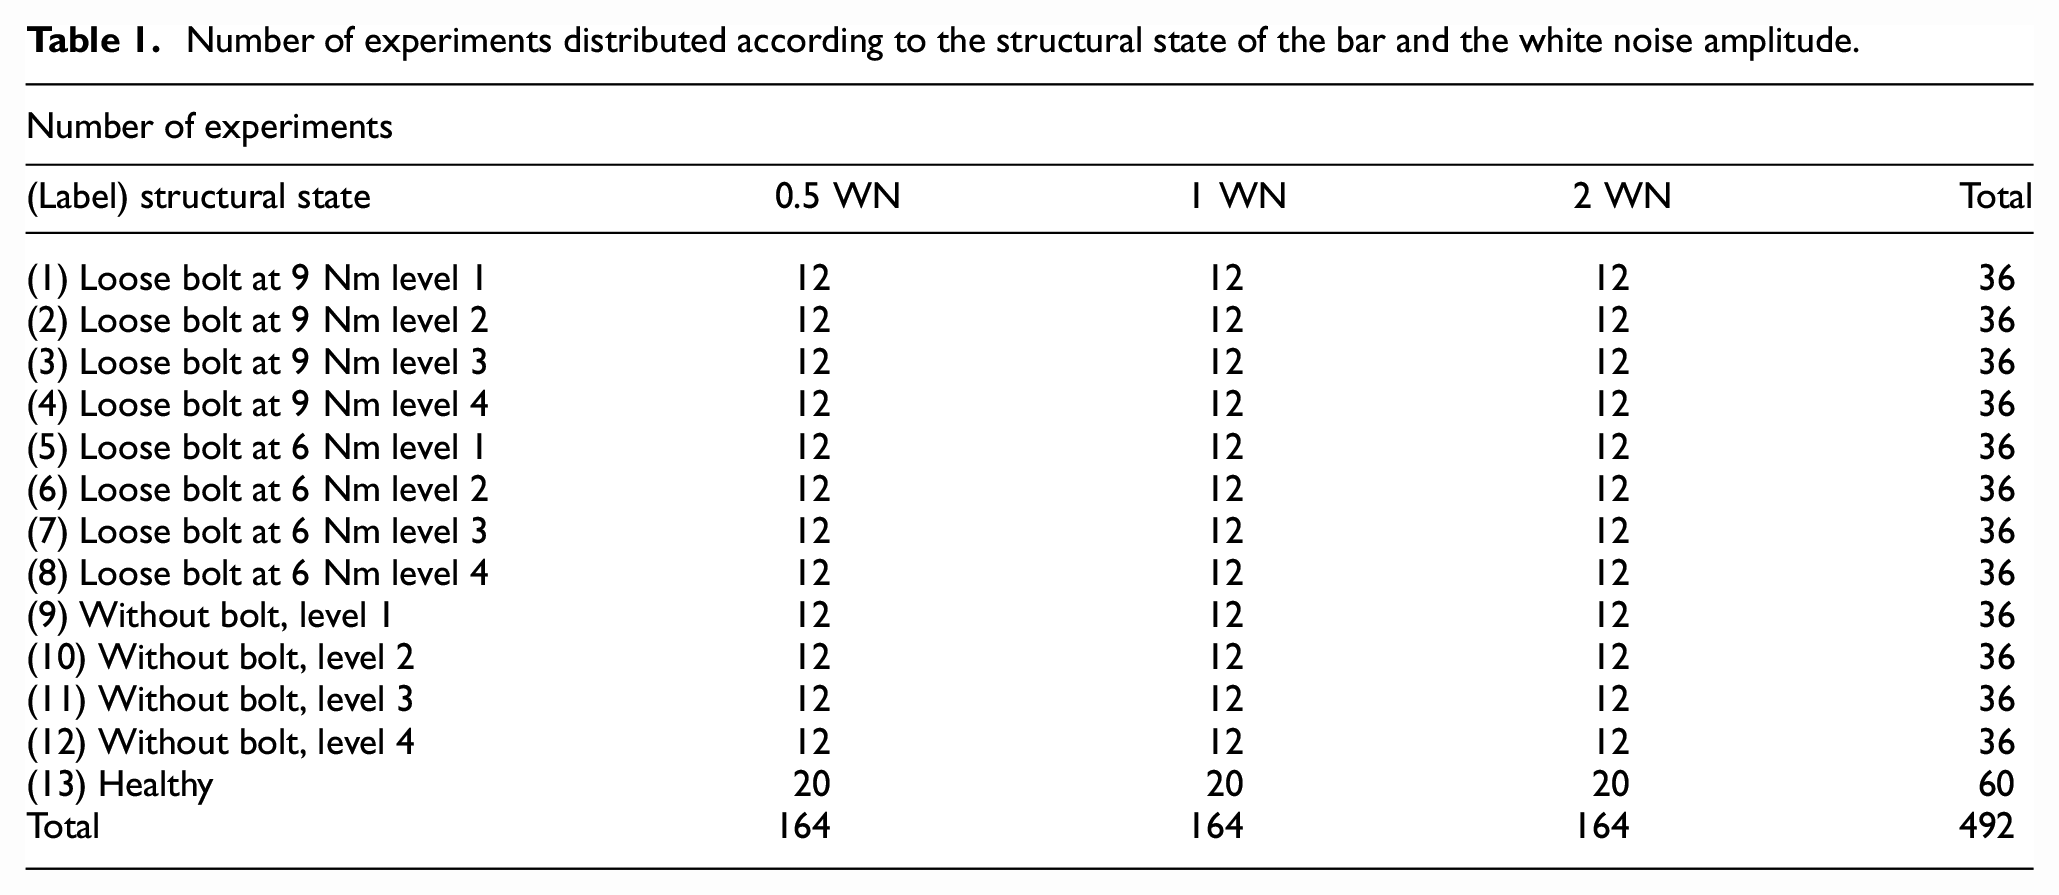
The distribution of the experiments performed, according to the white noise amplitude factors and structural states, is shown in detail in Table 1.
Number of experiments distributed according to the structural state of the bar and the white noise amplitude.
A total of 99,097 measurements are obtained from each sensor during each experiment, which takes 60 seconds at a sampling frequency of 1.6 kHz. The number of signals obtained during each experiment is equivalent to 8 × 3 = 24 signals because there are eight triaxial accelerometers used.
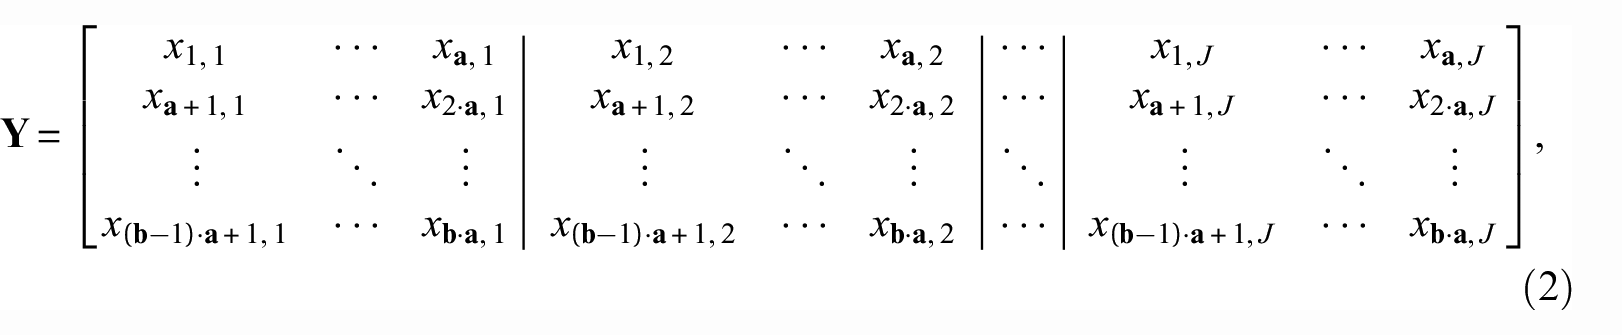
The matrix
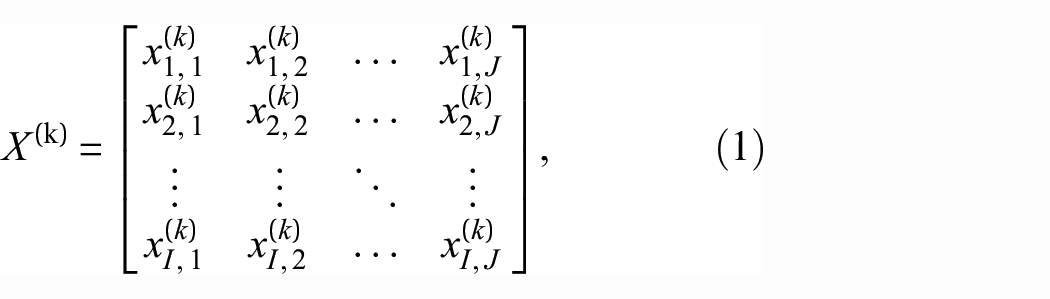
where
identifies the timestamp, while
represents the measuring sensor, while
As a result, each experiment matrix
Data split
The way in which the data from a particular experiment are handled depends on the structural condition of the base structure of the WTs when the experiment is conducted. If the data are related to a healthy state, it is used to create a baseline, calculate threshold values, or test the methodology. On the contrary, data from experiments conducted under any kind of damage are only used for testing.
Hence, the main features of the following methodology are considered in order to split available data:
A model is generated when new input data are available and a prediction procedure is performed to detect damage, where the new data and baseline data are used.
Threshold values are computed based on how near healthy data are clustered, which allows perceiving whether input information is associated with damage condition in the structure or not.
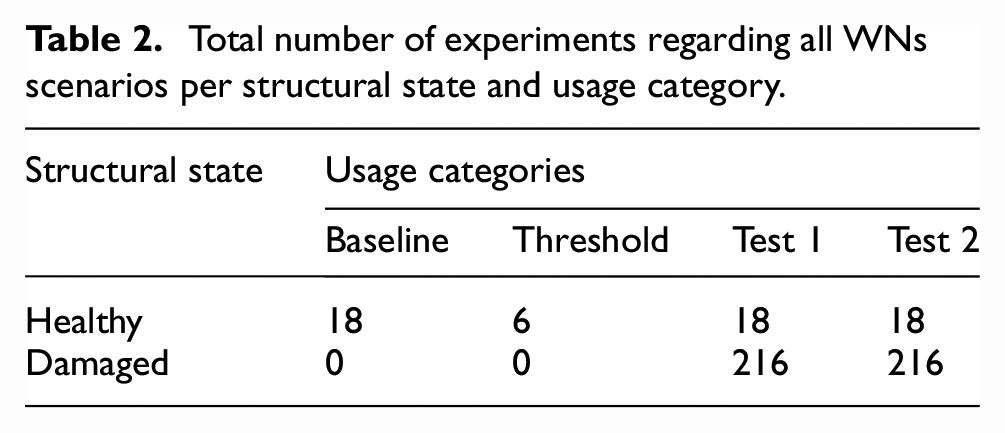
As a result, the obtained data are divided into different categories depending on how each experiment is implemented and the amount of information required in subsequent steps. Finally, the data split procedure is summarized in Table 2, where each value per case is equally distributed between the three different WN scenarios considered during data acquisition.
Total number of experiments regarding all WNs scenarios per structural state and usage category.
Data reshape
As previously mentioned, raw data from each experiment are stored as a matrix format, with 24 columns or features and 99,097 observations or rows. Given the quantity of acquired data per experiment and the scarce number of features, the information of each experiment should be preprocessed in order to enhance its characteristics and perform dimensionality reduction efficiently.
The number of features is limited by the experimental setup, since it is directly related to the number of sensors used during data acquisition. Therefore, enhancing the characteristics is necessary to avoid being left with limited information (lower number of columns) after calculating the principal components.
Features are increased by rearranging the original data’s time-based characteristics into transposed vectors batches and appending them back. The reshaping procedure is depicted in Figure 6 and is described below considering that, for every experiment, each sensor is represented by a unique column in its matrix.
The first column of sensor 1 (S1) is divided into
The first batch is transposed and considered as the initial new matrix
The remaining batches are also transposed and appended one below the other, maintaining their relative position in the matrix
The process described in previous steps is repeated for the remaining columns, adding new batches of other sensors to the right of the last reshaped row as described in Figure 6 based on the colors representing the data from different sensors.
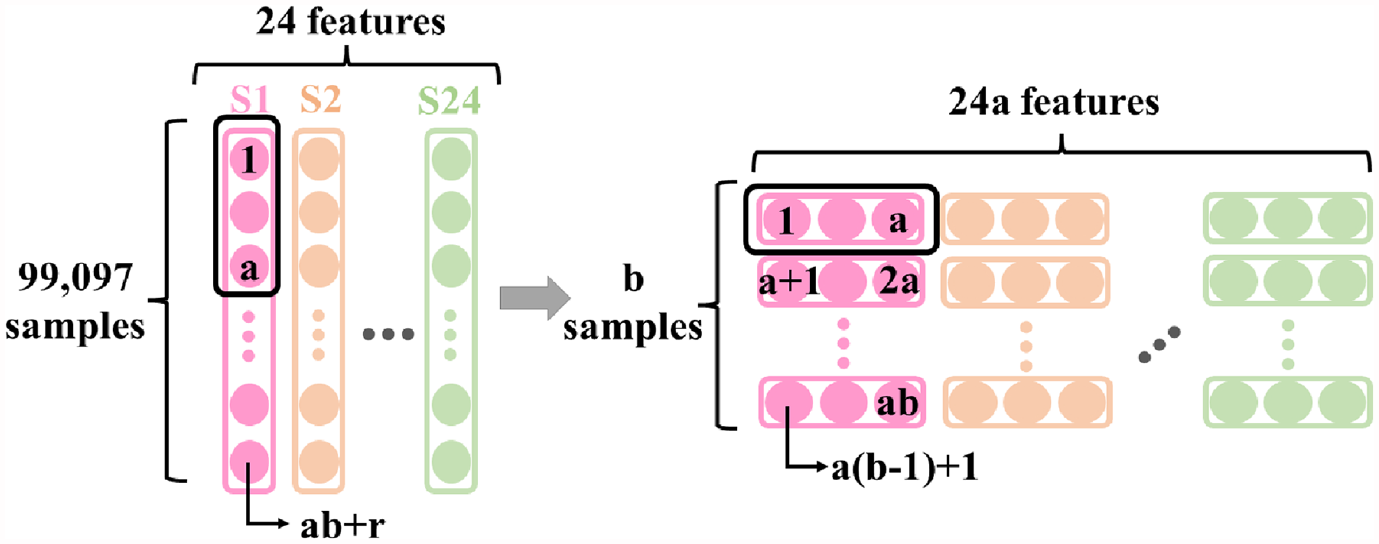
Reshape process for every data matrix.
The batch length is determined considering a minimum value of 100 and minimizing the residual samples, resulting in a quantity of 1139 for
In Figure 6, the final reshaped matrix is denoted as
Data transformation
The proposed methodology consists of a damage detection algorithm, which compares healthy structural data with newly acquired data associated with a subsequent structural state. Therefore, a dataset that contains data exclusively from healthy experiments is determined initially. After that, new testing data concerning experiments with unknown structural conditions are processed. For each data groups of the methodology, a matrix is formed by appending several data-reshaped matrices (in matrix
Matrix
Matrix
Matrix
Matrix
For every damage detection procedure, a model matrix
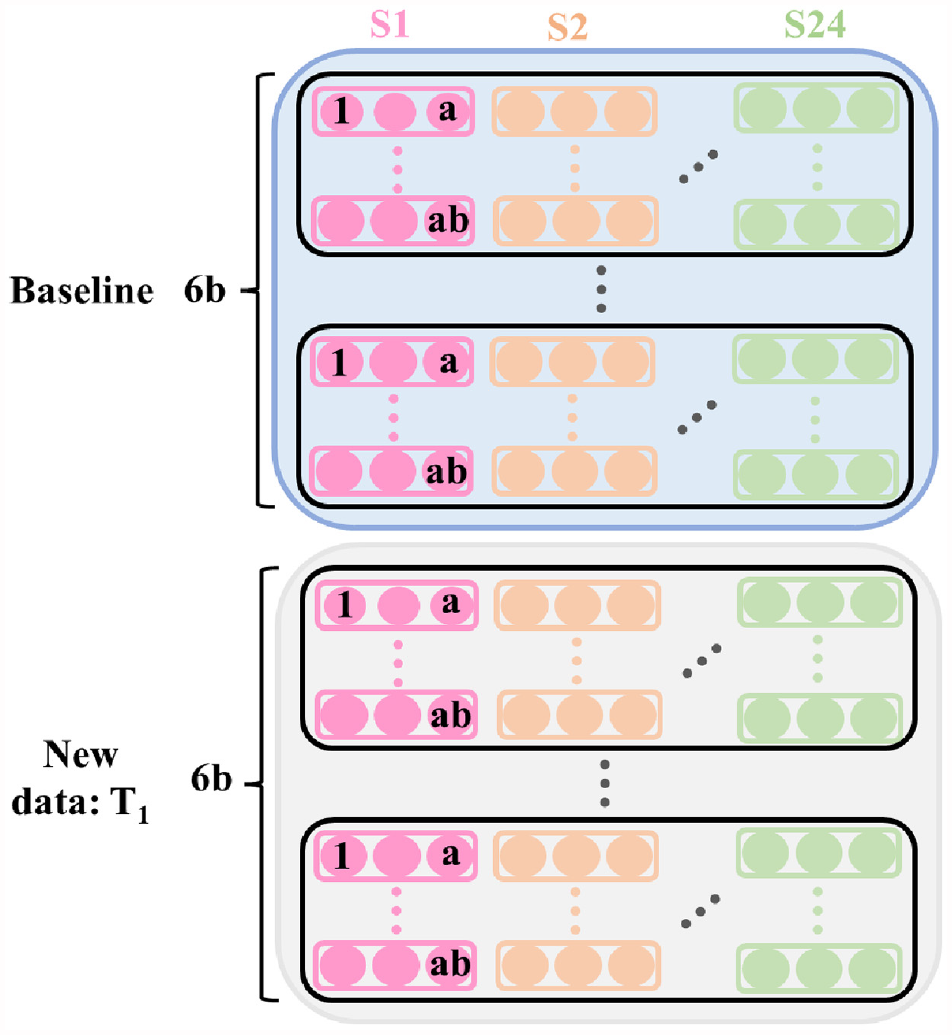
Model matrix
This matrix
Feature scaling
Column standardization is performed prior to applying dimensionality reduction on matrix
It should be noted that for every damage detection test, the columns of both matrix
The following formula describes the standardization of each column:

from which the mean,
Principal component analysis
Feature augmentation is performed previously through a reshape procedure on data matrices, which originated the conformation of several new matrices with enhanced characteristics and more dense information per sample describing the structural state. However, since the damage detection approach explained in the initial hypothesis follows a clustering-related unsupervised technique, it is pertinent to apply dimensionality reduction to concisely describe similarities between structural states. PCA is implemented following feature scaling to fulfill the previous consideration.
PCA aids in representing data in a lower-dimensional subspace and finds an orthogonal basis for the original variables comprised of eigenvectors that describe the directions in which data vary the most, with the first principal component associated with the maximum data’s variance. Principal components are calculated by determining the eigenvectors of the covariance matrix from the matrix
The matrix
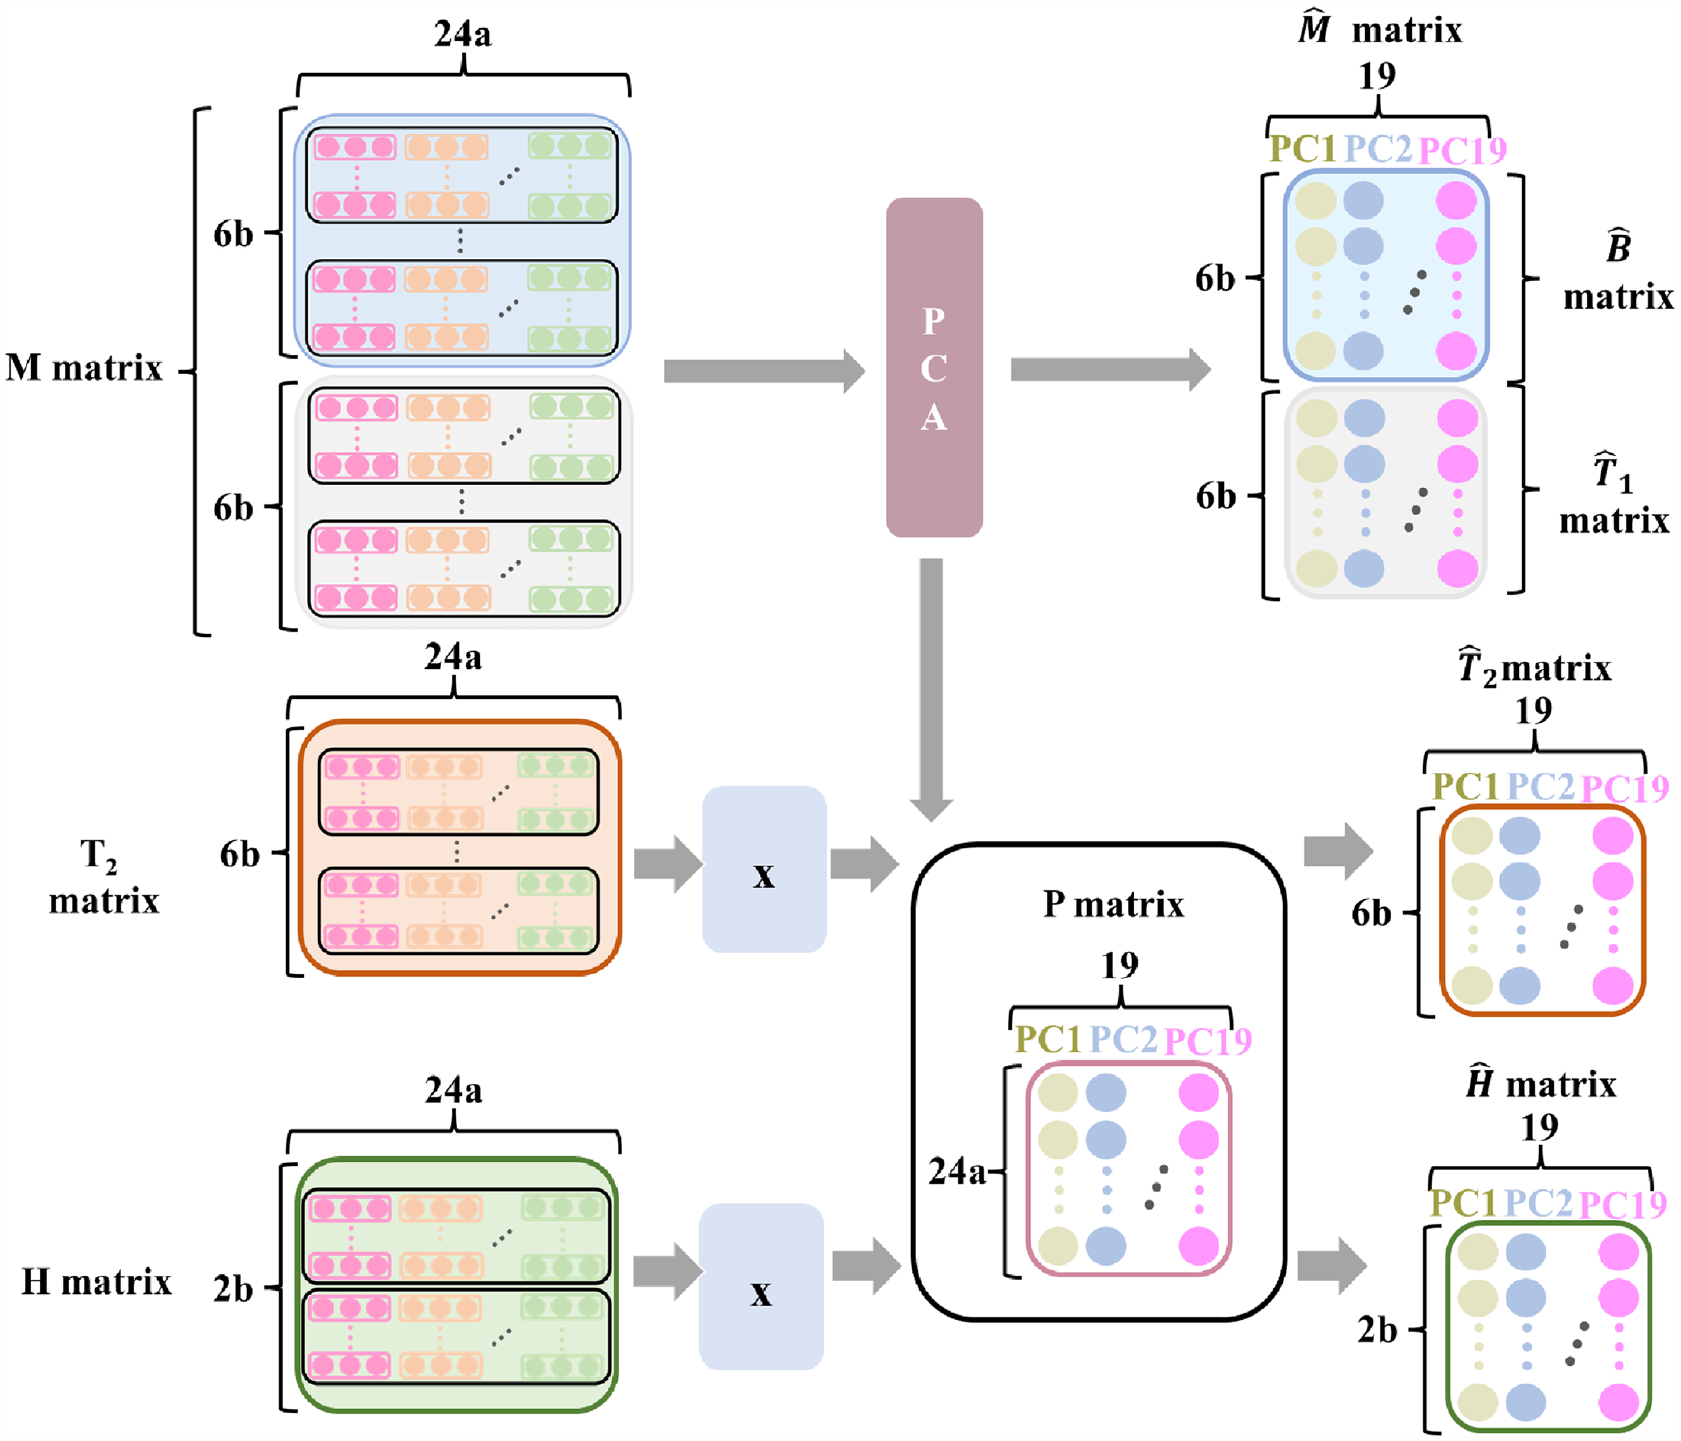
Data transformation process with PCA.
As a result of PCA, matrices
In Figure 8, the number of rows in the matrix
Mahalanobis distance and threshold interval
After PCA, the data’s dimensions have been reduced due to the 19 principal components specified as an optimal value for the new number of features. Since the methodology focuses on a clustering approach by comparing new data to previously known healthy data, submatrix
First, the healthy Mahalanobis distances from the threshold dataset are computed. This metric determined the distance of each sample from the matrix
The calculation of the Mahalanobis distance is described as
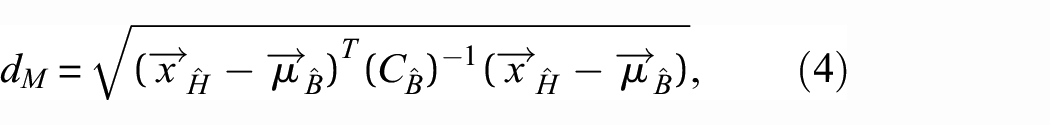
where
By definition, zero is the minimum value for the Mahalanobis distance. Furthermore, as the distance between the evaluated data and the healthy baseline approaches zero, the likelihood of a healthy structural state increases. This proximity serves as a quantitative indicator of structural integrity.
To separate abnormal data indicative of damaged structural states from healthy data, it is essential to analyze the upper tail of the healthy distances’ distribution to define an upper threshold. Determining this threshold involves initially calculating the mean and standard deviation of the healthy Mahalanobis distances associated with the threshold dataset,
The value of
Consequently, the resulting interval for Mahalanobis distances associated with healthy data is determined as follows:

As a consequence, distances not included in the interval are considered aberrant, and its related structural condition would be cataloged as related to damage.
Then, for every sample in matrix
Figure 9 describes the final steps of the methodology regarding the calculation of the threshold value and the Mahalanobis distances.
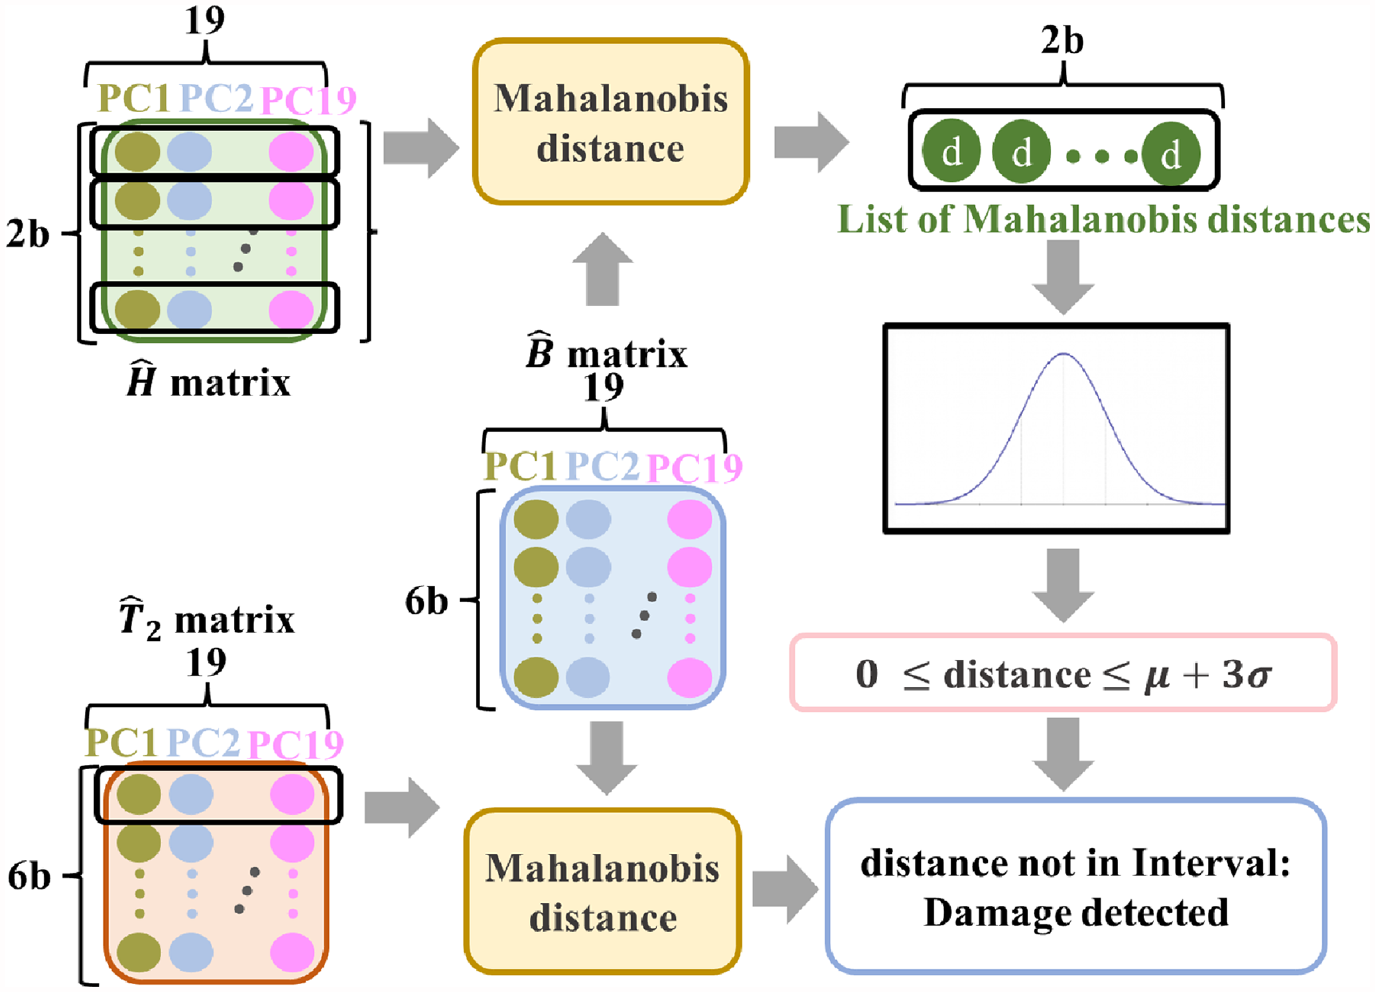
Damage detection by calculating the Mahalanobis distance of test data with respect to the baseline with healthy data.
Results and discussion
The methodology’s performance, as well as the metrics implemented for the results’ evaluation, is described and discussed in this section.
As described in the last step of the methodology, each sample (row) of the matrix
Correct detection percentages for each structural state and WN amplitude factor.
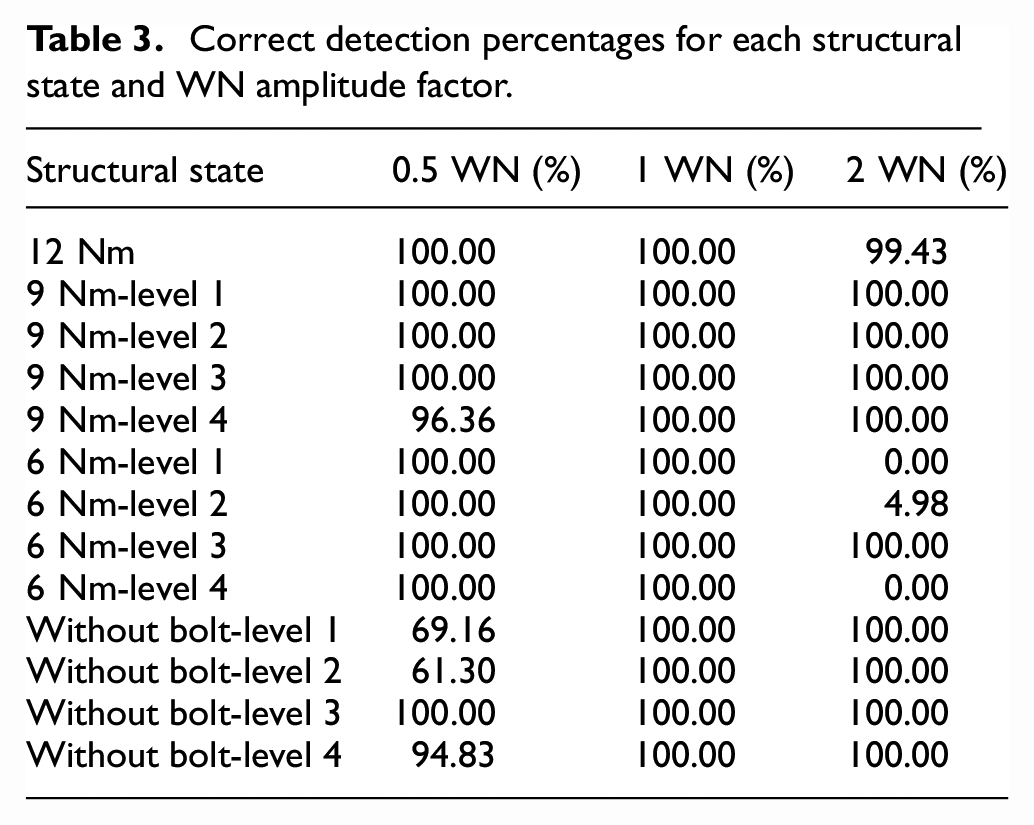
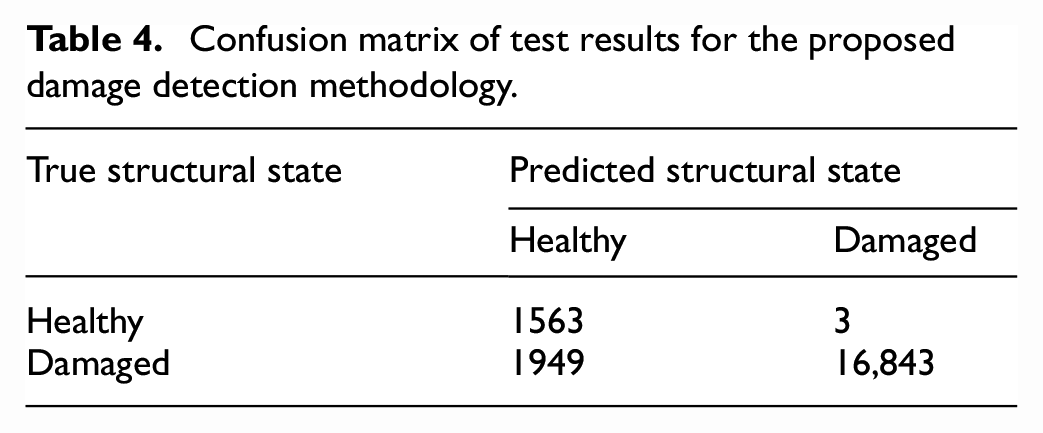
The results indicate that 33 of the 39 structural cases explored present a precision greater than 95% in predicting their true structural state. However, only three scenarios (related to the 6 Nm loosened bolt and WN amplitude of 2) obtain a very low accuracy. Table 4 summarizes in a confusion matrix the results described in Table 3. In the aforementioned methodology, a data batch is considered as a testing unit. Hence, the values described in the following table represent the number of data batches classified into the corresponding predicted and true structural state. Based on Table 4, false positives and negatives are significantly less compared to their corresponding true category.
Confusion matrix of test results for the proposed damage detection methodology.
Furthermore, the percentages in Table 3 regarding the scenarios where the bolts are starting to loose (9 Nm) describe the overall outstanding performance of the methodology to indicate whether the base structure is starting to perceive some damage. Since these cases represent the origin of the deterioration of the structural state, the methodology could also be evaluated based on the initial damage and healthy data, considering the three different amplitude factors. In Table 5, only the results from healthy cases and bolt loosened to 9 Nm cases are described in the form of a confusion matrix.
Confusion matrix for healthy data and 9 Nm cases evaluated under the proposed damage detection methodology.
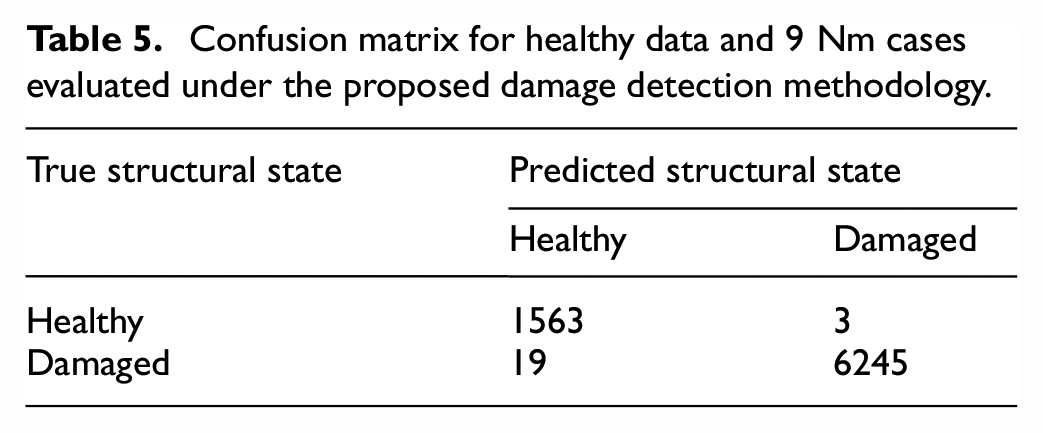
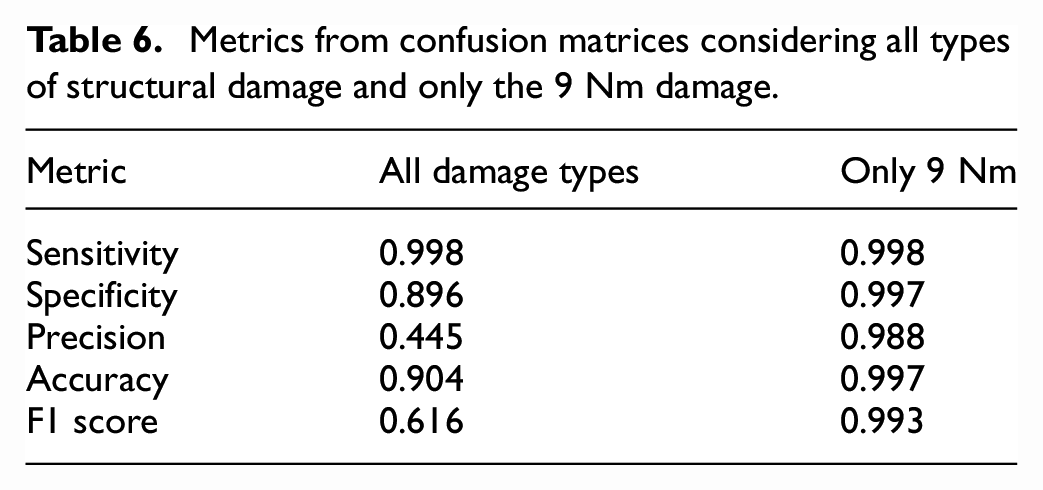
Table 5 indicates a low number of misclassified data batches, either false positives or false negatives, with respect to the number of correct predictions of the structural state. The results of the confusion matrices in Tables 4 and 5 are compared based on several metrics in Table 6 suggesting a better performance of the damage detection methodology considering exclusively the initial deterioration of the structural state with a bolt loosening to 9 Nm. The results improve as a consequence of a better ratio between true negatives and false negatives, with the latter presenting a significant decrease. All metrics explored in Table 6, regarding healthy and 9 Nm damage cases, exhibit values above 0.98.
Metrics from confusion matrices considering all types of structural damage and only the 9 Nm damage.
Finally, Figure 10 depicts the curves of the calculated Mahalanobis distances from several experimental cases, which were determined for every data batch used during testing. Figure 10(a)–(c) describes how the methodology effectively detects that the structure is in a healthy condition regardless of the WNs amplitude. In these three scenarios, nearly all the Mahalanobis distances for every data batch (in red) are below the corresponding threshold value for the amplitude (in green). Therefore, most of the data batches have been classified as healthy, leading to an approximate 100% predictions that match their real structural state. On the other hand, Figure 10(d)–(o) describes the results of scenarios in which an initial structural damage, represented as a bolt loosened to 9 Nm, has been configured at a specific level in the structure. It is portrayed in every plot, except Figure 10(m), that all the Mahalanobis distances for every data batch are above the amplitude’s threshold value, thus determining the structure is damaged. However, since Figure 10(m) depicts few misclassified data batches, Figure 10 indicates a high overall performance of the methodology when determining whether the structure is in a healthy condition or initial damage is present. Therefore, damage detection can be performed in its initial stages and major structural damage, such as the scenarios where a bolt has been loosened to 6 Nm or is no longer in the structure, can be avoided.
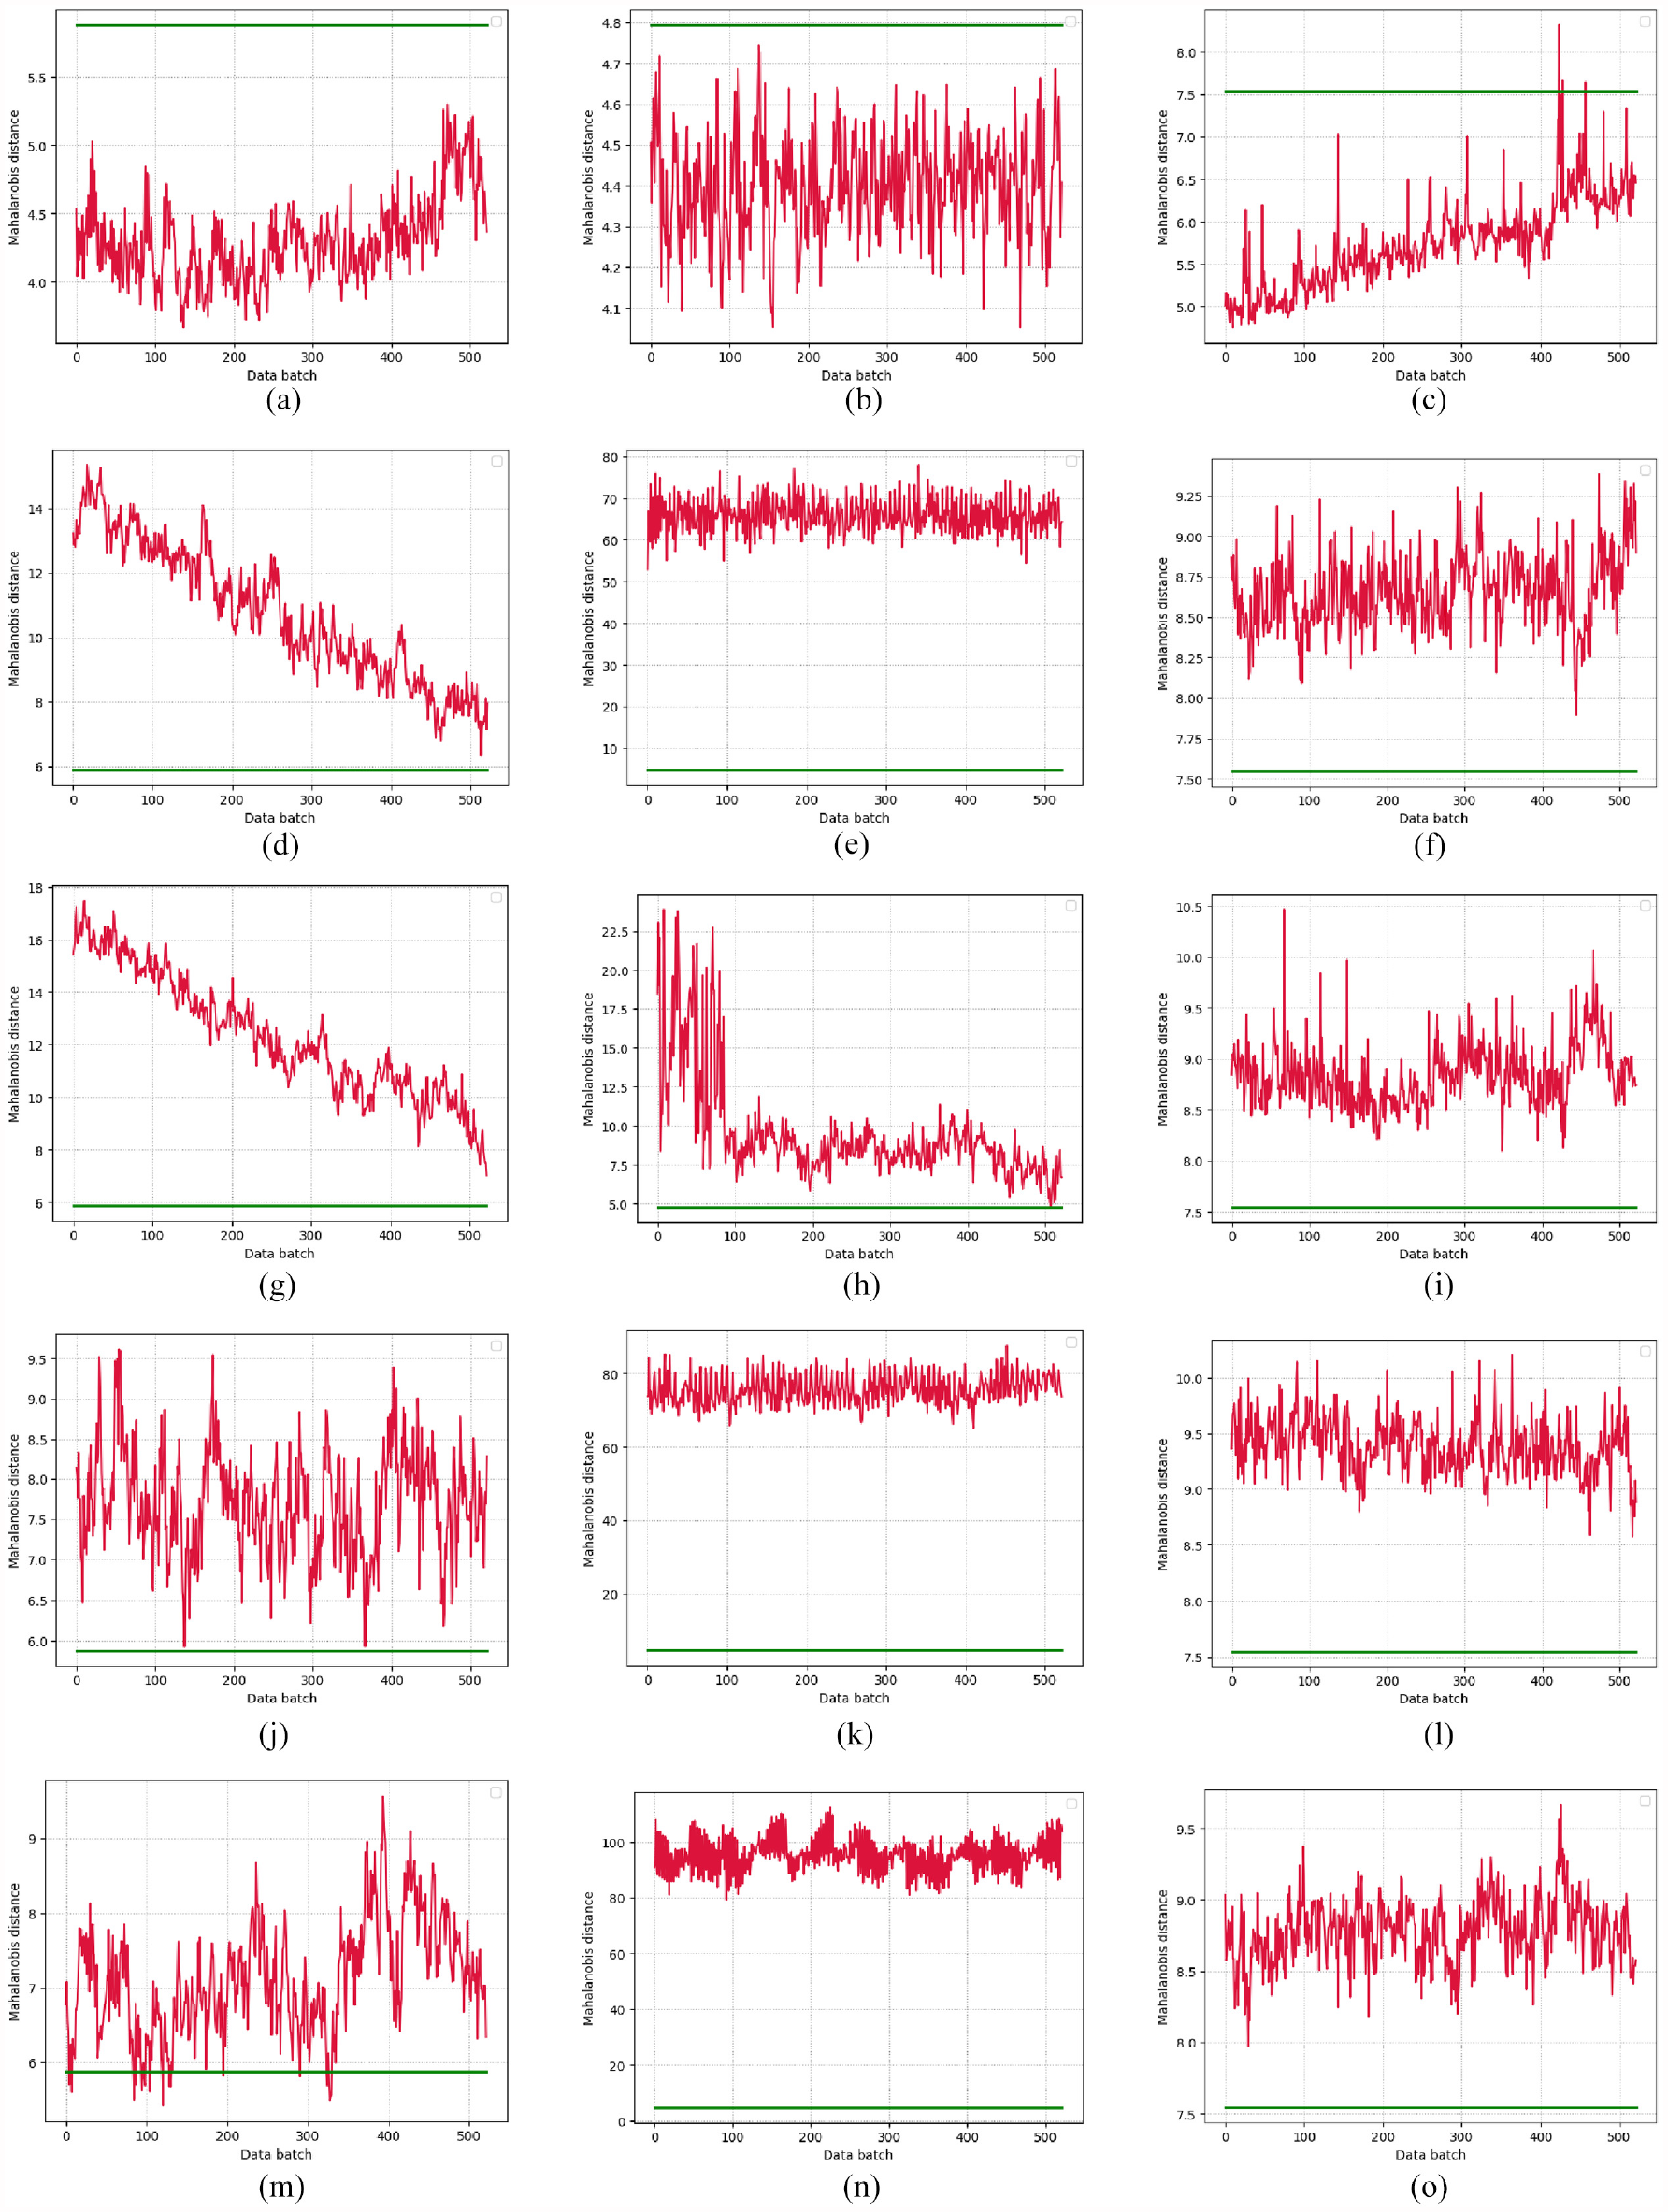
Calculated Mahalanobis distances of data batches considering scenarios with healthy conditions and damage with a bolt loosened to 9 Nm: (a) amplitude 0.5—healthy condition, (b) amplitude 1—healthy condition, (c) amplitude 2—healthy condition,(d) amplitude 0.5—loosened bolt to 9 Nm at level 1, (e) amplitude 1—loosened bolt to 9 Nm at level 1. (f) Amplitude 2—loosened bolt to 9 Nm at level 1, (g) amplitude 0.5—loosened bolt to 9 Nm at level 2, (h) amplitude 1—loosened bolt to 9 Nm at level 2,(i) amplitude 2—loosened bolt to 9 Nm at level 2, (j) amplitude 0.5—loosened bolt to 9 Nm at level 3, (k) amplitude 1—loosened bolt to 9 Nm at level 3, (l) amplitude 2—loosened bolt to 9 Nm at level 3. (m) Amplitude 0.5—loosened bolt to 9 Nm at level 4, (n) amplitude 1—loosened bolt to 9 Nm at level 4, and (o) amplitude 2—loosened bolt to 9 Nm at level 4.
Figure 11 illustrates the results of several cases in which the methodology has been less precise in determining whether the evaluated structural state is healthy or damaged. Specifically, the scenarios with lower performance are without bolt—0.5 WN and 6 Nm—2 WN. In cases with a white noise amplitude of 2, the sensor signals distribution may not have been sufficiently distinguishable from healthy states, as described in the exploratory data analysis by Baquerizo et al. 40 This analysis explains how the signal distribution becomes more similar and thus harder to distinguish between healthy and damaged states as the white noise amplitude increases. For scenarios with a noise amplitude of 0.5, further investigation is required to understand how the absence of a bolt affects the vibrations captured by the accelerometers. Such an analysis would help improve the precision of the methodology in detecting damage under varying conditions and perturbations.
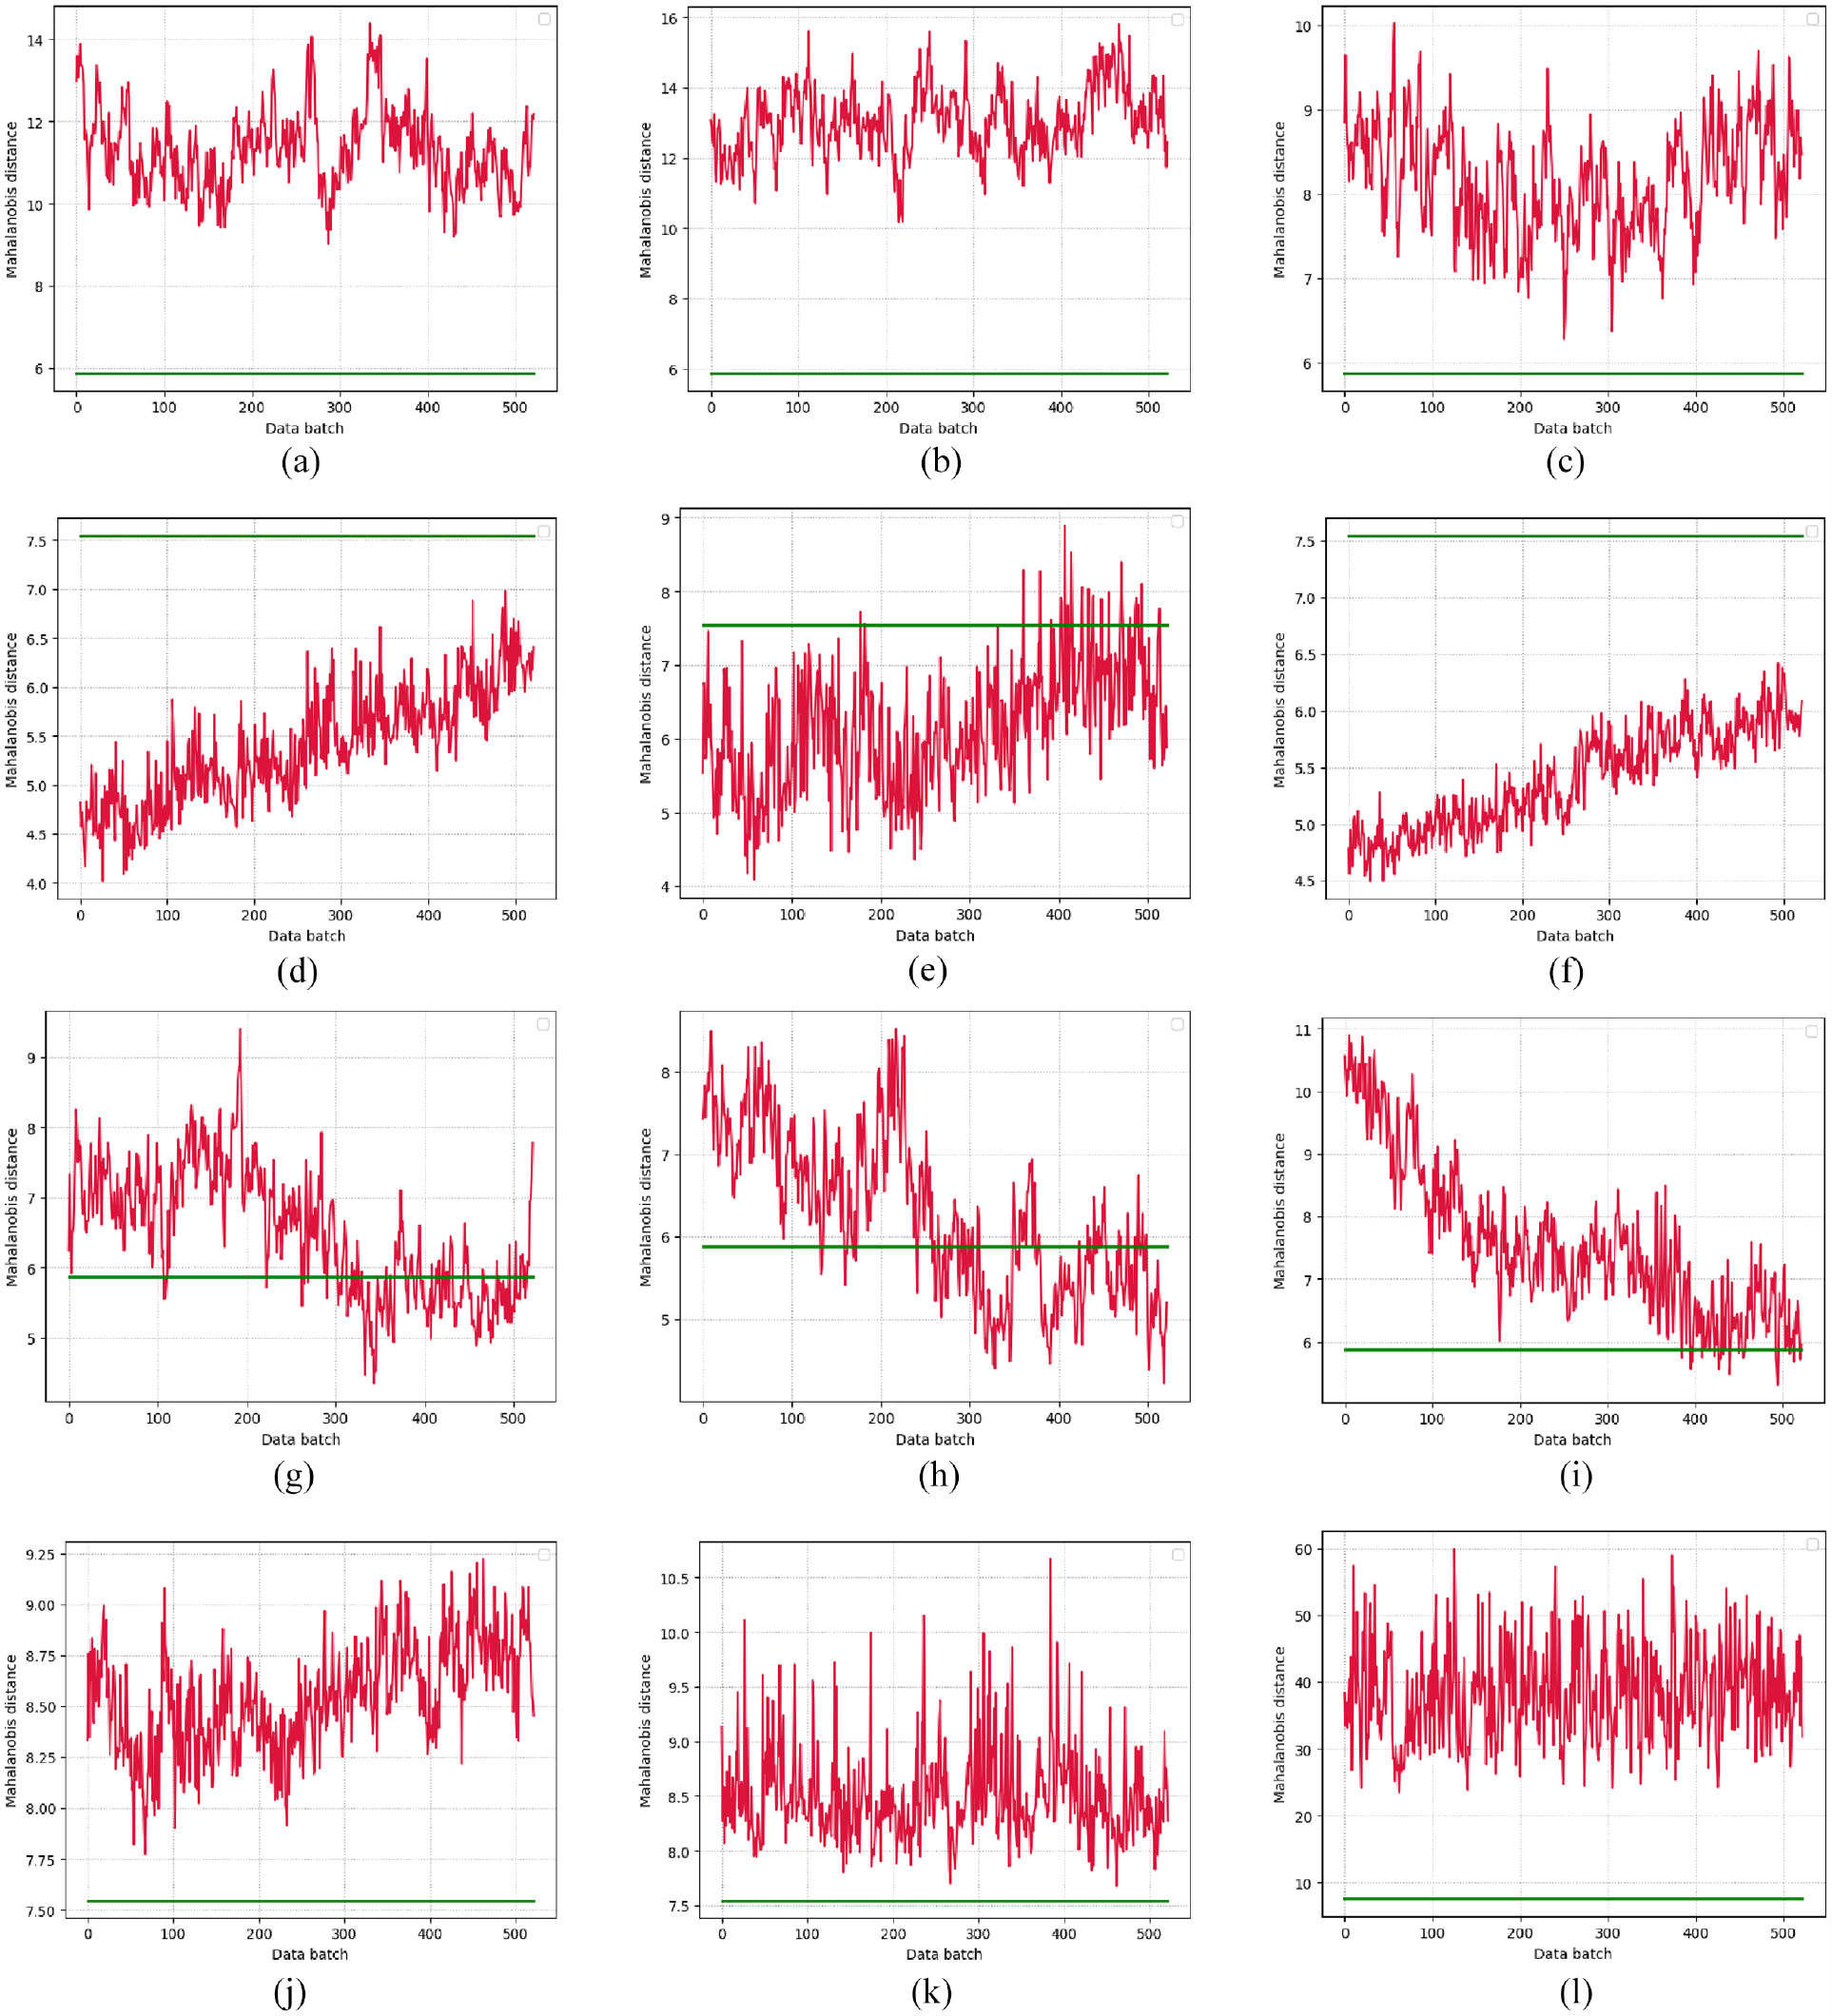
Calculated Mahalanobis distances of data batches considering scenarios with damage consisting of bolt absence and bolt loosened to 6 Nm: (a) amplitude 0.5—loosened bolt to 6 Nm at level 1, (b) amplitude 0.5—loosened bolt to 6 Nm at level 2,(c) amplitude 0.5—loosened bolt to 6 Nm at level 4, (d) amplitude 2—loosened bolt to 6 Nm at level 1, (e) amplitude 2—loosened bolt to 6 Nm at level 2, (f) amplitude 2—loosened bolt to 6 Nm at level 4, (g) amplitude 0.5—without bolt at level 1, (h) amplitude 0.5—without bolt at level 2, (i) amplitude 0.5—without bolt at level 4, (j) amplitude 2—without bolt at level 1, (k) amplitude2—without bolt at level 2, and (l) amplitude 2—without bolt at level 4.
Conclusions
Offshore WTs are rapidly growing as a vital source of renewable energy worldwide. However, the harsh marine environments in which they operate lead to structural deterioration and damage over time. Continuous monitoring of the structural health of these massive turbines is essential to prevent catastrophic failures and ensure their safety.
This paper presents a methodology for detecting bolt-loosening damage in the jacket support structures of offshore WTs. The technique leverages vibrational data from the structure together with data processing and statistical tools. PCA provides effective dimensionality reduction and transformation of the data. Comparison of new measurements with a purely healthy baseline through statistical metrics allows abnormal behavior and damage to be identified. Crucially, the technique only requires data from the undamaged structure for development and validation, eliminating the need for hard-to-obtain damage data.
The methodology is demonstrated using vibration data from a lab-scale WT model under different simulated structural states. The approach shows excellent detection accuracy for incipient loosening damage, even at a high preload torque level.
On the other hand, it is important to consider the comparability of experiments performed in a laboratory environment with the extreme conditions found on a real offshore platform. Although laboratory experiments provide valuable proof-of-concept validation, the proposed strategy should be validated in a more realistic environment to further increase its level of technological readiness. This could involve placing the laboratory tower in a water tank installation, subjecting it to the action of regular and irregular waves and using pattern recognition techniques. Another approach could be to use a finite-element model to simulate the extreme conditions and evaluate the impact on the Mahalanobis distance. These additional experiments and/or simulations will ensure that the methodology is validated in the complex and dynamic operating environments characteristic of offshore platforms.
Finally, it is important to note that EOCs significantly impact long-term monitoring of structures, complicating damage detection processes. Large variations in EOC necessitate their monitoring almost as critically as the structural monitoring itself, warranting EOC compensation to enhance monitoring accuracy. Numerous methods have been developed to address EOC compensation in WTs. For instance, clustering algorithms are used to categorize data into groups with similar EOC. 41 Covariance-driven stochastic subspace identification techniques are another method employed to mitigate EOC influences. 42 Additionally, fuzzy classification techniques have been applied for EOC compensation in various studies. 43 Despite these advancements, current research remains experimental, with further work required to implement these techniques in more realistic environments.
Looking ahead, the proposed method could be further improved by testing it on real data of actual WTs in operation. Unfortunately, these data are usually proprietary and not easily accessible to researchers. Therefore, it is crucial that in the near future, asset owners and researchers collaborate in a mutually beneficial way. This collaboration would allow asset owners to benefit from the latest data analytics and researchers to gain access to the necessary datasets to train and validate their models.
Footnotes
Declaration of conflicting interests
The author(s) declared no potential conflicts of interest with respect to the research, authorship, and/or publication of this article.
Funding
The author(s) disclosed receipt of the following financial support for the research, authorship, and/or publication of this article: This work is partially funded by the Spanish Agencia Estatal de Investigación (AEI)—Ministerio de Economía, Industria y Competitividad (MINECO), and the Fondo Europeo de Desarrollo Regional (FEDER) through the research projects PID2021-122132OB-C21 and TED2021-129512B-I00; and by the Generalitat de Catalunya through 2021-SGR-01044.