
Abstract
The health monitoring of infrastructure is vital for ensuring the safety and structural integrity of bridges. Recently, ground-based real aperture radar (GB-RAR) systems have been successfully utilized in the dynamic and static monitoring of bridges. In this study, a comprehensive and innovative approach is presented to monitor the vertical deformation of a long-span metallic railway bridge and a reinforced concrete Shinkansen bridge in Japan using a polarimetric GB-RAR system. Distinct from conventional signal processing procedures, the proposed method omits the coherent scatterer selection step. Instead, polarization analysis is employed to evaluate the properties of scatterers and identify those corresponding to bridge sections requiring monitoring, while considering the structural characteristics of the bridge. Simultaneously, the signal-to-noise ratio for monitoring is enhanced by combining co-polarization responses from scatterers. Furthermore, the radar look angle is determined by accounting for the spatial configuration of the survey and the polarization orientation angle. Lastly, vertical deformation is assessed by projecting line of sight deformation in the vertical direction. The findings reveal the dynamic responses of the two bridges under diverse loading conditions, which include the transit of a low-speed train and a high-speed Shinkansen bullet train. The results demonstrate that the polarimetric GB-RAR interferometry technique, coupled with the developed algorithms, can be effectively applied to monitor any type of bridge with unparalleled spatial and temporal resolutions.
Keywords
Introduction
Bridges are an essential component of transportation infrastructure, significantly influencing long-term economic growth and productivity, alongside various other types of civil structures. As bridges age rapidly and inevitably approach their intended design lifespans, the maintenance and deterioration of existing bridges have emerged as major concerns in numerous nations. Increased funding for bridge maintenance, repair, and rehabilitation is necessary to address the growing number of aged bridges.1,2 In many countries, the overall cost of repairing defective bridges has consistently risen each year, and insufficient maintenance can result in escalating future bridge maintenance costs. The risk of bridge failure has recently generated considerable attention, prompting the need for improved management strategies and a national strategic direction for maintaining and replacing faulty bridges. Traditionally, one of the methods for assessing bridge conditions has been on-site visual inspection by qualified inspectors. However, numerous limitations arise in this kind of inspection. First and foremost, on-site visual inspections can detect only visible damage, and not latent issues before they manifest. This lack of precision may provide an inaccurate representation of true structure condition. Additionally, the effectiveness of the inspection relies on the experience and judgment of the individual inspector. Moreover, on-site visual inspections are neither cost-effective nor suitable for continuous monitoring.3,4
In recent decades, infrastructure health monitoring has emerged as a highly effective technique for consistently and intermittently monitoring structural issues. The reduced cost of data collection for most infrastructure, and particularly bridges, has made infrastructure health monitoring more accessible and widespread.5,6 Infrastructure health monitoring involves implementing a strategy to identify potential issues as early as possible and determining the residual lifespan. In addition to damage inspection, understanding the current state and load-carrying capacity of in-service structures is crucial for long-term bridge usage and health monitoring. Damage to a bridge structure is defined as any change to material properties, boundary conditions, and system integrity. Such damage may result from natural disasters, such as earthquakes, tsunamis and floods, or man-made catastrophes, such as explosions. It may also stem from service load conditions, including aging, traffic growth, progressive deterioration, and environmental impacts. One benefit of a monitoring system for bridge health is its ability to objectively assess the condition of a structure over time and detect damage before it leads to severe problems or following a catastrophic event.
Various methodologies for bridge health monitoring exist at different stages.7–12 One of the most prevalent health monitoring approaches is vibration-based, founded on the principle that damage can be detected through the dynamic testing of structural changes. Dynamic testing can be performed on a structure by evaluating the mechanical response of its deformation. The assumption is that the damage does not result in a loss of mass but rather a loss of stiffness in one or more structural components. 13 Consequently, dynamic testing methods have garnered significant research attention in recent years, as an effective technique for monitoring and detecting the health condition of bridge infrastructure. The majority of dynamic testing methods employ fiber optic sensors and piezoelectric accelerometers. These transducers can accurately and reliably capture dynamic time series deformation. On monitored bridges, they must be installed in specific locations, and hard-wiring from the transducers to the data collection system is required. This process can be time-consuming and costly and may cause considerable damage to historical bridges.
According to the platform of radar systems, two main categories of microwave interferometric radar system have been employed in recent years for various purposes: space-borne synthetic aperture radar (SAR) systems and ground-based real aperture radar (GB-RAR) systems. Space-borne interferometry SAR (InSAR) can provide wide-area and semi-continuous monitoring.14–16 Ground- and satellite-based radar interferometers follow the same basic principles. The only difference is viewing the geometry. The interferometric radar can detect the displacement of the target in the target cone by using the phase information of the back-reflected microwave signal. If only single-point scattering of monochromatic wave impact is considered, the phase difference of the backward reflected wave depends on the distance between the radar and the target. However, this phase information cannot be directly used for distance measurement. Because this phase must be affected by an ambiguity phase equal to half a wavelength. It is also affected by the nature of the air at the moment and the changes in the position of the sensor. Therefore, the interferometry phase accuracy depends not only on the ability of the electronic device to appreciate small phase rotation but also on the subsequent signal processing. In an ideal situation, by using electromagnetic waves in the Ku band, the accuracy can reach 0.1 mm. Space-borne InSAR measurements offer high spatial resolution and a weekly measurement update and can detect changes in track geometry with millimeter precision. Since infrastructure deformation is primarily restricted to vertical and horizontal transversal directions, it is possible to estimate these two components of the deformation vector from multi-track radar data, albeit with sensitivity dependent on track orientation.
The GB-RAR interferometry approach is an alternative deformation measurement technology widely used for determining the dynamic deformation of bridges. It offers non-contact deformation monitoring with sub-millimetric accuracy, a simple-and-fast set-up investigation, and detailed condition assessment of the entire bridge structure.11,17,18 For GB-RAR interferometry, the radar transmits a modulated signal that gives the sensor the capability to detect the displacements of the different targets that are spaced more than the resolution of the radar. In many applications, only-range resolution monitoring could be not enough. In order to provide cross-range too, it is necessary for rotating or moving the microwave radar system. In this way, it is possible to obtain a 2D image in which the responses of targets at the same distance from the radar can be discriminated in azimuth. In other words, moving the microwave radar system, it is possible to obtain a 2D image of the displacement pattern and not only a plot of its projection in the view direction. This is an important capability, but obviously it makes the sensor rather slow, heavier, and bulky, so it is an option not so commonly implemented. It was because of its inability to provide 2D image, pinpointing the monitoring position in the reflection signal on bridges is difficult. More importantly, vertical deformation is typically more crucial than horizontal deformation in bridge dynamic monitoring. However, line of sight (LOS) deformation of the monitored bridge is the only information available from GB-RAR interferometry techniques.19,20
In recent years, researchers have proposed various approaches to address these two main disadvantages of employing GB-RAR interferometry techniques for infrastructure health monitoring. The first attempt to obtain 2-D imaging with range and cross-range resolution for monitoring deformation was proposed and tested by Pieraccini et al. 21 To measure the vertical bending and torsional movements of a bridge, a GB-RAR sensor was positioned beneath the bridge deck at a specific distance and radar look angle. 22 The dynamic deformation responses of two long-span bridges were observed using a multi-mode microwave interferometric radar technology known as GAMMA portable radar interferometry (GPRI), as described in Zhang et al. 23 Leveraging the GPRI system and specific radar look angles, the vertical deformation of the long-span bridge was obtained. Monti-Guarnieri et al. 24 proposed a technique to estimate 3D deformation using two or three synchronized GB-RAR sensors, and at least two fixed calibrators were proposed and tested in both lab and field measurements. The utilization of permanent scatterer interferometry synthetic aperture radar, ground-based radar interferometry and terrestrial laser scanning (TLS) to identify and analyze damage to metropolitan bridges was also outlined by Liu et al. 25 and Chen et al. 26 More recently, multi-static GB-RAR systems have been developed to obtain more accurate structural information for bridge monitoring.27,28
This article employs a polarimetric GB-RAR sensor to monitor the vertical deformation responses of two distinct types of bridge. A novel and comprehensive strategy is proposed to address the two main disadvantages associated with the application of GB-RAR interferometry for bridge monitoring. In contrast to traditional signal processing procedures, the proposed strategy omits the coherent scatterers selection step. For large infrastructure structures such as bridges (particularly metallic bridges), the majority of the structure can be considered to be characterized by high-quality scatterers during the dynamic monitoring period. Furthermore, polarization analysis is utilized to determine the properties of scatterers and select those corresponding to sections of the bridge structure requiring monitoring, by distinguishing the structural properties of the bridge. Simultaneously, the signal-to-noise ratio (SNR) of monitoring is enhanced by combining the co-polarization response to the scatterers. Moreover, the radar look angle is calculated by considering the spatial configuration of the survey and polarization orientation angle. Consequently, vertical deformation is performed by projecting the LOS deformation in the vertical direction. This study provides a novel monitoring strategy based on polarimetric GB-RAR sensor for railway bridges. This strategy could provide more detailed information about bridges. It will also contribute to the large infrastructure structure health (dam, tower, and tunnel) and nature disaster (landslide, snow, and glacier movement) monitoring.
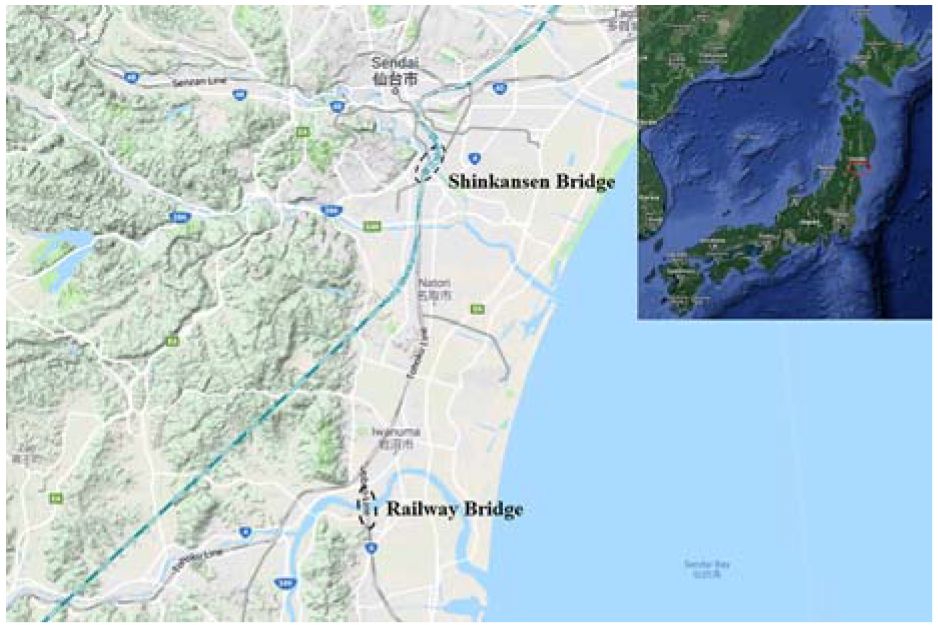
Locations of monitored bridges (Sendai, Japan).
Methodology
Ground-based radar interferometry
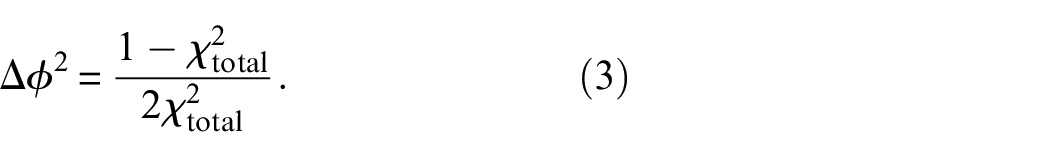
Ground- and satellite-based radar interferometers follow the same basic principles. The only difference is viewing the geometry. As a kind of sensor, the ground interferometric radar can detect the displacement of the target in the target cone by using the phase information of the back-reflected microwave signal. If only single-point scattering of monochromatic wave impact is considered, the phase difference of the backward reflected wave depends on the distance between the radar and the target. However, this phase information cannot be directly used for distance measurement. Because this phase must be affected by an ambiguity phase equal to half a wavelength. Therefore, the interference phase Δφ21 obtained at two moments can be expressed as: 15

where Δφvib is the component related to the vibration; Δφnoise is the phase noise component; finally, the term 2nπ is due to the fact of phase wrapping corresponding to the ambiguity phase equal to half a wavelength.
Polarimetric radar system
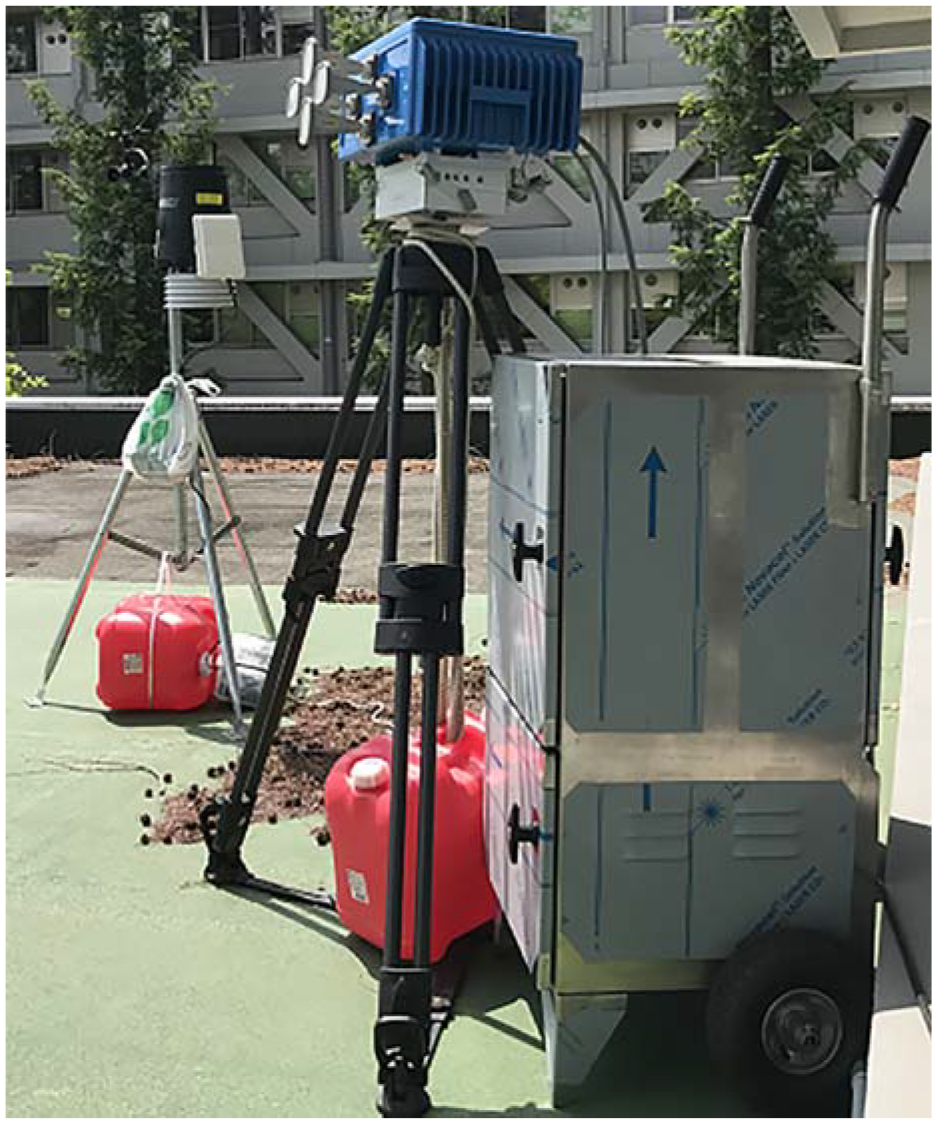
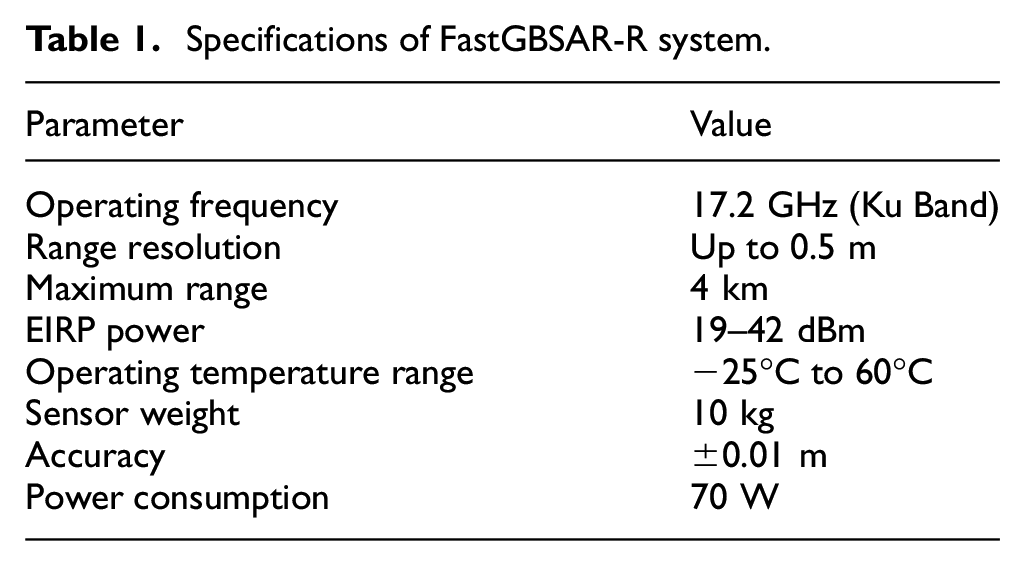
FastGBSAR-R, operating in full polarimetric RAR mode as shown in Figure 2, was used to collect data. This frequency modulated continuous wave radar operates in the frequency band 17–17.3 GHz, providing a 0.5-m range resolution. It utilizes four horn antennas to collect fully polarimetric radar data. Two of the four horn antennas are used for transmitting horizontal (H) and vertical (V) polarimetric electromagnetic waves, whereas the other two receive the horizontal (H) and vertical (V) polarimetric reflective waves. As a result, a full polarimetric response (HH, HV, VH, and VV) from the structure can be obtained. The system can achieve an extremely high pulse repetition frequency (PRF) to meet various monitoring requirements. The system parameters are summarized in Table 1.
Polarimetric FastGBSAR-R system.
Specifications of FastGBSAR-R system.
Scattering properties
With SAR observation, estimation of deformation parameters using the interferometric phase is limited to coherent scatterers. The coherent scatterers are primarily reflected from targets with stable phase values in time, such as buildings, bare rocks, railways, and bridges. 29 However, extracting all coherent scatterers in a relatively short time period may not be ideal or reliable. A minimum of half an hour of continuous monitoring of the static scene by GB-RAR is required to obtain high-quality coherent scattering, which is impossible for a traffic-busy bridge. Moreover, this approach lacks sensitivity for accurately locating coherent scatterers within radar coordinates and detecting sidelobes. Therefore, employment of the selection process for coherent scatterers in bridge monitoring applications is herein avoided.
Instead, polarization analysis is used to examine the scattering properties of the bridge structure and identify reflections from the bridge deck. However, these resolution cells of the bridge deck are not all high-quality scatterers and are usually very noisy. To mitigate the noise, the average phase of dual-channel (HH and VV) with an allocated weight function relating to the correlation level of VV and HH channels is adopted. 30 This approach helps improve the monitoring of dynamic deformation from the bridge deck.
Classification of target properties
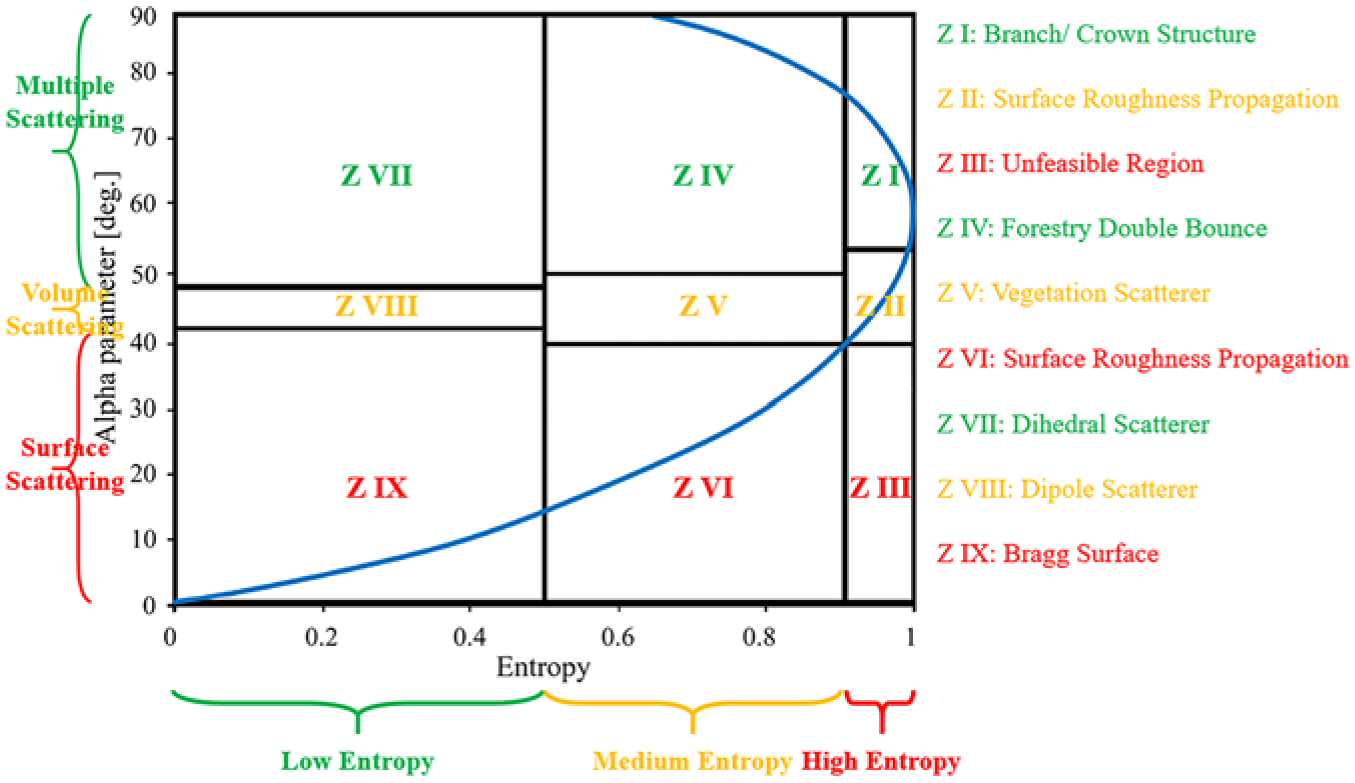
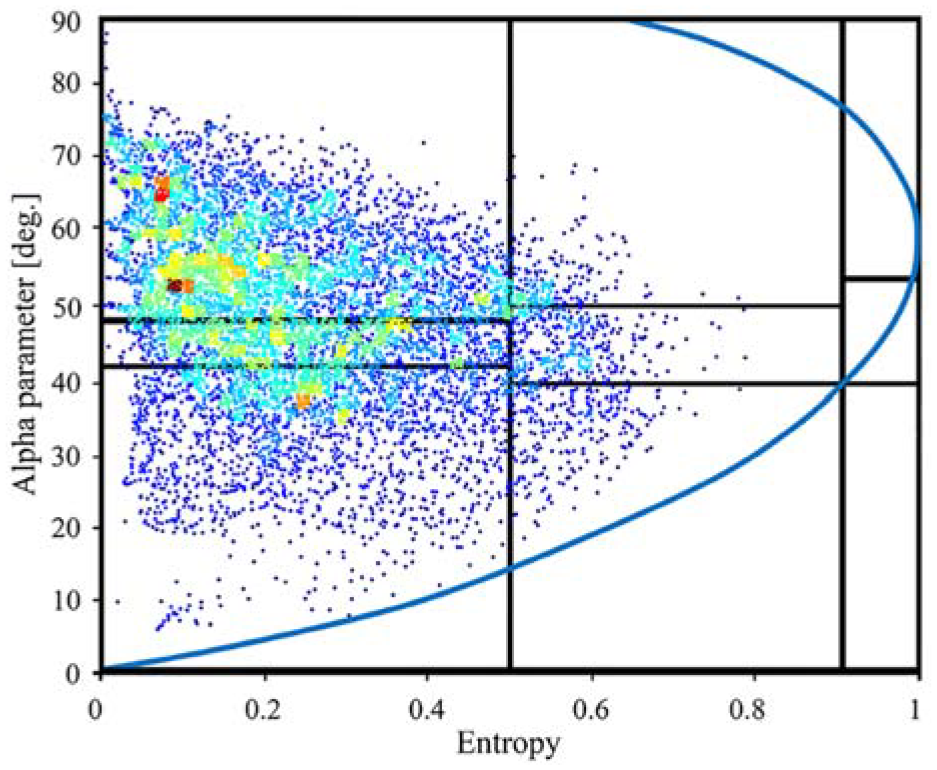
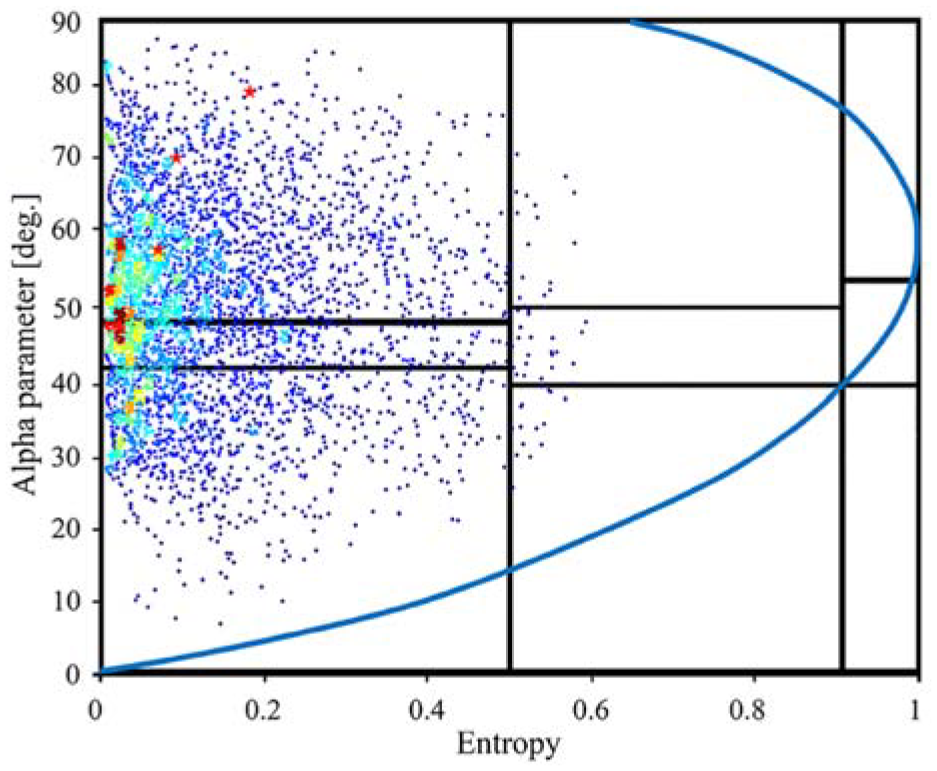
In reality, a SAR resolution cell – where a single coherent scatterer may be found – is defined by a superposition of three scattering processes; namely pure surface, volume, and dihedral scatterers. The most important information in relation to scattering is contained in the polarization response, and the scattering matrix can hold all of the polarization information. The initial purpose of polarization decomposition (a commonly utilized polarization attribute analysis technique) is to classify the topography in SAR images. Currently, many approaches that decompose the polarimetric scattering matrix are applied to more meaningful, phenomenological parameter spaces.31–34 Based on these approaches, polarimetric information can be applied in specialized cases for target identification and classification.35–37 In this study, the polarization features of bridge details are evaluated using the H–α decomposition approach, which is independent of a particular dataset.
The average scattering mechanisms of the targets are represented by
2-D
Deformation prediction improvement
Due to the submeter-level spatial resolution of GB-RAR observation, a scatterer contains various noises. The total coherence can be modeled as:

The loss of coherence caused by SNR decorrelation effects is represented by
Researchers have established that the SNR of scatterers plays a critical role in determining the accuracy of deformation monitoring in real-world measurements.
39
In addition to considering the SNR value, the distance between scatterers within the scene must also be taken into account. Given that the obtained SNR values appear to be significantly overestimated, it is logical to establish a correlation between deformation and total coherence based on the preceding discussion, to enhance the real-world accuracy of deformation measurements under field conditions. In this article, we implement an approach that combines the co-polarization deformation of scatterers according to coherence, to improve the estimation of the deformation time series. More specifically, the associated deformation of scatterers in the HH and VV channels is denoted as
The designated weights for deformation in the HH and VV channels are represented by
Vertical deformation calculation
Calculation of the vertical deformation based on acquisition geometry and radar polarimetry was next focused upon. The geometry of the bridge deck is shown in Figure 4. The azimuth direction and ground range direction were determined by radar
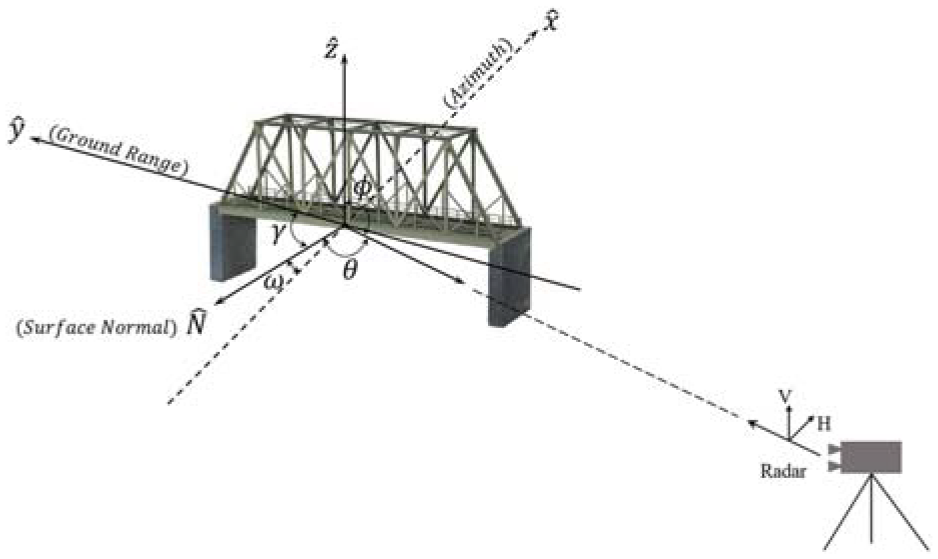
Radar imaging geometry of bridge deck.
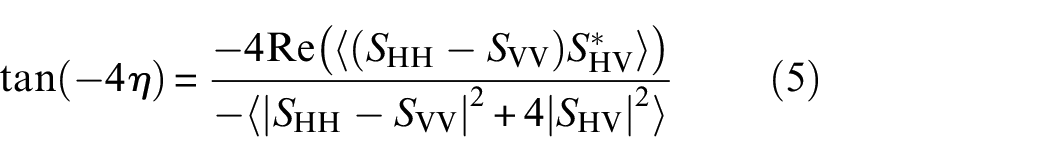
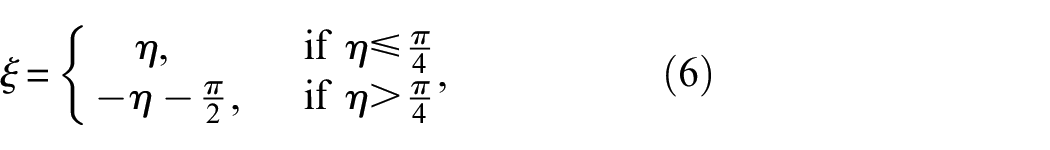
The radar LOS rotation angle is known as the polarization orientation angle (POA). 35 The angle of correlation between LL and RR circular polarization may be used to estimate the POA using PolSAR data, 36 and is expressed as:
where
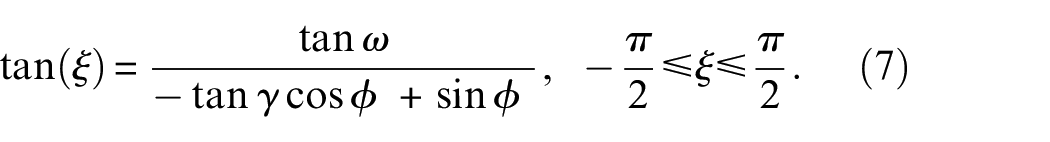
It can also be concluded from Figure 4 that:
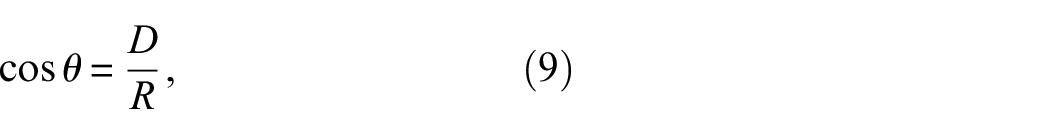
Since the sensor was positioned on a tripod at a fixed distance
where
Using the aforementioned equations, the radar look angle
Monitoring results
Survey site
Two bridges in Japan were selected for health condition monitoring. Both bridges are located near Sendai, the largest city in the northeastern region of Japan, situated northeast of Tokyo on Honshu Island. A devastating tsunami caused by a magnitude 9.0 offshore earthquake on 11 March 2011 severely damaged the coastal areas of the city. The locations of the monitored bridges are shown in Figure 1. Both bridges are situated in the flood area affected by the destructive tsunami. As a result, evaluating the health condition of these bridges for safety considerations is crucial.
The long-span metallic railway bridge is part of the Joban Line Railway, operated by the East Japan Railway Company. The Joban Line begins at Nippori Station in Arakawa, Tokyo and runs roughly parallel to the Pacific coastlines of Chiba, Ibaraki and Fukushima prefectures before ending at Iwanuma Station in Iwanuma, Miyagi. The bridge spans the Abukuma River, connecting Iwanuma city to Watari town with a dual-lane railway.
The reinforced concrete Shinkansen bridge carries the dual-lane high-speed railway line of the Tohoku Shinkansen. The Tohoku Shinkansen is the longest Shinkansen line in Japan, operating at high speed between Tokyo and Aomori in Aomori prefecture. The Yamagata Shinkansen and Akita Shinkansen are two of its mini-shinkansen branch lines. The reinforced concrete Shinkansen bridge crosses the Hirose River, which flows through the center of Sendai City.
Long-span metallic railway bridge
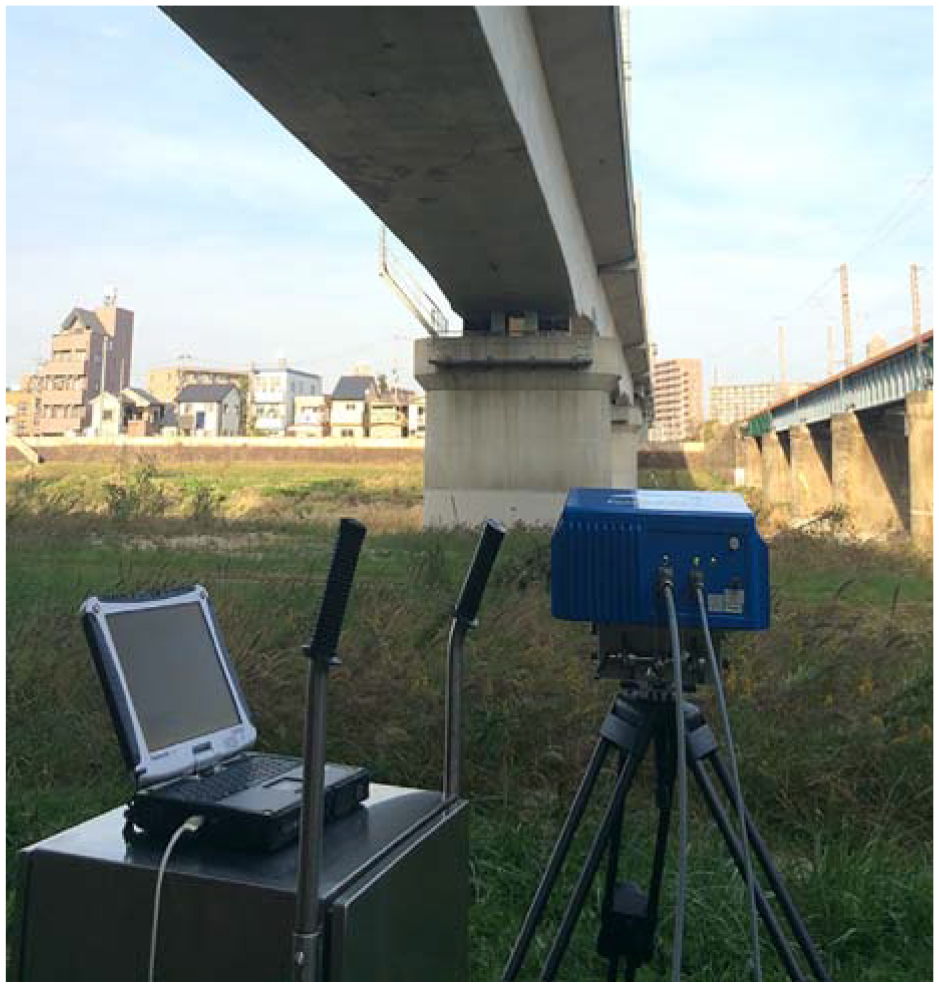
The FastGBSAR-R radar sensor, as described in section ‘Methodology,’ was implemented to monitor the dynamic behavior of the long-span metallic railway bridge. The polarimetric performance of the sensor was calibrated following the methodology outlined by Zhou et al. 40 Positioned on a tripod 10 m distant from the bridge, the sensor was directed along the structure, as depicted in Figure 5. Measurements were conducted during the normal traffic conditions of the trains. This study aims to offer dynamic monitoring of the bridge during train crossings. The health condition of the bridge can be assessed by evaluating the vertical deformation scale. The radar system is capable of providing a radar profile with an exceptionally short sampling time. In this study, the PRF was set at 500 Hz with 300 s acquisition.
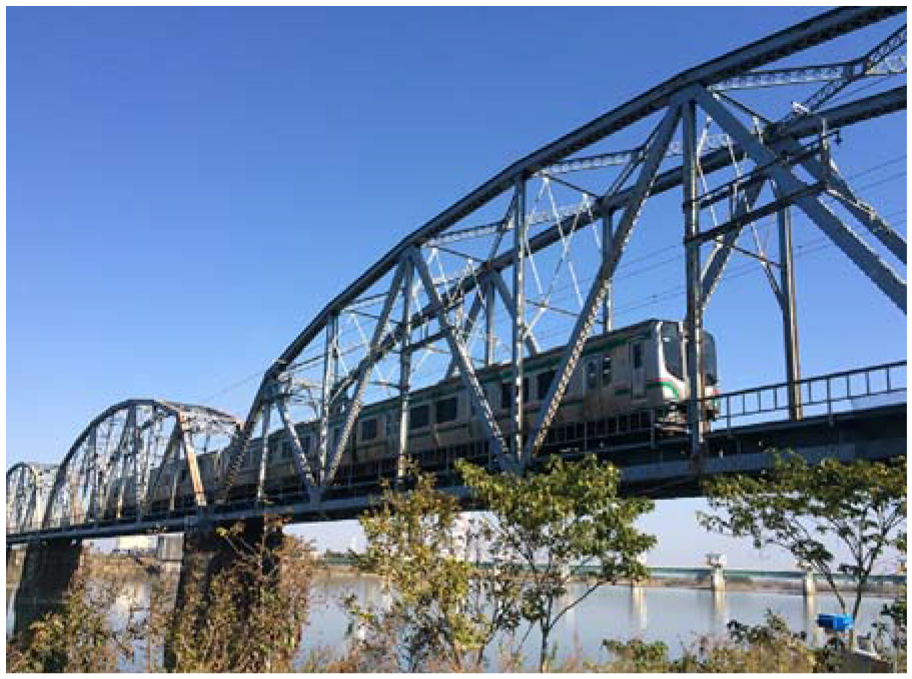
Polarimetric FastGBSAR-R system set up beside metallic railway bridge while a train passes.
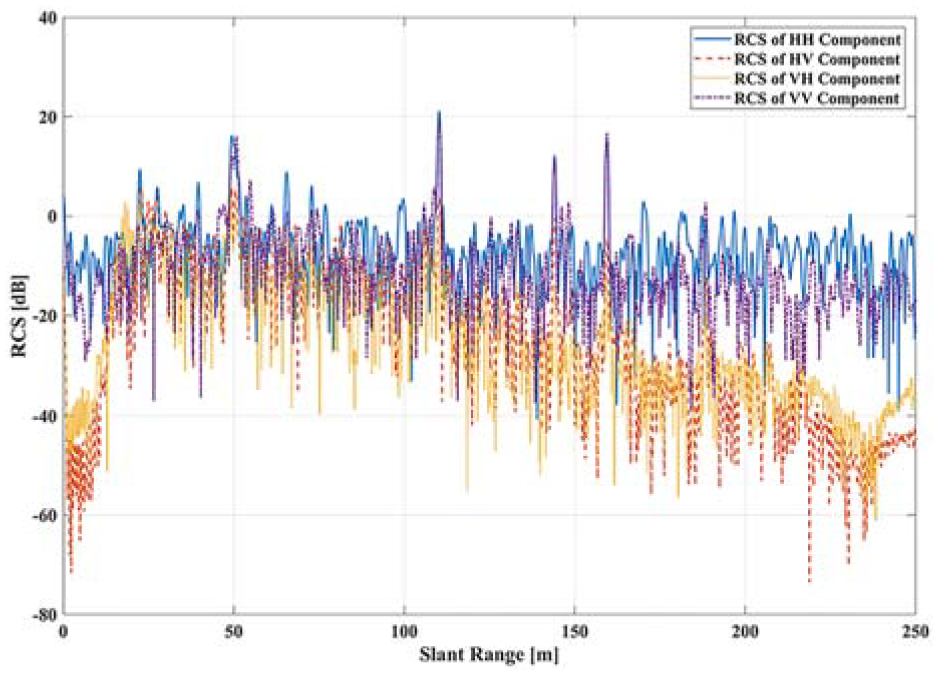
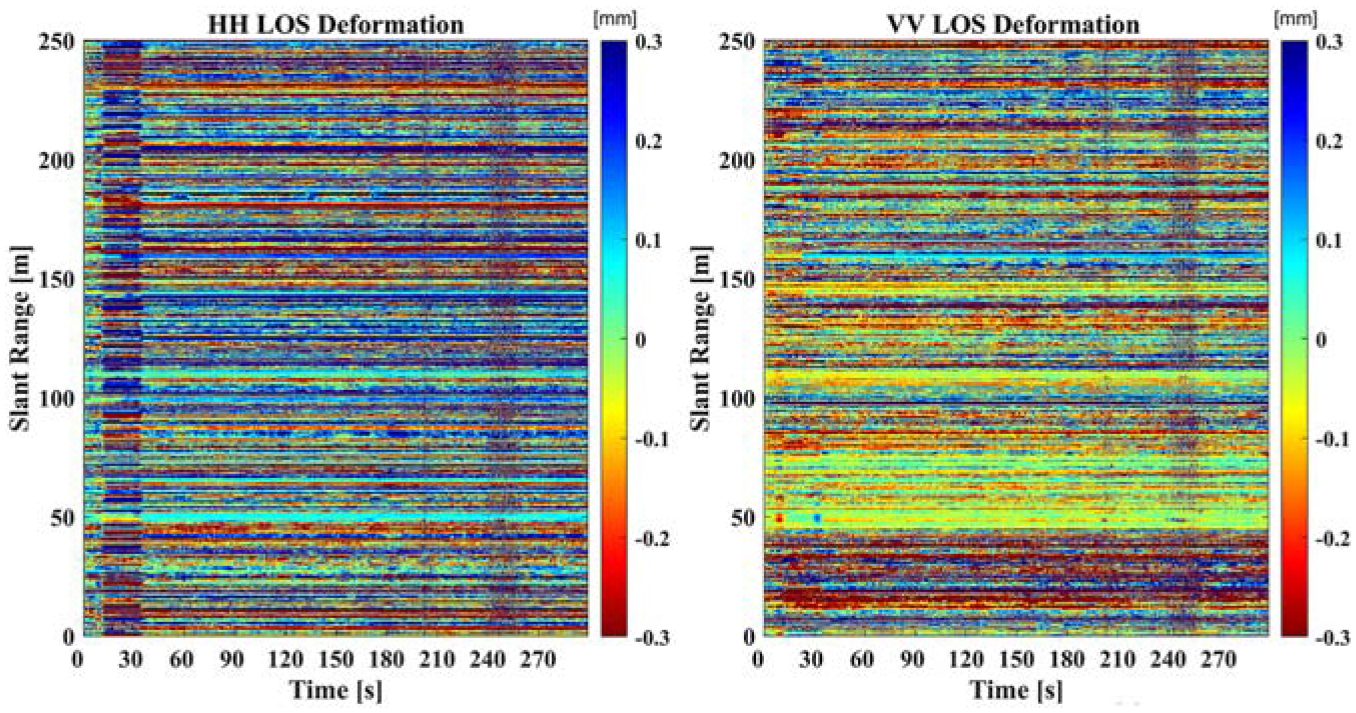
The RCS profiles of HH and VV polarimetric responses for this bridge are displayed in Figure 6. Owing to the scattering properties of the bridge and the acquisition geometry, the RCS diminishes consistently as the distance increases. The discernible bridge response begins at 40 m range. The corresponding temporal profiles of the LOS deformation for each polarimetric component are captured as a train passes by. As illustrated in Figure 7, the bridge remains static while no trains are traversing it. However, as a train moves along the railway, the condition of the bridge alters rapidly. At all range profiles corresponding to the objectives on the bridge, high-speed moving trains traversing the railway cause considerable variation to the condition of the bridge between the time periods of 200 and 260 s.
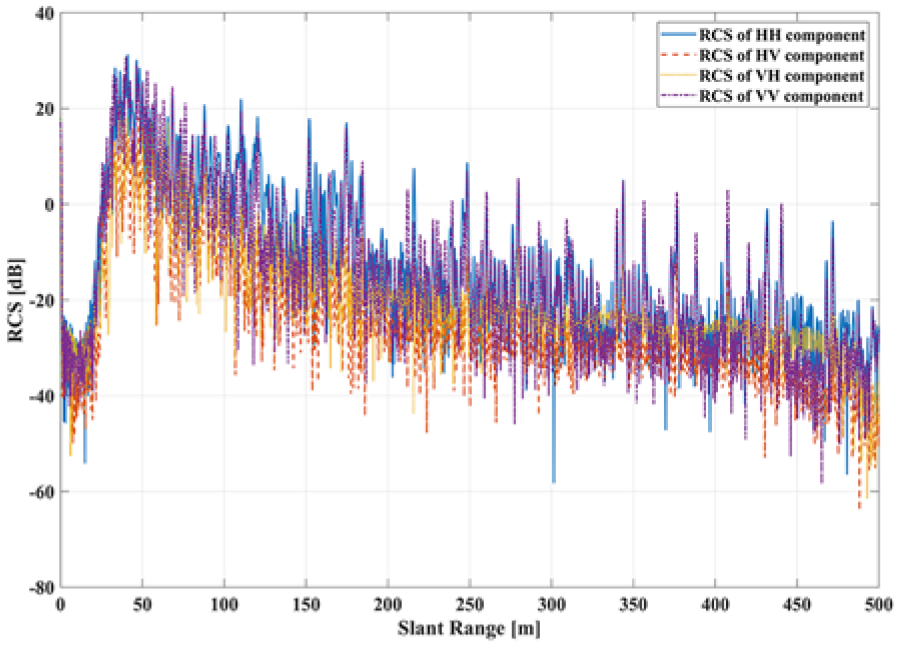
RCS profile of HH, HV, VH, and VV components acquired at metallic railway bridge.
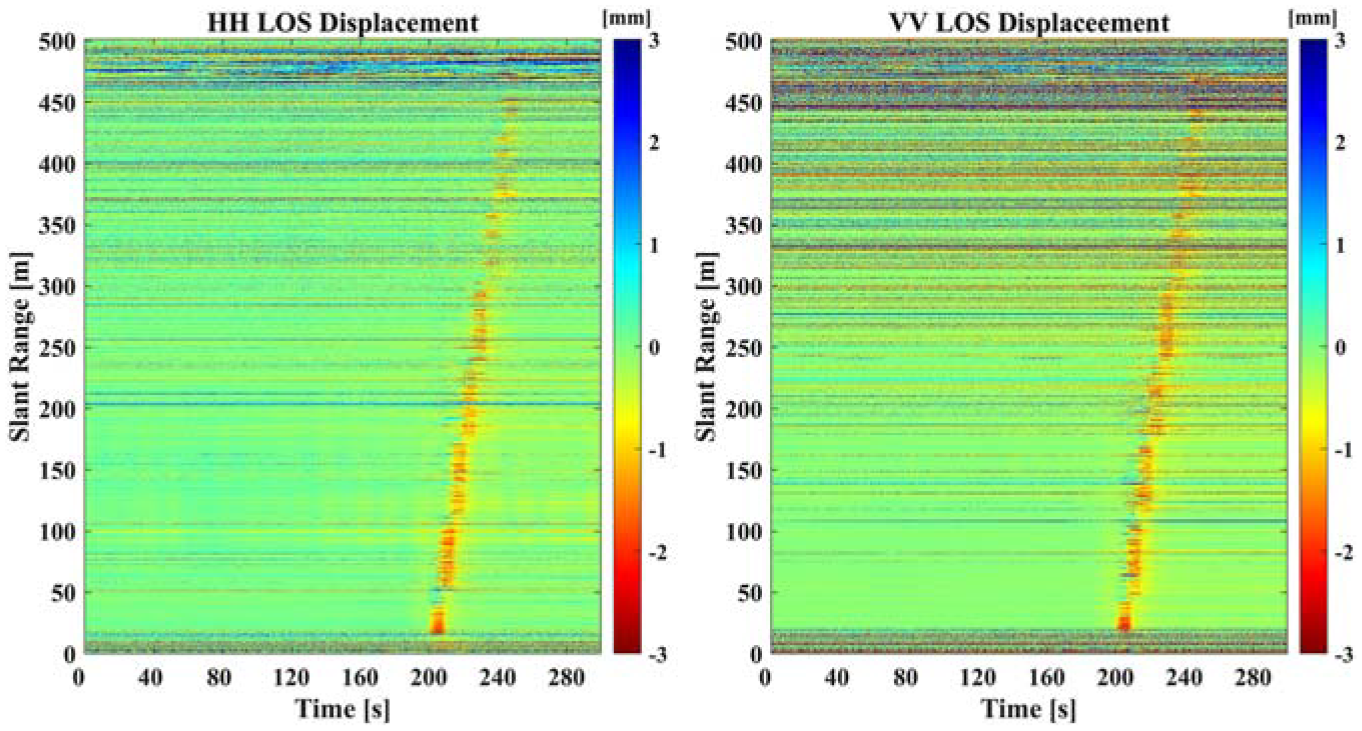
LOS deformation profiles measured at metallic railway bridge while a train passes.
The
Polarimetric data distribution of metallic railway bridge in the 2-D
Figure 9 illustrates the vertical deformation of the metallic railway bridge induced by a moving train. The moving trains affect the metallic railway bridge during the time interval 200–250 s, resulting in significant deformation. Because the pillars scattering points has been removed during
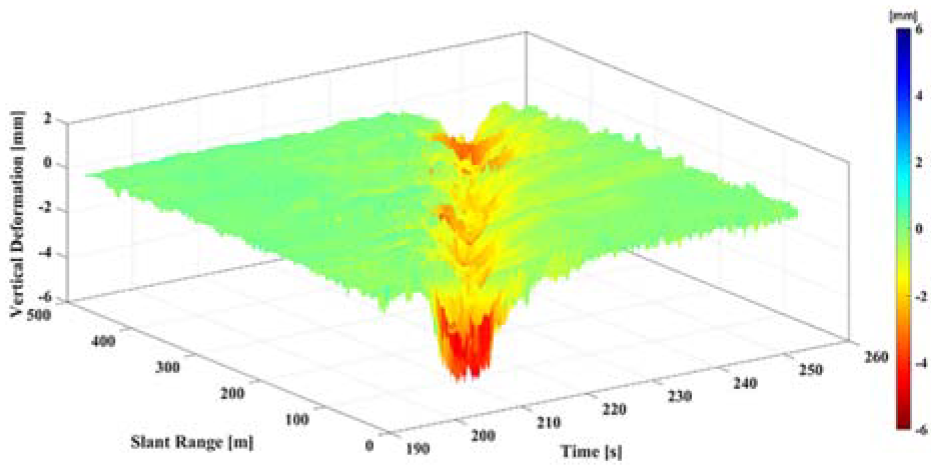
Vertical deformation of metallic railway bridge with one train on bridge.
Maximum downward vertical deformation of metallic railway bridge with one train passing.
Reinforced concrete Shinkansen bridge
The FastGBSAR-R radar sensor was also implemented to investigate the dynamic behavior of a reinforced concrete Shinkansen bridge. The sensor was positioned on a tripod under the edge of the bridge, with the antennas directed along the structure, as depicted in Figure 11, and measurements were taken during normal traffic conditions. In this study, the PRF was set at 1000 Hz, and the acquisition lasted for 300 s. The RCS profiles of each polarimetric response for this bridge are displayed in Figure 12. The corresponding temporal profiles of the LOS deformation for HH and VV polarimetric components during the passing of a Shinkansen bullet train are shown in Figure 13. It can be observed that, between 10 and 40 s, deformation has been measured in all the range profiles corresponding to targets on the bridge.
Polarimetric FastGBSAR-R system set up beside Shinkansen bridge.
RCS profile of HH, HV, VH, and VV components acquired at Shinkansen bridge.
LOS deformation profiles measured at reinforced concrete bridge during passing of a Shinkansen train.
As the bridge deck surface is relatively smooth, the back-reflected signals of each polarimetric component are very weak. A lower SNR will result in poorer interferometry phase quality, as also demonstrated in Figure 13. It is not advised to monitor the interferometry phase of all reflections from the bridge deck. Only a limited number of reflection points on the structure can retrieve accurate deformation time series.
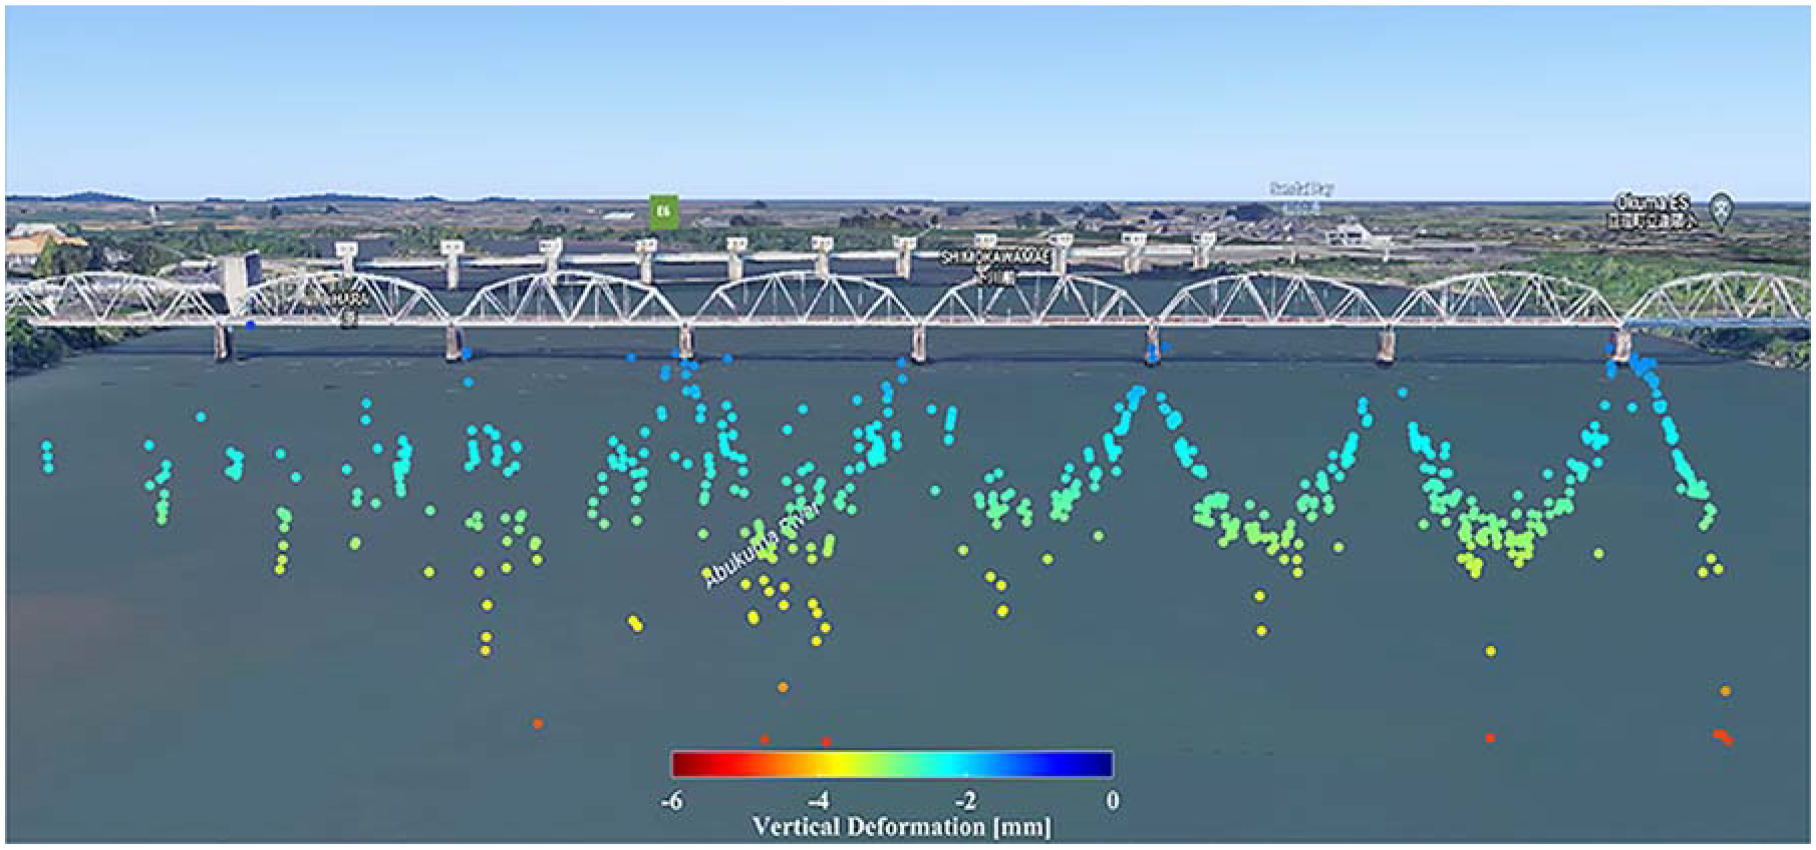
In Figure 12, three high RCS reflection points can be observed at around 50, 110 and 160 m. The
Polarimetric data distribution of Shinkansen bridge in the 2-D
The three red stars in Figure 14 represent points with high RCS values. It is evident that the reflection of these three points originates from a target similar to a dihedral reflector. Furthermore, the absolute amplitude of the reflections is plotted in a figure, with the absolute amplitude of the HH component on the horizontal axis and the absolute amplitude of the VV component on the vertical axis, as depicted in Figure 15. From this figure, it can be observed that the three reflections (marked as red stars) are distributed around the diagonal region. This indicates that the HH component responses are nearly equal to the VV component responses.
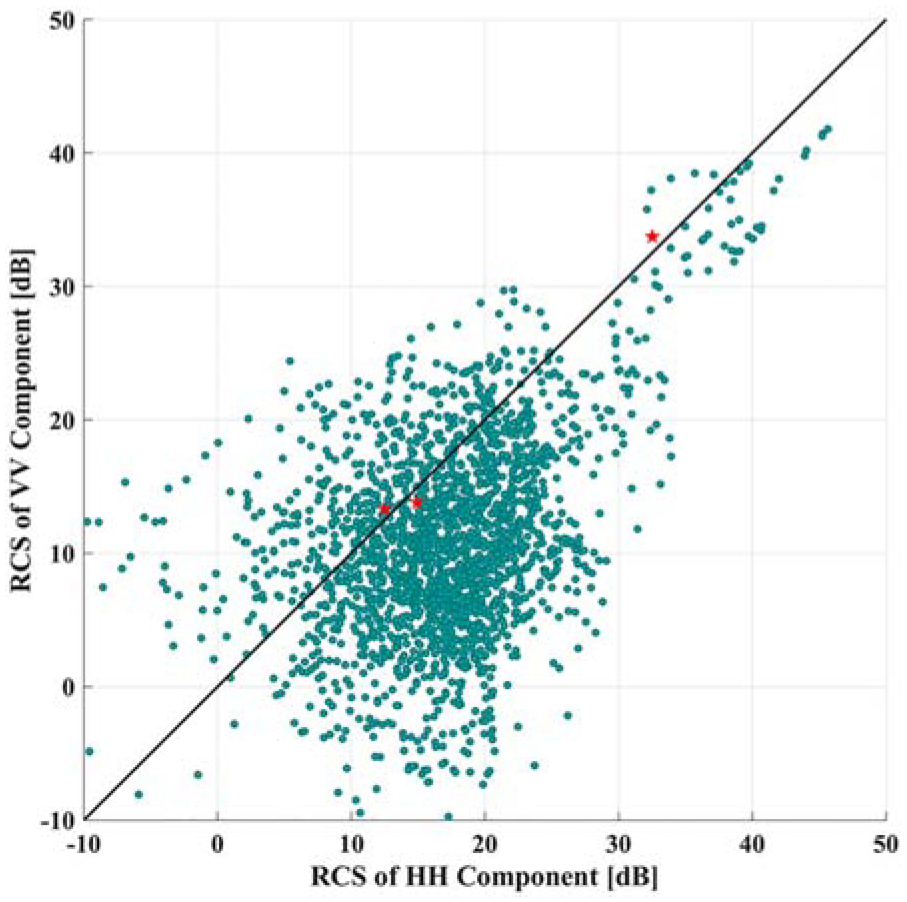
Polarimetric data distribution in HH and VV components of RCS.
Considering the acquisition geometry, we conclude that these reflections originate from the horizontal deck with a vertical edge, similar to a dihedral corner reflector. The altitude difference between the sensor and the bridge deck is 2.5 m. The deformation of the three points in the vertical direction can be readily converted using the slant range distances, as illustrated in Figure 16. The maximum vertical deformation of the reinforced concrete Shinkansen bridge is approximately 10 mm. Each sawtooth pattern in the deformation curve corresponds to a Shinkansen bullet train carriage. These monitoring results consist with the results obtained by Linear Variable Differential Transformer (LVDT) sensors of an urban railway bridge. 41
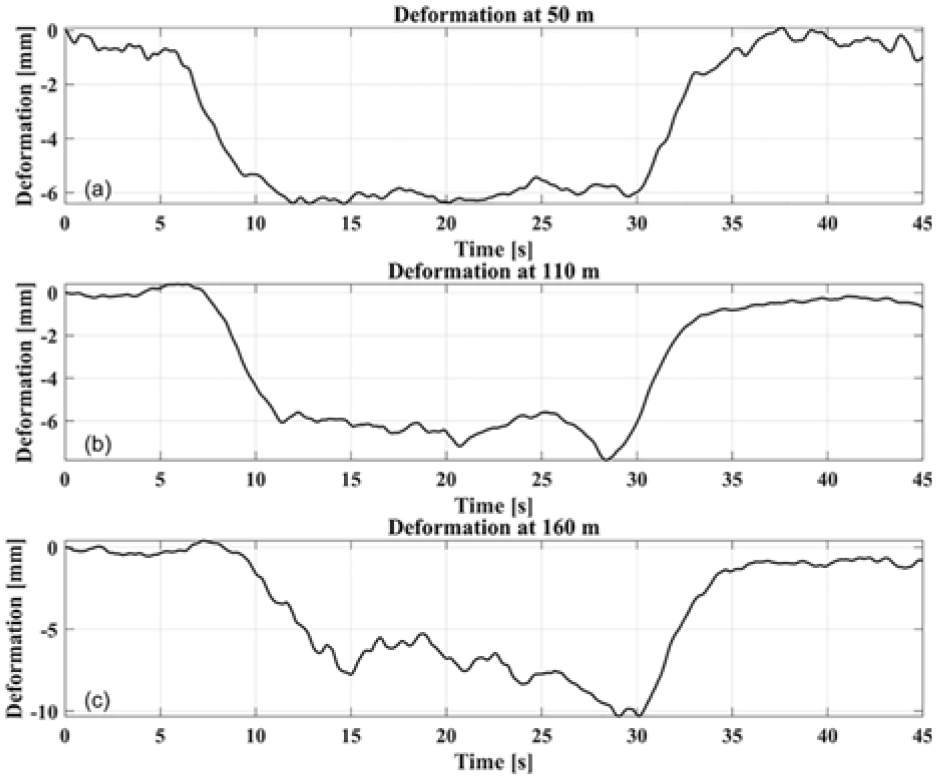
Vertical deformation of three different points of reinforced concrete at Shinkansen bridge.
Discussion and conclusion
GB-RAR interferometry is a recently proposed measurement technique for infrastructure health monitoring. Its unique advantage lies in its ability to provide global information on the structure being tested. The only drawback is that it can be challenging to precisely pinpoint the measured deformation within the structure, as it can potentially be affected by all points in the same resolution cell. In this article, we propose various strategies to mitigate the disadvantages of using GB-RAR interferometry technology for bridge monitoring. The vertical deformation characteristics of bridges are investigated using a polarimetric GB-RAR system with an advanced signal processing technique, and the connection between mode parameters and the physical structure of a bridge are also identified. Innovative signal processing methodologies include scattering characteristic classification through polarization analysis, enhanced deformation prediction through dual polarization channels, and radar look angle estimation for vertical deformation calculations, to provide accurate structural localization and vertical deformation in bridge monitoring. The findings unveil the dynamic responses of two types of bridge under different loading conditions, including the passing of low-speed trains and high-speed Shinkansen bullet trains. The results demonstrate that polarimetric GB-RAR, in combination with the proposed algorithms, is an effective methodology for monitoring bridge structures and improves the comprehensiveness and accuracy of dynamic deformation monitoring.
Footnotes
Declaration of conflicting interests
The authors declared no potential conflicts of interest with respect to the research, authorship, and/or publication of this article.
Funding
The authors received no financial support for the research, authorship, and/or publication of this article.