
Abstract
A process and Structural Health Monitoring system was implemented on a Composite Overwrapped Pressure Vessel (COPV) for hydrogen storage at 350 bar to be used in a fuel-cell system of an Unmanned Aerial Vehicle. This work reports the embedment strategy of optical fibre Bragg grating (FBG) sensors to monitor the full life cycle of the vessel, consisting of an aluminium liner and a wound carbon fibre reinforced polymer composite overwrap. A FBG sensing array, bonded on the aluminium liner circumferential section, was covered with a localised unidirectional prepreg composite tape, enabling composite winding and curing monitoring. The sensing array strategy allowed to detect and locate Barely Visible Impact Damage resulting from drop-weight impact tests, based on the ratio of the residual strain amplitude between FBG sensor pairs. Errors as small as 17 mm and up to 56 mm were determined between the predicted and ‘real’ impact locations. To simulate the real-life operational pressure charging and discharging cycles, the COPV was subjected to cycling testing at different pressure ranges. The FBG sensors were able to monitor a total of 20 980 pressure cycles, revealing a linear response to the applied pressure, and remained operational after COPV failure. Furthermore, the FBG sensing array was able to detect the residual plastic strain caused in the aluminium liner by the autofrettage process that the COPV was subjected to prior to pressure cycling, at 600 bar for 2 min, to improve its fatigue performance. This manuscript also reports the COPV structural design by Finite Element Modelling (FEM), its manufacturing process and burst pressure testing for the FEM analysis validation. A small difference of 0.7% was found between the simulated and experimental determined burst pressure of 1061 ± 26 bar.
Keywords
Introduction
It is estimated that around 20% of the global carbon dioxide emissions are produced by burning fossil fuels in combustion engines. Since the 1970s, owing to the oil crisis, and particularly in the last decade, additional research efforts have been made to replace the fossil fuels used in the transportation sector, aiming to constrain global warming to 1.5 °C. 1 Fuel cells (FCs) are an emergent hydrogen-powered propulsion system, which may help to lessen climate changes. 2 They are expected to be widely used in the automotive industry in a near future, as demonstrated by the several FC electric vehicles (FCEVs) already commercialised by the bigger automotive manufacturers, such as Toyota, Hyundai and Honda. 1 In comparison to battery electric vehicles, FCEVs have faster refuelling times (around 3–5 min) for a 600 km autonomy, superior longevity (>200,000 km), reducing associated anxiety and providing a better and safer experience to the driver. 1 The exploitation of hydrogen-powered technologies is not only foreseen in the automotive industry. Hydrogen powered Unmanned Aerial Vehicles (UAVs) 3 are being developed and even Airbus has recently announced its pursuit of hydrogen powered aircrafts with the ZEROe concept, with hydrogen combustion through modified gas turbine engines and hydrogen FCs. 4 The implementation of hydrogen-powered systems depends on the development of pressure vessels capable of storing hydrogen at high pressure. Among the existing solutions, Composite Overwrapped Pressure Vessels (COPVs) seem to be presently the most weight-efficient option. 5
The complexity of the supplying schemes, array of construction solutions provided by different manufacturers and material degradation in the COPVs pose some reliability issues on these systems’ performance. Periodic inspections through traditional non-destructive methods, such as ultrasonic, radiography, acoustic emission, shearography and visual inspections, might miss crucial information, for accurate assessment of the structural condition of the COPV. In contrast, instrumentation of composite pressure vessels and the implementation of structural health monitoring (SHM) systems provides additional safety, with the acquired continuous data enabling the detection of critical debilities and defects, like onset and propagation of delamination and fracture, excessive stresses/strains, leakage, etc. 6
The real-time detection of damages such as Barely Visible Impact Damage (BVID) or fibre breakage may prompt the immediate repair or inactivation of the COPV before burst may happen. Several studies have reported the instrumentation of COPV for SHM,7,8 impact damage detection9,10 and a few of them have also reported the use of the same sensors for monitoring of the manufacturing 11 and curing 6 processes. The instrumentation of COPV is mainly restricted to fibre optic-based sensors.6,8–14 Back in 2010, Frias et al. 7 have compared the performance of FBG and polyvinylidene fluoride (PVDF) piezoelectric sensors embedded in a steel liner/composite overwrap interface, to monitor the strain in both longitudinal and circumferential directions. The PVDF and FBG sensors showed good agreement under cyclic internal pressure loading up to 40 bar. However, this type of construction is not adequate to COPVs applied in the storage of hydrogen at high pressure.
Sensors should be integrated at places of higher strains, which usually happens in between the liner and first layer of the composite overwrap or in between different layers of the composite overwrap. Gasior et al. 6 have embedded FBG sensors on the surface of the polyethylene liner of a type IV COPV for hydrogen storage at 700 bar for automotive applications. Three optical fibres (OFs), having 4 FBG sensors each, were placed in the axial direction of the liner, separated by an angle of 120°. The sensors enabled the control of the manufacturing step, by the measurement of strain during winding and curing. The suitability of the system for operation monitoring was demonstrated during pressure cyclic testing. Saeter et al. 9 embedded a network of OF distributed Rayleigh backscattering sensors, in between layers of hoop wound layers. The authors tested two configuration networks for impact damage detection: (1) a grid with OF running in the longitudinal and hoop direction within a region of 3 × 3 cm2; and (2) a spiral placed in the hoop direction, although with a pitch angle different from that of the wound CF layers. While the grid network could evaluate the damage extent in two directions, the authors disclosed this was a labour-intensive procedure. The spiral network demonstrated to be suitable for damage location and severity assessment. With the carbon fibres bearing most of the loading in the COPV, it is advantageous that strain is measured along the carbon fibres direction. Nevertheless, challenges concerning practical integration of OF, due to their fragility, intrusiveness (producing ply defects), and inability to contour some geometric characteristics like hard curvatures should not be disregarded.7,9
This work reports the development of a COPV for storage of the hydrogen needed to supply the FC system of an electrically powered UAV. A 1-L COPV was designed for hydrogen storage at 350 bar pressure, resorting to Finite Element Modelling (FEM) analysis. In an attempt to assess the presence of flaws that may cause any unpredicted failure of a pressure vessel with a catastrophic outcome, the COPV was instrumented with an array of optical FBG sensors to monitor its production, including the composite winding and curing processes, detect and locate impact damages and monitor pressure cycling testing. The demonstration of pressure cycling monitoring capabilities aims at validating the proposed sensing system for monitoring of the real operating life of COPVs, consisting of pressure charging and discharging cycles. Moreover, having an embedded OF that can endure and monitor these large number of pressure cycles can provide safety assurance in the development of new COPV designs.
Materials and experimental techniques
Materials
A 6 mm wide prepreg tape made of Tenax®-E ITS50 carbon fibre from Teijin, Japan, and RCX0125 epoxy from RED Composites, Newport, United Kingdom, was used to produce the composite overwrapped wall of the COPV. A liner with an aluminium alloy 6061-T6 was selected, due to its high resistance to the embrittlement and impermeability to the very small hydrogen molecules, and thus, ensuring much higher reliability.
Experimental techniques
Development of the smart COPV
The COPV was developed to satisfy the requirement of a 2-h flight autonomy for the UAV, which was found to be accomplished with a volume capacity of 2 L of hydrogen stored at 350 bar. Thus, to ensure uniform weight distribution, a 1-L capacity COPV was placed under each of the two UAV wings. To withstand the service pressure of 350 bar, the COPV was designed to have a minimum burst pressure of 1050 bar, in order to ensure the safety coefficient of three recommended by EN12245 European standard. 15 The iterative working steps used in the design and development of the COPV may be seen in Figure 1.
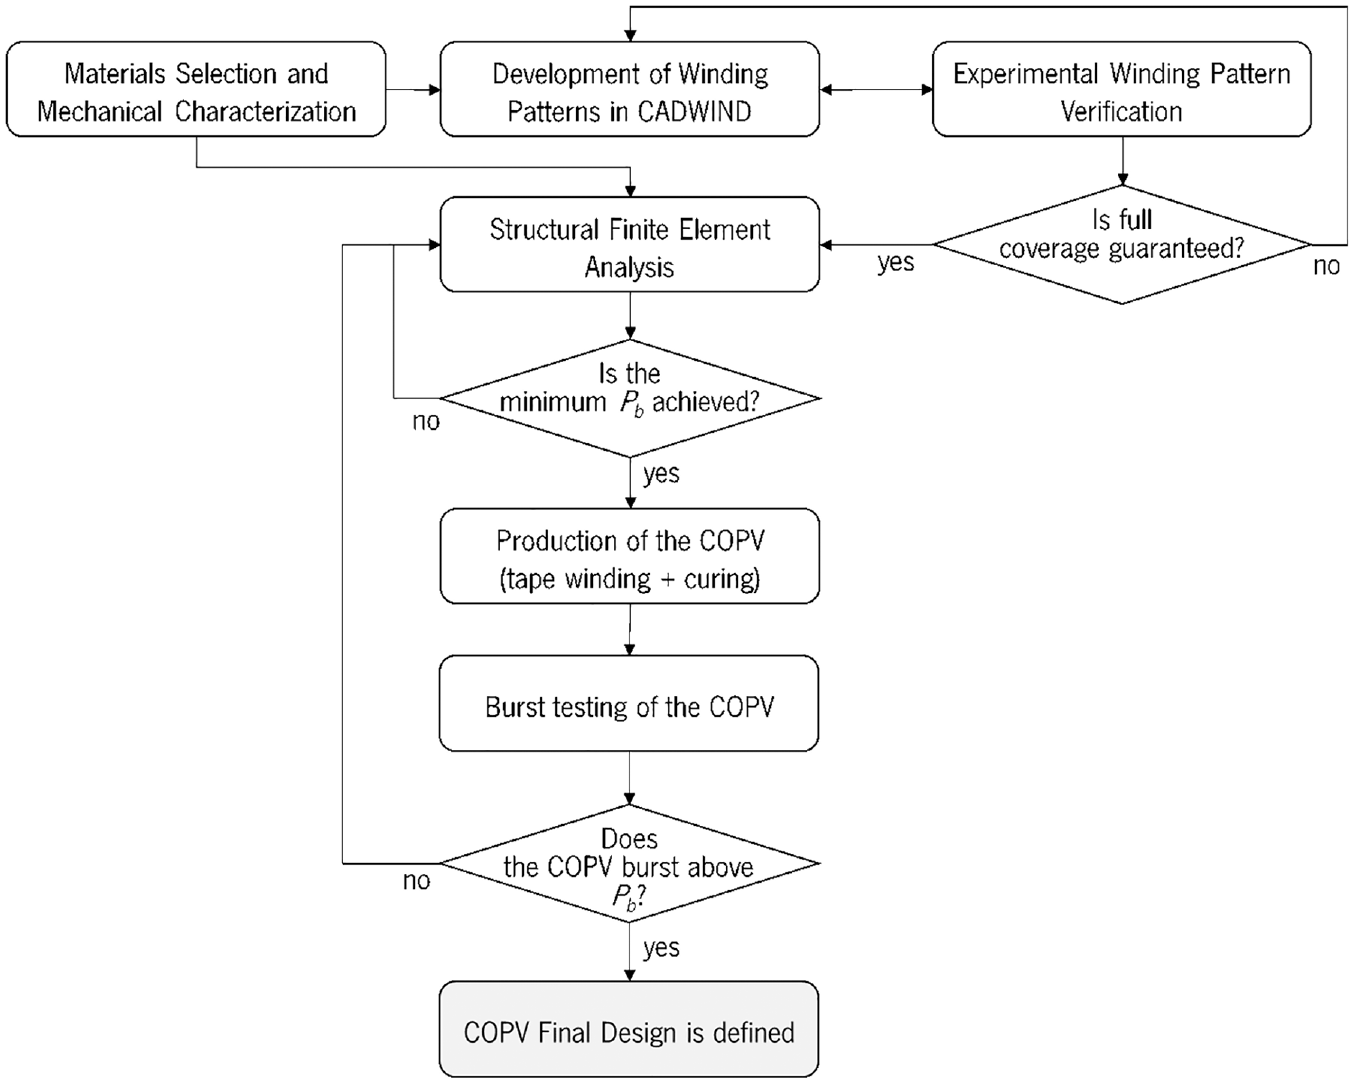
Iterative work steps for the development of the composite overwrapped pressure vessel.
In the first step, the materials selection and characterisation step was made, followed by the generation of winding patterns by using CADWIND® software, supplied from MATERIAL SPRL (Brussels, Belgium). The winding patterns were converted into a numerical code, compatible with the filament winding machine used, in order to make possible to carry out preliminary tape winding experiments to validate those simulations made in CADWIND®. If the helical and circumferential winding patterns presented full coverage of the liner, the FEM analysis could proceed, thus validating the winding patterns characteristics that had been considered previously (carbon fibre orientation taken from CADWIND® simulation and layer thickness taken from the experimental winding pattern verification tests). Contrarily, if the simulated winding patterns did not provide full coverage, new winding patterns must be simulated and selected using CADWIND® and another experimental verification of the winding patterns should be implemented.
FEM simulations were run until the composite overwrap layup was optimised and withstood the minimum burst pressure. At this point, the COPV can be produced according to the selected winding patterns and optimised overwrap layup configuration. Then, the COPV was subjected to a burst test in the next step. If the experimental burst pressure achieved the minimum requirement value, the COPV design was considered finalised. Otherwise, the constitutive models of the FEM were modified, a new optimisation of the composite overwrap layup performed, and production and testing iteration implemented again.
Finite element modelling
Abaqus Standard software was used to simulate the COPV mechanical behaviour and optimise the composite overwrap layup to obtain a minimum burst pressure of 1050 bar. For that, a static FEM analysis was conducted by applying a uniform pressure on the inner surface of the aluminium liner. As applied boundary conditions, the COPV was considered totally fixed at the bottleneck and tie constrained in between the liner and overwrap.
The composite overwrap was initially modelled using an orphan mesh generated by CADWIND® software, which divided the overwrap into several circumferential/conical sections along the longitudinal axis of the overwrap, to attribute specific fibre angle and thickness of each layer in that section. However, the model did not present good correlation with the experimental burst tests. As such, the composite overwrap was then modelled as a continuum shell, using a 3D CAD drawing having the external surface of the liner as the actual internal surface of the composite overwrap, which allowed to change the mesh refinement. Additionally, the composite shell was manually divided into several section, to attribute distinct fibre angle at each of these sections, as obtained in the CADWIND® input file. Furthermore, the thickness of each layer was attributed as measured on a preliminary wound COPV after curing. This COPV was cut half lengthwise to measure the thickness of helical and circumferential layers. As mentioned previously, this was an iterative process. After measuring the thickness of each layer of the selected winding patterns and updating the thickness values in the finite element model, the composite overwrap layup configuration was optimised. In the circumferential section of the COPV, each circumferential and helical layer presented a thickness of 0.28 mm and 0.50 mm, respectively. The composite overwrap was modelled using a general 1 mm size mesh, resulting in 27,720 S4 linear shell anisotropic elements. The Hashin and Rotem’s failure criterion was used for damage initiation and the Abaqus’ built-in linear damage evolution model was applied. On the other hand, the liner was modelled with a 2 mm general size mesh, resulting in 26,348 C3D8 linear solid isotropic elastic-plastic elements. The ITS50/RCX0125 composite and liner material properties used in FEM analysis are presented in Tables 1 and 2, respectively.
Properties of the ITS50/RCX0125 composite layer, used in the FEM analysis.
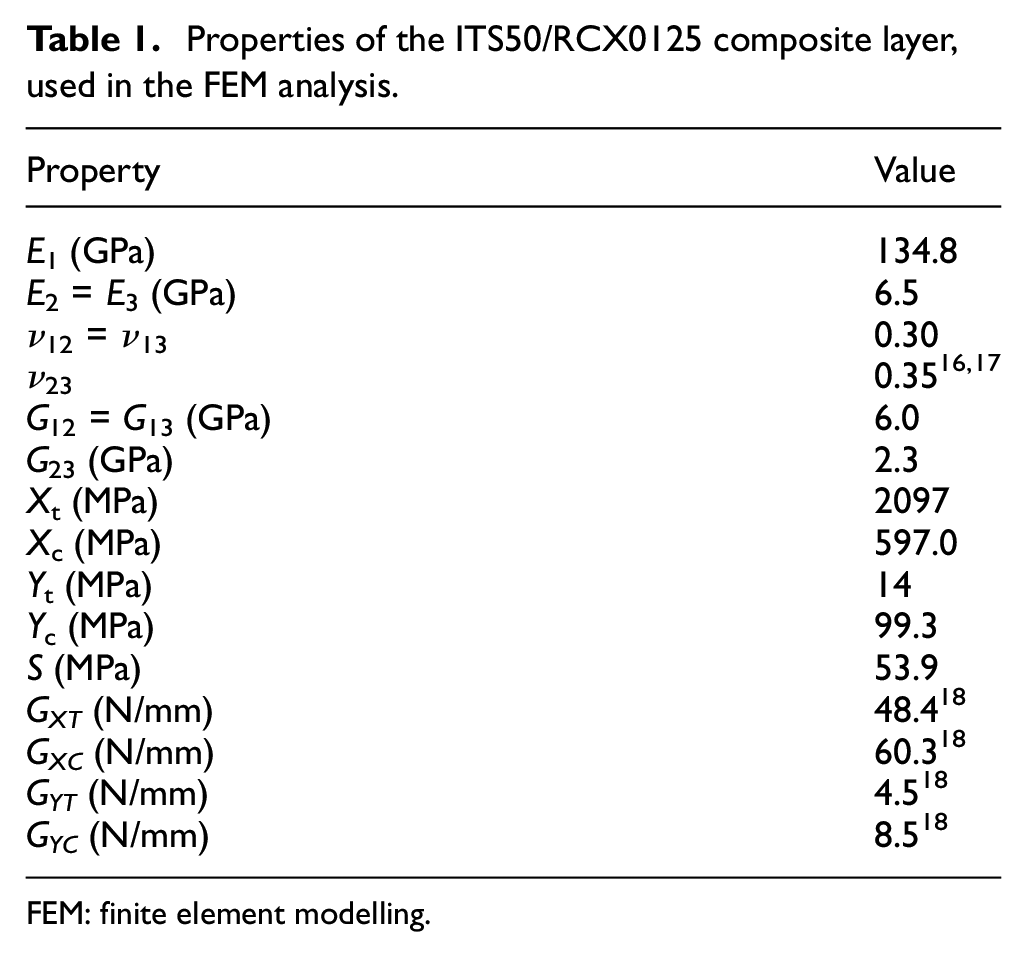
FEM: finite element modelling.
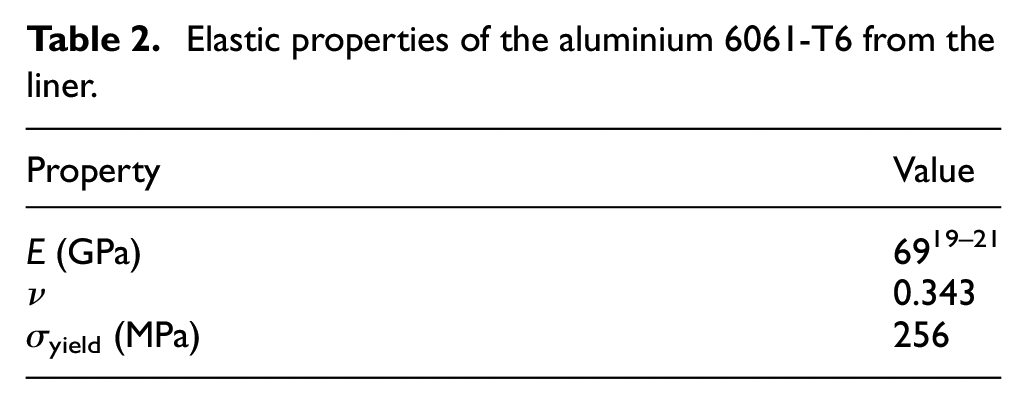
Elastic properties of the aluminium 6061-T6 from the liner.
E is the elastic modulus, G is the shear modulus and ν is the Poisson’s ratio, where the subscript 1 represents the property in the longitudinal direction of the fibres and the subscripts 2 and 3 represent the property in the transverse directions of the fibres. Xt and Xc are the tensile and compressive strength, respectively, in the longitudinal direction of the fibres and Yt and Yc are the tensile and compressive strength, respectively, in the transverse direction of the fibres. S is the shear strength. GXT, GXC, GYT, GYC are the fracture energies, where the subscripts x and y stand for the longitudinal and transverse direction of the fibres, respectively, and the subscripts t and c stand for tensile and compressive mode.
The values of fracture energy were taken from similar material in the literature. 18 Poisson’s ratio ν23 was considered to be 0.35, a common value found in the literature for epoxy resin.16,17 All remaining properties were experimentally obtained from specimens produced on a flat mandrel.
The mechanical properties of the aluminium liner were determined from dog-bone-shaped specimens cut out in the longitudinal direction, of a 6061-T6 aluminium liner. Modelling of the liner material also included its plastic behaviour. For that, the true stress/true strain curves were calculated from the plastic region of the experimental stress/strain curve.
The FEM results were validated through burst tests according to the procedure detailed in section ‘Burst pressure testing’ and the experimental results from those tests may be checked within section ‘Experimental techniques’.
Winding patterns
CADWIND® software, version 10.131, from MI MATERIAL innovative GmbH, was used to generate winding patterns compatible with the laboratorial used winding machine and the friction characteristics of the liner and prepreg tape.
The 2-dimensional (2D) liner surface contour, previously drawn in SolidWorks 2020 CAD software (Dassault Systèmes from Vélizy-Villacoublay, France), was firstly fed to the software. A friction factor of 0.35 was considered for winding of the prepreg tape over the aluminium liner for both circumferential and helical winding patterns. Finding an adequate winding pattern was an iterative process between the CADWIND® pattern simulation and the actual winding process in the laboratory winding machine. Although the unwound ITS50 carbon fibre/RCX0125 epoxy tape had a width of approximately 6 mm, the tension in the tape during winding affected its width. Therefore, to respect the real tape width during winding and achieve full coverage of the liner, the tape width was adjusted to 4 and 5 mm during CADWIND® simulations of the helical and circumferential winding patterns, respectively.
Liner
A seamless 6061-T6 aluminium liner, having a water volume capacity of 0.98 L, was purchase from Luxfer Gas Cylinders, Riverside, USA. The liner has an external diameter of 78.99 mm, a minimum thickness of 1.85 mm, a total length of 287.02 mm and weighs 0.454 kg.
Embedment of optical FBG sensors for process and SHM
Sensors should be integrated at places where the highest strains are developed, which usually happens in between the liner and the first composite overwrap layer or between the overwrapped layers having more dissimilar orientations. 6 Moreover, by fixing FBG sensors on the external surface of the liner prior to composite overwrap winding, it becomes as well possible to monitor the winding and curing processes. Having the aim of BVID detection in mind, a FBG sensor array was configured to be embedded in the liner/overwrap interface with enough spatial sensing range to enable damage detection and localisation in the circumferential section of the COPV. A single OF was designed to be wound around the liner and have 8-FBG sensors equally spaced throughout the circumferential section of the liner. The FBG sensors were positioned along three lines running in the axial direction of the liner, distanced by 120°, and with an axial distance of 26 mm in between consecutive sensors, as schematically represented in Figure 2. The FBG sensors were fixed on the liner at 90° to its axial direction, to be aligned with the internal circumferential layers.
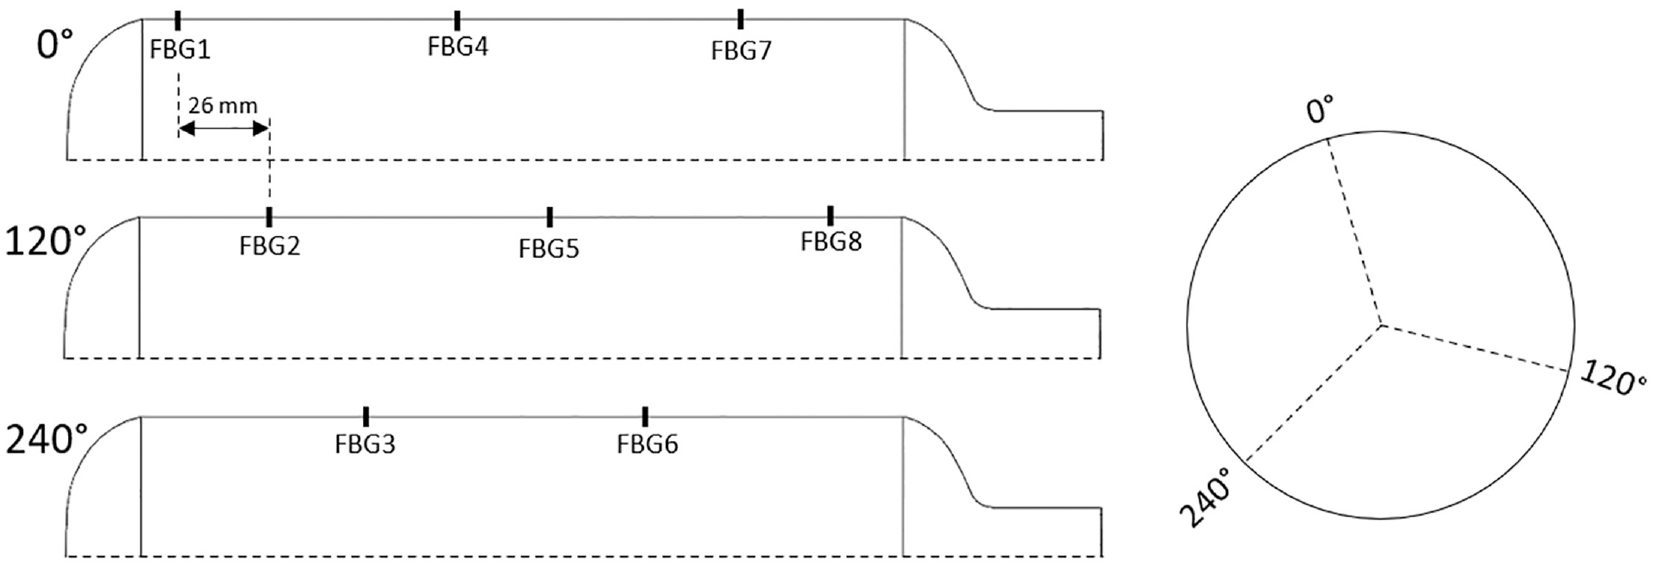
Schematic representation of the fibre Bragg grating sensors location on the liner surface.
Four- and 8-FBG sensor arrays were purchased from HBK Fibersensing, Maia, Portugal. The 8-FBG sensors were inscribed in 150 μm diameter polyimide coated OF, each distanced by 0.09 m. The COPV for pressure cycling testing monitoring had an embedded 4-FBG sensor array inscribed in a bend-insensitive OF, where a 200 μm diameter microtube was placed over each FBG for added protection. The OFs had Ferrule Connector/ Angled Physical Contact (FC/APC) connectors with 750 μm diameter teflon lead-in/out cable and 500 μm diameter transition tube.
The OFs were fixed on the external liner surface using the bi-component epoxy adhesive X120 from HBM, Darmstadt, Germany. The adhesive was either let to cure at room temperature for 40 h or cured at 60°C for 3 h. A high temperature polyester adhesive tape was also placed on top of the cured epoxy adhesive X120 to further protect the OF in the following manufacturing steps.
To increase the sturdiness of the sensing array so that it could withstand the compressive and shear loads imposed to the liner and composite overwrap by the pressurisation, a bend-insensitive OF was used instead. Besides bonding of the OF with epoxy adhesive X120, the OF was covered with a unidirectional flax fibres reinforced epoxy prepreg tape, to act as a buffer. This protection was vacuum bagged and cured in an oven for 24 h at 70°C. The configuration of the bend-insensitive OFs differs from traditional ones. An optical trench, made of a lower refractive index material, is applied between the OF core and cladding to reflect the lost light back into the core material. 22
Production of the smart COPV
A laboratory filament winding equipment manufactured by Gislotica, Perafita, Portugal, was used to produce the COPV. This equipment has six axes of movement: three linear moving carriage axes (vertical, horizontal left-right and horizontal back-forward), a rotating spindle axis, where the liner is fixed, and two other rotating axes, one around the linear vertical carriage axis and one around the fibre pay-out eye, along the linear horizontal back-forward carriage axis.
The composite overwrap was produced by winding the prepreg tape around the aluminium liner. The CADWIND® software was used to generate the numerical code to be introduced into the winding equipment command for each pattern (circumferential, helical and angle combinations).
An interrogator system from Ibsen Photonics, Farum, Denmark, comprising the DL-BP1 1501A super-luminescent LED source and I-MON 256 USB High Speed interrogation monitor, was used to acquire the data from the FBGs during production, at a sampling rate of 50 Hz. The winding procedure was monitored by fixing the optical interrogator to the liner. A long steel bolt with threads on the end was adhesively bonded (Loctite EA3450 epoxy adhesive from Henkel, Düsseldorf, Germany) to the centre of the closed dome of the liner. A support for the interrogator was produced by additive manufacturing and screwed to the bolt. The OF was connected to the interrogator and the power and USB cables to the electricity socket and laptop, respectively, through a rotary joint that was fixed to the additive manufactured support, as it may be seen in Figure 3.
Filament winding machine and in-situ strain monitoring with fibre Bragg grating sensors.
After winding, the COPV was wrapped with a 31.7 mm wide polyester shrink tape A 575 from Airtech to maintain the composite overwrap consolidated during curing. The COPV curing schedule followed the resin manufacturer recommendations. The COPV was pre-cured during 30 min at 90°C and, then cured over 90 min at 150°C.
After curing, the type III pressure vessels are subjected to an autofrettage process. In this process, a permanent plastic deformation was imposed on the load sharing elastic liner, by pressurising it above Py, the pressure at which the metallic liner is stretched past the yielding point. After unloading, the composite overwrap has a tensile preload, while the liner becomes preloaded in compression, which results on an improved fatigue strength of the COPV.
23
The minimum pressure Py that causes yielding of the liner is dependent on the liner’s yield stress,
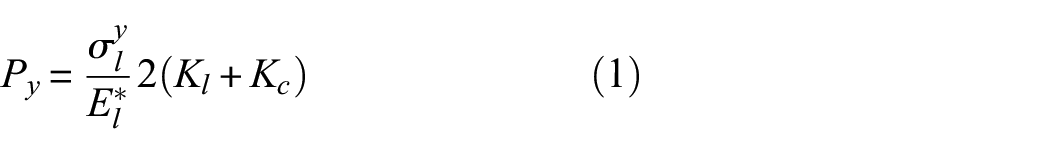
where:
ν is the liner Poisson’s ratio
tl is the liner thickness
Rl is the liner inner shell radius
Ef is the carbon fibre modulus
vf is the carbon fibre volume fraction in the composite
tc is the composite shell thickness
Rc is the composite inner shell radius
The autofrettage process was conducted at a pressure of 600 bar for 2 min. However, the COPVs submitted to burst testing were not subjected to the autofrettage process.
Burst pressure testing
Burst pressure tests were conducted at Amtrol-Alfa, Guimarães, Portugal, in an in-house built setup. The COPV was filled with distilled water and then connected to the pumping system inside a protective chamber. The internal pressure is then manually increased from the atmospheric pressure until burst. Three COPVs, as recommended by the EN12245 European standard, 15 were subjected to burst testing to validate the FEM simulation.
Cyclic pressure testing
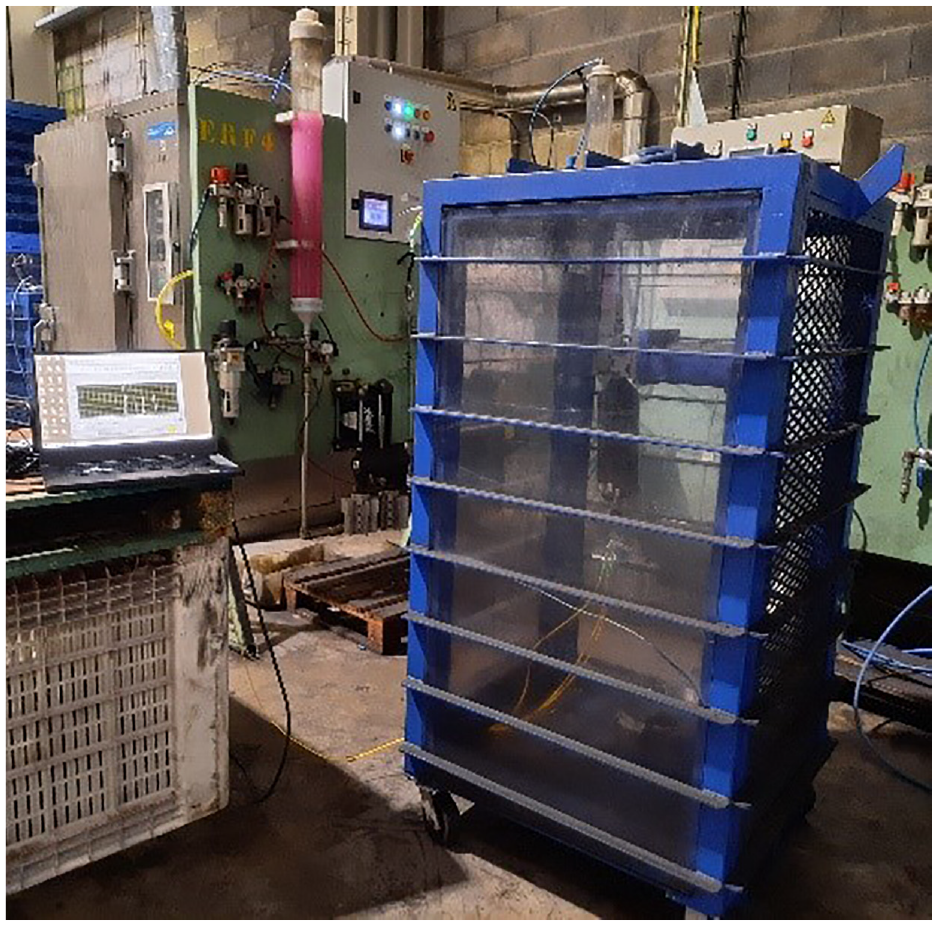
Cyclic pressure testing was also conducted at Amtrol-Alfa, Portugal. The COPV was filled with distilled water and antifreeze agent and connected to the pumping system. Then, it was placed and tested inside of a protecting chamber. Two COPVs were subjected to cyclic pressure testing, between 3 and 525 bar until failure, to evaluate its lifetime, as suggested by the EN12245 European standard. 15 It should be mentioned that the EN12245 standard recommends that the lower value of the cycle pressure does not exceed 10 % of the higher pressure and shall not exceed 30 bar. However, the used setup did not allow to limit the lower cyclic pressure to that range of values.
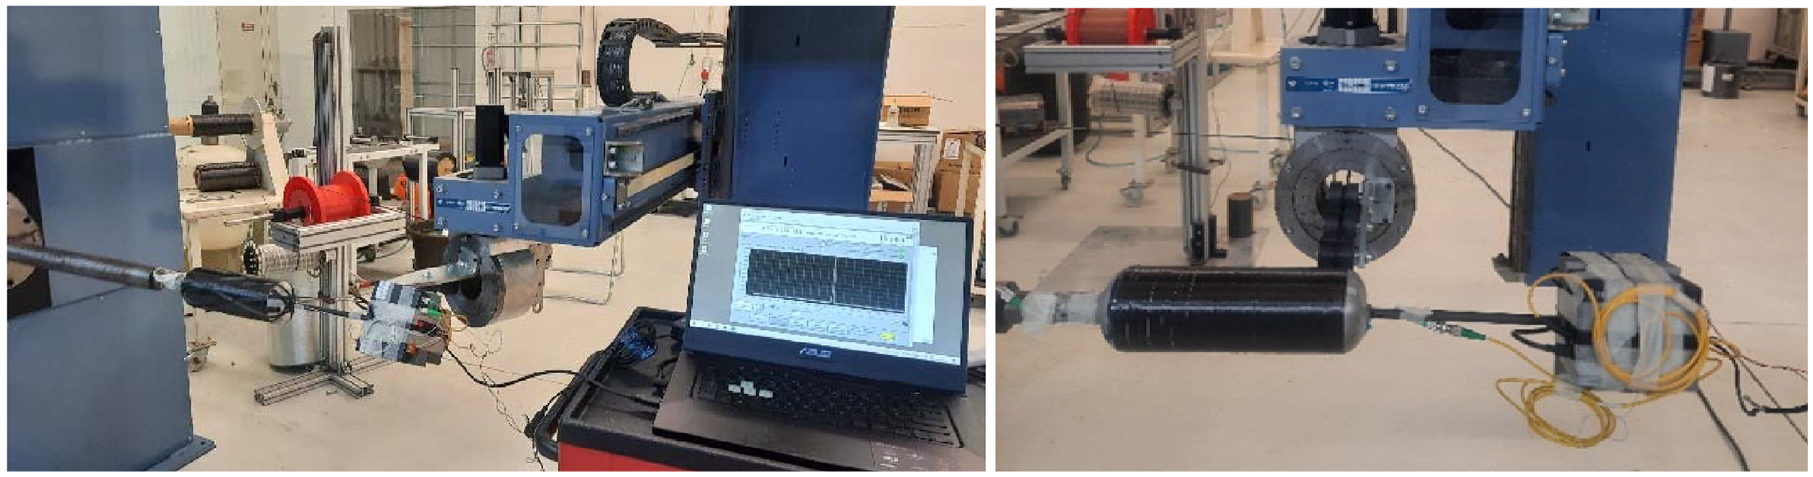
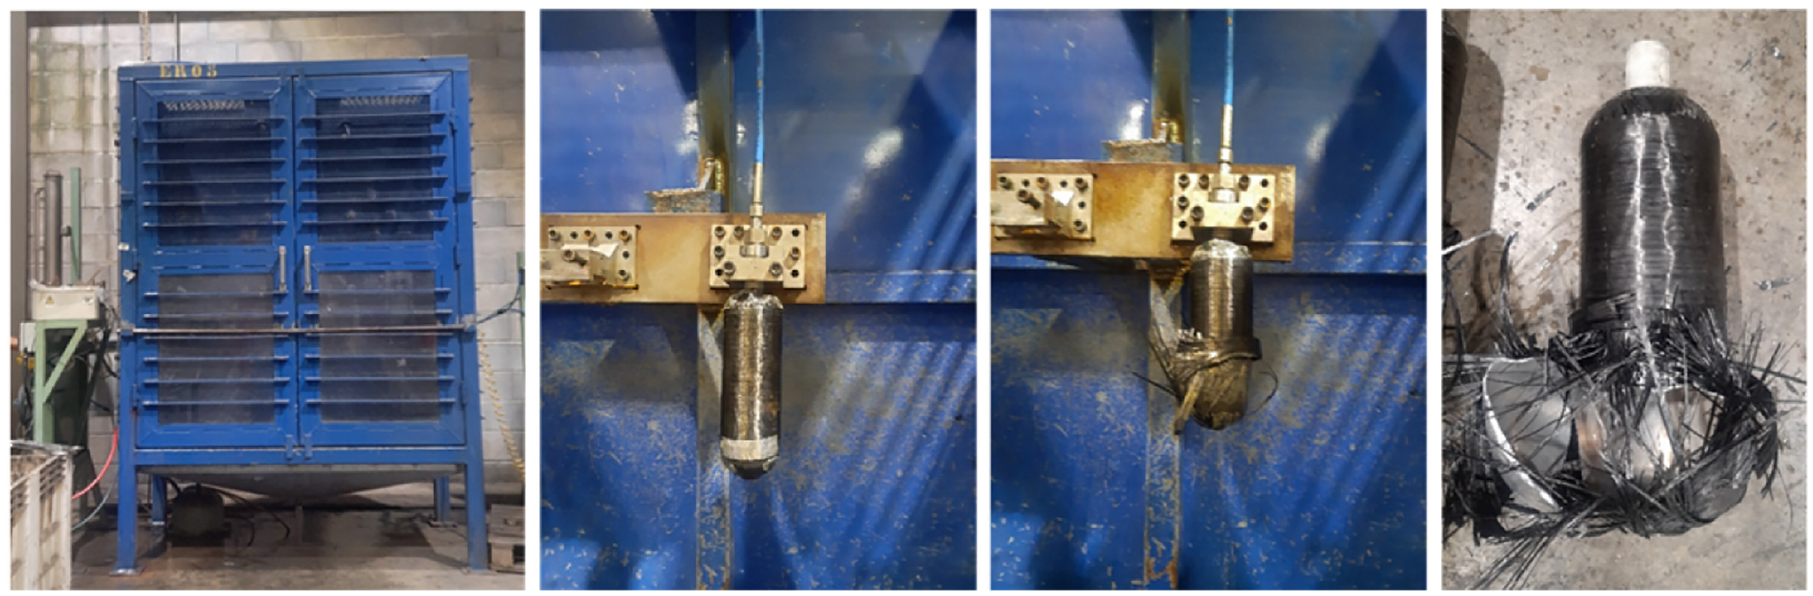
A smart COPV, with embedded bend-insensitive optical FBG sensors, was subjected to 18 190 pressure cycles between 3 and 350 bar, to resemble the operational fuel charging and discharging cycles. To accelerate failure and evaluate the suitability of the FBG sensors to monitor different pressure levels, it was then subjected to 1000 pressure cycles between 3 and 400 bar, 1000 pressure cycles between 3 and 450 bar and, lastly, to pressure cycles between 3 and 500 bar until failure. Each cycle lasted for about 7–15 s. The FBG data during test was acquired by the interrogator system from Ibsen Photonics, at a sampling rate of 100 Hz. The testing setup can be seen in Figure 4.
Cyclic pressure test and optical fibre monitoring setup at Amtrol-Alfa.
Impact testing and localisation
Drop-weight impact tests were performed on the Fractovis Plus impact testing equipment from CEAST, Pianezza, Italy. The impactor had a hemispheric shape with a 20 mm diameter and a mass of 5.045 kg. The tests were performed at the energy of 15 J, being the impactor placed at a vertical distance of 305 mm from the COPV. Each tested vessel was placed on a custom-built concave steel support and fixed with clamps, as shown in Figure 5.
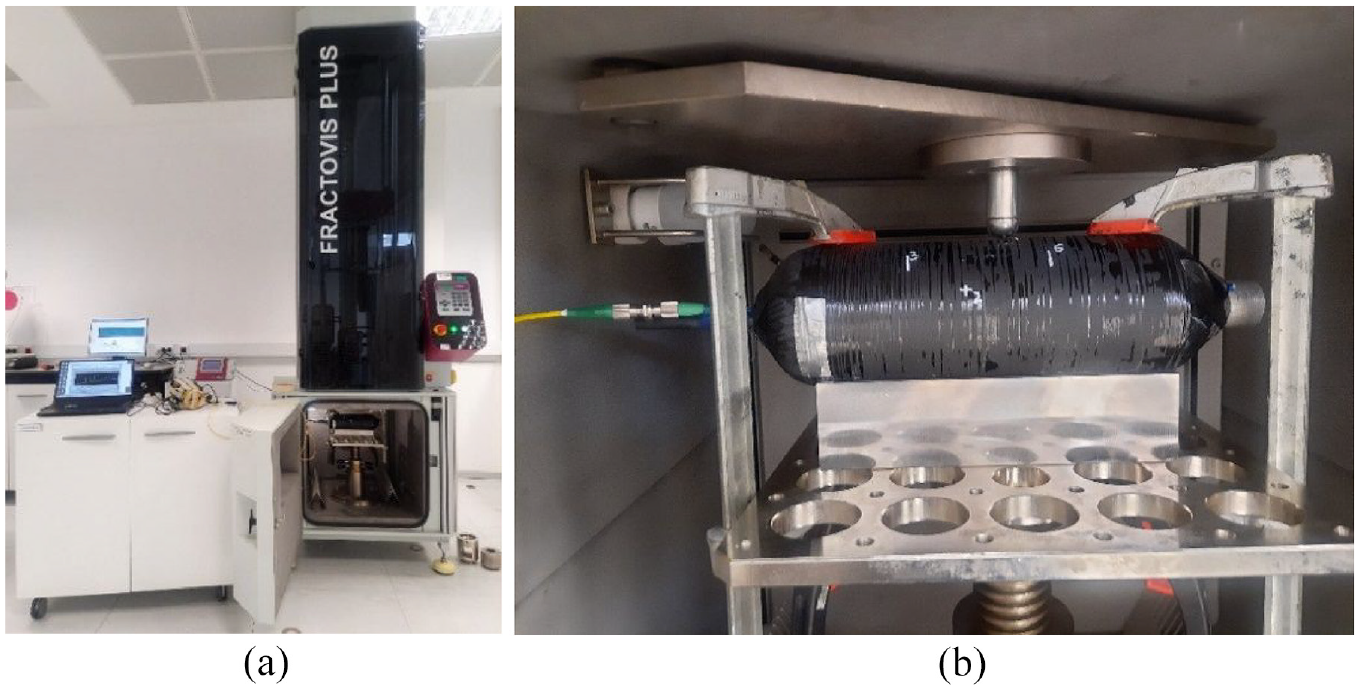
(a) Drop-weight impact testing setup with optical interrogation system and (b) composite overwrapped pressure vessel support.
A simple method, based on the residual strain amplitude, similar to the one reported by Hiche et al., 25 was used to predict damage location on the circumferential section of the COPV. This method assumes that FBG sensors closer to the impact sight measure higher residual strain values.
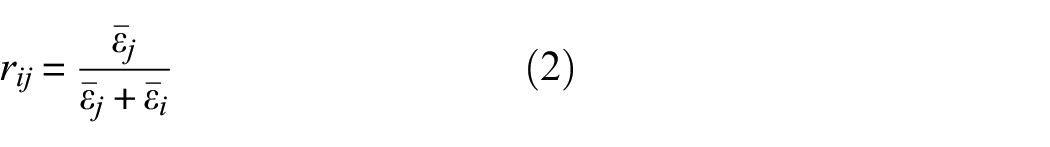
The residual strain values measured by each sensor after impact are normalised to calculate the strain ratio, rij, between each pair of sensors, according to Equation (2).
For impact detection, only the four sensor pairs with highest strain magnitude, Mij (Equation (3)), were used.

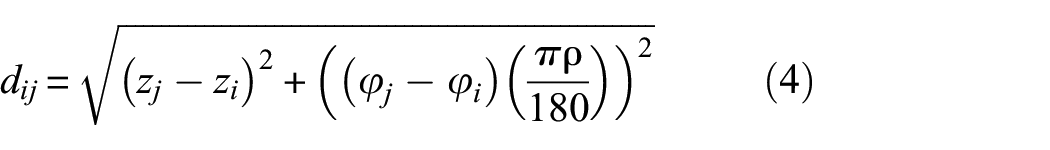
The cylindrical coordinates (ρ, φ, z) of each FBG sensor were initially inputted to calculate the linear surface distance between each of the selected sensor pairs, dij, following Equation (4).
The relative distance between FBG i , of the FBG i /FBG j sensors pair and the expected impact location, Id, was calculated according to Equation (5).

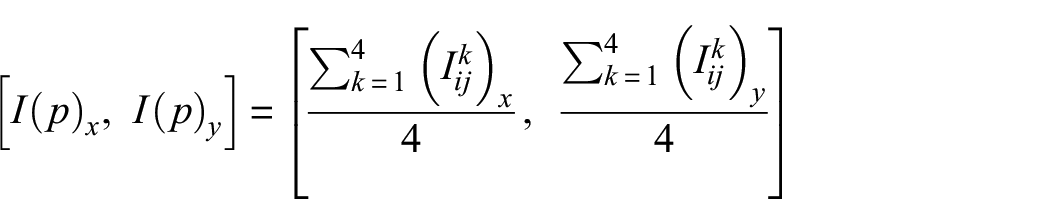
The cartesian coordinates of the relative impact locations ((Iij) x , (Iij) y ) were recorded, using the nearest FBG sensor as origin of the coordinate axes, considering the 2D flat projection of the cylinder region (as it can be seen in the section ‘Results and discussion’, Figure 12). The cartesian coordinates of the predicted impact location, (I(p) x , I(p) y ), are finally obtained from the average of the relative impact positions obtained from the four FBG sensor pairs previously selected, as given by Equation (6).
Results and discussion
Finite element analysis
The structural modelling of the COPV in Abaqus software was an iterative process, until a minimum burst pressure of 1050 bar was achieved. Different layups were modelled and subjected to the burst pressure to validate the composite overwrap layup. It was decided to use the symmetric layup [903/±152]S in the COPVs production, that has shown the required minimum burst pressure, as it can be seen next, with adequate manufacturability.
The circumferential layers were the first ones to fail. Damage initiation was observed at a pressure of 1063 bar according to Hashin and Rotem’s damage initiation criteria for fibre tensile mode (Figure 6).
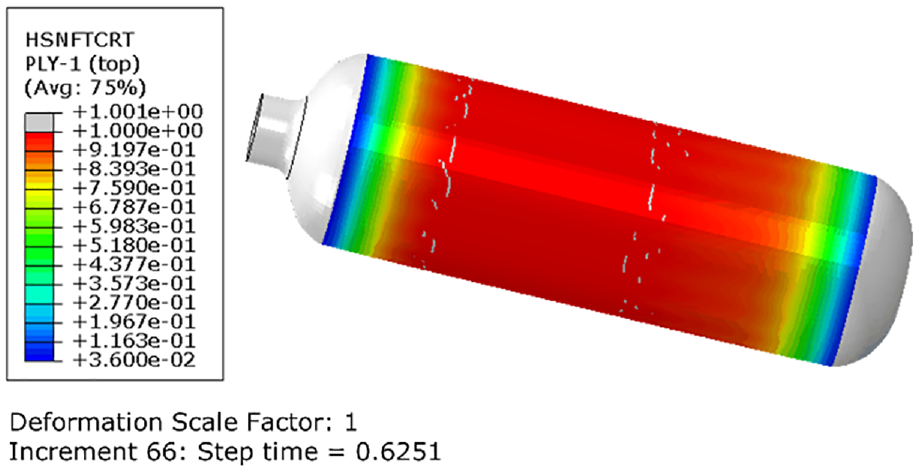
Hashin and Rotem’s damage initiation criteria for fibre tensile mode of the first internal circumferential layer.
At the point where the circumferential layers and the epoxy resin have already failed, there is a sudden stiffness loss in the circumferential direction of the COPV. That can be observed by the sudden increase of elastic strain in the helical layers in the circumferential direction (Figure 7(a)). With that, the failure of the helical layers can be identified right after the failure of the circumferential layers, at a pressure of 1064 bar.
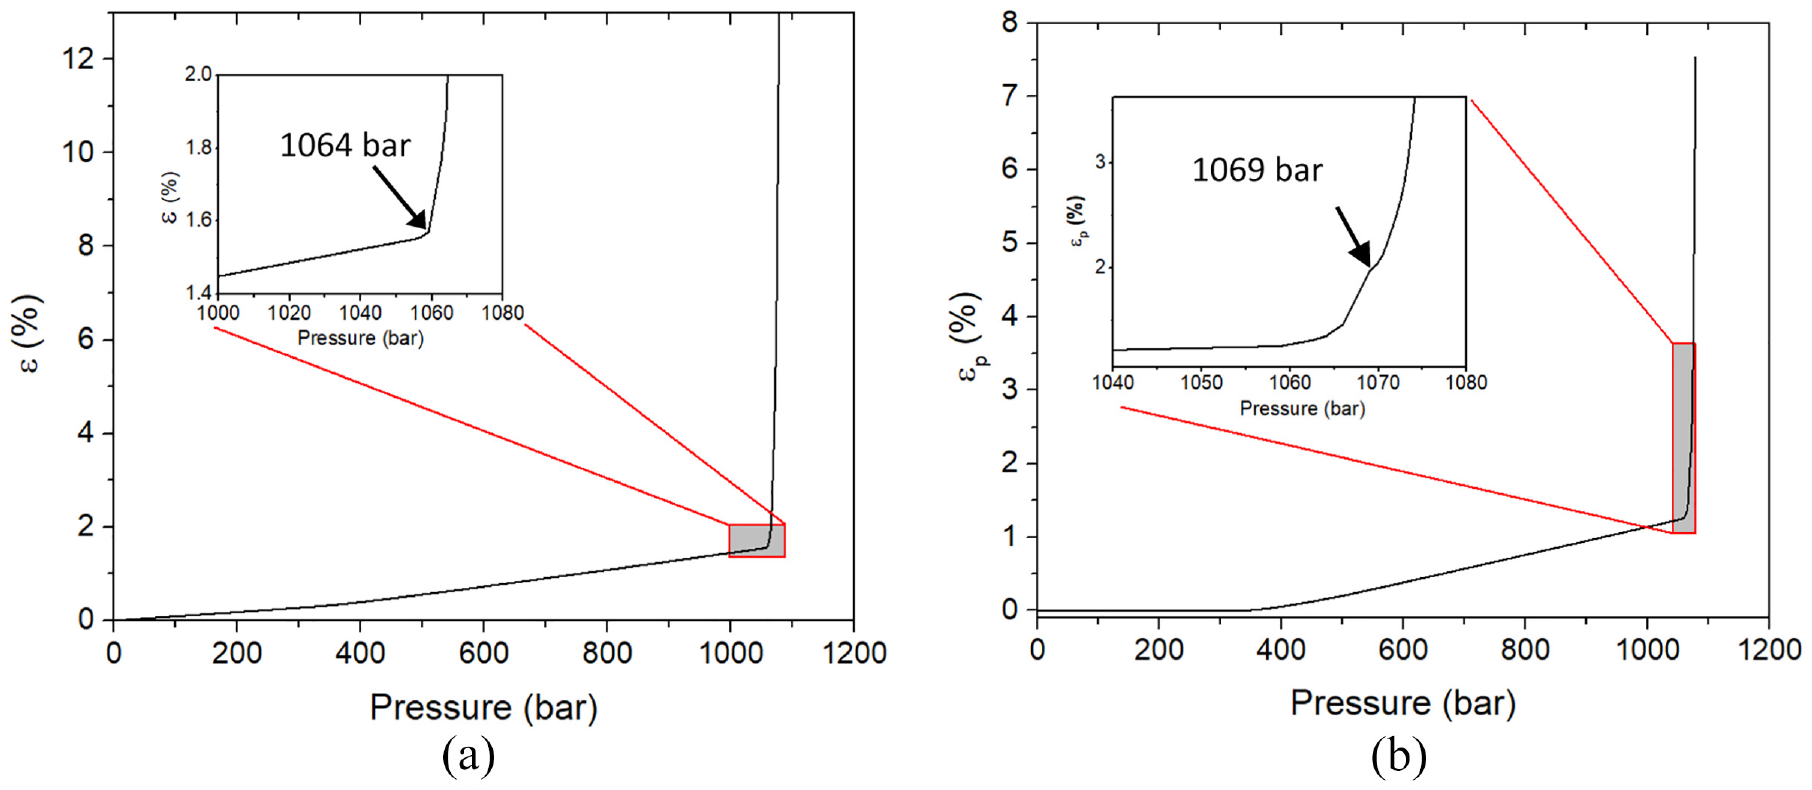
(a) Elastic strain on the circumferential direction of the composite overwrapped pressure vessel helical layers and (b) plastic strains on the aluminium liner.
Once the stiffness of the composite overwrap is lost, the liner is the last element to expand with the applied internal pressure and burst. At last, the failure of the aluminium liner, and of the COPV as a whole, was identified at a pressure of 1069 bar, when there is a sudden increase of the plastic strain of the liner (Figure 7(b)).
Burst pressure testing for FEM analysis validation
The FEM analysis was validated by experimental burst tests, which showed a burst pressure of 1061 ± 26 bar, within three tested COPVs. This revealed a very small error of 0.7% between the simulated and experimental burst pressure. An example of a tested COPV can be seen in Figure 8.
Burst pressure test of a composite overwrapped pressure vessel.
Process and SHM studies
Winding and curing monitoring
The integration of FBG sensors on the liner surface brings the advantage of enabling monitoring of the full manufacturing process, both winding and curing processes. To monitor the winding process, the optical interrogator was fixed to the liner and an electrical rotary joint used for data transfer, as described in section ‘Production of the smart COPVs’ within the section ‘Experimental techniques’.
Figure 9 presents the strain evolution during the tape winding process, as measured by the FBG sensors. For easier reading of the graphs, just the data for every other sensor of the 8-FBG sensing array is presented. The FBG sensors showed a decrease of strain when the circumferential layers were wound. As winding of a layer started, a strain oscillation was observed in all sensors, reaching higher amplitude as the carbon fibres being wound got closer to the FBG sensor. A sudden strain decrease followed as the carbon fibres covered the FBG sensor. After that, a strain recovery and plateau are observed for the remaining time of the layer deposition. Figure 9(b) clearly shows the strain variation measured by FBG5, where the first and third internal and external circumferential layers are highlighted by the grey shadowed regions for easier identification. During circumferential winding, as the process progressed, the FBG sensors were strained at progressively later time, according to their location along the longitudinal axis of the liner, as presented in Figure 9(c) and (d). At about 1 min after initiating data acquisition, the winding process started and FBG7 was the first sensor to show a strain decrease, followed by FBG5 and so on. Naturally, as the second circumferential layer is wound backwards, relatively to the first circumferential layer, FBG1 was the first sensor to show another strain decrease step, followed by FBG3 and so on. The behaviour observed in the first circumferential layer is also visible in the third one. This pattern also applies to the deposition of the external circumferential layers. It is also noticeable that strain amplitude recovery, just after the FBG sensor has been covered and compressed by the carbon fibres, is much higher during winding of the external circumferential layers than during winding of the internal ones. For the case of FBG5, it measured a strain decrease of about 51, 37 and 34 με after winding of the first, second and third internal circumferential layers, respectively, and of 7, 3 and 2 με after winding of the first, second and third external ones, respectively. It seems possible to conclude that as the layers were deposited over the liner and FBG sensors, the previously wound layers with tensioned carbon fibres acted as a buffer and lessen the compression of the FBG sensors.
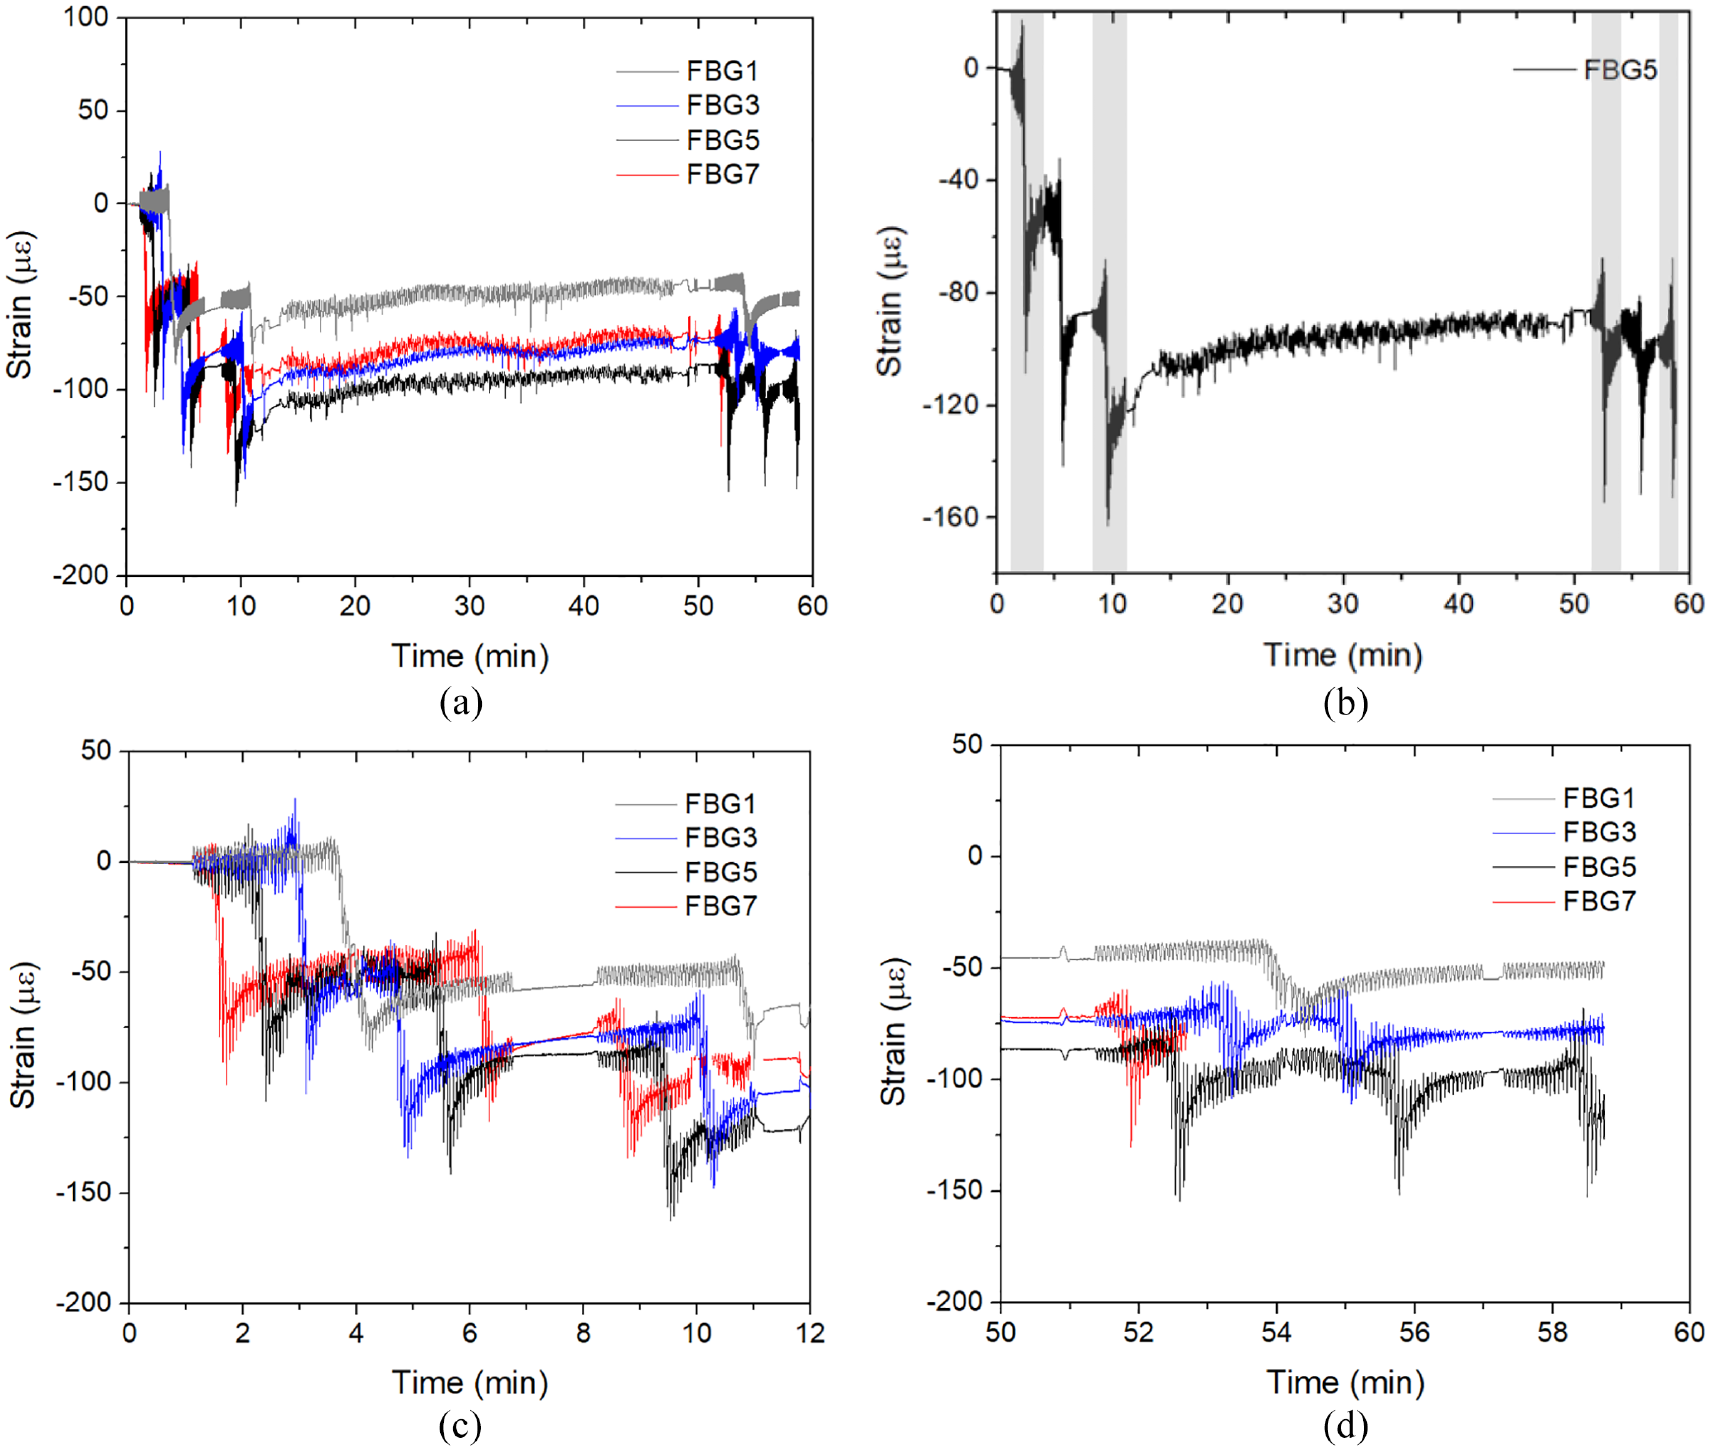
Strain change on FBG sensors during: (a) the entire COPV winding process, where the first and third internal and external circumferential layers are highlighted in (b) and detail of strain change during winding of internal (c) and external (d) circumferential layers.
The winding of helical layers (between approximately the 12th and 48th min, see Figure 9(a) and (b)) does not impose additional compression on the FBG sensors. Instead, the strain slightly increased during these steps. This can be attributed to the wound internal circumferential layers acting as a buffer to the FBG sensors, but also to the fact that the anchoring places for the carbon fibre during helical winding are the domes sections of the COPV. The times between 11 and 13.5 min and 48 and 51 min correspond to the processing steps of combined angle winding, enabling the changes from circumferential to helical winding and vice-versa, respectively, without stopping the machine nor cutting the carbon fibres at the end of winding of each layer type.
After winding, the COPV is cured. Figure 10 compares the strain data imposed on an FBG during the curing process to the temperature on the COPV surface, measured by a type-k thermocouple, and also to the oven temperature. The results presented here concern to an OF fixed by epoxy adhesive X120 to the liner surface, which was protected with a high-temperature adhesive tape to prevent its breaking. The strain in the FBG roughly follows the temperature curve shape measured in the COPV surface. Yet, the measured strain starts to increase faster than the temperature curve, which may be attributed to the liner thermal expansion. Between 3.8 and 4.6 h into the curing process, it was possible to observe that the strain was kept approximately constant, while the temperature measured in the COPV surfacewas still slightly increasing, revealing the effect of the polymerisation shrinkage counteracting the thermal expansion.
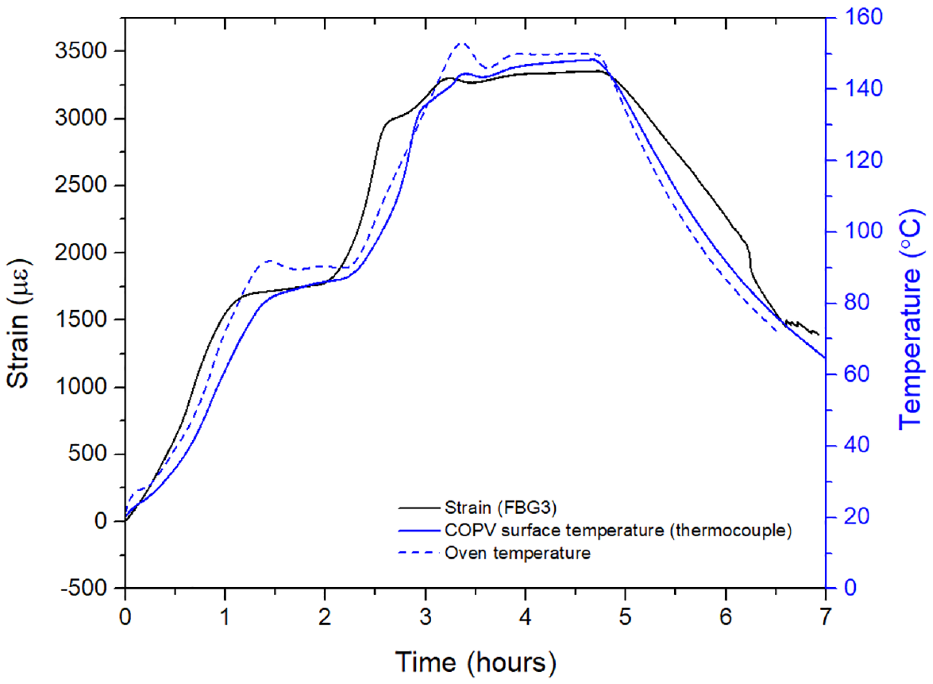
Curing monitoring of the COPV by embedded OF.
Ideally, cure monitoring should be done with an OF without a protective buffer layer to actually measure the mechanical and thermal strain resulting from thermal expansion and polymerisation. However, the OF without protection barely survived the curing procedure and suffered significant microbending during the process. Alternatively, an OF could be used in the external layers of composite overwrap; however, cure monitoring was not the main focus of this project.
A picture of a produced COPV with embedded FBG sensors can be seen in Figure 11.
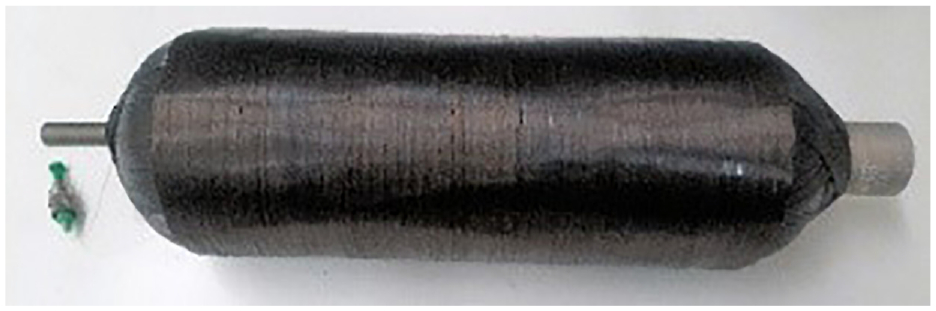
Smart COPV with embedded FBG sensors.
Impact testing
Low velocity impact tests were performed on the circumferential section of the COPV to demonstrate the capability of the FBG sensors to detect and locate BVID. Prediction of damage location was achieved by a simple method, similar to the one reported by Hiche et al. 25 earlier presented in this paper.
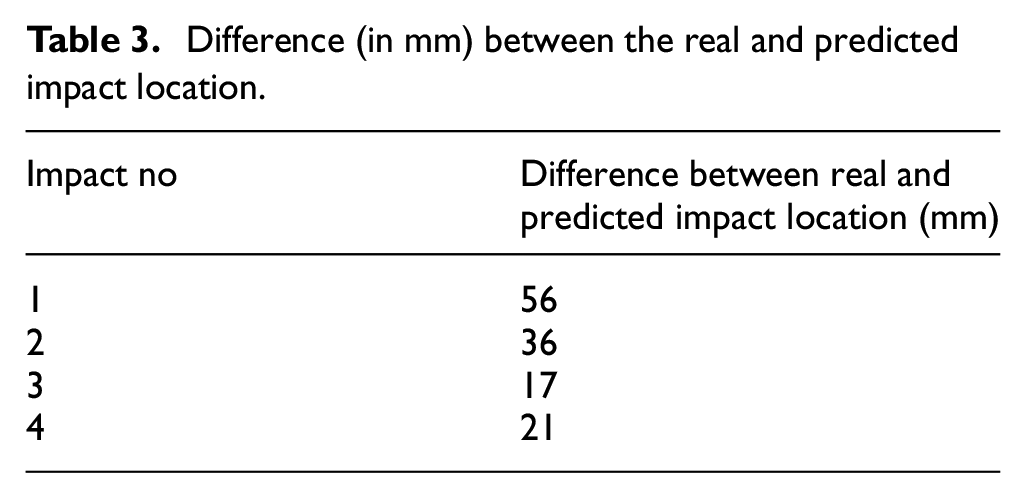
Figure 12 shows a flat projection of the location of the FBG sensors, ‘real’ impact locations, predicted impact locations based on the residual strain between pairs of FBG sensors and averagely predicted impact locations. Distances as small as 17 mm and up to 56 mm (Table 3) were measured between the predicted impact locations and the ‘real’ ones. These very short distances quickly enable the localisation of the impact in a real-life structure and the implementation of preventive measures.
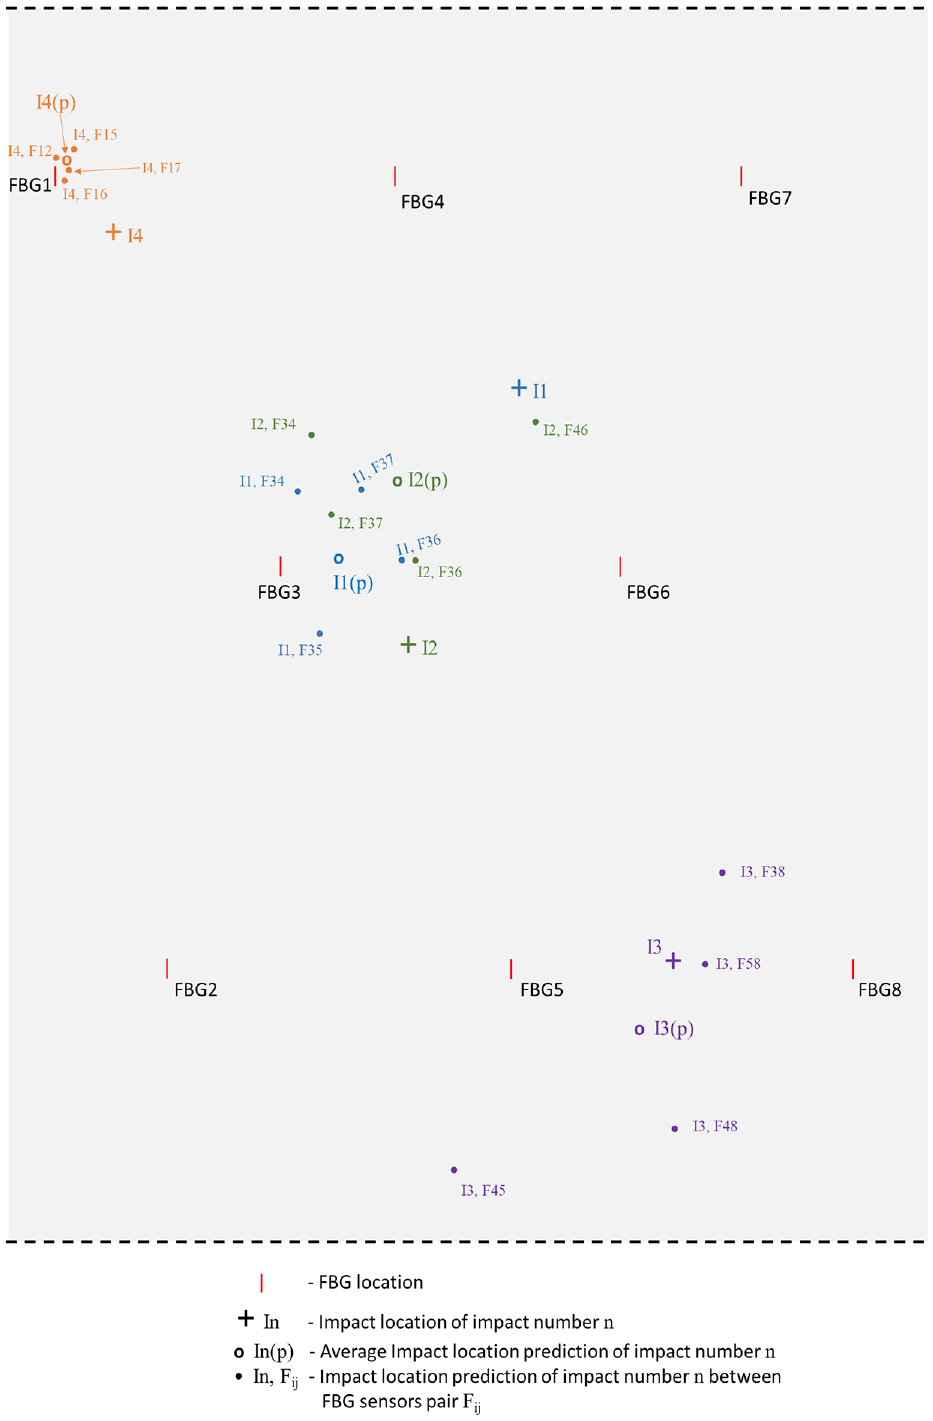
Real and predicted impact locations on the flat projection of the COPV cylindric region.
Difference (in mm) between the real and predicted impact location.
It should be mentioned that the differences between the ‘real’ and the predicted impact locations may arise from the misidentification of the FBG sensors’ location in the COPV after winding. The FBGs are fixed in the liner surface and a plastic jig mask is used to mark their position. However, after winding, as the diameter of the COPV increased comparatively to the liner diameter, an exact identification of the FBG sensors is not possible.
These impact tests, conducted at 15 J, produced BVID on the COPV surface that were successfully detected and located by the FBG sensors. The matrix crack resulting from impact 1 and the small bump caused by impact 4 can be seen in Figure 13(a) and (b), respectively. Impacts 2 and 3 also produced very small bumps on the COPV surface that could not be well perceived on camera.
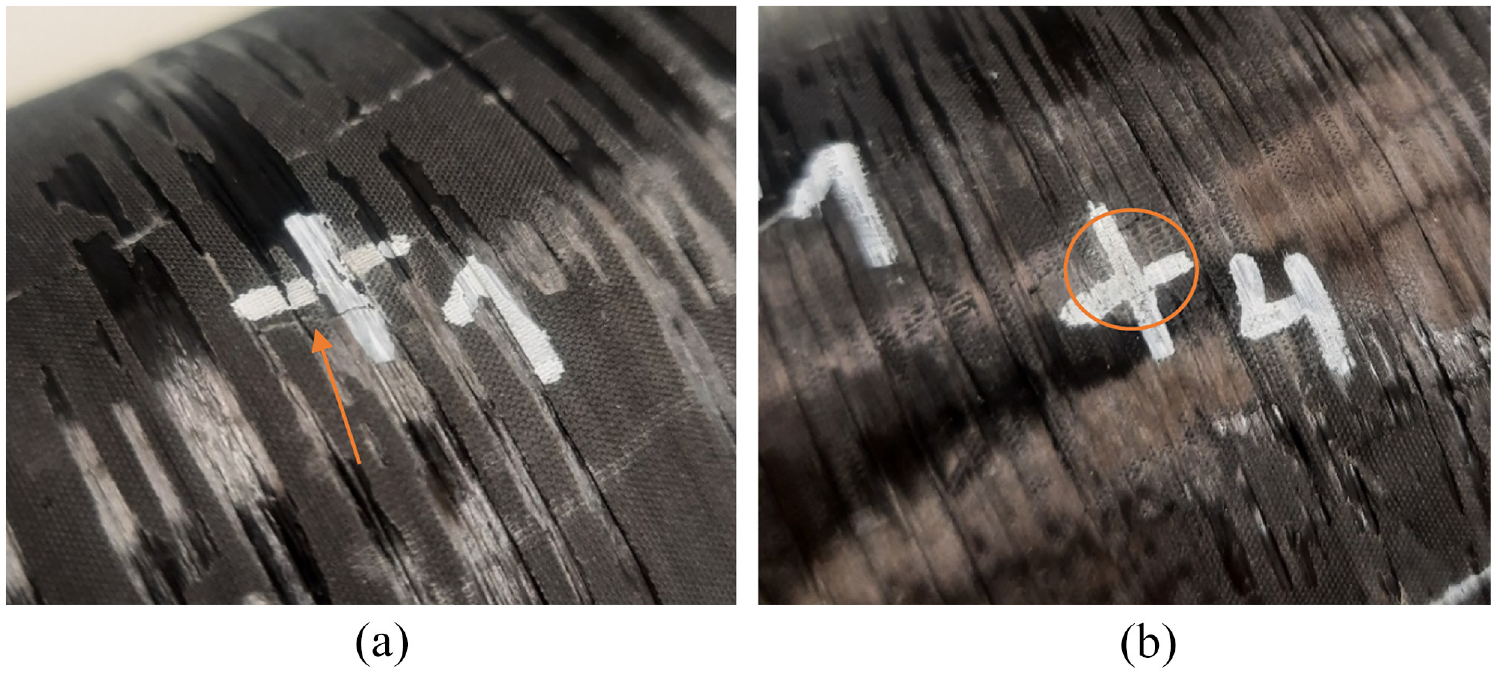
Barely visible impact damage on the composite overwrapped pressure vessel surface resulting from impacts (a) #1, which produced a matrix crack and (b) #4, which produced a small bump.
Cyclic pressure testing
A smart COPV, with an embedded bend-insensitive OF having a 4-FBG sensing array, was subjected to cyclic pressure testing. Prior to that, the COPV was also submitted to the autofrettage process. It was pressurised up to 600 bar and that pressure was kept for 2 min. The shift of the FBGs’ central wavelength (CWL) towards higher values, shown in Figure 14, reveals the success of the autofrettage process, where a permanent residual tensile strain was imposed on the liner. In fact, residual tensile strains between 1300 and 2058 με were measured in the COPV by the 4-FBG sensing array.
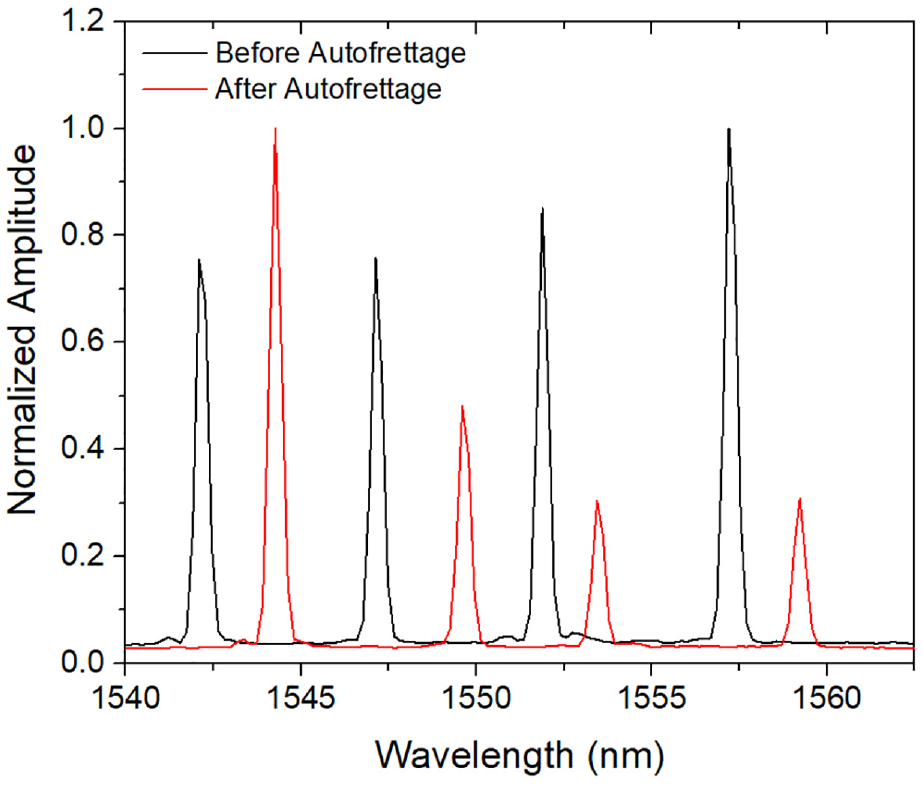
Bend-insensitive optical fibre spectra prior to and after autofrettage process.
Considering the design operating pressure of 350 bar, the smart COPV was, at first, cyclically pressurised between 3 and 350 bar, to resemble the operational charging and discharging cycles of fuel. After 18 190 pressure cycles between 3 and 350 bar, the same COPV was then subjected to 1000 pressure cycles between 3 and 400 bar, 1000 pressure cycles between 3 and 450 bar and, lastly, to pressure cycles between 3 and 500 bar until failure.
For demonstration, Figure 15 presents the strain obtained by the FBG sensors during pressure cycling testing for a few cycles conducted at different values of maximum pressure. The FBG sensors show a linear response to the applied internal strain as it can be clearly seen in Figure 16.
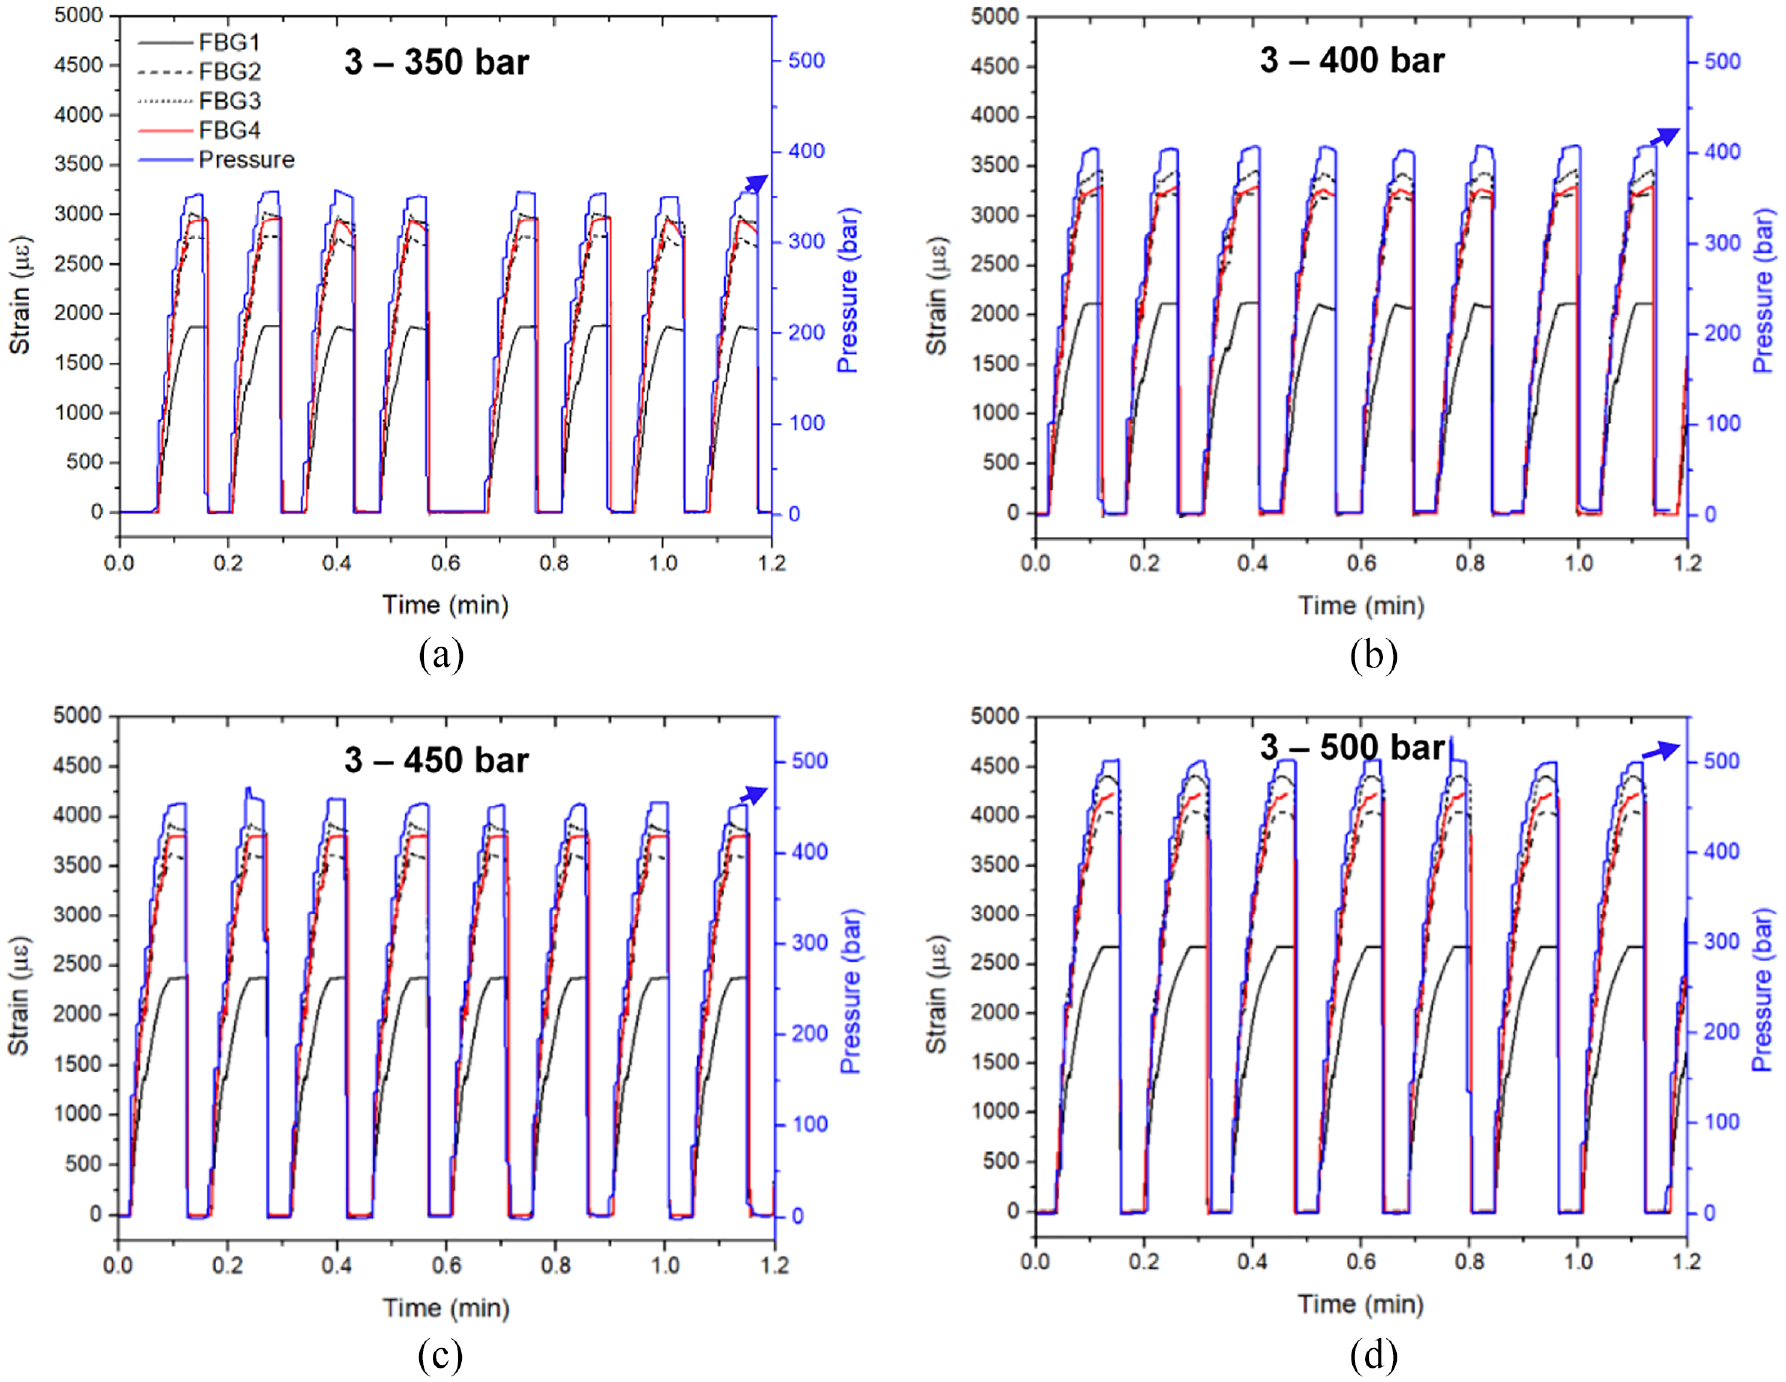
Examples of strain measured by the FBG sensors during pressure cycling test at different stages of the test with different values of maximum pressure: (a) cycles number 8050–8058 between 3 and 350 bar, (b) cycles number 396–404 between 3 and 400 bar, (c) cycles number 393–401 between 3 and 450 bar, and (d) cycles number 347–354 between 3 and 500 bar.
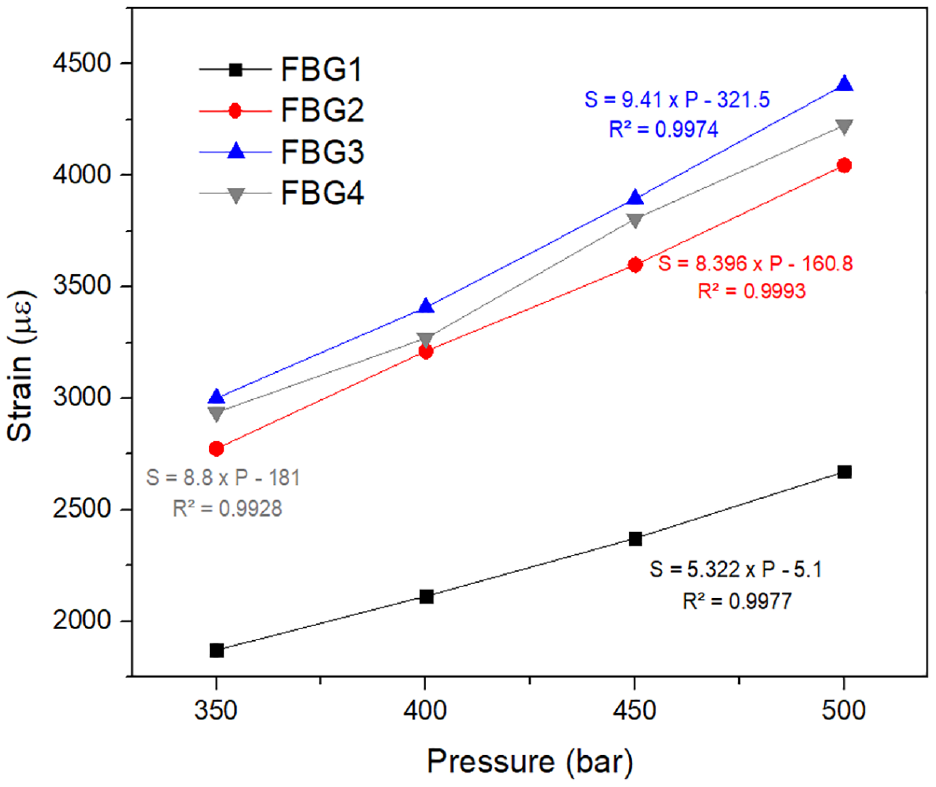
Relation between the maximum cyclic pressure and measured strain by FBG sensors.
As expected, considering the results of the FEM analysis presented in the above section ‘Finite element analysis’ FBG1, the one closest to the dome section, suffers the smallest strain gradient at each cycle, comparatively to the other FBG sensors. This is followed by FBG2, with significantly higher strain gradient at each cycle, and then FBG4 and FBG3. It would be expected that FBG4 would suffer higher strain as it is in the middle section of the circumferential zone of the COPV. This behaviour can be attributed to an increased buffer effect of the protective unidirectional fibre layer in the surroundings of FBG4. Yet, in some cycles between 3 and 500 bar, such as the ones shown in Figure 15(d), FBG4 suffers the highest strains when at the top pressure range of the cycle, causing microbending and momentaneous signal loss.
FBG1 presents the smallest slope of the linear strain/pressure curve, thus, suffering a lower strain gradient as the internal pressure is increased, comparatively to FBG2–FBG4. This behaviour can be very useful to evaluate the internal pressure and, therefore, knowing the level of hydrogen fuel in the COPV.
Figure 17 presents the spectra of the embedded OF at the maximum and minimum pressures in different cycles, having different maximum pressures. The CWL of the 4-FBGs, for the four cyclic pressure ranges tested, remained nearly unchanged, revealing no damage as the COPV is unloaded, up to this point. Moreover, the spectra amplitude was kept approximately constant, demonstrating the reliability of the OF for a very high number of cycles. The spectra at each cycle maximum pressure showed a decrease of amplitude as the value of maximum pressure increases, due to increased microbending. Nevertheless, except for the FBG4 when cycled between 3 and 500 bar, the optical interrogator was still able to continuously detect the CWL of all FBG sensors throughout the entire test. The COPV completed 790 cycles between 3 and 500 bar and the bend-insensitive OF was able to withstand the entire cyclic pressure test and remained operational after failure of the COPV.
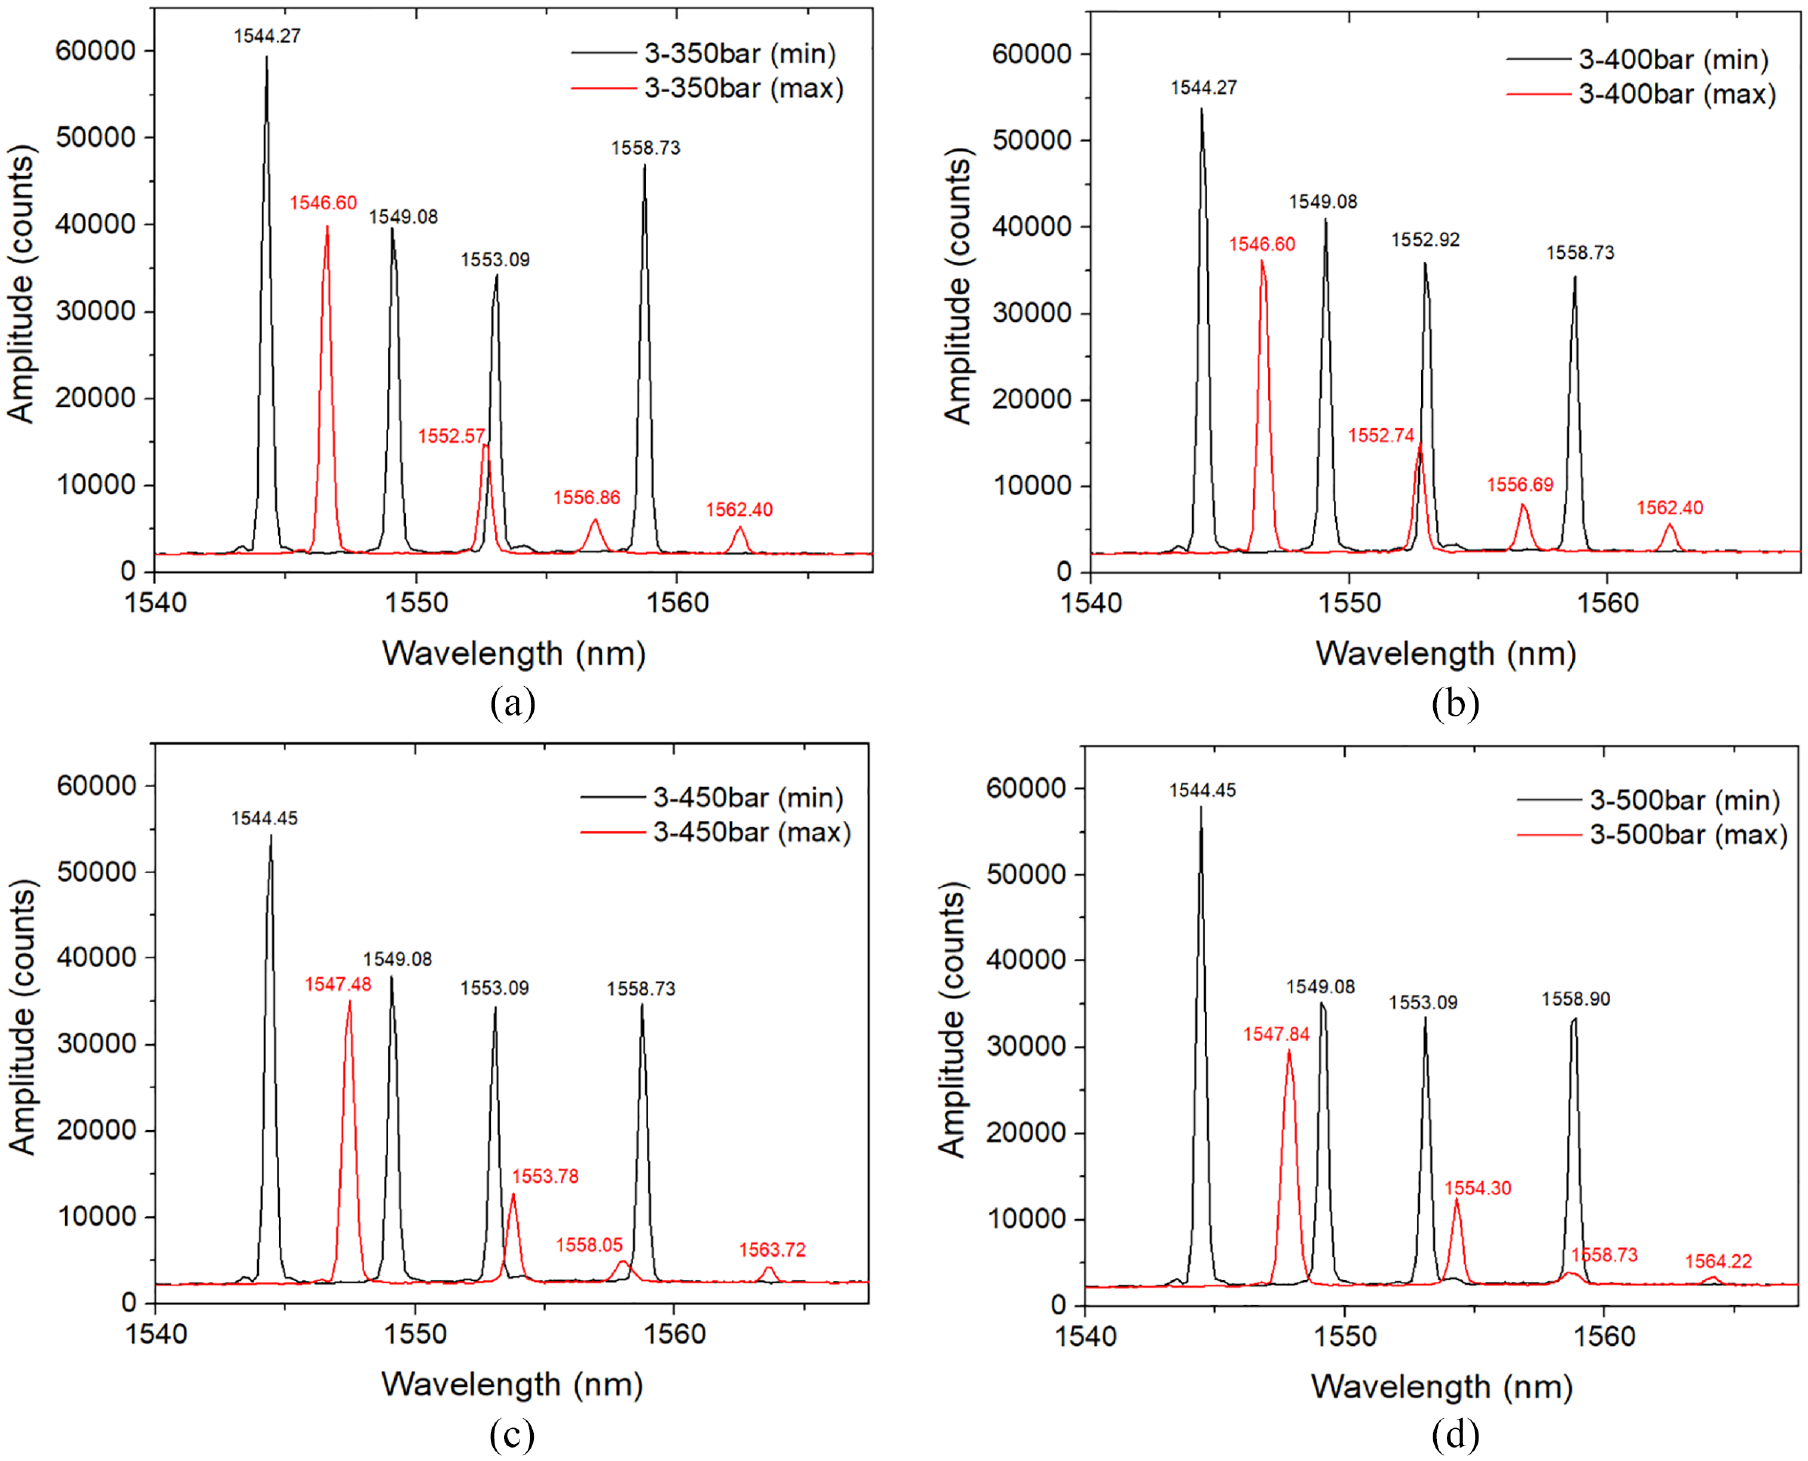
Optical spectra change between maximum and minimum pressure values of cyclic pressure testing with different maximum pressure value: (a) cycle number 8292 between 3 and 350 bar, (b) cycle number 82 between 3 and 400 bar, (c) cycle number 437 between 3 and 450 bar, and (d) cycle number 10 between 3 and 500 bar.
The reported integration methodology with a bend-insensitive OF and the results presented here are very promising for the widespread use of metallic liner COPVs for storage of hydrogen or other fluid, to enable new COPV product development and reliability assurance. It should be mentioned that although the COPV failed after a total of 20 980 cycles, the FBG sensors were still intact in the end of the cyclic pressure test, showing their high fatigue strength. This number of cycles is equivalent to refuelling the COPV once a day for over 57 years. So far, monitoring of cyclic pressure testing of metallic COPVs with embedded sensors, at such high-pressure range, has not been reported in the literature.
Conclusion
A COPV was developed for hydrogen storage to supply a UAV’s FC system in order to satisfy the requirement of a 2-h flying autonomy. For that, two COPVs with 1-L capacity were designed for hydrogen storage at 350 bar. A safety coefficient of three and a minimum burst pressure of 1050 bar were used in the structural design, as recommended by EN12245 European standard. The COPV consisted of an aluminium liner and a carbon fibre reinforced polymer composite overwrap. The composite overwrap layup was optimised by FEM analysis, which was validated by experimental burst pressure tests. The tested COPVs presented a burst pressure of 1061 ± 26 bar, a very small difference of 0.7% with the simulated burst pressure (1069 bar). The optimised layup presents the following configuration: [903/±152]S.
An optical FBG sensing array was bonded to the aluminium liner prior to the composite overwrap winding enabling to monitor the winding process itself and curing schedule. Moreover, this work demonstrated the ability of the implemented optical system to detect and locate BVID and monitor the operational life of the COPV. The embedded OFs were able to detect and locate BVID, in the form of matrix cracks and small bumps, produced by drop-weight impact tests at 15 J energy. Errors as small as 17 mm and up to 56 mm were determined between the predicted and the ‘real’ impact locations. Such small errors will easily enable to detect and localise impact damage in a real structure in service.
Demonstration of the COPV’s operation monitoring was accomplished by a bend-insensitive OF fixed to the liner surface by epoxy adhesive and covered with a composite layer to protect the OF from excessive shear and compressive strains. The OF was able to withstand the full cyclic pressure testing, remaining operational even after the failure of the COPV. The bend-insensitive OF also revealed to react linearly to the internal pressure increasing, which can be used to detect the level of hydrogen in the COPV. Moreover, having an embedded OF able to withstand so large a number of pressure cycles will provide safety assurance and allow to optimise new COPV designs in the future. To the author’s knowledge, monitoring of pressure cycling tests at such high-pressure ranges has not yet been reported in the literature for metallic (type III) COPVs. This paper demonstrates the suitability of the reported FBG sensors embedding strategy for quality assurance of metallic COPVs during manufacturing and operation. A similar embedding strategy could not only be applied for conventional transportation applications, but also for metallic pressure vessels of reusable launch vehicles.
Footnotes
Declaration of conflicting interests
The author(s) declared no potential conflicts of interest with respect to the research, authorship, and/or publication of this article.
Funding
The author(s) disclosed receipt of the following financial support for the research, authorship, and/or publication of this article: This work was supported by the European Space Agency [Network/Partnering Initiative Program – ESA Contract 4000123315]; and the European Union’s Portugal 2020 founding program (ACE project (No 39863)).