
Abstract
This article presents continuous monitoring results of alkali-silica reaction (ASR) development in concrete specimens for over 400 days using ultrasonic testing and expansion measurements. Eight concrete specimens with nonreactive aggregate (Control), reactive coarse aggregate, and reactive fine aggregates were cast with two reinforced confinement conditions. The specimens were conditioned in an environmental chamber with high temperature and humidity (38°C and 90% relative humidity) to accelerate the ASR development. A multichannel ultrasonic monitoring system was developed to collect ultrasonic signals automatically, and the expansions in three directions were measured periodically. Results showed that the relative velocity change could detect the ASR initiation in all reactive specimens and show a correlation with expansion in the early stage. However, these correlations are inconsistent for different ASR specimens, and the velocity change becomes less sensitive to ASR damage in the late stage (after 300 days). Irrecoverable velocity drop was observed during every chamber shutdown period, especially in specimens with higher levels of ASR damage. This phenomenon suggests that the nonlinear ultrasonic response caused by the ambient temperature variation may indicate the ASR damage.
Keywords
Introduction
Alkali-silica reaction (ASR) has been recognized as a material distress process affecting concrete structures, including bridges, dams, and nuclear power plants. The reactive noncrystalline silica in concrete aggregates reacts with the sodium hydroxide in cement, generating silicate hydrate gel. The gel will swell and expand when absorbing water, causing cracks and degradation in concrete. ASR damage is often coupled with other concrete deterioration mechanisms, such as freezing–thawing and reinforcement corrosion, and reduces the capacity and service life of concrete structures. Preventing ASR in new concrete structures can be effectively achieved by choosing nonreactive aggregates and partial replacement of cement with fly ash, etc. 1 For existing concrete structures, especially critical infrastructures such as bridges, dams, and nuclear power plants, reliable ASR damage assessment is essential for service life prediction and public safety. In current practice, most ASR assessment programs rely on visual testing (VT), such as surface crack inspection and measurement. However, VT is subjective and cannot provide reliable information about the internal damage in concrete. Expansion measurement is commonly used for ASR damage assessment, which requires a reference measurement before the ASR expansion initiation. Concrete coring with subsequent petrographic examination 2 can provide more detailed information about the ASR damage, but petrographic examination is time-consuming and destructive, not suitable for long-term monitoring purposes.
Nondestructive testing and evaluation (NDT/NDE) methods, such as vibration-based methods, acoustic emission (AE), and ultrasonic tests, have been studied to assess ASR damage and monitor ASR development in concrete structures. The vibration-based method is based on the principle that the ASR-induced cracks decrease the elastic modulus of the concrete material, which can be detected in the vibration response of the sample. By measuring the resonant frequency of a small concrete prism per American Society for Testing and Materials standard C215, 3 the dynamic modulus is calculated for concrete specimens with different ASR damage levels.4–7Nonlinear resonance acoustic spectroscopy shows a high sensitivity to ASR damage development by measuring the fundamental resonance frequency change with vibration or strain magnitude.7–11 AE, a passive monitoring method, detects the energy released from the cracking events due to ASR gel expansion in concrete. AE has been used to monitor ASR development in a continuous manner.12–15
Ultrasonic tests are widely used for concrete damage assessment. Concrete property changes and microcracking damage will affect elastic wave propagation in concrete. Ultrasonic parameters, including wave velocity and amplitude (attenuation), have been investigated for ASR damage assessment in concrete.6,16–18 With the increase of crack density in concrete, both the ultrasonic velocity and the amplitude decrease due to wave scattering and absorption. Although the amplitude is more sensitive to microcracking than the wave velocity, 16 consistent amplitude measurement is difficult for long-term monitoring because the amplitude is greatly affected by the sensor coupling. Wave velocity-based analyses typically require a baseline measurement as a reference for quantitative evaluation. Saint-Pierre et al. 16 found the ultrasonic wave velocity dropped about 8% when the ASR expansion reached 0.2%, whereas in another study, Rivard and Saint-Pierre 17 found the velocity only dropped about 4% in concrete prisms at the same ASR expansion level. Giannini 6 investigated multiple NDT test methods, including ultrasonic pulse velocity (UPV), impact-echo, surface wave tests, and the resonance test for much larger ASR expansion ranges (0.3%–1.6%). It was found that the UPV results showed up to 20% decrease at higher expansions for different aggregates, but it was very difficult to obtain consistent UPV measurements. Nonlinear ultrasonic (NLU) methods show high sensitivities to ASR-induced microcracking damage in concrete, including nonlinear wave modulation, 19 nonlinear resonance test,9–11 or nonlinear wave mixing method.18,20 Most of these NLU tests are limited to laboratory tests or on small concrete specimens. Some recent studies applied NLU tests to large-scale concrete specimens and structures with promising results,21–23 but they are not used for long-term monitoring of concrete damage process.
This article presents an experimental study of continuous ultrasonic monitoring of concrete specimens with ASR damage. This work differs from other studies in terms of specimen size, aggregate types, confinement conditions, monitoring and conditioning duration, and data collection and analysis procedures. Previous studies measured the ultrasonic velocity using the UPV test on small concrete specimens with ASR damage.6,16,17 Small specimens are known to suffer from alkali leaching, which limits the ultimate progress of ASR.24,25 Larger specimens allow applying reinforcement, permit more extensive sensor networks, and better represent actual concrete structures. 26 In this study, eight concrete beam specimens were cast with different reactive aggregates and reinforcing confinements. These specimens were conditioned in an environmental chamber at 38°C and 95% relative humidity (RH) for accelerated ASR damage and continuously monitored by an ultrasonic testing system for more than 400 days. The wave velocity changes were analyzed for the entire monitoring period and compared to the expansion measurements on the specimens. With continuous ultrasonic monitoring and a slow expansion rate in the specimens, detailed data and information can be obtained in both the initiation stage and late stages of the ASR damage.
Concrete specimens
To investigate the effects of steel confinement and different types of reactive aggregates on the ASR damage development, eight concrete specimens were designed and cast in three groups (Table 1). All specimens are named following the rule of “Concrete mix—Confinement.” The first group included one control specimen (Control) and two reactive specimens with reactive coarse aggregate (RCA) (see Figure 1(a)), in which one reactive specimen had two-dimensional reinforcements (RCA-2D). The second group included one control specimen with 2D steel confinement (Control-2D) and two reactive specimens with reactive fine aggregate (RFA and RFA-2D). These six specimens had the same dimensions of 0.3 m × 0.3 m × 1.12 m. The third group included two small reactive specimens with reactive coarse aggregate (sRCA and sRCA-2D) and the dimensions were 0.3 m × 0.3 m × 0.61 m.
Concrete specimens information.
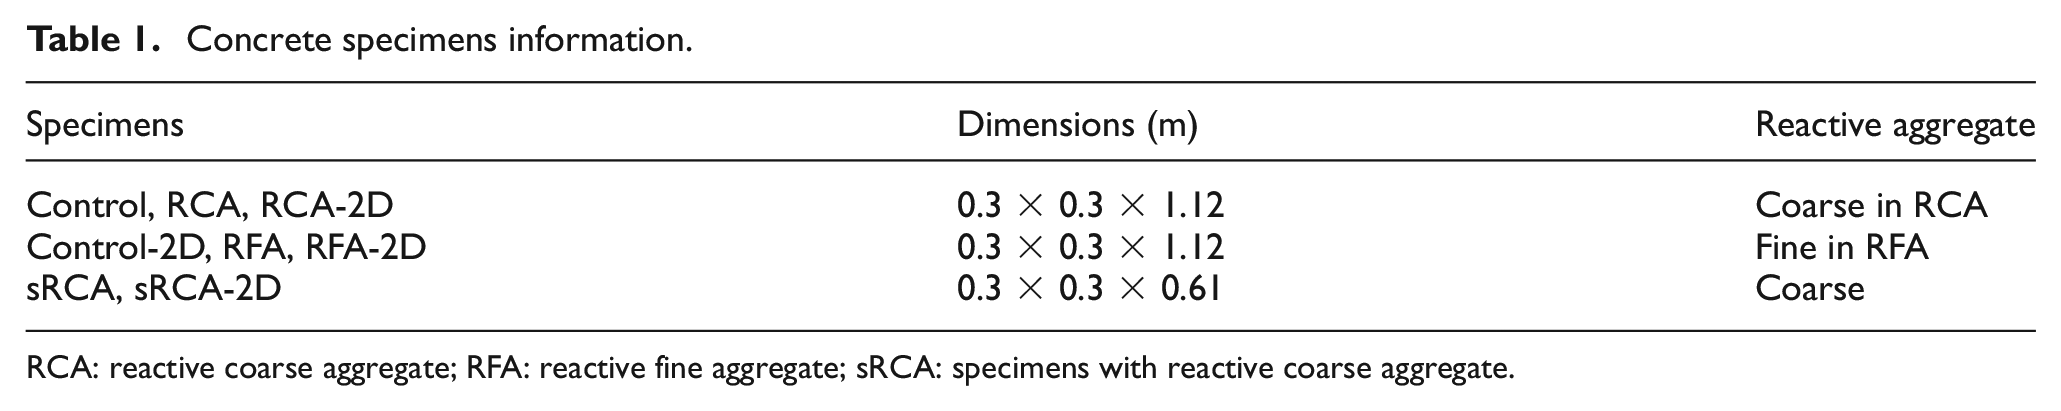
RCA: reactive coarse aggregate; RFA: reactive fine aggregate; sRCA: specimens with reactive coarse aggregate.
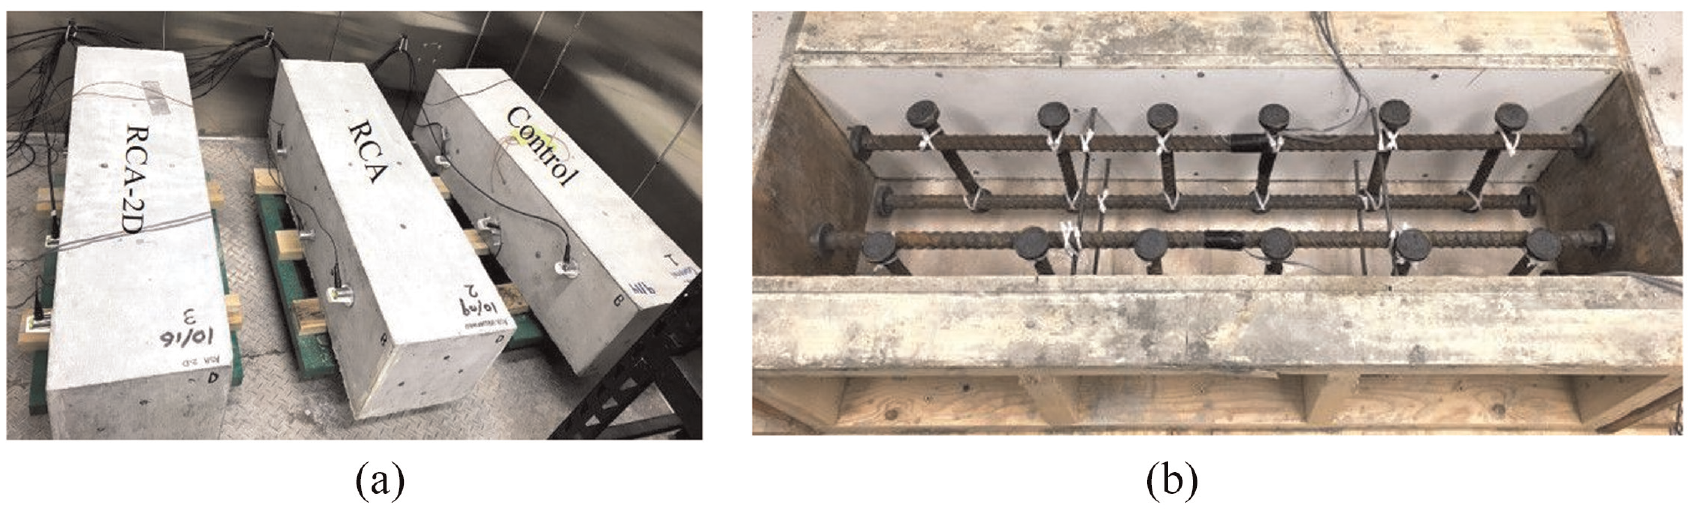
(a) Control, RCA, and RCA-2D specimens and (b) vertical and horizontal-headed reinforcement steel bars in the RCA-2D specimen.
Table 2 gives the mix design, slump, and compressive strength of the eight specimens. The Control mixes used innocuous local coarse and fine aggregates, all RCA mixes used reactive coarse aggregate and innocuous local fine aggregate with added NaOH to boost the alkali content to 1.50% Na2O by mass of cement. Both RFA mixes used innocuous local coarse aggregate and RFA with added NaOH. In all confined specimens (“-2D” specimens), No. 6 (diameter: 19 mm)-headed reinforcement steel bars were used to constrain the expansion in the longitudinal and vertical directions, as shown in Figure 1(b).
Concrete mix design and strength for the concrete specimens.
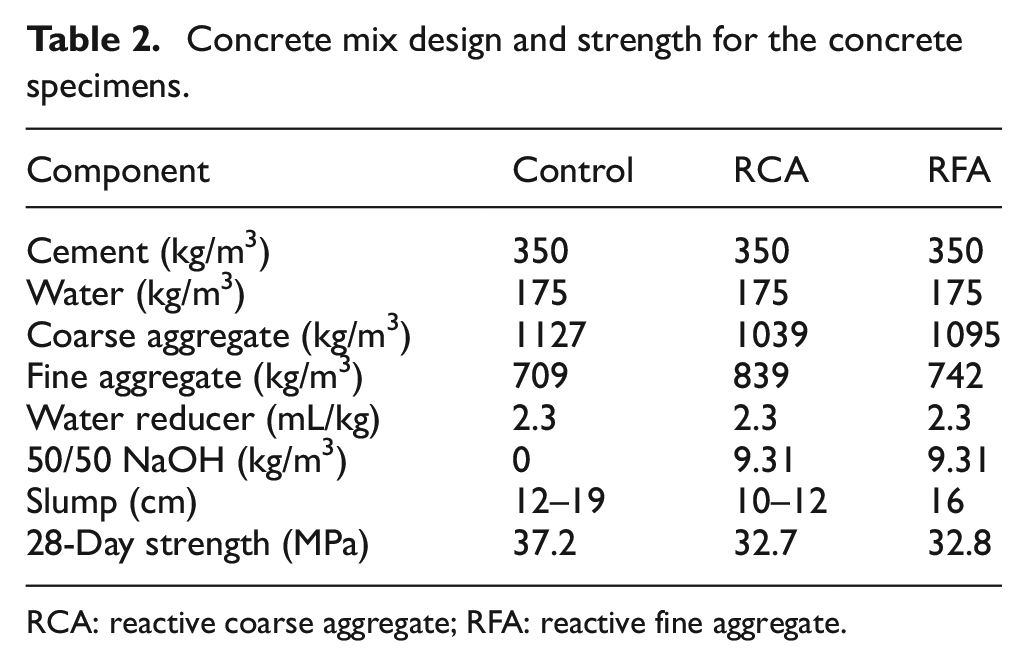
RCA: reactive coarse aggregate; RFA: reactive fine aggregate.
All specimens were moist-cured for at least 28 days. Then the specimens were moved to an environmental chamber for high temperature (38°C) and high humidity (95% RH) conditioning. The specimens were placed on racks to make sure all surfaces were exposed to moisture. Two thermocouple sensors were installed on the surface and inside of the RCA-2D specimen to monitor the surface and internal temperatures of the specimens. Demountable mechanical strain gauges (DEMEC) were used to measure the expansions in three directions. Stainless steel DEMEC targets were glued on five surfaces (except for the bottom) of each specimen and in two directions on each surface. Every 2 weeks, the chamber was shut down overnight then maintained at 23°C and 50% RH for 24 h. Expansions were measured using 150 and 500 mm DEMEC strain gauges (Mayes Instruments Limited, UK). Expansion measurements were taken during the shutdown period when the internal temperature of concrete specimens reached stable 23°C. Three measurements were taken on each test location and averaged. After the expansion measurements, the chamber was restarted, and the temperature and humidity were resumed to 38°C and 95% RH. More detailed information about the concrete specimens and curing conditions can be found in the technical report authored by the research team. 26
Ultrasonic monitoring system
An ultrasonic monitoring system was developed for long-term monitoring of the concrete specimens (see Figure 2). A 15-mm diameter piezoceramic disc was installed on the side surface of each concrete specimen as the ultrasonic transmitter (T). An ultrasonic pulser/receiver (Olympus 5077PR, Evident Corporation, Tokyo, Japan) was used to drive the transmitter with square wave pulses at the center frequency of 100 kHz. Two or three AE sensors (Physical Acoustics R15I-AST and R6I-AST, Princeton Jct, NJ, USA) were installed on the opposite side surface across the transverse direction. In this article, only the ultrasonic signals from the receiver right opposite to the transmitter were used for analysis. The other two receivers with lateral offsets had weak signals after the cracks initiated due to long travel distances, nonalignment, and wave scattering. The AE sensors were used as ultrasonic receivers (R) due to their high sensitivity and good electrical shielding. Although water-resistant epoxy was used to install all sensors on the concrete surface, the bonding between sensors and concrete still deteriorated with time due to the high temperature and humidity conditions. Therefore, sensors showing low amplitude were reinstalled at the same position during the chamber shutdown time. A multiplexer (Agilent 34970A and 34901A, Santa Clara, CA, USA) was used to sequentially switch each pair of the transmitter and receiver to the AE amplifier, ultrasonic pulser/receiver, and oscilloscope. The received ultrasonic signals were digitized by an oscilloscope (Pico Technology PICO4262, St Neots, UK) with a sampling rate of 10 MHz and averaged by 100 times to increase the signal-to-noise ratio. The ultrasonic test was conducted automatically every 12 h. When the chamber was shut down for expansion measurements, the ultrasonic monitoring system was paused. The surface and internal temperatures of the concrete specimens were also monitored using two Type-T thermocouples and a Picoscope TC-08 thermocouple data logger. A LabVIEW program was developed to automatically control the data acquisition process.
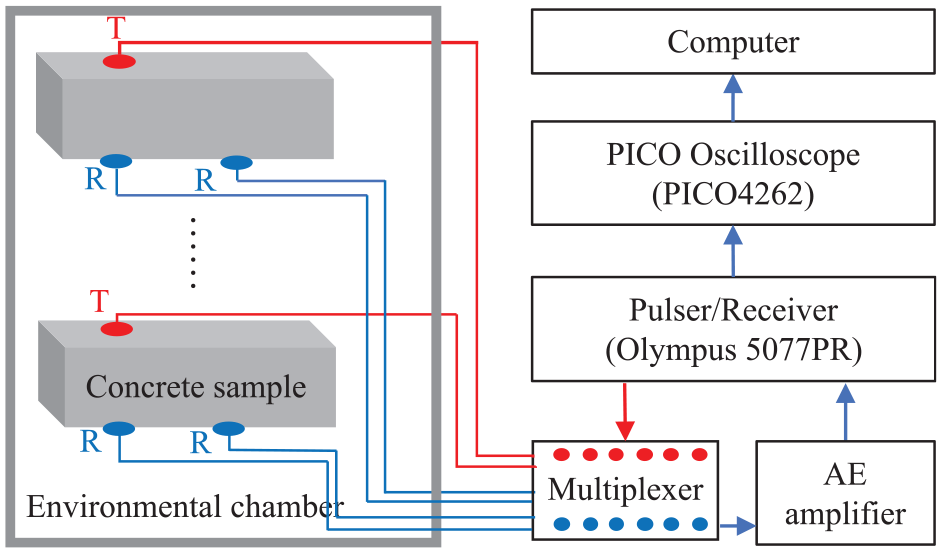
Experiment setup for the ultrasonic monitoring system.
Signal processing for wave velocity analysis
Coda wave interferometry
Wave velocity is calculated by dividing the wave path by the travel time. A UPV device is typically used to measure the wave transit time between two ultrasonic transducers. Due to inconsistent sensor coupling and limited accuracy in the first arrival time determination, this method cannot be used to measure very small velocity changes. Coda wave interferometry (CWI) has been used for monitoring small wave velocity changes caused by material property changes, stresses, or temperature variations. The coda wave is the tail part of a wave signal, which amplifies a minor change in materials through multiple scattering and reflections by internal scatters and sample boundaries. A relative velocity
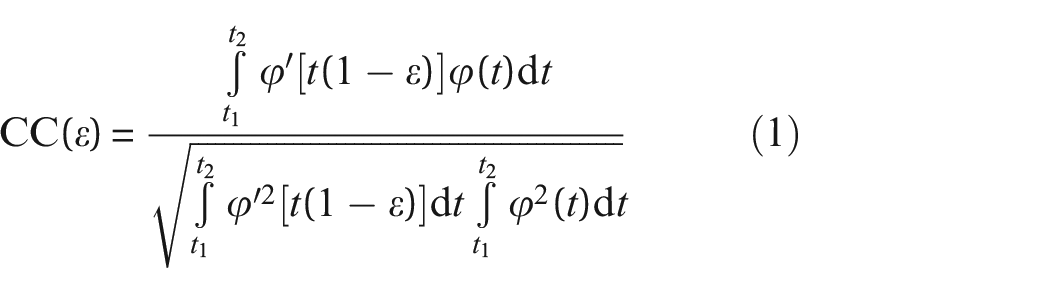
The stretching factor
Challenges with CWI
The high sensitivity of CWI analysis enables monitoring of slow and minor changes in materials, such as ASR-induced microcracking damage or the self-healing process of concrete.
29
However, when the material has severe deterioration or the sensor location changes, the perturbed signals and the reference signal lose coherence in the coda wave part, then CWI analysis no longer gives meaningful results. Similarly, the decorrelation coefficient analysis
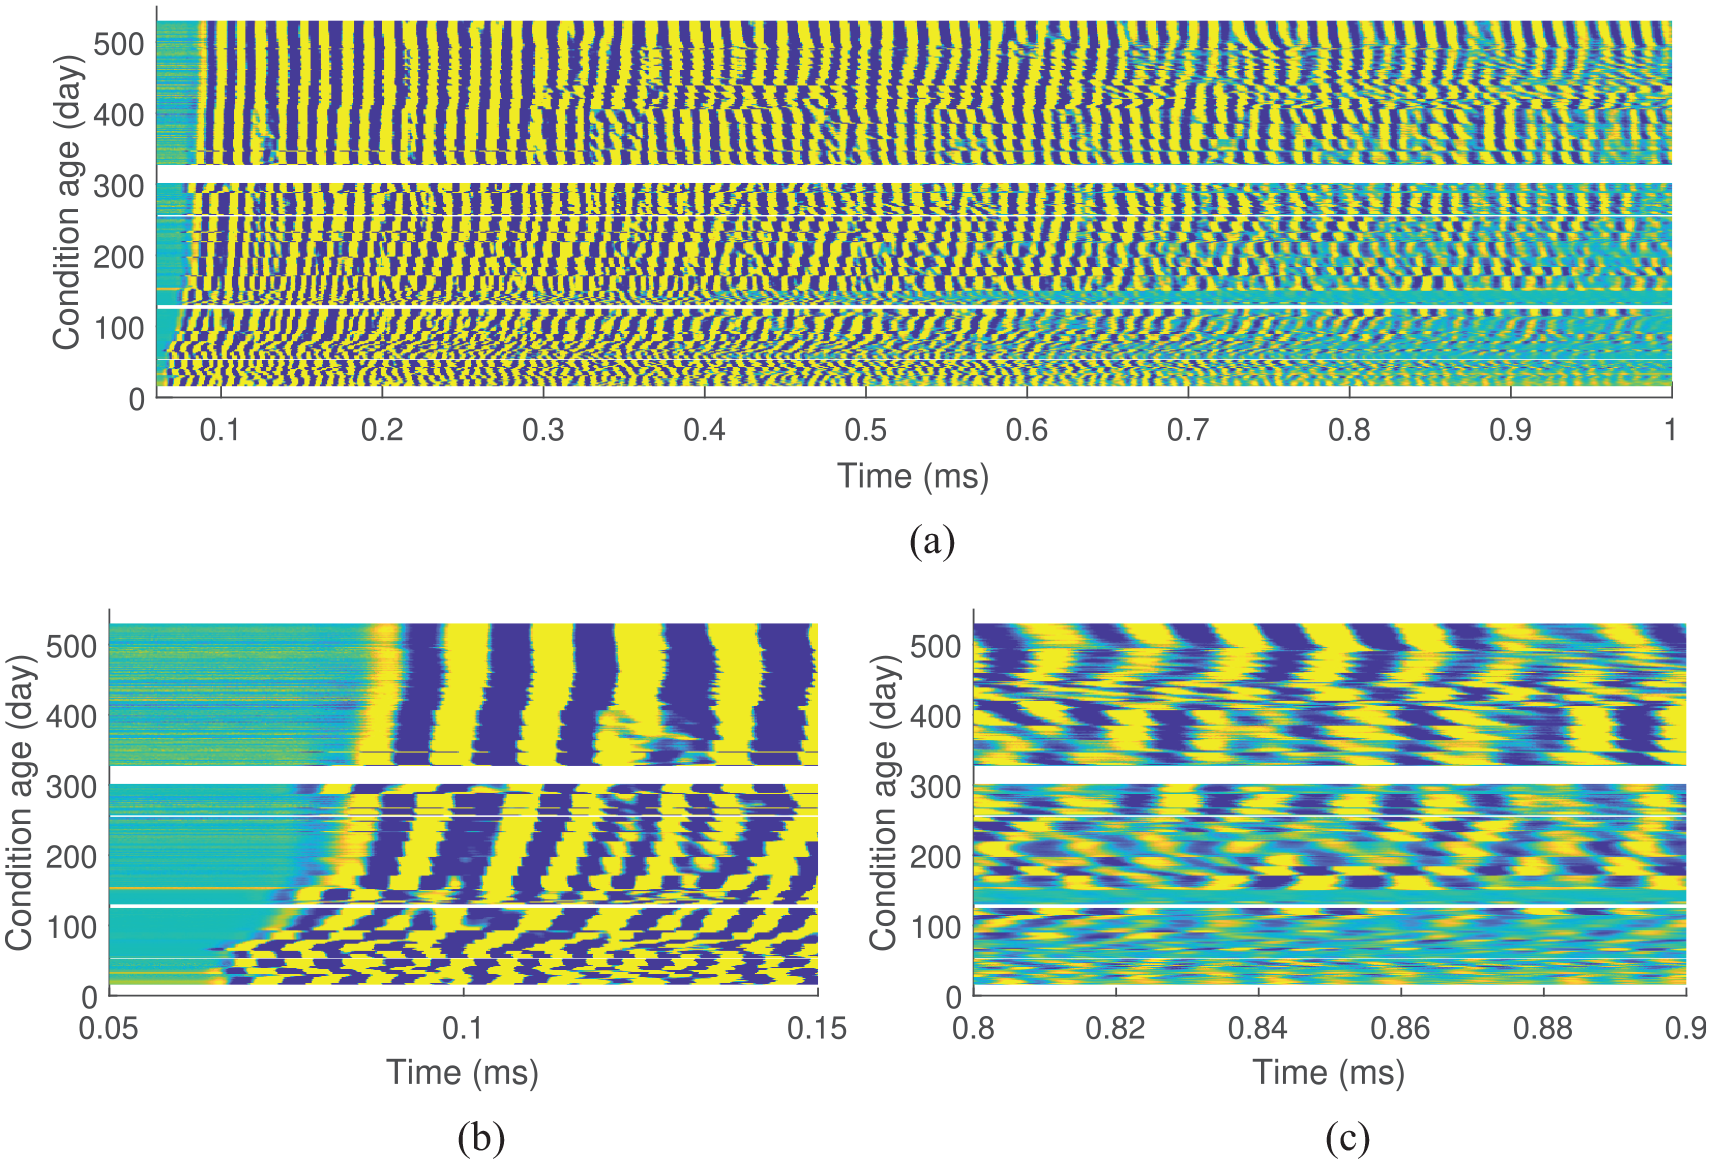
(a) “B-scan” of ultrasonic signals with condition age up to 540 days for the RCA specimen, (b) Zoom in of P-wave part of the “B-scan” image, and (c) Zoom in of the coda wave part of the “B-scan” image.
Niederleithinger and Wang et al.31,32 proposed the stepwise CWI method to calculate significant velocity changes in long-term monitoring data with large temperature variations. CWI is applied to each segment of slow-changing signals and changes the reference signal when the coherence drops below a certain threshold. The relative velocity change is calculated as the cumulative change from multiple-segment CWI analysis. A major challenge of the stepwise CWI analysis is that errors will accumulate throughout the entire analysis process, and the accumulated error may become very large after many steps at the late stage. In this study, extended chamber shutdown during the malfunction period and sensor reinstallation caused interruptions and large gaps (the white strip) in velocity change, while these gaps cannot be accurately calculated using coda waves due to lack of monitoring data during the shutdown periods. Therefore, the inaccurate gap estimation will be the main source of errors if stepwise CWI analysis was applied in this study.
Proposed velocity analysis method for long-term monitoring data
In Figure 3, the early part of signals still shows a consistent trend over the entire monitoring period, while within a small time range, the coda wave maintains good coherence. We proposed to address the challenges in the velocity change analysis of long-term monitoring data by using a two-level relative velocity analysis method. The procedure include:
Segmentation: First, the entire signal data is divided into several segments based on major interruptions. The signals shown in Figure 3(a) can be divided into four segments as shown in Figure 4. Within each segment, the ultrasonic signals were collected continuously without major interruption. Between segments, there was a large gap caused by either sensor reinstallation or long-time chamber shutdown due to malfunction.
Pivot signals: Second, one representative signal measured at a specific temperature (e.g., 38°C) is selected in each segment and named the pivot signal. The four pivot signals from the four segments are denoted as
Calculate local relative velocity change within each segment: Within each segment, the local relative velocity change
Build the entire

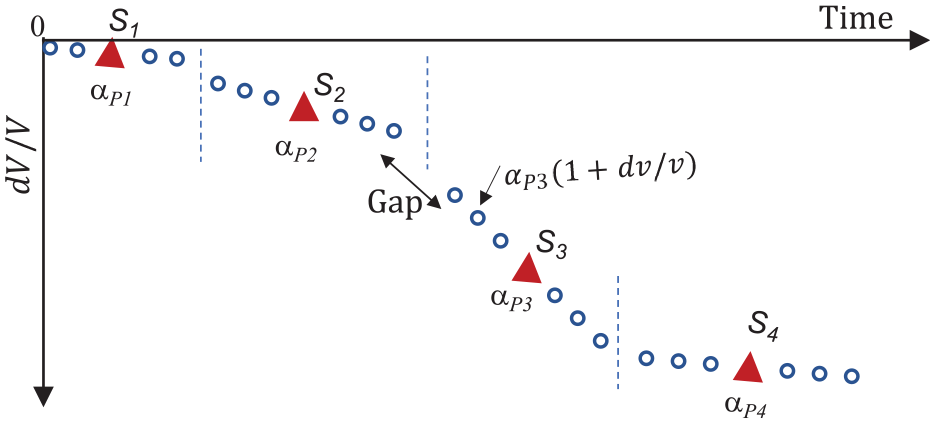
Velocity analysis for long-term ultrasonic monitoring data.
In Figure 4, the relative velocity change of each signal (blue circle) only depends on its local relative change with respect to the pivot signal
ASR expansion results
Group 1: RCA specimens
The expansions of all specimens were measured in three directions (longitudinal, transverse, and vertical) throughout the monitoring period. The volumetric expansion is the summation of the expansions in the three directions. Figure 5 plots the volumetric expansions for the three groups of specimens. In Figure 5(a), the RCA specimen exhibited a larger volumetric expansion than the RCA-2D specimen, which was mainly due to the large vertical expansion in the RCA specimen. 26 Ideally, the two ASR specimens should demonstrate similar volumetric expansions. Due to the large size of specimens and limited capacity of the concrete mixer, concrete for each specimen was mixed and cast separately. Variations in concrete mixing and casting may affect the ASR expansions, especially in the vertical direction, due to the effect of the horizontal casting plane, 33 where a horizontal crack may expand dramatically.
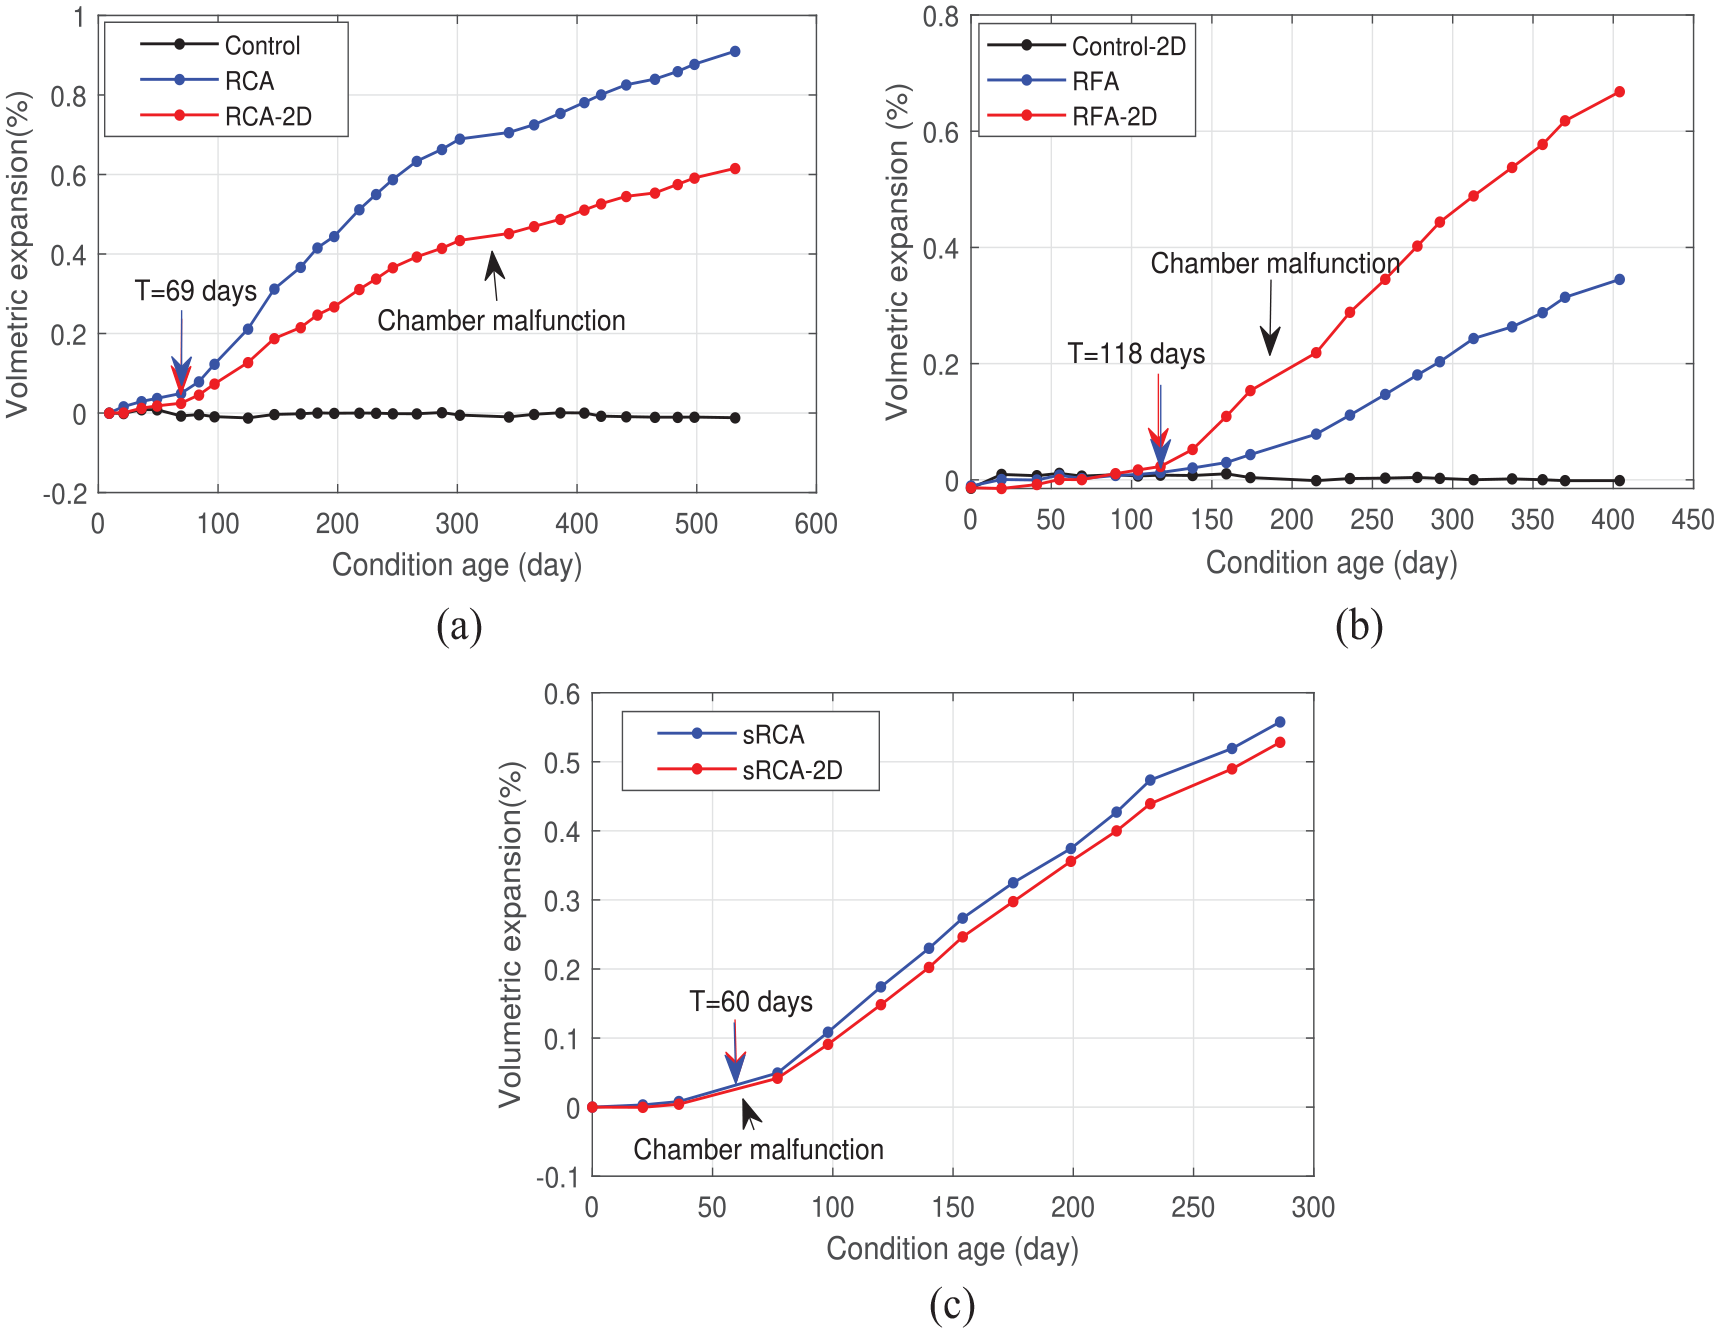
Volumetric expansion histories of: (a) Control (black), RCA (blue), and RCA-2D (red), (b) Control-2D (black), RFA (blue), and RFA-2D (red), and (c) sRCA (blue) and sRCA-2D (red).
The ASR initiation time was determined using the volumetric expansion rate when the expansion rate began to increase. The ASR was initiated at 69 days in both RCA and RCA-2D specimens, whereas the surface cracking appeared around 150. It indicates that the surface cracking does not provide an accurate indication of ASR initiation, and internal cracks caused by ASR occurred earlier than the surface cracks. During the chamber malfunctioning period (from day 302 to day 343), expansion measurements were not taken. Both the expansions of RCA and RCA-2D slowed down after the chamber resumed (343 days). The expansion of the Control specimen was relatively small and can be regarded as no expansion during the testing period.
Group 2: RFA specimens
Compared to the reactive coarse aggregate sample RCA, the volumetric expansion of RFA was less than half of the RCA expansion at 400 days. This result was confirmed on small concrete prism samples. 11 In both RFA and RFA-2D specimens, ASR expansion initiated at 118 days, later than the RCA initiation at 69 days, which indicates that the RFA aggregate had a lower reactivity than the RCA aggregate.
In Figure 5(b), the confined RFA-2D specimen showed a more significant volumetric expansion than the unconfined RFA specimen, which was caused by the large transverse expansion on the RFA-2D specimen. The RFA specimen only showed some random cracks on its top surface (Figure 6(a)), whereas the RFA-2D had a single longitudinal crack on the top surface leading to the sizeable transverse expansion, as shown in Figure 6(b). This comparison clearly shows the effect of 2D confinements, which restrict expansions in confined directions and induce a large crack normal to the transverse direction (unconfined). After the ASR initiation, both specimens expanded at relatively constant rates, and RFA had a larger expansion rate. The Control-2D specimen had no obvious expansion.
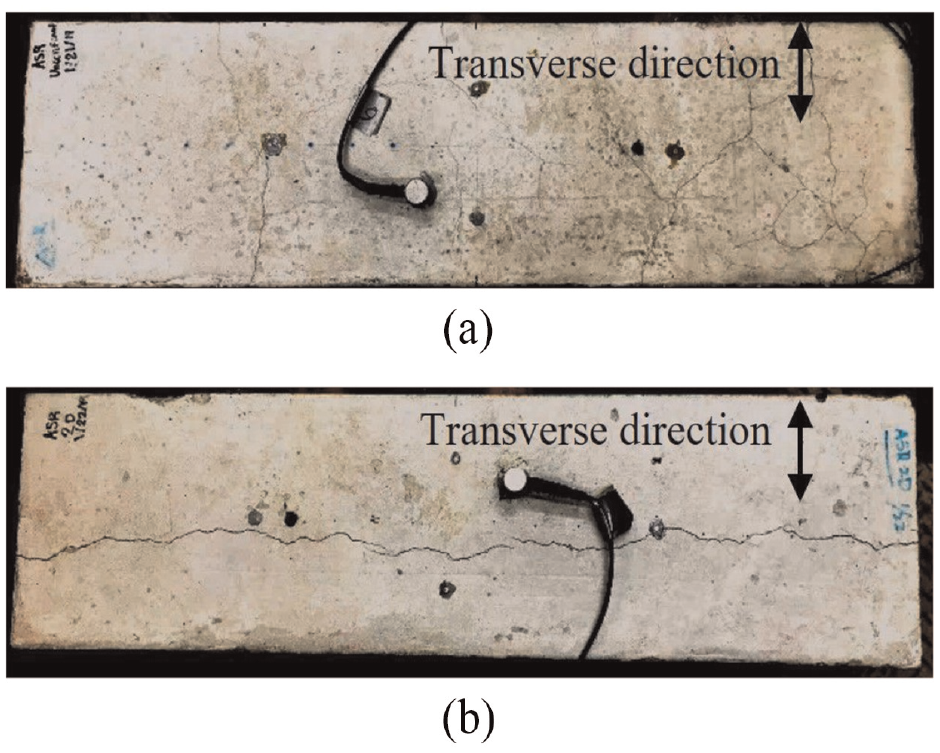
Surface cracks of: (a) RFA (top surface) and (b) RFA-2D (top surface).
Group 3: Small RCA specimens and effect of confinement
To confirm that the difference between unconfined and confined RCA specimens was caused by the casting effect, we cast two smaller specimens (sRCA and sRCA-2D) from the same concrete mixing batch. Their volumetric expansion histories are shown in Figure 5(c), where both curves are very close. Because the ASR was initiated during the chamber malfunction period, the initiation dates for the two sRCA samples were estimated to be 60 days, which was close to the expansion initiation time of the RCA and RCA-2D specimens (69 days). The expansion of these two specimens was around 0.5% at 250 days, which also agrees with the average expansions of RCA and RCA-2D specimens at 250 days. These results indicate that the volumetric expansion does not depend on the confinement condition and dimensions but can be affected by mixing and casting procedures.
Ultrasonic wave velocity monitoring results
The relative velocity change for each specimen was analyzed over the testing period using the method proposed in the signal processing section. The results are presented in Figure 7. In all figures, the Control specimens showed a slight increase in velocity due to continuing cement hydration, and all reactive specimens demonstrated significant velocity drops of
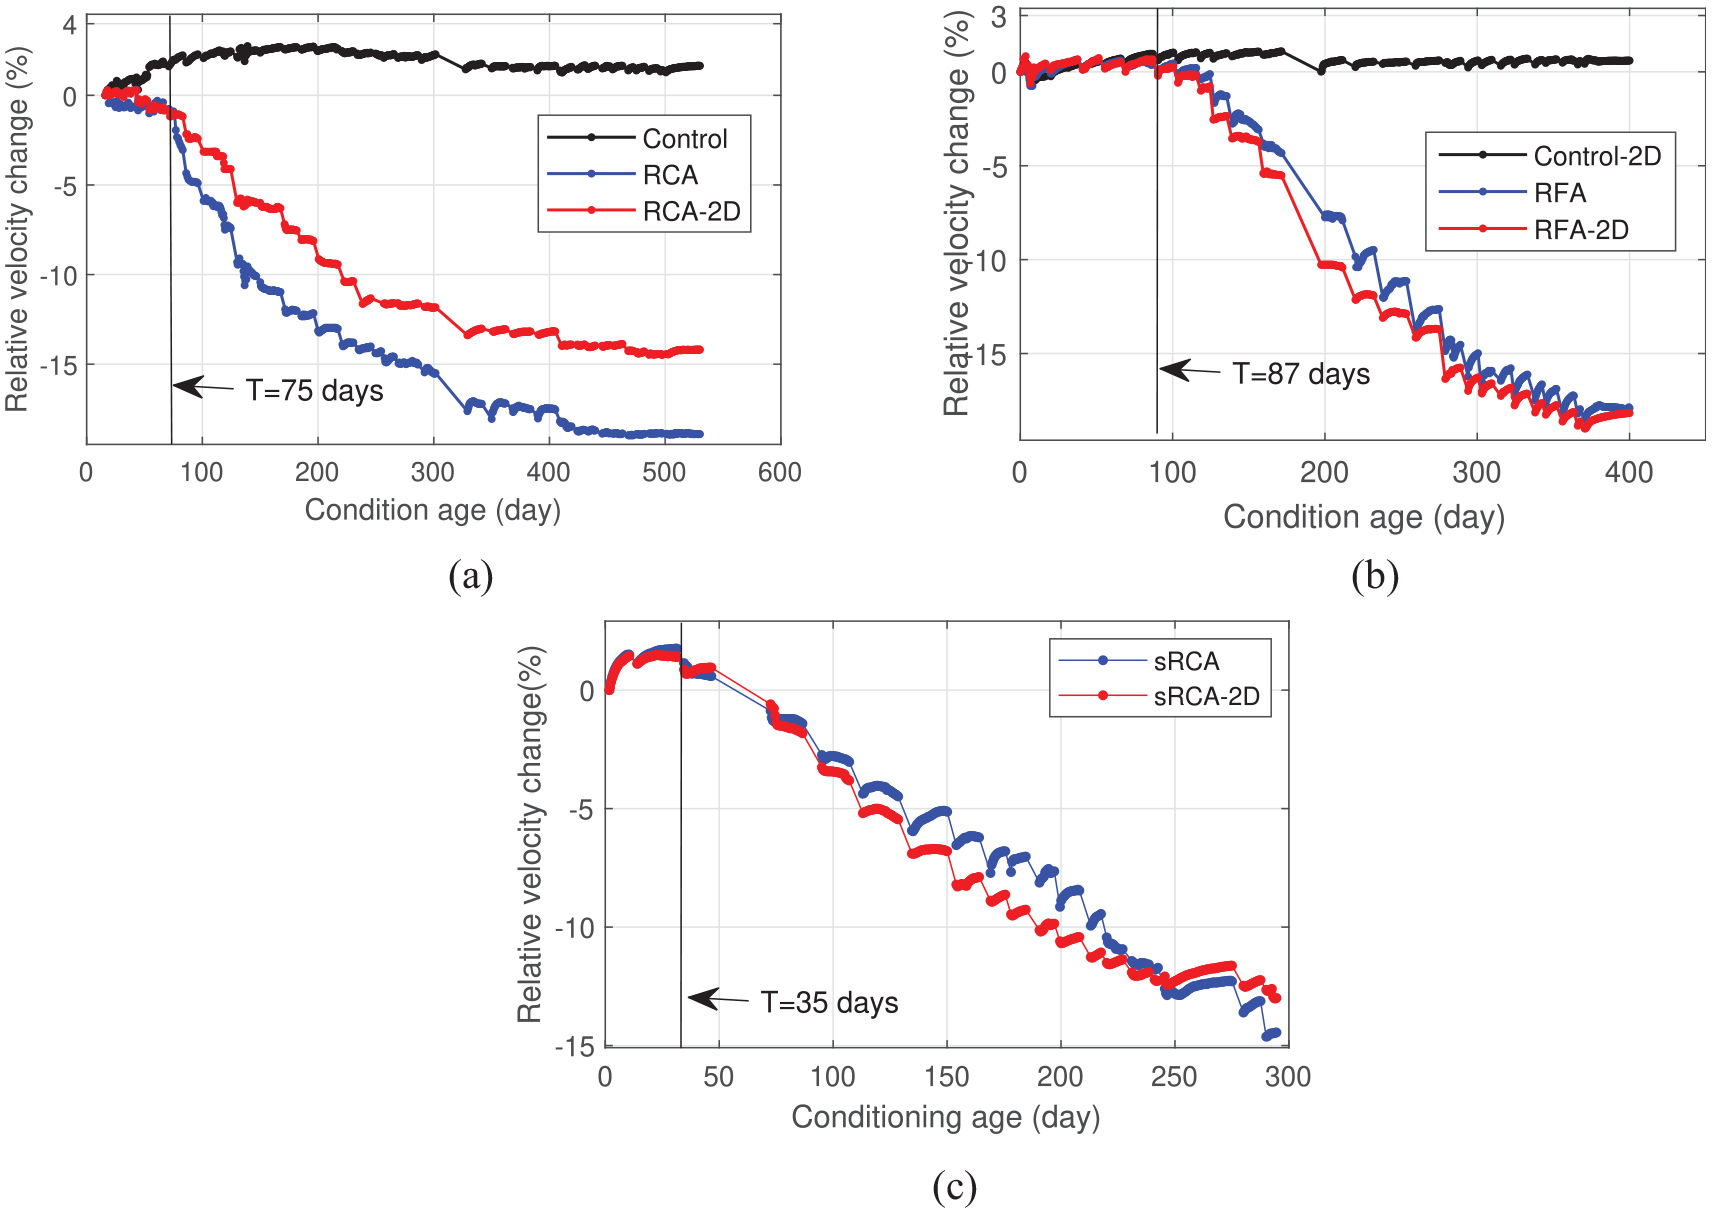
Relative velocity change histories: (a) Control (black), RCA (blue), and RCA-2D (red), (b) Control-2D (black), RFA (blue), and RFA-2D (red), and (c) sRCA (blue) and sRCA-2D (red).
Group 1 specimens: RCA, RCA-2D, and Control
Figure 7(a) presents the relative velocity change histories for the Control, RCA, and RCA-2D specimens. In the Control specimen, the velocity increased by 2.6% up to 210 days, followed by a sudden decrease during the chamber malfunction period (301–327 days), and then stayed constant. All eight specimens showed a large velocity drop during the chamber malfunction period, which may be caused by the moisture evaporation of the specimen. During normal chamber operation time, the specimens were 90%–95% RH condition, whereas the RH was around 30%–50% during the shutdown period. Exposure to the low-humidity environment for 27 days during the malfunctioning period caused a decrease in the moisture content and dry shrinkage of specimens, as shown in the expansion curves. For normal chamber shutdown period, the velocity of control specimens always showed a full recovery.
Before 75 days, the velocity history of the RCA specimen was relatively constant, while the RCA-2D history had a slowly decreasing trend. Both velocity histories began fast decreasing at 75 days, which is close to the date of volumetric expansion initiation (69 days, see Table 3), so the ASR initiation can be detected by monitoring the ultrasonic velocity change. The fast decreasing trend continued till 300 days for the RCA specimen and 250 days for the RCA-2D specimen. In this stage, both RCA and RCA-2D specimens had a high reactivity, and the volumetric expansions of RCA and RCA-2D also showed a fast increase before 300 days. After 300 days, the velocity decreasing slowed down for both specimens, although the expansions continued to increase with the condition age. In this stage, the expansions mainly came from the dilation of the existing cracks rather than the generation of new cracks. 34 Because the wave velocity is more sensitive to the crack density and quantity than the crack width, expansion of the existing crack has a limited effect on the wave velocity. Therefore, the velocity change is no longer sensitive to ASR damage at the late stage of expansion.
Dates for ASR initiation.
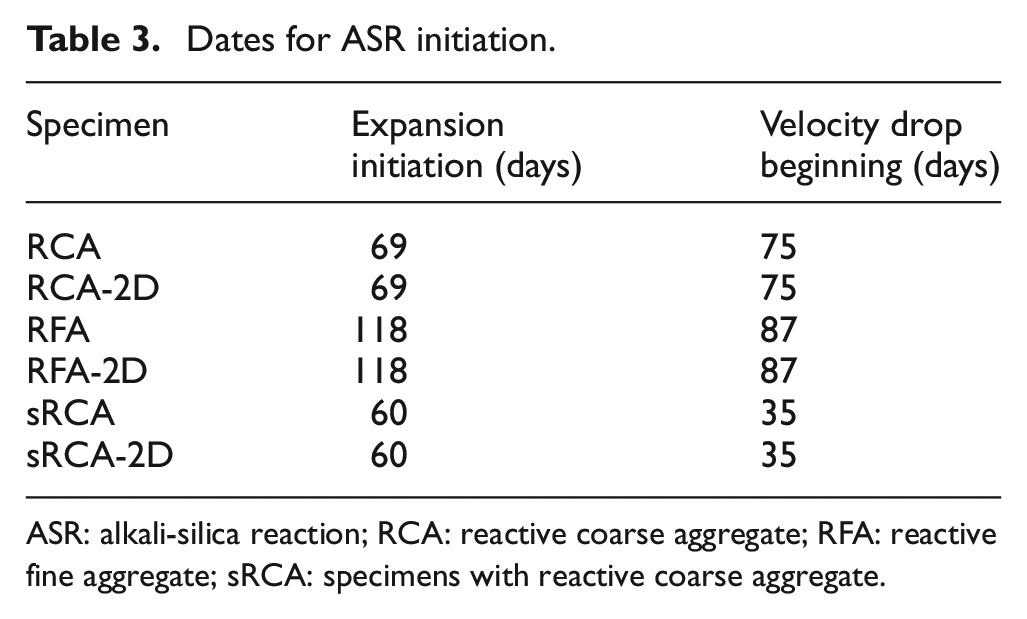
ASR: alkali-silica reaction; RCA: reactive coarse aggregate; RFA: reactive fine aggregate; sRCA: specimens with reactive coarse aggregate.
Group 2 specimens: RFA, RFA-2D, and Control-2D
Figure 7(b) plots the relative velocity change histories for the Control-2D, RFA, and RFA-2D specimens. Similar to the Control specimen in Figure 7(a), the velocity change for the confined Control-2D specimen (black curve) increased until the chamber malfunctioned and then stayed constant. For the RFA and RFA-2D specimens, both velocity histories started to drop at 87 days, which was earlier than the expansion initiation time (see Table 3), indicating that the velocity history showed an earlier indication of ASR development than the expansion measurement.
The RFA and RFA-2D specimens had a similar velocity change trend during the entire test period, but the volumetric expansion of the RFA-2D specimen was near twice the expansion in RFA. The pictures of both specimens are shown in Figure 6. On the top surface of the RFA specimen, tight surface cracks with random orientations were observed. For the RFA-2D specimen, a large longitudinal crack appeared on the top surface, which contributed to the large transverse and volumetric expansions due to the lack of confinement in the transverse direction. The longitudinal crack on the RFA-2D specimen only penetrated 1/3 depth of the specimen, which did not block the wave propagation path. Therefore, the velocity change for the RFA-2D specimen was mainly caused by small internal cracks rather than the single longitudinal crack. Since the two specimens showed very similar velocity decreases, the two specimens may have a similar crack density inside.
Group 3 specimens: sRCA and sRCA-2D
In Figure 7(c), the sRCA and sRCA-2D specimens showed very similar velocity histories over the monitoring period. Both the expansions and relative velocity change histories indicate that the two specimens had a similar ASR development over time. Both velocity curves started to drop at 35 days, which was much earlier than the expansion initiation time (see Table 3). At 250 days, the average velocity change of sRCA and sRCA-2D is −12.6%, whereas the average velocity change for the RCA and RCA-2D specimens is −13%. Therefore, the two small RCA specimens have almost the same average velocity change and average expansion as the large RCA specimens.
Correlation between wave velocity change and expansion
To understand if the wave velocity change can be used to evaluate ASR damage, we plot the relative velocity change versus the volumetric expansion for the eight reactive specimens in Figure 8. In the figure, all correlation curves show linear relationships up to −15% of velocity change and reach saturation around 20%. The relative velocity change became less sensitive to the volumetric expansion in the late stage than in the early stage. These results are consistent with the previous findings by Malone et al., 11 who used the resonance frequency to monitor ASR development in small prisms that were cast from the same batches of this work. In that work, the maximum decrease of the resonance frequency is about 12%–15% for RCA prisms, and it occurred between 250 and 300 days.
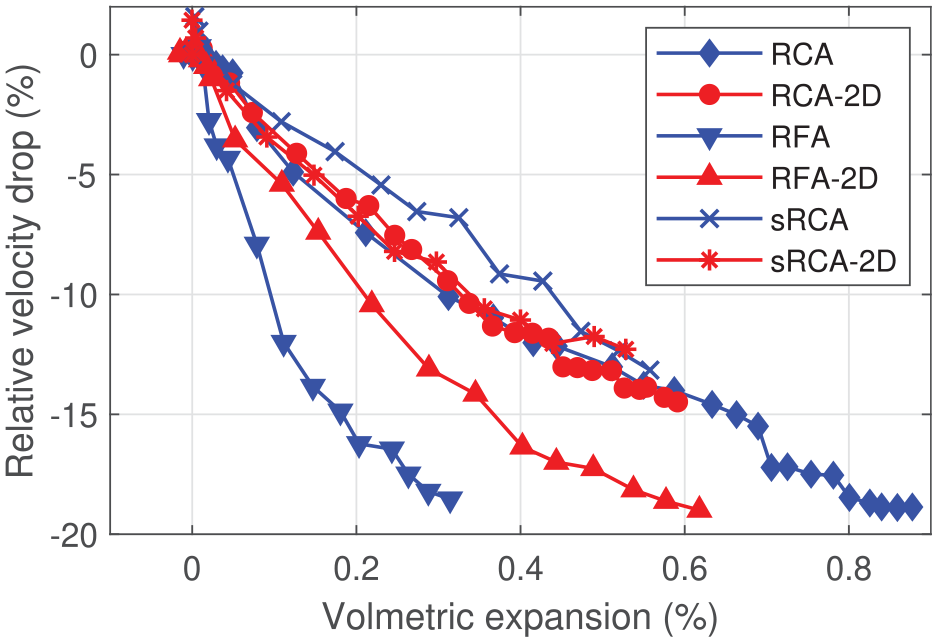
Correlation between the relative velocity change and volumetric expansion for all reactive specimens.
The correlation curves for all RCA specimens (RCA, RCA-2D, sRCA, and sRCA-2D) showed a consistent relationship, regardless of the confinement conditions, specimen size, and mixing batch. However, the correlation curves for the RFA and RFA-2D specimens demonstrated different trends due to the large expansion of RFA-2D. As explained before, the longitudinal crack on the top surface of RFA-2D specimen caused a very large volumetric expansion, but it did not contribute too much to the velocity change. Neither of the RFA and RFA-2D curves matches the correlation curves of the RCA and sRCA batches. Based on the results of the RCA, RCA-2D, sRCA, and sRCA-2D specimens, we may conclude there is a correlation between the volumetric expansion and the relative velocity change when the specimens have the same mix design and reactive aggregate and when the expansion is not dominated by a single large crack.
Discussions
By comparing the expansion curves of the large RCA specimens (RCA and RCA-2D) and the small RCA specimens (sRCA and sRCA-2D), we conclude that the mixing and casting process could affect the ASR damage development even if the specimens have the same mix design. The large RCA specimens were cast from two separate mixing batches and showed different volumetric expansions and velocity changes. As a comparison, the small RCA specimens cast from the same mixing batch showed the same expansion and velocity histories. An interesting finding is obtained in Figure 8, where the correlations between the velocity change and volumetric expansion are nearly the same for these four specimens regardless of the confinement conditions and dimensions.
From Figures 7(a) and 8, we observe that the ultrasonic wave velocity becomes less sensitive to the ASR damage development in the late stage than in the early stage, although the expansion continues to increase. Therefore, the wave velocity monitoring should be applied in the early or medium stage of ASR damage, and the velocity change can provide an accurate indication of ASR initiation well before the surface cracks appear.
As presented by the authors in their previous studies35,36 for most materials, the wave velocity increases when the temperature decreases, and vice versa. For an ideal elastic material subject to a closed thermal cycle, the wave velocity will resume to the original value after the cycle. However, all relative velocity change curves for the reactive specimens (Figure 7) show irrecoverable velocity drops during the chamber shutdown periods. Figure 9 shows the detailed relative velocity histories of the RFA and RFA-2D specimens during the period of 340 days to 400 days. At time T1, the chamber was shut down, and the temperature of the specimens gradually changed from 38°C to room temperature 23°C. After the chamber was restarted, ultrasonic monitoring resumed at time T2 when the temperature increased to 38°C. Therefore, the specimen temperature and chamber humidity were identical at T1 and T2. However, the wave velocity in both ASR specimens showed a clear drop between T1 and T2. This behavior has been observed for every chamber shutdown and restart cycle, and it is more pronounced in the reactive specimens than in the Control specimens (Figure 7). The velocity cannot recover to the original value after the specimen experiences a closed thermal cycle. This irreversible temperature effect might be related to the material hysteresis and damage level and deserves further studies. Sun and Zhu 36 built a model to interpret this nonlinear response of ultrasonic waves in materials with hysteresis. After the chamber restarted, the velocity gradually increased with time (e.g., after time T2) and showed a partial recovery during the constant temperature and humidity conditions. This slow recovery phenomenon occurred during every chamber restart cycle. Although ASR expansion continued during the chamber operating period (38°C and 95% RH), the wave velocity shows a slight increase in this condition, but this increase cannot fully offset the large velocity drop caused by the cooling/heating cycle in each shutdown period. Therefore, all velocity curves of ASR specimens showed a general decreasing trend with time and the number of thermal cycles. Although the control specimens also showed sudden velocity drops during chamber shutdown period, their velocities could fully recover during the constant conditioning period, which gives an overall constant trend of velocity.
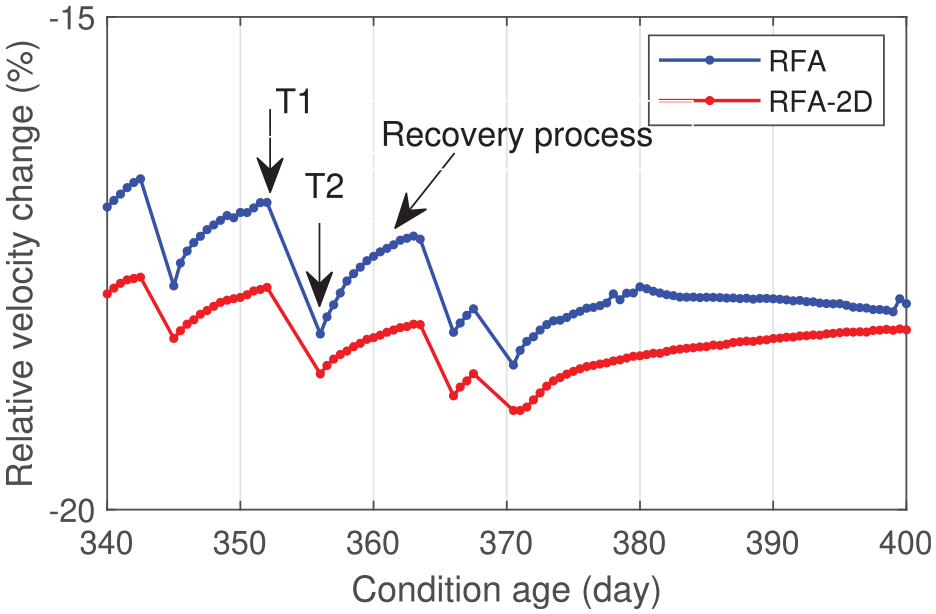
Relative velocity change histories of the RFA and RFA-2D specimens from 340 days to 400 days.
To investigate the NLU wave response to thermal cycles, we started to record ultrasonic signals during the chamber shutdown and restart period (e.g., from time T1 to time T2 in Figure 9) when the specimens experienced a closed thermal cycle. We then correlate the velocity change with the temperature history to study the thermally induced nonlinear acoustic response. Figure 10 shows the correlation curves between the relative velocity change and the specimen temperature for the Control-2D, RFA, and RFA-2D specimens during the chamber shutdown period of 365 days. The arrows represent the temperature change directions. In the figure, the velocity increased in the cooling process and decreased in the heating process. According to previous studies,36,37 the thermal velocity changes are attributed to the linear thermal expansion, local stress induced by the temperature gradient, and the material’s nonlinear acoustic behavior. The RFA-2D specimen had the largest slope for both the heating and cooling processes, whereas the Control-2D had the smallest slope. In the cooling process and temperature range of 24°C to 34°C, the slopes for the Control-2D, RFA, and RFA-2D are 2.3 × 10⁻⁴/°C, 5.5 × 10⁻⁴/°C, and 10 × 10−4/°C, respectively. At the time, the volumetric expansions of the Control-2D, RFA, and RFA-2D specimens were −0.0014%, 0.31%, and 0.62%, respectively. The trend of the slopes for the three specimens agrees with the ASR damage levels. As a comparison, the velocity drops are −18.2% for RFA and −18.8% for RFA-2D in Figure 7(b), which cannot differentiate the damage level between these two specimens. The RFA-2D curve also shows a large hysteretic area and a large velocity gap between the start and end points than the other two curves. This trend of hysteresis also matches the damage levels of the three specimens. Based on a previous study, 36 the slope and hysteretic gap of the correlation curves in the figure are related to the material nonlinearity induced by the ASR damage. NLU parameters may be more sensitive to ASR damage than the linear ultrasonic parameter (e.g., velocity) in the late stage of ASR development.
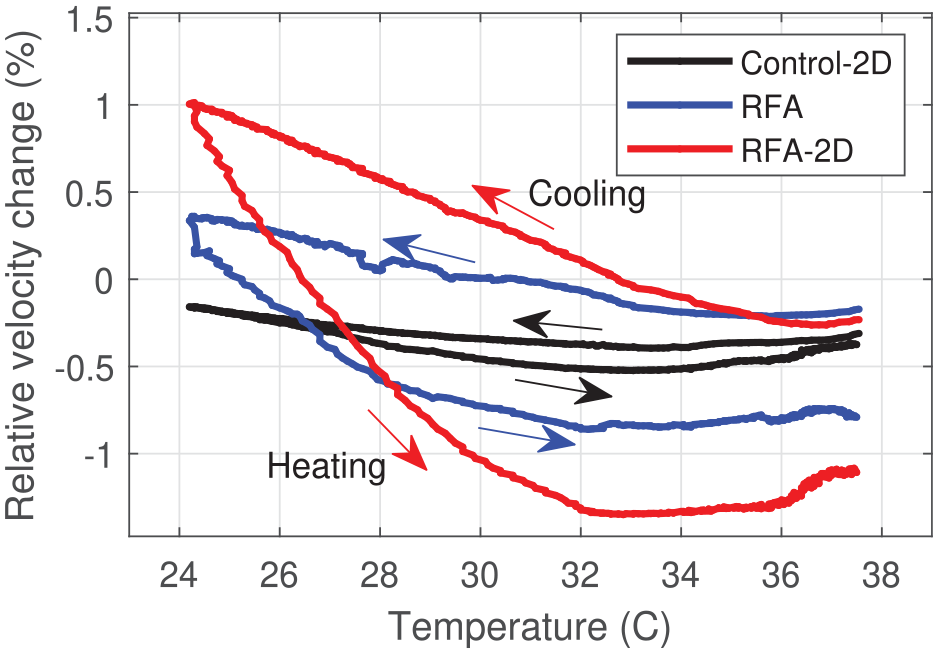
Velocity change versus temperature correlation curves in a closed thermal cycle for the RFA, RFA-2D, and Control-2D specimens at the age of 365 days.
Conclusions
In this work, the long-term ultrasonic monitoring results are presented for concrete specimens with ASR damage. Eight specimens were cast with different mix designs (nonreactive, reactive coarse, and reactive fine) and different confinement conditions (unconfined and 2D-confined). The specimens were conditioned in an environmental chamber for over 400 days to accelerate ASR development. A multichannel ultrasonic monitoring system was developed for the long-term monitoring of these specimens. Expansions were measured periodically during the chamber shutdown period at 23°C. A new algorithm was developed to analyze the long-term relative velocity change by dividing signals into multiple segments and using pivot points as segment references. The test results demonstrated the feasibility of long-term ultrasonic monitoring to characterize the ASR initiation and development in concrete.
Based on the expansion measurements, ASR initiated earlier in the specimens with reactive coarse aggregate (RCA and RCA-2D) than in the specimens with reactive fine aggregate (RFA and RFA-2D). Even with the same mix design, the ASR specimens may have different expansion rates due to differences in the mixing and casting process. Surface cracks appeared later than the ASR initiation time.
In all six reactive specimens, the relative velocity change could detect the ASR initiation regardless of the reactive aggregate type and confinement conditions. The ASR initiation time detected by ultrasonic velocity is generally earlier than or close to the expansion initiation time. The velocity-based initiation time can be determined by observation, or advanced machine learning algorithm. 38 At the early and medium stages of ASR development, the relative velocity change is sensitive to the ASR damage development and shows a nearly linear trend with the expansion. However, in the late stage, the relative velocity changes for the RCA and RCA-2D specimens became less sensitive to further damage development, whereas the expansions were still increasing. This conclusion was also verified by the correlation curves between the relative velocity change and the volumetric expansion. The RFA and RFA-2D specimens showed similar trends of relative velocity change but with very different volumetric expansions. The ultrasonic wave velocity may be related to the crack density rather than the volumetric expansion, so the dilation of existing cracks has a limited effect on the velocity decreasing.
The correlation curves between the relative velocity change and the volumetric expansion for all RCA specimens (RCA, RCA-2D, sRCA, and sRCA-2D) showed a consistent relationship. The correlation curves for the RFA and RFA-2D specimens demonstrated different trends because of a single wide crack on the top surface of the RFA-2D specimen, which contributed to the high volumetric expansion, but the velocity changes in both specimens are very close. Therefore, we may conclude that the specimens with the same mix design showed similar correlations between the ultrasonic velocity and the volumetric expansion if there is no major wide crack.
A velocity drop behavior was observed, followed by a recovery process after every chamber shutdown and restart. The behavior could be related to the material hysteresis and damage level of the specimens. By monitoring the relative velocity change during chamber shutdown periods in the late stage, we observed that the Control-2D, RFA, and RFA-2D specimens demonstrated different behaviors on the correlation between relative velocity change and temperature. The velocity of the RFA-2D specimen was most sensitive to temperature change, whereas the velocity of the Control-2D had the least sensitivity. This trend also matches the damage levels of the three specimens. According to a previous study, 36 nonlinear parameters could be extracted from these correlation curves, providing a potential solution for ASR damage evaluation in the late stage.
Footnotes
Acknowledgements
The authors acknowledge the technical support of Prof. Jiong Hu and Dr. Eric Giannini in preparation of materials and specimens and assistance of Ph.D. student Bibo Zhong in data collection.
Declaration of conflicting interests
The authors declared no potential conflicts of interest with respect to the research, authorship, and/or publication of this article.
Funding
The authors disclosed receipt of the following financial support for the research, authorship, and/or publication of this article: This work is sponsored by the U.S. Department of Energy, Nuclear Energy University Program (NEUP) under Contract No. DE-NE0008544.