
Abstract
Ultrasonic structural health monitoring (SHM) systems can detect degrading material properties based on changing wave speeds. In harsh environments like molten salt reactors and allied test loops, the transducers must be sufficiently robust to survive, and guided waves facilitate minimizing the number of transducers. The L(0, 2) guided wave mode can propagate long distances in the Ni-based alloy 600 tubing used for a molten salt thermal convection loop. The sensitivity of the L(0, 2) group velocity to material degradation associated with the corrosive attack of molten salt is assessed by modeling and ex situ guided wave speed measurements from alloy 600 tubing used in static salt tests. Guided wave testing is performed on dry tubing at room temperature. Microscopy is performed after guided wave testing to document the corrosive attack. At driving frequencies of 490 and 680 kHz, the group velocities are shown to decrease and increase, respectively, for small amounts of material degradation on the inner diameter of the tubing. These opposite trends in group velocity are anticipated to provide a sensitive characteristic for SHM. Although the data are somewhat limited, the wave speed of the more dispersive 680 kHz frequency appears to be more sensitive to corrosive attack, with a possible threshold in the 50–100 µm range.
Introduction
In order to deploy clean, domestic energy sources of the future, the safety and reliability of baseload power generation are paramount.1–3 Engineering materials for service in nuclear reactors, such as the higher efficiency molten salt reactors, and small modular reactors are under development with planned operating lifetimes up to 5 decades to achieve long-term energy security. These can offer continuous baseload electricity to bridge gaps in intermittent renewable energy sources. One concern about molten salt nuclear reactors (MSRs) is the potentially corrosive halide salts used as the working fluid and/or as a fuel salt.4,5 Thus, continuous, in situ characterization of the structural integrity of their conduits is desired for increased safety and to avoid costly periodic shutdowns for offline inspection.
Typical MSR operating temperatures are 500°C–800°C. However, for temperatures beyond 300°C, the reliability of commercial structural sensors based on electrical transducers (piezoelectric or magnetostrictive) is still under investigation. Alternative high-temperature transducers are desired that can survive the MSR conditions while continuously monitoring the containment structures.
Transducer characterization and improvements for operation in harsh environments such as much higher temperatures (>500°C) have been progressing rapidly to address safety in power generation stations, superheated steam lines (whose temperature is between ∼500°C and 600°C), process industries, in aeroengine manufacture and operation, and petrochemical plants as well as nuclear reactors. Guided wave ultrasound has been pivotal in locating damage in ambient temperature pipelines (e.g., Cawley 6 ), and piezoelectric ultrasound transducers are mainly applied for this purpose. While much reported work on “high temperature” refers to ∼100°C range, here, we focus on transducers capable of operating at temperatures above 500°C for molten salt. Likewise, the effects of environmental and operating conditions on an SHM system can be characterized through receiver operating characteristic curves, as described by Cawley and colleagues.7,8
A large aggregate of studies has been undertaken to evaluate high temperature piezoelectric crystal transducers’ performance up to almost 1000°C.9–13 Piezoelectric wafer active sensors have also been demonstrated by Dhutti et al. 14 up to 600°C, and brazing techniques for longer term monitoring have been outlined. 15 In addition, for nuclear reactor applications, temperature and neutron flux studies 16 show promising transducer performance. Contactless transducers are also investigated for high-temperature monitoring of plate-like structures with ultrasonic Lamb wave methods, 17 from where signals are detectable over long distances. Hence, long-term operation of high-temperature SHM systems is an emerging possibility. However, as noted by Dhutti et al., 18 many challenges remain.
Optical fiber sensing systems for detecting ultrasonic signals provide several advantages, such as tolerance of harsh environments, ability to multiplex sensor signals, and elimination of cabling, as described by Wild and Hinckley 19 and Allwood et al. 20 Specific research to understand the operational parameters for maximum sensitivity of optical fiber systems is described, for example, by Betz et al., 21 Minardo et al., 22 Rosenthal et al., 23 and Davis et al. 24 Some specific applications for detecting Lamb waves with fiber Bragg gratings in optical fibers are reported by Betz et al., 21 Soman et al., 25 Wang et al., 26 and Wee et al. 27 The literature cited here, and elsewhere, provides solid evidence that optical fiber sensing systems have strong potential for SHM of components in molten salt reactors and allied test loops. In the present application, the L(0, 2) guided wave mode has a large in-plane displacement component on the surface (as shown in Figure 2(b)), which is readily detectable with a fiber Bragg grating.
The objective of this article is to demonstrate the capabilities of an SHM system for a prototypical molten salt test loop based on ultrasonic guided wave speeds measured on static salt capsules. The test loop is a thermal convection loop (TCL)28,29 comprised of alloy 600 tubing, Figure 1(a), while the SHM system employs ultrasonic guided waves to monitor the hot zone of the loop, where material degradation is most likely to occur. The key components of the SHM system under development are the launching piezoelectric actuator and temperature-resistant fiber optic Bragg grating receivers coupled to the outside of the tubing. The static salt capsules are vessels made from the alloy 600 tubing used for the TCL, which contain molten salt and will be described in detail subsequently.
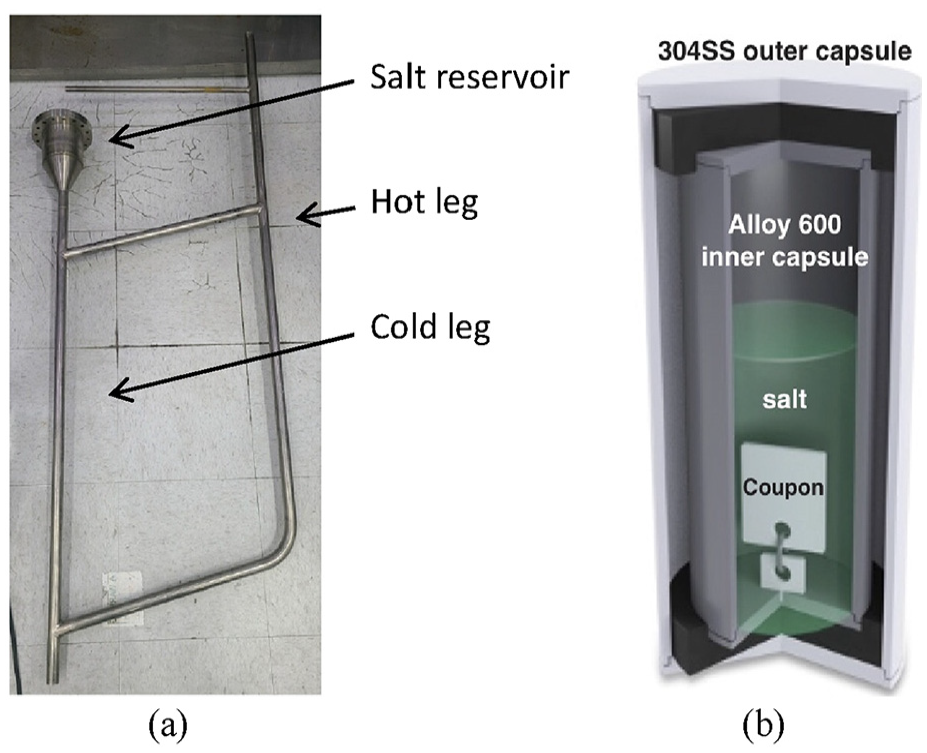
(a) Thermal convection loop and (b) static salt capsule.
To demonstrate guided wave sensing capability, initial offline guided ultrasound results are reported here from experiments conducted on the static salt capsules shown in Figure 1(b), before and after exposure to molten salt heated to 700°C or 800°C for 100 h. Importantly, these ultrasonic measurements were not conducted at high temperature and did not use fiber Bragg gratings.
The remainder of the article is organized as follows. Section “SHM system for TCL” briefly introduces the SHM system for the TCL at Oak Ridge National Laboratory (ORNL), where it will be deployed. The section “Ultrasonic guided wave mode selection” describes the selection of ultrasonic guided wave modes for the molten salt test loop tubing based on propagation distance, sensitivity to damage, and detectability. Offline salt testing materials and methodology for baseline-guided wave testing using static salt capsule experiments are described in the section “Static salt capsule testing materials and methodology.” Results from guided wave testing and metallography are provided in the section “Static salt capsule test results.” A simplified model is implemented to relate corrosive attack, which results in porosity or wall loss, to material properties and wave speeds as described in the section “Material degradation model.” The changes in wave speed resulting from static salt exposure are discussed in light of the model in the section “Discussion.” Finally, a concise summary and conclusions bring the article to a close.
SHM system for TCL
As a surrogate for a molten salt reactor with flowing salt where corrosion is a concern, a much simpler TCL at ORNL has been selected to demonstrate SHM operation at high temperature (Figure 1). This TCL was fabricated from 25.4-mm diameter alloy 600 tubing. In a TCL, molten salt flows due to the ∼100°C thermal gradient, which results in a salt density difference between the hot and cold legs. Measurements are to be made in the more corrosion-prone hot leg of the TCL to detect guided waves’ velocity changes. Since guided waves are multimodal and dispersive, we must select which wave mode and frequency to use (in section “Ultrasonic guided wave mode selection”) and then determine the SHM system’s sensitivity to material degradation from corrosive attack.
The basis of operation of the SHM system is that material degradation of the tubing associated with the corrosive attack of the flowing molten salt affects the ultrasonic guided wave speeds. Thus, changes in wave speeds will be measured during TCL operation in the final SHM system for a long duration. The functional requirements of the system are that online measurements at prescribed intervals with noninvasive receivers will be conducted during operation at nominally constant temperatures up to 700°C. The structural health monitoring (SHM) system for the molten salt test loop will use high-melting point (>1500°C) fused silica optical fibers for receiving ultrasound, in combination with remotely launched ultrasound via piezoelectric transducers. Long guided wave propagation distances provide a significant advantage in terms of the size of regions that can be monitored. Other specifics of the SHM system under development with remote launch and fiber optic receivers will be provided in a companion article, wherein the results from a flowing salt test in the TCL will be presented. Fiber optic receivers are a good choice for the type of guided waves selected because of their sensitivity to in-plane displacement and because they can be multiplexed to assess degradation in different regions of interest.
Bulk ultrasonic wave speeds depend on linear elastic properties (and mass density). In addition, as indicated in Figure 2, guided wave speeds also depend on the wall thickness. Thus, material degradation causes changes in wave speeds that can be detected using pitch-catch guided wave ultrasound. Specifically, a transducer actuates guided waves that propagate along the TCL tubing through the hot leg, where maximum degradation is expected. Sensors that can survive the harsh environment in the region of interest will be used to receive the guided waves at fixed positions such that the average wave speed between sensor positions can be computed. In fact, it is the change in wave speed that provides information about the material degradation. When used in pairs, the sensors enable the calculation of the average wave speed in the region of the structure between the sensors. Taken individually, a sensor can monitor a change in average wave speed from the actuator to the sensor. As already noted, SHM system measurements on the TCL will be reported in a companion paper. Initial offline guided wave measurements have been undertaken (see section “Static salt capsule test results”) to ensure that the SHM system will be capable of providing meaningful results.
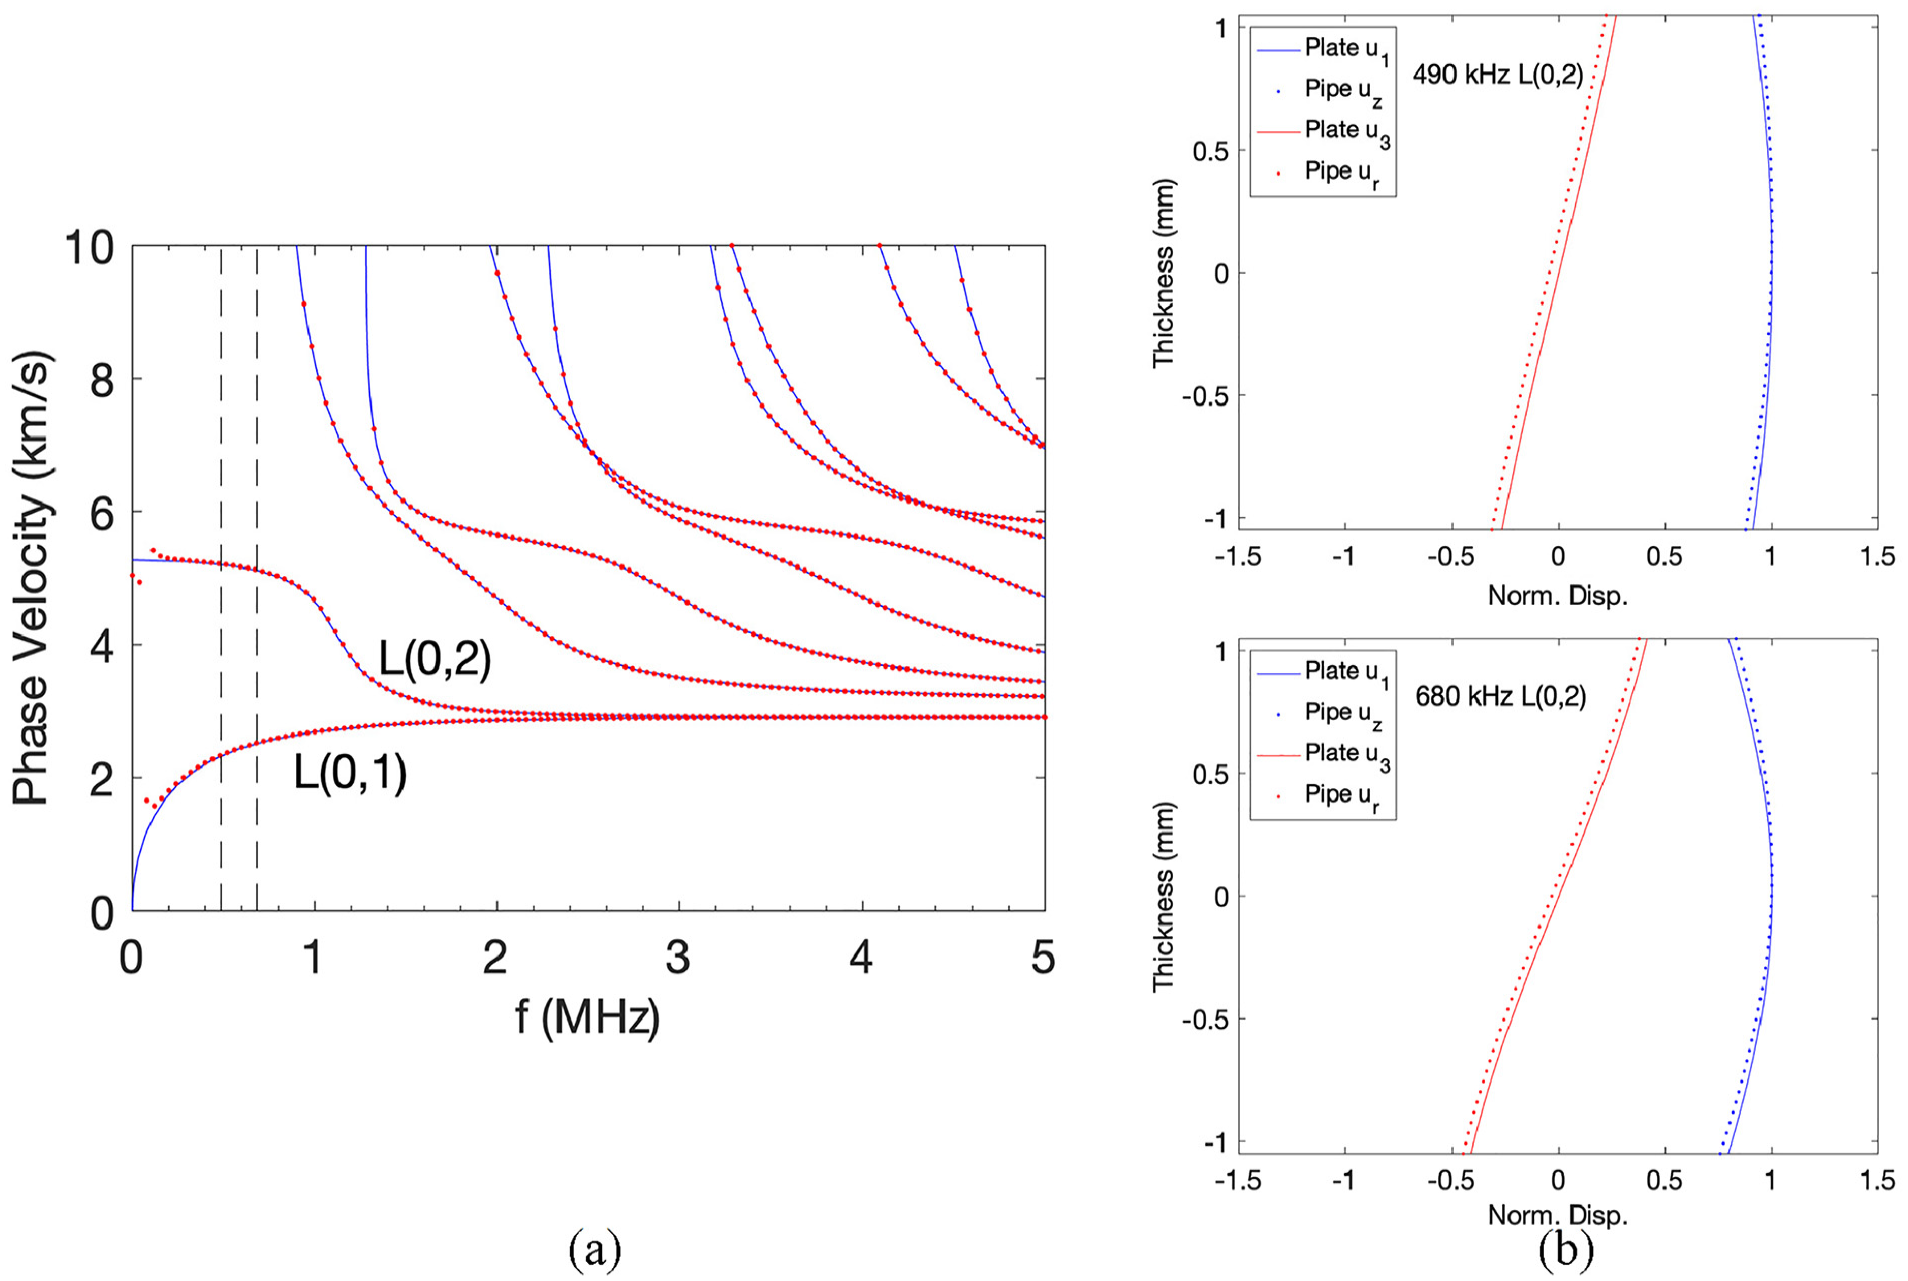
(a) Phase velocity dispersion curves for axisymmetric longitudinal wave modes in 25.4-mm outer diameter alloy 600 tubing with 2.1 mm wall thickness. (b) Wave structure for L(0, 2) mode at 490 and 680 kHz. The results for Lamb waves in a plate are overlaid in blue on the results for a pipe, which are shown in red.
Ultrasonic guided wave mode selection
Phase velocity dispersion curves determined using a global matrix method for the tubing are shown in Figure 2 based on handbook values for material properties of alloy 600 (ρ = 8420 kg/m3, c L = 5770 m/s, c T = 3138 m/s). Axisymmetric longitudinal wave modes propagating along the tubing are the only type shown, that is, torsional and flexural modes are not shown. Each point on each dispersion curve has a unique wave structure (displacement profile) associated with it. Defining a cylindrical coordinate system helps describe the guided wave propagation. Let the z-axis be along the tubing axis, and let r and θ be the radial and circumferential directions, respectively. We prefer to use frequencies below the lowest cutoff frequency to minimize the number of propagating modes and to promote long propagation distances. Furthermore, only longitudinal type waves are considered, that is, L(0, 1) and L(0, 2), to simplify actuation and reception. Ultrasonic energy in wave modes with a significant radial displacement component, u r , at the inner diameter will leak into the fluid contained within the tubing, the molten salt in the case of an operating reactor or TCL. These wave modes (e.g., L(0, 1)) are not capable of propagating long distances. Therefore, we select the L(0, 2) wave mode because it has only a small radial displacement component at the tubing surface, minimizing ultrasonic energy leakage. Additionally, its large u z displacement component is effectively detected by a surface-mounted optical fiber with a fiber Bragg grating.
As previously mentioned, the basis of the SHM system is that degradation of the tubing material will be evident from the speed of the ultrasonic guided waves. Guided waves are dispersive; thus, it is the group velocity that is computed from time-of-flight (TOF) measurements over a known distance. The group velocity is dependent upon the linear elastic constants, the mass density, and the wall thickness. Attenuation from the tubing material is associated with internal scattering and damping. While attenuation coefficients were computed as part of this work, this article focuses on wave speeds. Figure 3 shows the dependence of phase velocity and group velocity on frequency for 2.1-mm thick alloy 600 tubing. Having already selected the L(0, 2) wave mode, that is the only mode that we will analyze further. For frequencies between 200 and 600 kHz the L(0, 2) mode is relatively nondispersive, but between 600 and 1000 kHz, it becomes progressively more dispersive, and the group velocity decreases. As the dispersivity increases, so too does the pulse spreading of the wave packet, which limits the effective propagation distance. The frequency of 490 kHz was selected because it is near the end of the nondispersive region for the L(0, 2) mode. Thus, it is able to propagate a long distance because it is quite nondispersive and has lower attenuation than higher frequencies. In addition, the lead zirconate titanate (PZT) elements planned for use in the TCL have a 490 kHz resonant frequency. The material degradation model results in the section “Material degradation model” show that the dispersivity provides a unique advantage, and thus the higher frequency of 680 kHz is also used. This particular value (680 kHz) is selected due to the ability to use PZT discs with a 680 kHz resonant frequency for the TCL. For clarity, we reiterate that only 500-kHz PZT discs were used for capsule testing. The group velocities predicted for the L(0, 2) mode at 490 and 680 kHz are 5053 and 4722 m/s, respectively.
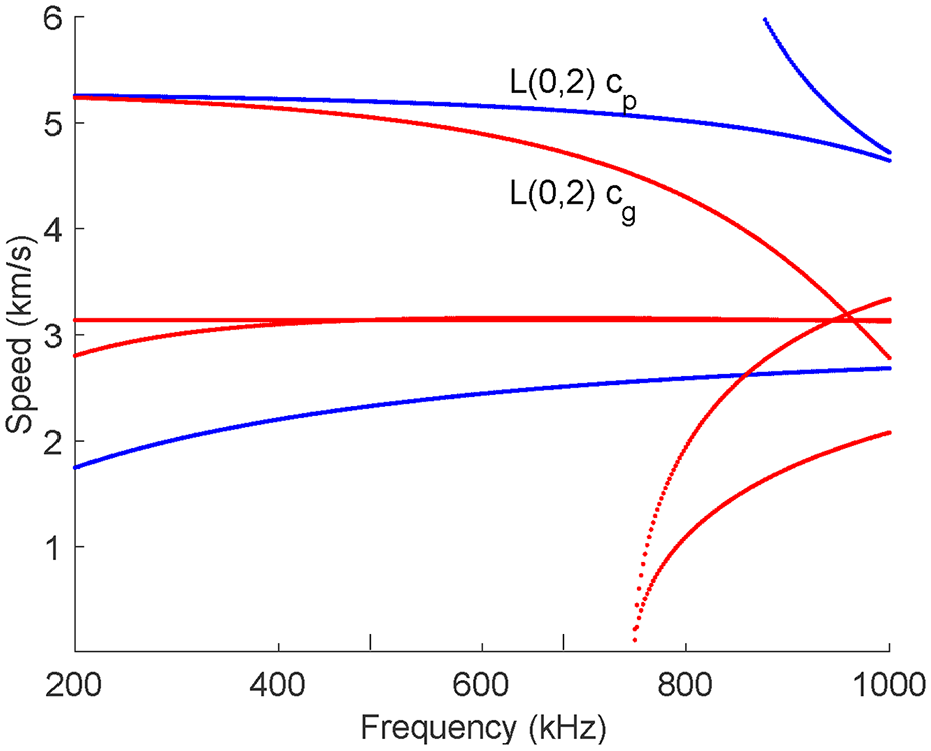
Phase velocity (blue) and group velocity (red) dispersion curves for the L(0, 2) mode in 2.1-mm-thick Alloy 600 tubing. Other wave modes are shown for reference but are not labeled.
Static salt capsule testing materials and methodology
Static salt-exposed capsule experiments were conducted to provide corroded alloy 600 tube samples for guided wave characterization to correlate wave speed changes with the depth of attack. Six capsules were isothermally tested, each with an immersed witness coupon tied to one endcap using Ni wire, as shown in Figure 1(b). Unlike typical salt/material compatibility experiments, a deep attack was desired so that the guided waves could detect it. Thus, mixtures of dried and undried salt were used to increase the depth of attack. Previously, however, 100% undried salt caused weld failures in the alloy 600 capsules, so mixtures of 25%–75% dried–undried salt were used. As described in the results, a deep corrosive attack of the capsule was not achieved. After ultrasonic testing, destructive metallography was conducted on capsule materials from two aggressive static salt tests to compare the depth of the attack on the immersed coupon and the tubing wall.
Corrosive attack procedure
Isothermal capsule testing was conducted using alloy 600 (Ni-15Cr-9Fe) capsules (25.4 mm outer diameter × 406 mm long × 2.1 mm wall) with small ∼6 × 12 × 1.5 mm coupons of alloy 600 inside (as shown in Figure 1(b)) that were polished to a 600-grit finish. Initial experiments were conducted on 76-mm- and 203 -mm-long capsules, which were otherwise identical to the 406-mm-long capsules, but their results are not presented herein. The final two capsule tests were conducted on 406-mm-long capsules with 75% undried salt. As noted above, metallography was later conducted on materials from these two salt tests. The details of these two tests are described here. The commercial 20.1% K-12.9% Mg-1.6% Na-65% Cl salt contained ∼5% H2O and was dried by heating in argon at 550°C. 30 Capsules were loaded with 150 g of salt (38 g of dried salt and 112 g of undried salt) and welded shut at both ends in an Ar-filled glove box with impurity levels ≤1 ppm O2 and H2O. The capsule was then welded inside a larger Type 304 stainless steel capsule as a secondary container in case the alloy 600 capsule leaked. One 406-mm-long capsule (#5) was exposed for 100 h at 700°C and the other (#6) at 800°C for 100 h in a box furnace in laboratory air. After 100 h, the capsules were inverted to allow the salt to drain away from the coupon and opened in the same glove box. The capsule endcaps were removed, and the capsule specimens were then cleaned after exposure using deionized water at 40°C, and mass change of the coupon was measured using a Mettler Toledo XP205 balance with an accuracy of ∼±0.04 mg. The coupons were then sectioned and mounted in epoxy and polished for characterization using light microscopy and scanning electron microscopy (SEM) equipped with energy dispersive spectroscopy (EDS) X-ray. The capsule specimens were then characterized nondestructively with guided waves at Penn State as described subsequently. Afterward, the capsule specimens were returned to ORNL for metallographic analysis. The capsule end filled with salt was determined based on the residue marks on the tubing. The depth of attack was measured using ImageJ software, and ∼30 measurements were made on each specimen.
Ultrasonic testing procedure
All capsules were from the same alloy 600 heat. Calipers were used to measure the outer diameter to be 25.425 ± 0.014 mm (mean and standard deviation for n = 22 measurements) at different points along the length of capsules #1 to #4. Likewise, the wall thickness was measured to be 2.133 ± 0.048 mm (n = 64) at points around the circumference of each end of pristine capsules #1 to #4. It is noteworthy that the standard deviation of the wall thickness is 3.4 times larger than that of the outer diameter. Capsules #1 to #4 and a third 406-mm-long capsule (#7) were guided wave tested prior to isostatic salt tests to provide a reference. No salt testing has been conducted on capsule #7. As described above, capsules #5 and #6 were exposed to corrosive salts. Preparation for guided wave testing involved machining the ends of the cleaned capsules flat and parallel, and then measuring the lengths.
Pulse-echo ring-down tests were conducted on the salt-exposed capsule specimens using L(0, 2) guided waves. A PZT disc was coupled to one end of the capsule to send and receive the guided waves, as shown in Figure 4. The piston-like motion of the PZT disc preferentially excites the L(0, 2) mode over the other two fundamental axisymmetric wave modes L(0, 1) and T(0, 1). The tests employed an end-loaded 30-mm diameter PZT disc with a resonant frequency of 500 kHz. The PZT disc was gel-coupled to the end of the capsule, and uniform force was applied by an elastic band. Ringing of the PZT disc was reduced by applying a duct seal on the back face. A 25-cycle Hanning windowed tone burst of 200 Vpp with a central frequency of 490 kHz was sent to the PZT disc by a RAM-5000 system (Ritec, Inc., Warwick, RI USA). The diplexer (Ritec RDX-6) prevented the voltage sent to the PZT disc from overloading the oscilloscope. The received A-scan signal was recorded after applying a high-pass filter of 0.1 MHz, a low-pass filter of 20 MHz, a gain of 50 dB, and averaging 256 consecutive signals.
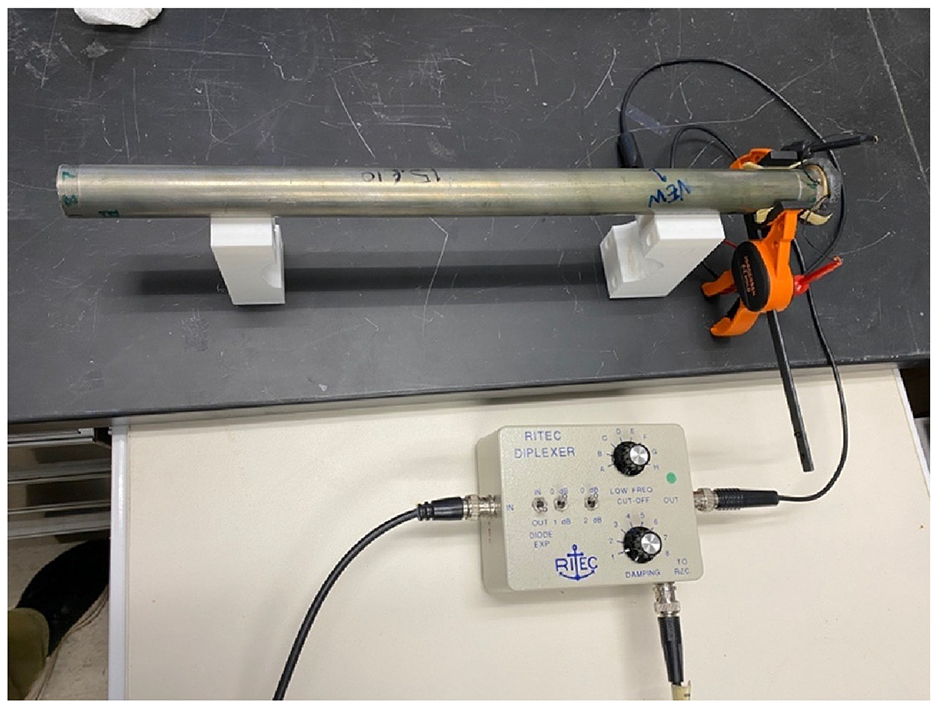
Guided wave test setup: end-loaded PZT disc on capsule and diplexer for pulse-echo measurements.
Metallography procedure
After the capsules were examined with guided wave ultrasound at Penn State, they were returned to ORNL for sectioning. Figure 5(a) shows the sectioning plan, and Figure 5(b) shows the ring specimens cut from the tubing for metallographic mounting. More specimens were cut from the 800°C capsule, where more attack was expected. Of particular interest was the amount of attack in the tubing that was above the level of salt in the capsule. The 150 g of salt is about the limit of what can be added in chunk form before the capsule is welded shut, but when the salt melts, it only fills a little over 50% of the capsule. Both light microscopy and SEM were used to view the material attacked by the molten salt.
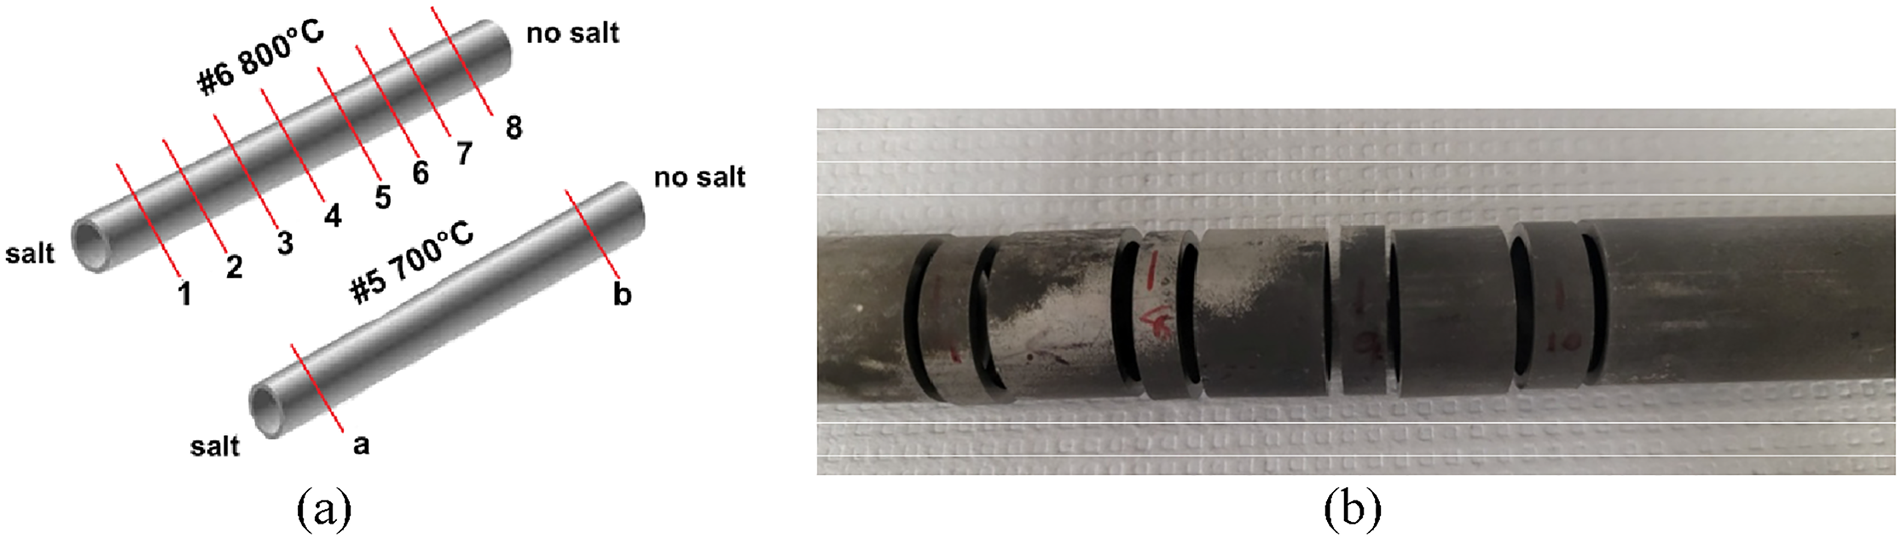
(a) Schematic of sections cut from alloy 600 capsules exposed at 700°C and 800°C and (b) example image of the rings cut from capsule #6.
Static salt capsule test results
Results from the guided wave ultrasound testing as well as the metallography conducted on materials from the static salt capsule testing are reported in this section.
Guided waves results
A representative received signal is shown in Figure 6 for a 490 kHz driving frequency. Based on the group velocity of 5053 m/s, the TOF for the 2L travel distance is ∼160 µs, where L is the length of the capsule tubing (∼406 mm). Six echoes are evident prior to 1000 µs. The presence of spurious wave packets is also evident. While the origin of these wave packets is unclear (possibilities include flexural wave modes and L(0, 1)), they are benign unless they interfere with the L(0, 2) wave mode of interest. Given that the L(0, 2) waveforms are well-defined, their peaks will be used to determine TOF, and from it the wave speed. The signal processing was automated in Matlab by using the function hilbert() to compute the analytic envelope and then the function findpeaks() to identify the peaks of the envelope corresponding to the L(0, 2) wave mode. Our algorithm was only semiautomated, as many peaks that did not correspond to the L(0, 2) peaks had to be manually removed. To determine the wave speed in the capsule, we divided the TOF difference between echo 4 and echo 1 by 6L. Results for the mean and standard deviation are tabulated in Table 1, which also provides the number of trial A-scans used for each wave speed computation.
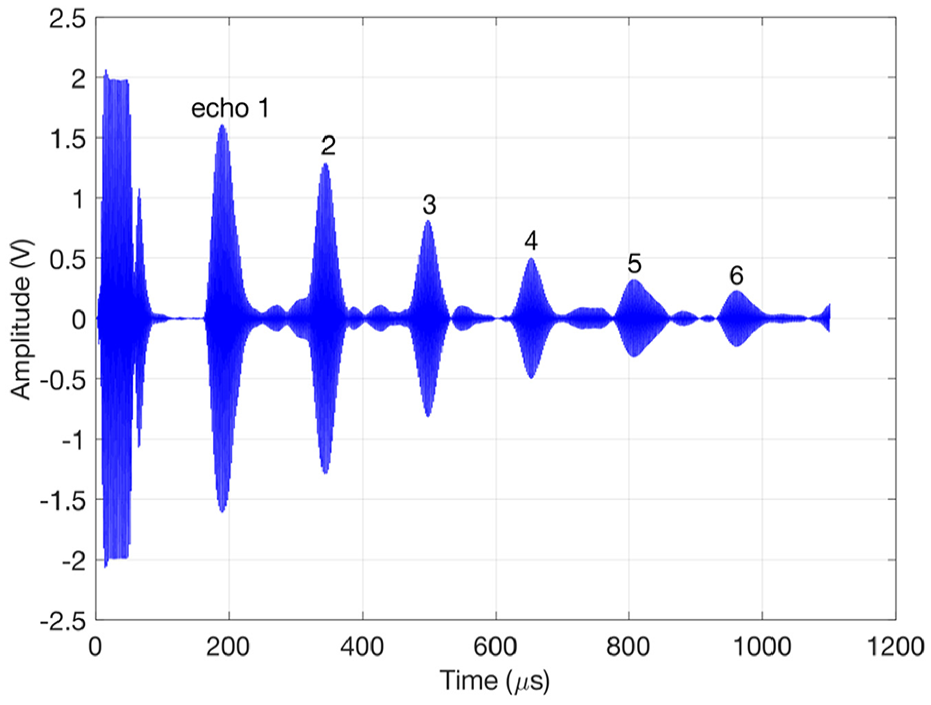
Ring-down of the representative received signal at 490 kHz driving frequency.
Wave speeds determined from capsules in pristine and exposed conditions.
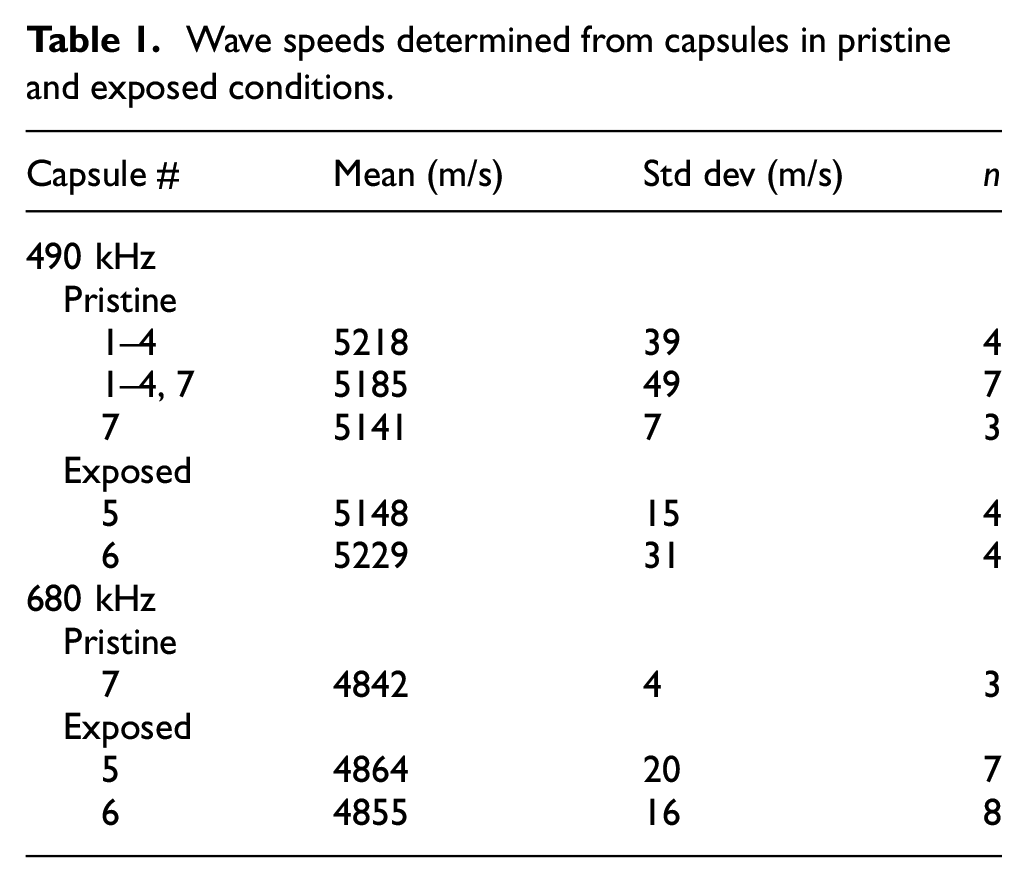
As mentioned earlier, all capsules were from the same alloy 600 heat. Therefore, the properties and wave speeds should be the same for each pristine capsule. Although the group velocity depends on wall thickness as well as material properties, the wall thickness standard deviation of 0.048 mm seems small enough to neglect. Capsules #1 to #4 were tested as a group, with only one test per capsule. Later, we tested capsule #7 thrice. The central driving frequency for each of these tests is 490 kHz. Thus, Table 1 provides wave speeds for pristine capsules as #1–#4, #1–#4 and #7, and #7. Based on the modeling to be described later, tests were also conducted on pristine capsule #7 at a central driving frequency of 680 kHz. A representative A-scan is shown in Figure 7. At 680 kHz, the group velocity is predicted to be 4722 m/s, giving a TOF for the first echo of ∼170 µs. It is worth noting that the predicted group velocities for the L(0, 2) waves are sensitive to the elastic properties, and handbook values were used, not measured properties.
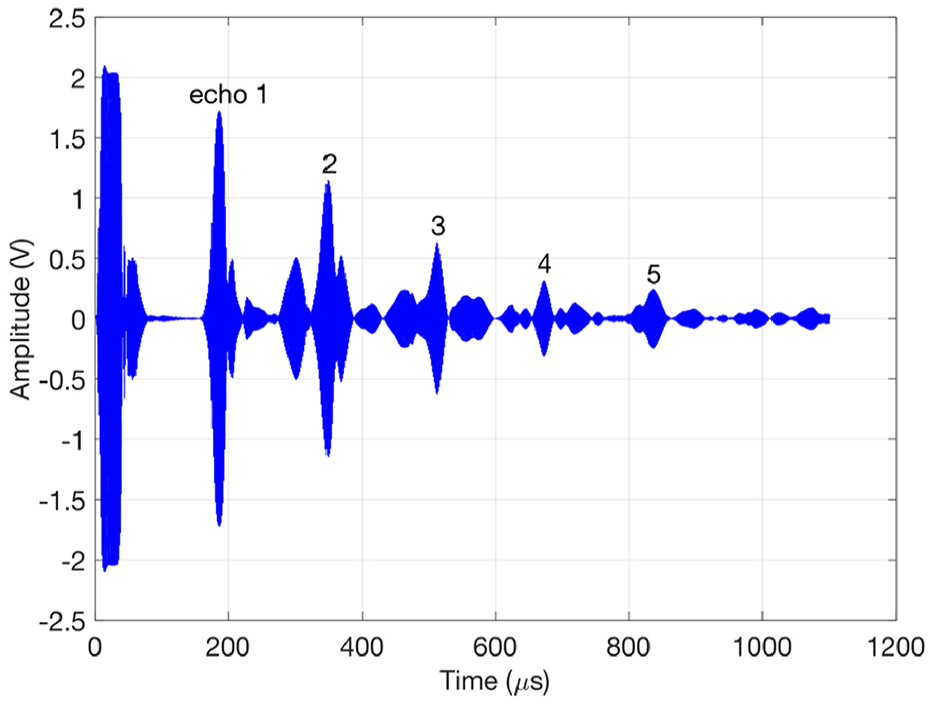
Ring-down of the representative received signal at 680 kHz driving frequency.
The witness coupons inside capsules #1–#4 exhibited only nominal attack, thus wave speed results are not provided for these capsules in the exposed condition. Changes in the salt and temperatures used for capsules #5 and #6 resulted in corrosive attack documented herein. Thus, wave speeds for central driving frequencies of 490 and 680 kHz are given in Table 1. Figure 8 compares the wave speeds for the pristine capsule #7 and the exposed capsules #5 and #6 separately for driving frequencies of 490 and 680 kHz. For 490 kHz, the wave speed results for the combined group of capsules #1–4 and #7 are used, and the average wave speed for each exposed capsule is within the standard deviation for the pristine capsules. However, for 680 kHz, the average wave speed for each exposed capsule is above the standard deviation for the pristine sample. These results will be interpreted based on the material degradation modeling described in the section “Material degradation model” and the significance tested in the section “Discussion.”
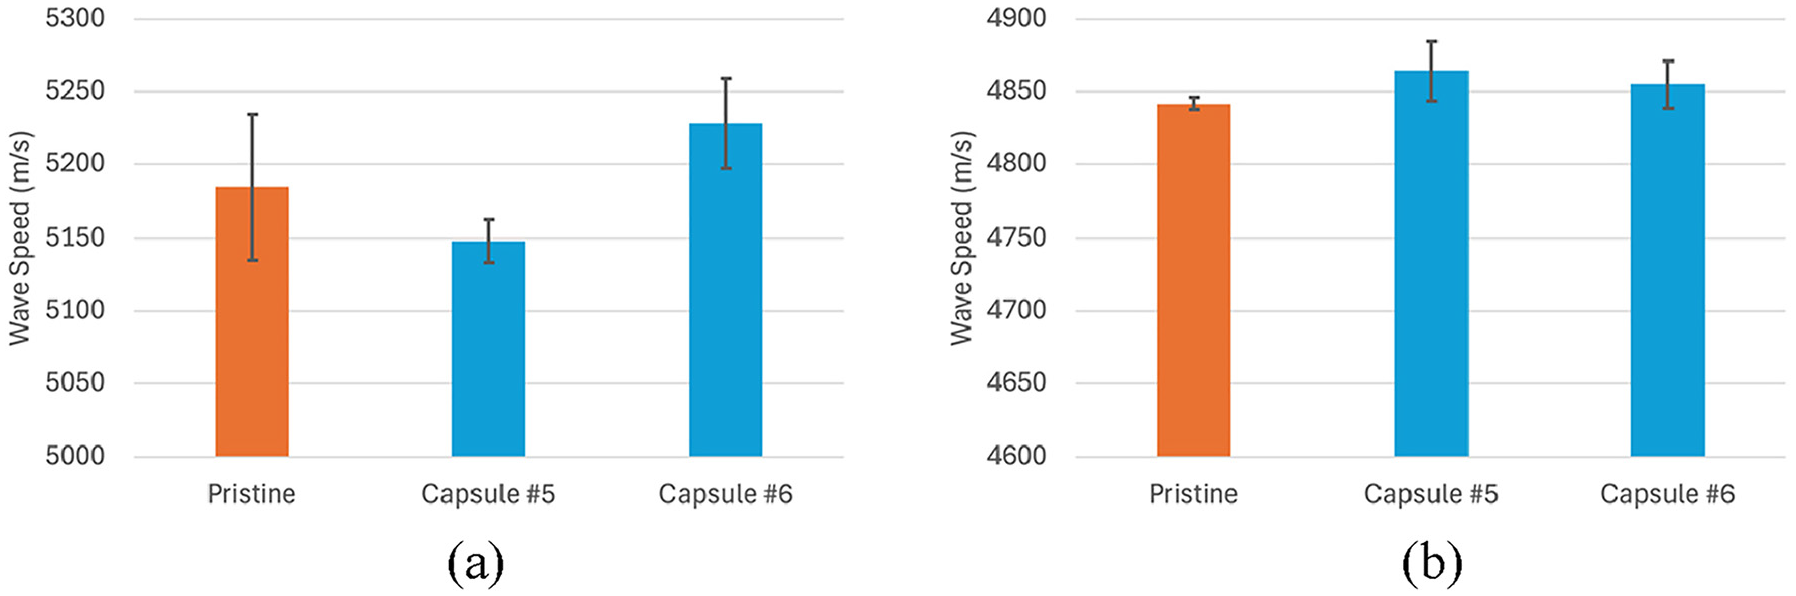
Comparison of wave speeds for pristine and exposed capsules (#5 and #6) for driving frequencies of (a) 490 kHz and(b) 680 kHz.
Metallography results
Figure 9 shows light microscopy images of polished cross-sections of the alloy 600 coupons exposed to a mixture of 25% dried and 75% undried chloride salt for 100 h at 700°C and 800°C (i.e., capsules #5 and #6, respectively). As is typical of structural alloys exposed to halide salts, the salts selectively dissolve Cr and Fe from the alloys, leaving behind a porous microstructure. The depth of attack for these coupons was 214 ± 45 µm and 266 ± 29 µm for coupons inside capsules #5 and #6, respectively, using ∼10 measurements from 3 imaged areas. Due to the high level of H2O and O2 impurities in the unpurified salt, an oxide layer formed on the surface of the coupons. For a similar coupon exposed at 800°C with 25% undried salt, Figure 10 shows that the external oxide layer primarily contained Cr and Mg. A small amount of Ti (0.2% in alloy, map not shown in Figure 10) was also detected in the oxide. Figure 10(f) also indicates that some of the pores in the underlying alloy contain oxygen, likely from retained salt and polishing debris. The combined effect of oxide formation and trapped salt (mass gain) and dissolution (mass loss) resulted in mass change data for the coupon specimen that was not a good predictor of the depth of attack. For the 700°C specimen, the mass loss was 0.6 mg/cm2, and for 800°C it was 18.1 mg/cm2.
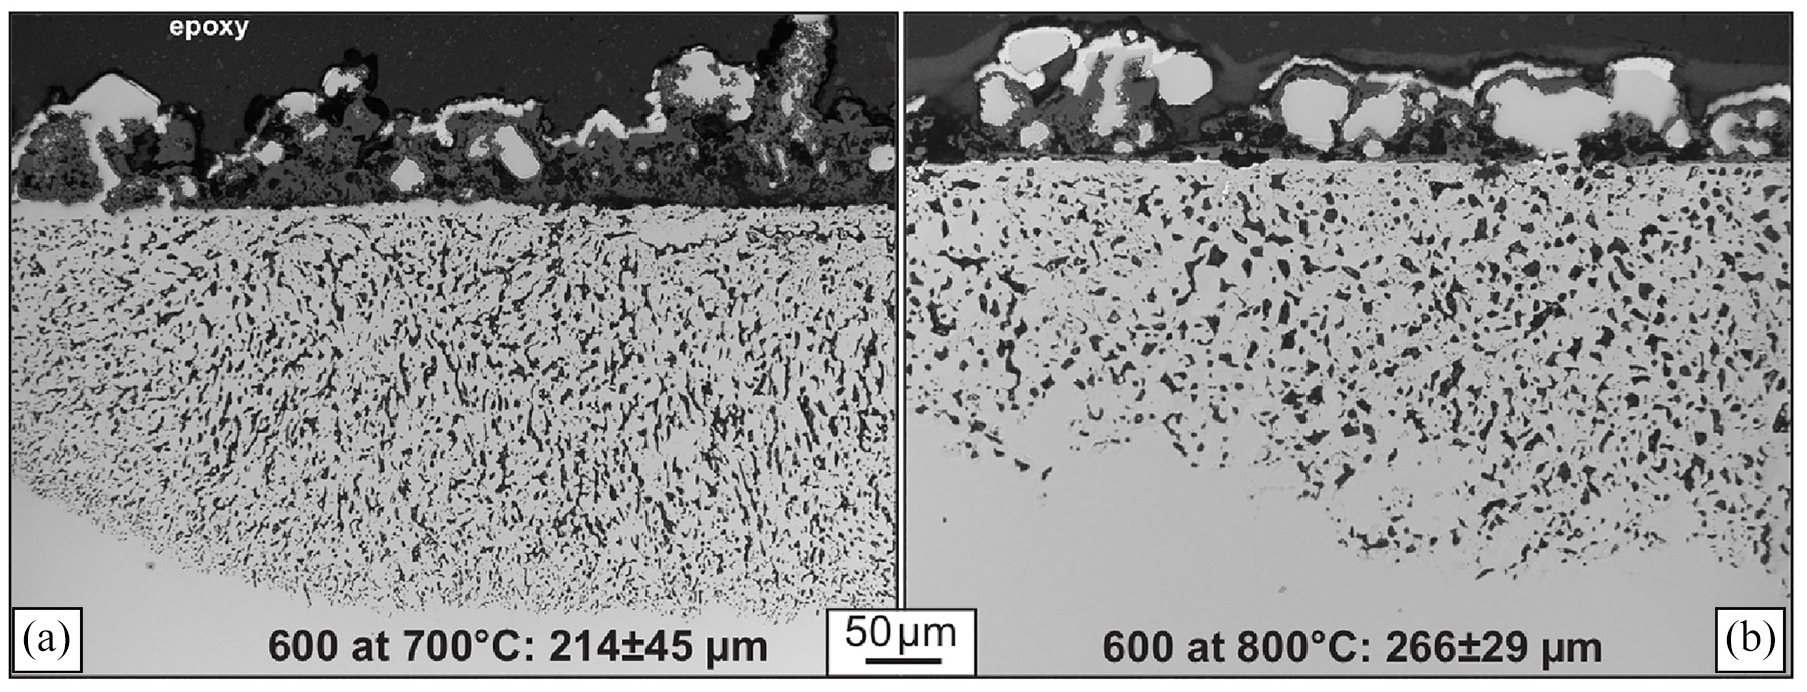
Light microscopy of alloy 600 coupons exposed to 25% dried and 75% undried KCl-MgCl2-NaCl salt for 100 h at(a) 700°C and (b) 800°C.
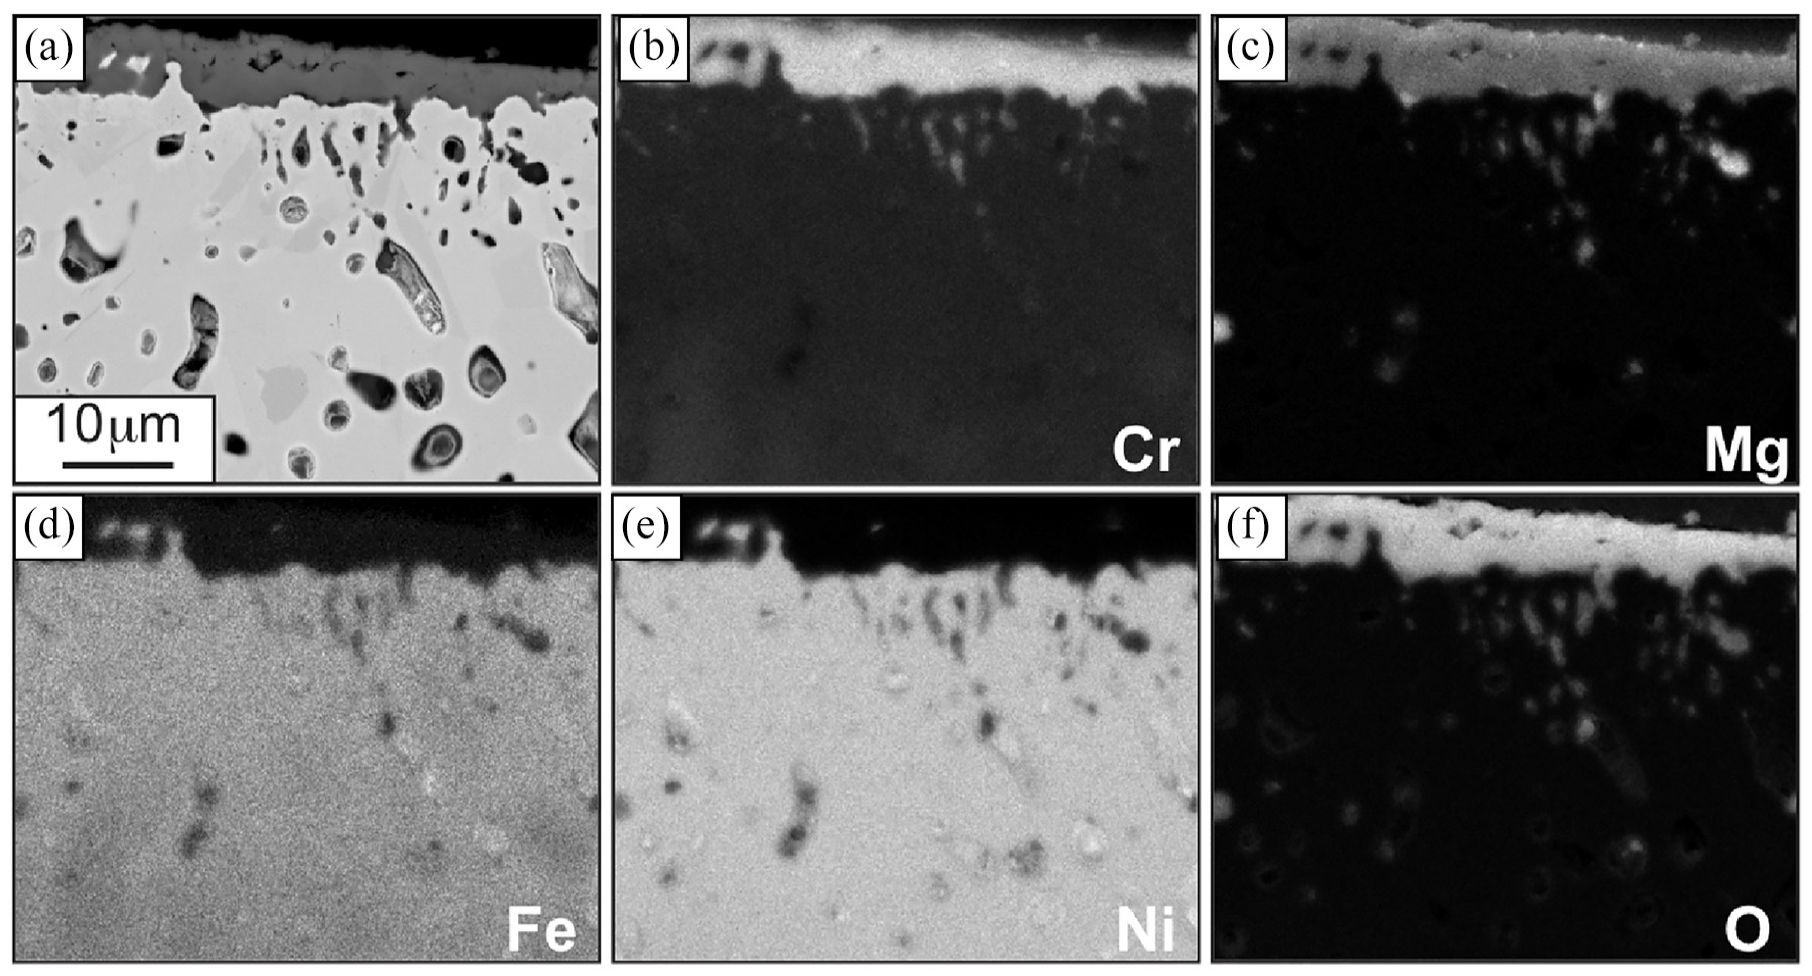
(a) Scanning electron microscope (SEM) secondary electron image of the near surface area of the alloy 600 coupon exposed at 800°C and (b–f) associated energy dispersive spectroscopy (EDS) maps.
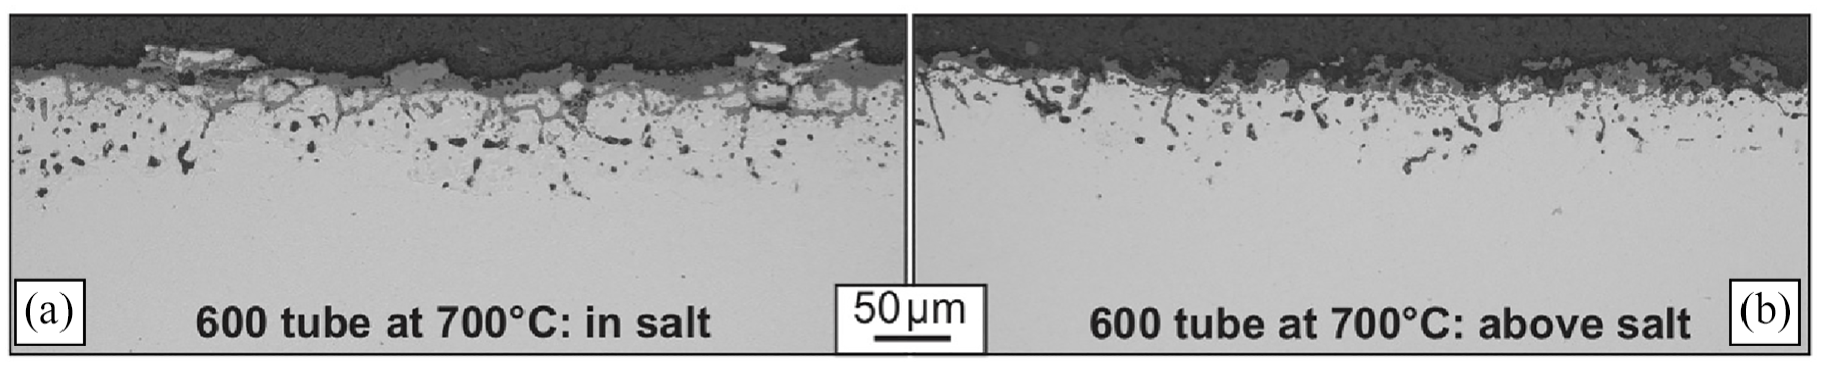
Figure 11 shows the representative images from the two rings cut from capsule #5. The depth of attack was more significant for the ring cut that was exposed to the salt for 100 h compared to the ring from the top of the capsule that was not exposed to salt. However, compared to Figure 9(a), the depth of attack was much less for the coupon. The measured values for the depth of attack and oxide thickness are shown in Figure 12(a) for both sections. Note that porosity within the depth of the attacked material has not been characterized from the micrographs.
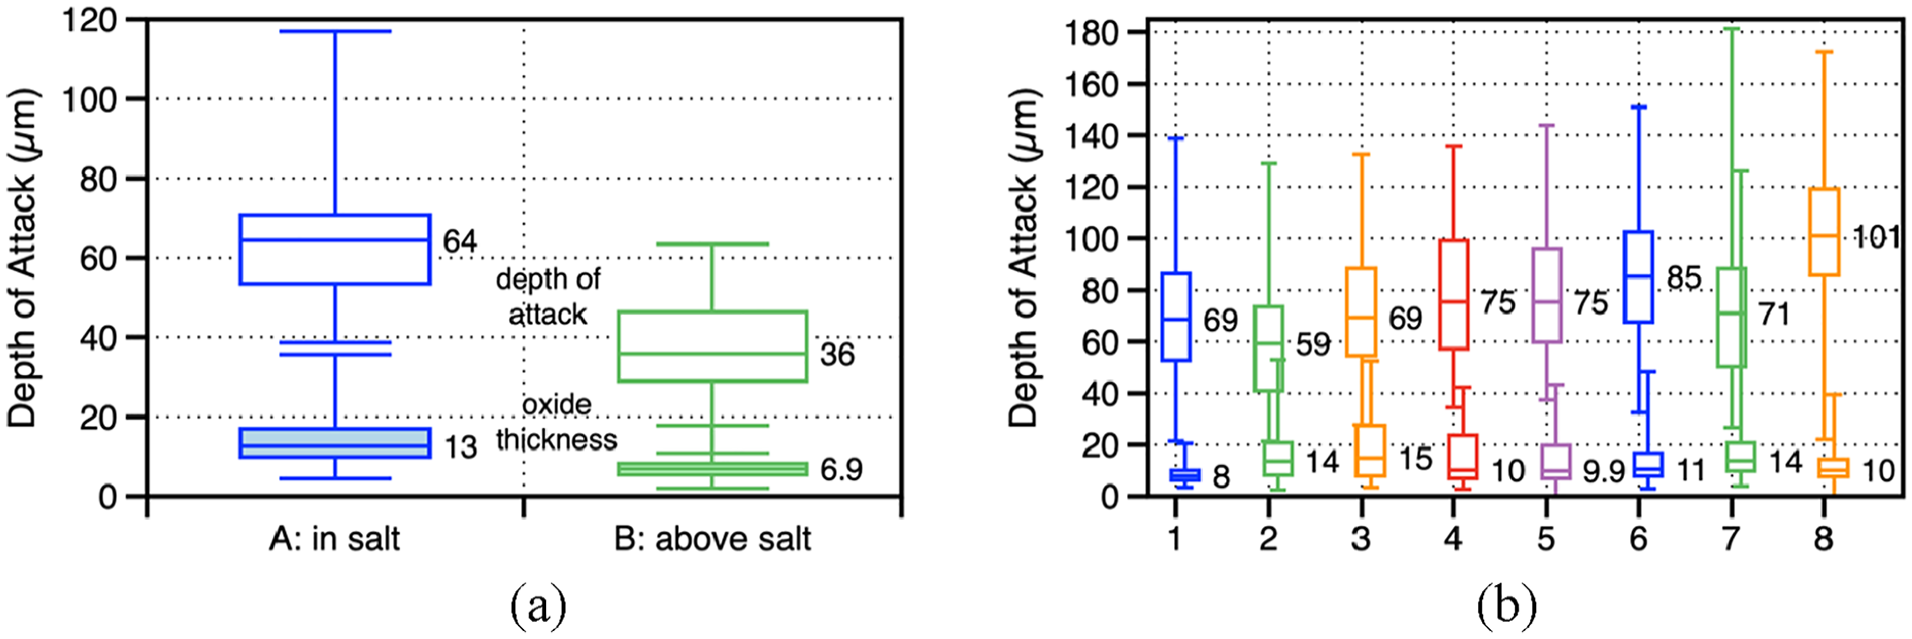
Box and whisker plots of measured depth of attack and oxide thickness from capsule walls after exposure to salt for 100 h at (a) 700°C and (b) 800°C. The boxes show the 25 and 75% values of ~30 measurements. The whiskers show the minimum and maximum values, and the median value is labeled.
Figure 13 shows the representative images for the 8 sections cut from capsule #6, shown in Figure 5(a). The measured depth of attack shown in Figure 12(b) was somewhat higher than that observed in the 700°C capsule but was considerably lower than the depth measured in the alloy 600 coupon in Figure 9(b). Also, the depth of attack was not significantly different at the top and bottom of the capsule #6. This may be due to the higher vapor pressure at 800°C. However, prior capsule studies did not compare the amount of capsule wall attack above and below the salt level to compare to these results. The depth was quantified here, but there may be differences in porosity between the top and bottom of the capsule as observed in Figure 13. This difference is more difficult to capture by image analysis and has not been performed yet.
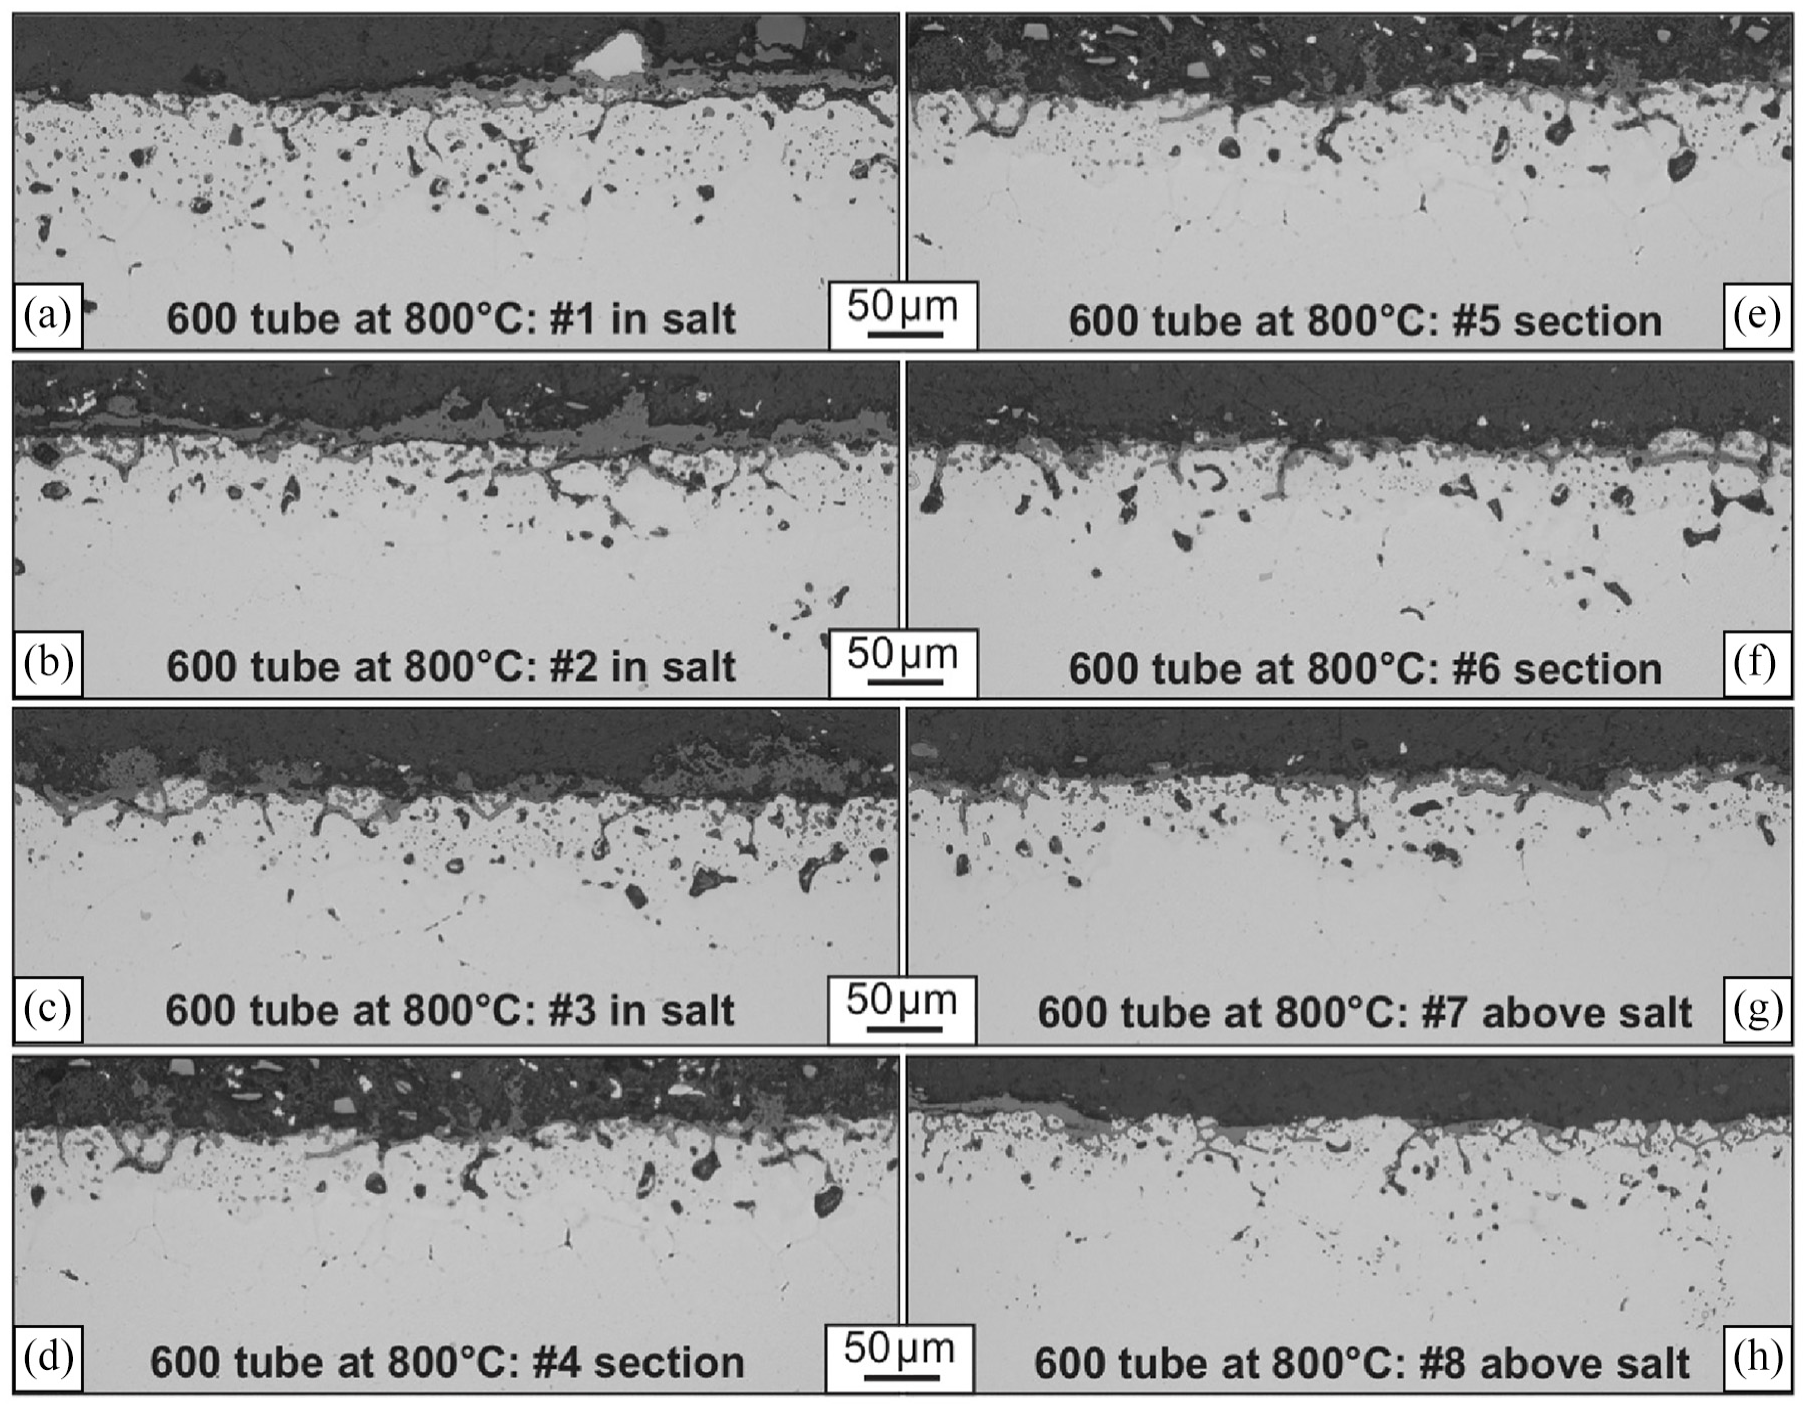
Light microscopy of alloy 600 capsule #6 wall exposed to 25% dried and 75% undried KCl-MgCl2-NaCl salt for 100 h at 800°C (a–h) 8 sections through wall, shown in Figure 5(a).
The difference between the coupon attack and the capsule wall attack is somewhat surprising. Two different heats of alloy 600 were used for the capsules and coupons, but that should not produce such a major difference as is observed here. The other variable is surface finish. The oxide present on the inner diameter of the tubing may have inhibited dissolution (less attack) compared to the polished surface of the coupon.
Material degradation model
Material degradation occurs due to the corrosive attack from the molten salt and was shown to consist of the development of porosity due to the selective dissolution of Cr and Fe, as shown in Figures 9, 11, and 13. We presume that the porosity may link up, leading to spallation and eventual loss of wall thickness. Two simplified models of degradation are applied here. In the first model, the wall thickness is subdivided into a porous layer and a fully dense layer. The porous layer thickness t and porosity p are the key parameters. The second model is simply wall thinning, that is, the degradation decreases the wall thickness from d to (d−t) without changing the properties. Other models are conceivable that consider both porosity and wall thinning, but require either more assumptions or more information about the degradation process.
In the first model, the tubing is comprised of an inner degraded layer and an outer fully dense layer. The usual relations for bulk wave speeds apply:
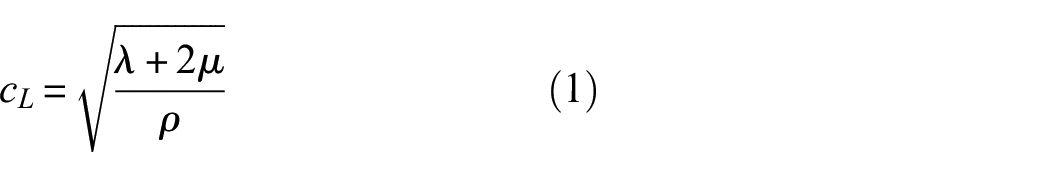
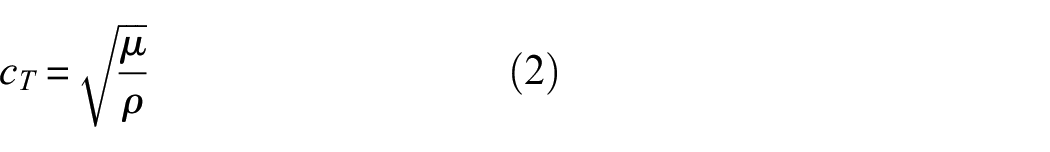
where
A simple micromechanical model is used to predict the effect of porosity on the linear elastic constants and mass density, from which
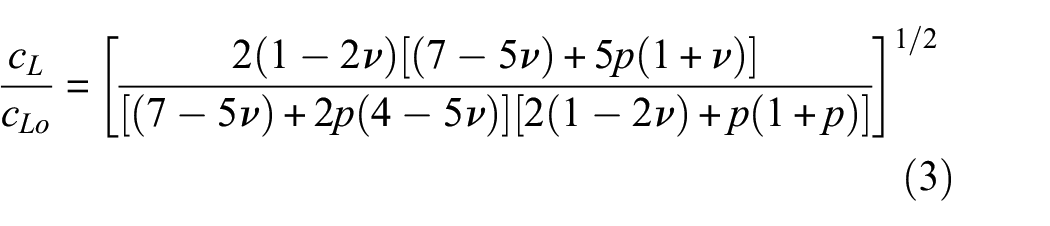
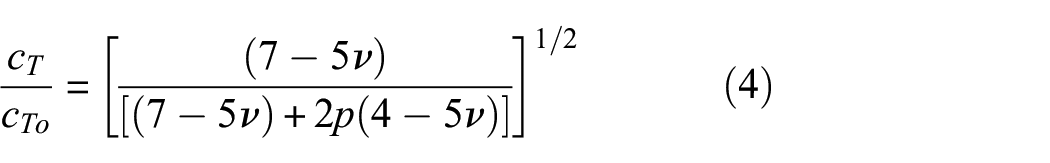
where

The dispersion curves for axisymmetric wave modes in a two-layer pipe are computed from the bulk wave speeds in the two layers and their radii as in Rose. 33 Once the phase velocity is a known function of frequency for a wave mode, the group velocity (or speed) can be computed from Rose 33 :
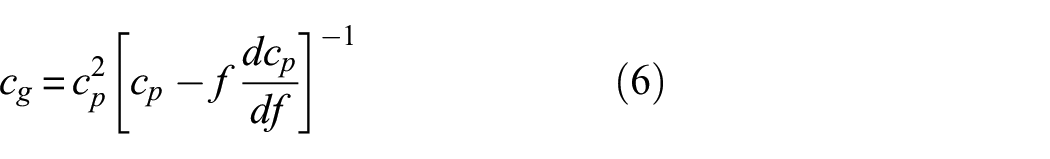
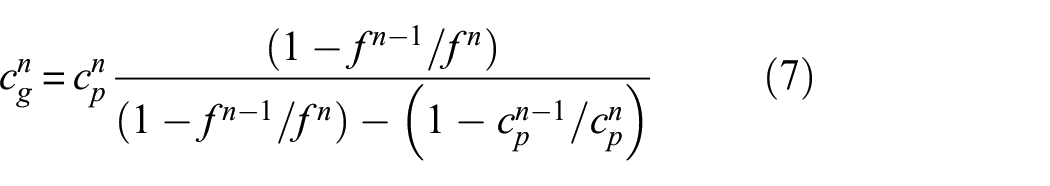
where the second equation is for increment
First, we analyze the change in the L(0, 2) mode group velocity dispersion curve, presuming that material is lost. Although this condition actually occurs after the material is first degraded, it is a simpler analysis with straightforward results. The only variable in this analysis is the wall thickness, which changes incrementally from 2.1 to 1.1 mm as we consider wall thickness loss of t = 0, 20, 50, 75, 100, 200, 500, 750, and 1000 µm. Although not done here, dispersion curves are often plotted as a function of the frequency-thickness product, which indicates that the wave speeds are directly related to thickness. There is a monotonic increase in the L(0, 2) group velocity at each frequency as the material loss increases. We are especially concerned with frequencies of 490 and 680 kHz, which are marked by dashed lines in Figure 14. The change in group velocity increases with frequency. Thus, it is larger at 680 kHz than at 490 kHz. The insert in Figure 14 emphasizes material loss up to 100 µm for frequencies of 400–800 kHz. The change in group velocity is plotted as a function of material loss in Figure 15 for both 490 and 680 kHz. For a material loss of 100 µm, the group velocity increases by 0.49% and 1.65% for 490 and 680 kHz, respectively.
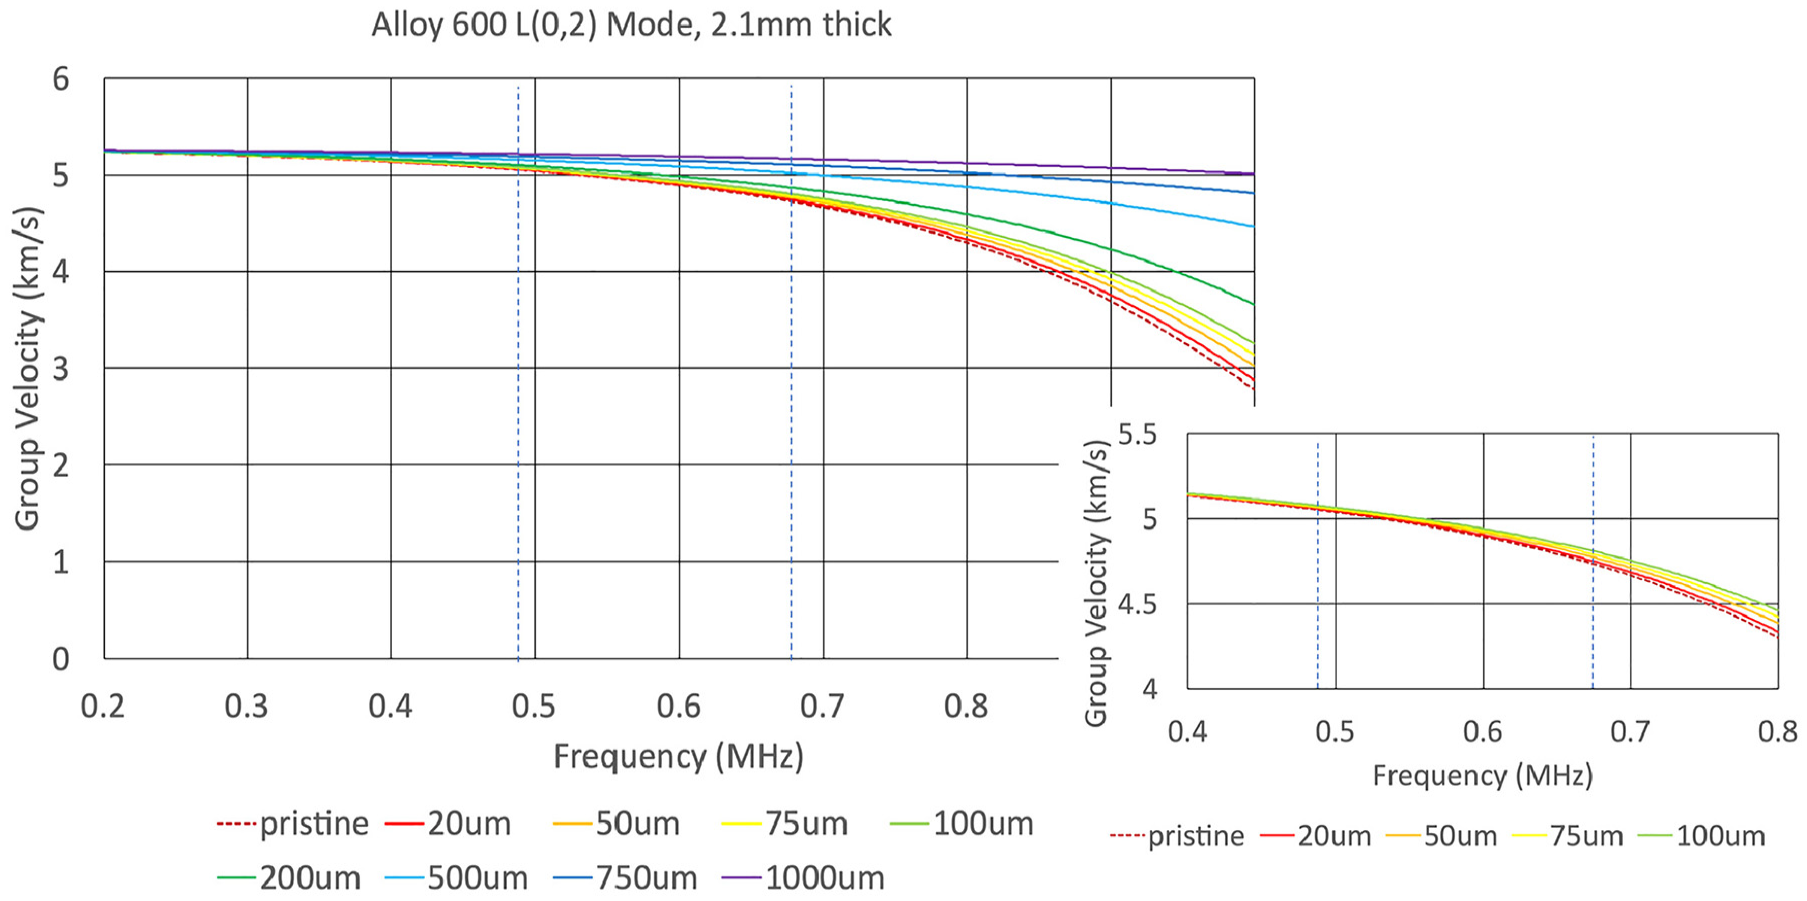
Mode L(0, 2) group velocity dispersion curves for tubing as material on the inner diameter is lost due to corrosive attack. Thickness of material lost ranges from 20 to 1000 µm.
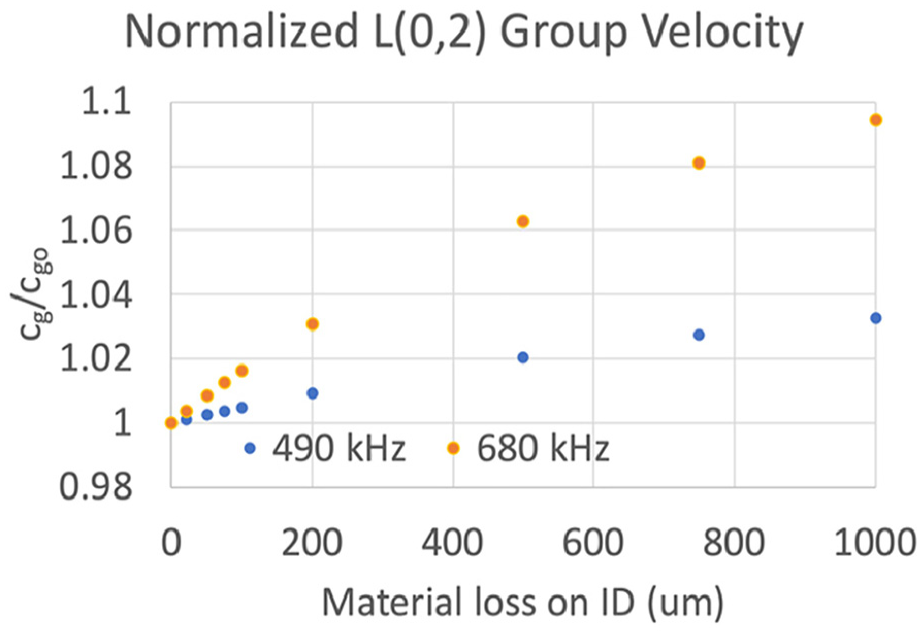
Normalized mode L(0, 2) group velocity increases as material on the tubing inner diameter (ID) is lost to corrosive attack for 490 and 680 kHz.
The group velocity for the L(0, 2) wave mode is plotted for pristine tubing and degraded layers of increasing thickness from 20 to 1000 µm as shown in Figure 16. Vertical dashed lines are overlaid at frequencies of 490 and 680 kHz. The group velocity for pristine tubing is distinguished by a dashed line. For frequencies below approximately 500 kHz, the degradation reduces the group velocity, which is opposite to the result for material loss. Above 500 kHz, the group velocity increases relative to the pristine condition until the thickness of the degraded layer becomes substantial, that is, 750 µm or more. The insert in Figure 16 emphasizes material degradation up to 100 µm for frequencies of 400–800 kHz, which is very roughly the range used in the experiments. Figure 17 provides perhaps a more informative look at the results by showing the normalized group velocity changes. For degradation up to approximately 200 µm thick, the change in group velocity appears to be linear, decreasing for 490 kHz but increasing for 680 kHz. The opposite changes in group velocity at these two frequencies could be a useful feature for monitoring a thin layer of material degradation in the tubing.
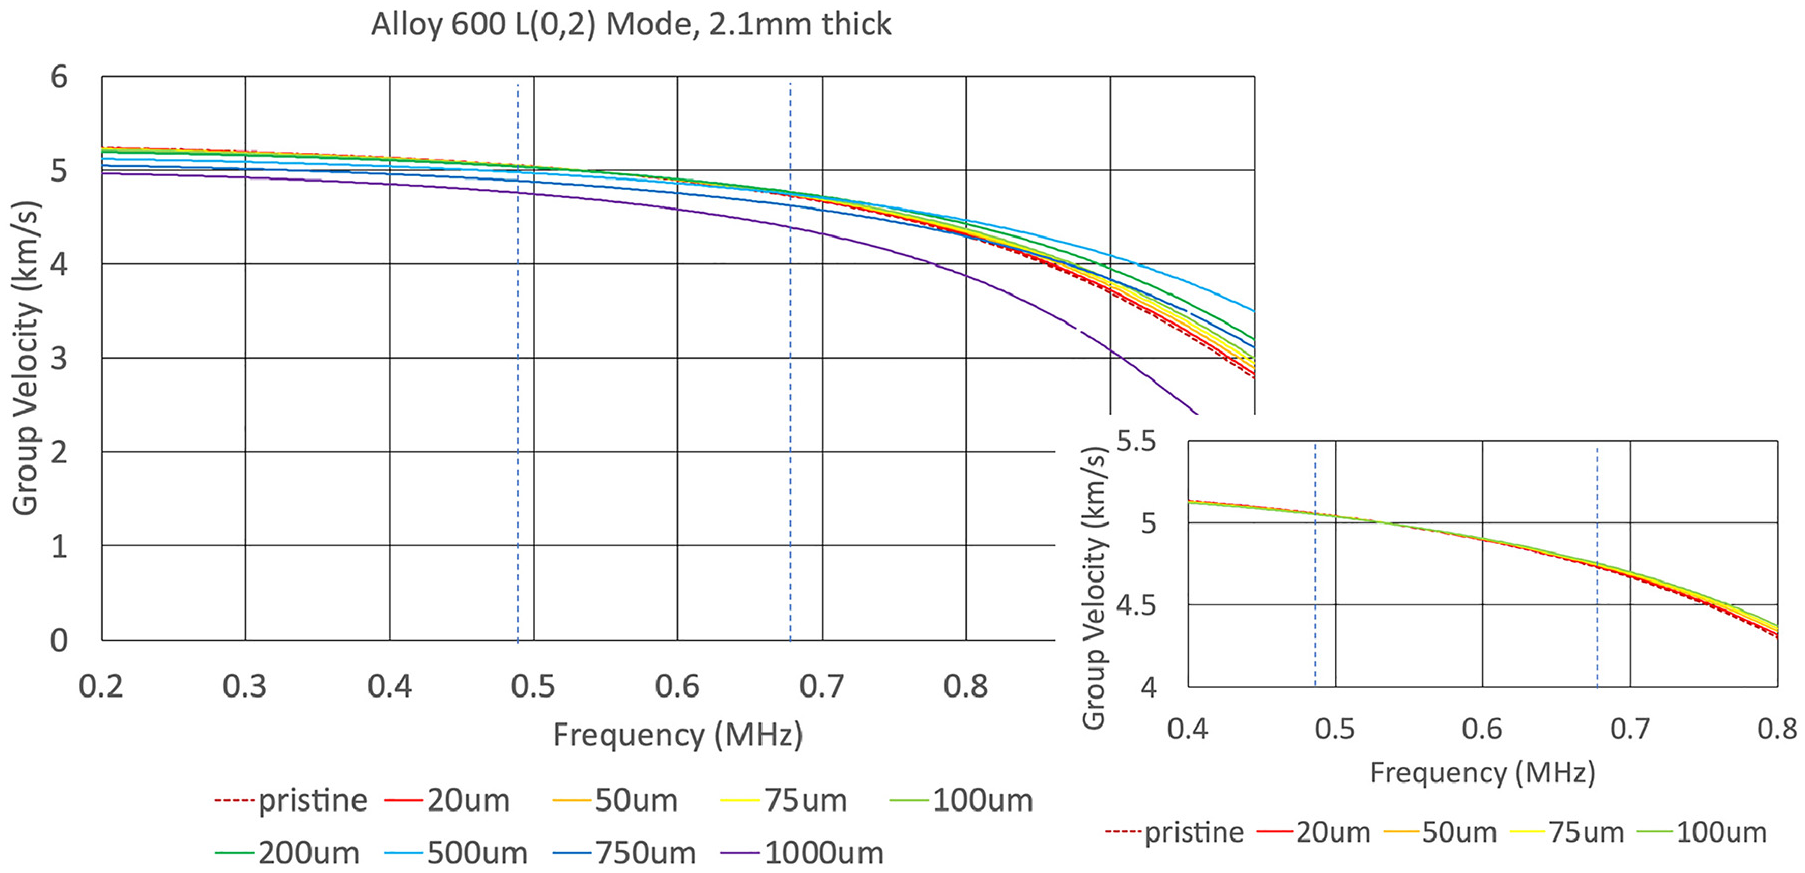
Mode L(0, 2) group velocity dispersion curves for TCL tubing as the material on the inner diameter is degraded due to corrosive attack. Thickness of the degraded material ranges from 20 to 1000 µm.
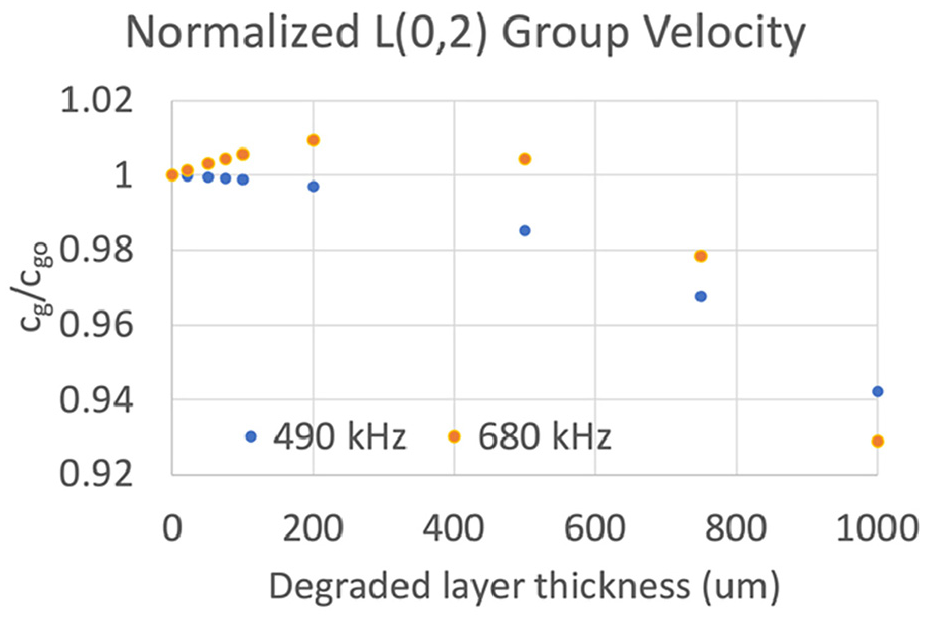
Normalized mode L(0, 2) group velocity changes differently for frequencies of 490 and 680 kHz as material degrades at the inner diameter.
Discussion
Modeling material degradation in tubing as a porous layer up to 200 µm thick on the inner diameter resulted in wave speed increase at 680 kHz and minimal wave speed decrease at 490 kHz for the L(0, 2) wave mode, see Figure 17. If the material on the inner diameter is removed rather than degraded, then the wave speed at 680 kHz increases more than the wave speed at 490 kHz, as shown in Figure 15. Thus, the 680 kHz frequency is expected to provide better sensitivity to the corrosive attack of molten salt. Microscopy indicated the depth of attack to be in the 50–100 µm range (Figure 13). The model predicts changes in wave speeds of −0.1% and +0.5% for 490 and 680 kHz, respectively. As Table 1 shows, our measurements have standard deviations ranging from 0.08% to 0.9%. Thus, the sensitivity to depth of corrosive attack of less than 100 µm is marginal. The student’s t-test can be applied to assess whether the changes in wave speed are statistically significant. Based on the model results, we assess whether the wave speed increase for 680 kHz is significant and whether the wave speed decrease for 490 kHz is significant. The results for 490 kHz (see Figure 8(a)) are found to be not significant (p = 0.054 for capsule 5 and p = 0.052 for capsule 6, both are slightly greater than the significance level α = 0.05). To the contrary, the results for 680 kHz (see Figure 8(b)) are significant (p = 0.013 for capsule 5 and p = 0.032 for capsule 6, both are less than the significance level α = 0.05). Furthermore, it is worth noting that the use of permanent sensors means that the same measurement is being made over and over, which could improve sensitivity. On the other hand, the harsh operating conditions, especially if they are variable, could decrease the sensitivity. Online experiments are needed to address this critical issue.
The applicability of these results to operations at high temperature (800°C) when molten salt is inside the pipe was assessed by selecting the appropriate material properties and repeating the preceding analysis. The L(0, 2) group velocity at 490 kHz changed from 4302 to 4308 to 4042 m/s as the degraded layer thickness increased from 0 to 200 µm to 1000 µm. While the L(0, 2) group velocity at 680 kHz changed from 3694 to 3822 to 3383 m/s as the degraded layer thickness increased from 0 to 200 µm to 1000 µm. These trends are consistent with the room temperature results. Moreover, the group velocity increase of 3.5% at 680 kHz for a 200 µm degraded layer is larger than at room temperature (0.5%).
The dissolution in the static capsule experiments was not as deep as expected, and deeper material degradation could not be obtained to confirm the model predictions, as shown in Figure 17, despite attempting longer experiments or changing the temperature. This points to the solubility of Cr and Fe in the Cl salt as a limiting factor for the amount of attack possible. 34 Increasing impurities may have increased the attack, but prior work with longer exposures did not increase the depth of attack. When the salt becomes saturated with reaction products, no further reaction is expected. Saturation is less likely to occur in flowing salt. The observed difference between the witness coupon inside the capsule and the capsule wall was not expected. However, the polished surface on the coupon may be attacked more readily than the mill finish on the tube inner diameter. The inner diameter of the alloy 600 capsule was not polished or machined and likely had a thin oxide on the surface formed during processing of the tubing. This oxide layer may have inhibited dissolution compared to the polished coupon. Machining the inner diameter may have increased the amount of attack.
Summary and conclusions
The practical question of how much material degradation from corrosive attack must occur to be detectable based on changes in guided wave speeds is addressed herein. Offline molten static salt tests conducted on capsules of alloy 600 tubing provided samples for assessing the capability of ultrasonic guided waves to quantify material degradation from corrosive salt attack on the inside of the tubing. The L(0, 2) guided wave mode was actuated and received by an end-loaded piezoelectric disc. Analysis of the dispersive nature of the L(0, 2) mode indicates that the driving frequencies of 490 and 680 kHz give wave speeds that decrease and increase, respectively, for limited amounts of material degradation. Assuming that the corrosive attack results in a porosity of 0.40, for the depth of attack up to 200 µm, the group velocity of the L(0, 2) wave mode changes −0.1 and +0.5% for 490 and 680 kHz, respectively (see Figure 17). The fact that one wave speed increases while the other decreases can improve the reliability of the results. The wave speeds measured on static salt capsules agree with the modeling in that at 680 kHz the wave speed increase is statistically significant, while at 490 kHz the wave speed change is not statistically significant (see Figure 8). An unexpected result revealed by the metallography is that immersed “witness” coupons exhibited significantly more corrosive attack than the inside of the tubing wall. These results provide a sound foundation for online guided wave testing of an SHM system for a molten salt TCL. Ultimately, the SHM system can be extended to maintain safety in molten salt reactors having very limited planned outages based on monitoring the L(0, 2) guided wave speed.
Footnotes
Declaration of conflicting interests
The author(s) declared no potential conflicts of interest with respect to the research, authorship, and/or publication of this article.
Funding
The author(s) disclosed receipt of the following financial support for the research, authorship, and/or publication of this article: Funded by DoE SBIR grant DE-SC0019653.