
Abstract
Wheelset bearing is a typical vulnerable structural component in high-speed trains and heavy haul vehicles. In addition to the typical nonlinear and nonstationary characteristics, the vibration signal of wheelset bearing also contains track subgrade vibration and transmission path coupling interference components. To solve this problem, this paper proposes a new feature extraction method for wheelset bearing faults. This method constructs the Teager energy spectrum correlation kurtosis, which is purposely sensitive to periodic fault impulse components, as the objective function. The Q-factor and redundancy of tunable Q-factor wavelet transform are selected by using the parameter convex optimization method, which makes the signal decomposition have better sparsity, so as to extract fault information accurately. Simulated analysis, experimental signal analysis of QPZZ-II test-bed, and experimental signal analysis of wheelset bearing test-bed show that the proposed method can suppress the influence of nonperiodic transient impulse components, harmonic components, and noise components in the signal and accurately extract the periodic impact characteristics of bearings.
Keywords
Introduction
Wheelset bearings are widely used in railway trains, subways, and heavy loaded vehicles with large equipment, and their operation status is related to the safety of vehicle operation. Under heavy load operation, especially under uneven heavy load conditions, it is very easy to cause wheelset bearing damage. When the vehicle runs under wheelset bearing damage, it is easy to introduce subgrade vibration, which will further damage the mechanical structure of the vehicle, and in serious cases, it will lead to seizure or even overturning. Therefore, it is of great significance to adopt necessary analysis means to enable the wheelset bearing to realize monitoring and diagnosis during vehicle operation.1–5
Vibration signal is an effective medium to analyze the running state of rotating machinery equipment, especially bearings. Many scholars have carried out a lot of research work on the nonstationary and nonlinear characteristics of bearing vibration signals and fault feature extraction methods.6–10 In order to effectively suppress noise and signal modulation and accurately identify wheelset bearing fault impact, Li et al. 11 proposed a method using morphological signal and image-processing technology. This method mainly includes two aspects: a new double cross-correlation algorithm for noise reduction and an improved image-processing algorithm for highlighting fault features. Traditional boundary determination methods cannot evaluate the capacity of fault information contained in the decomposition frequency band. To solve this problem, Zhang et al. 12 proposed an adaptive boundary determination method based on time delayed kurtosis (TDK), which uses the boundary determined by TDK to construct Meyer wavelet to extract fault-related resonance bands, and the proposed method was applied to wheelset bearing fault diagnosis. The parameter dictionary obtained by the classical correlation-filtering algorithm is difficult to match the potential fault influence characteristics of the wheelset bearing vibration signal. To solve this problem, Deng et al. 13 proposed a fault impact-matching algorithm (FIMA) combined with orthogonal match pursuit. The core of FIMA mainly includes two stages: partial segmentation and global analysis. The correlation function and kurtosis are used to comprehensively evaluate the local and global matching degree of Laplace wavelet and signal. In view of the problem that traditional sparse representation is difficult to ideally extract fault features when the signal contains strong interference components, Xing et al. 14 proposed a new method of fault feature extraction for wheel bearing based on wavelet sparse representation and adaptive local iterative filtering. The adaptive local iterative filtering of this method effectively reduces the influence of interference components and is helpful to extract sparse pulses. Wavelet sparse representation uses the global optimal solution of L1 regular optimization in sparse coding to extract the inherent features of faults in the wavelet domain. Based on the developed autocorrelation kurtosis and the proposed spectral segmentation method, Zhang et al. 15 proposed a new wheel bearing fault detection method called adaptive autocorrelation kurtosis. The autocorrelation kurtosis of this method aims to reduce the interference of irrelevant components and improve the signal-to-noise ratio. In view of the poor adaptability of time-frequency analysis method under multiple working conditions, Wei et al. 16 proposed a bearing fault detection method combining empirical mode decomposition and adaptive time-varying parameter short-time Fourier synchronous compression transform, which solved the problem of signal adaptation under multiple working conditions. Aiming at the influence of complex transmission path and strong background noise on the vibration signal of early fault of rolling bearing, Xiong et al. 17 proposed a diagnosis method of parameter adaptive multipoint optimal minimum entropy deconvolution adjustment combined with dynamic mode decomposition. The analysis of analog signals, public database signals, and fan bearing signals shows that the proposed method can successfully extract the early fault features of rolling bearings. To solve the problem of regularization parameter selection of sparse denoising algorithm, Sun et al. 18 proposed an adaptive regularization parameter selection strategy, which directly measures the importance of fault features in sparse denoising signals. The minimum angle regression algorithm with high computational efficiency is used to obtain the entire solution path, and the feature probability index is designed to measure the importance of fault features in the reconstructed signal envelope demodulation spectrum. This method is not limited by the noise probability distribution. In order to solve the problem that the system parameters need to be matched in real time when stochastic resonance (SR) processes nonstationary signals, Wang et al. 19 studied the adaptive frequency shift SR of tristable nonlinear systems. The variation of potential well depth, bifurcation phenomenon, and steady state switching process caused by system parameters are studied in order to control system parameters and determine steady state conditions. Moreover, SR is applied to fault diagnosis of rolling bearings under variable speed conditions and strong noise background, and weak fault features are effectively extracted. In order to effectively analyze the fault signals of nonlinear and nonstationary rolling bearings, Li et al. 20 studied derivative and enhanced discrete analysis wavelet algorithms for rolling bearing fault detection. The morphological spectrum of fault signal is obtained through multi-scale morphological open operation. Yazdanianasr et al. 21 constructed an improved envelope spectrum via feature optimization-gram (IESFOgram) method, which can accurately diagnose the wear bearing running at low speed. Amin et al. 22 present a machine-learning framework for early damage detection in gearboxes based on the cyclostationary and Kurtogram analysis of sensor data. Li et al. 23 proposed a fault diagnosis method based on weighted variational mode decomposition (VMD) and cyclic spectrum slice energy (CSSE). The signal is decomposed into intrinsic mode functions (IMFs) through VMD, and the amount of information contained in each IMF is measured using sparsity. Then, the reconstructed signal is analyzed using the advantage that CSSE can accurately mediate fault information. Feng et al. 24 provides a vibration-based wear mechanism identification procedure, and then the wear evolution is tracked using an indicator of vibration cyclostationarity. Ni et al. 25 proposed a fault information guided VMD (FIVMD) method to extract the weak bearing repetitive transient for the problem of parameter selection of VMD. Two nested statistical models based on fault cyclic information are used to approximate the number of modes in combination with the statistical threshold of a specific significance level. Then ratio of fault characteristic amplitude is defined and used to identify the optimal bandwidth control parameters, so as to extract the maximum fault information.
In addition to nonlinear and nonstationary characteristics, the vibration signals of wheelset bearings are coupled with subgrade vibration impulses, transmission path coupling interference, and other factors. To solve these problems, this paper proposes a fault feature extraction method based on Teager energy spectrum correlation kurtosis (TSCK) guided parameter convex optimization tunable Q-factor wavelet transform (TQWT). The proposed method constructs the TSCK, which is particularly sensitive to the periodic impulse components of the wheelset bearing fault, as the objective function. Combining with the parameter convex optimization method, the key parameter combination of TQWT can be found, thus realizing the optimal sparse decomposition and feature extraction of the signal. The simulated and experimental analyses show that the method can extract the periodic impulse components of bearing fault in the presence of nonperiodic transient impulses, harmonic, and noise interference. The outline of this paper is as follows. Section “Theoretical framework of TSCK guided parameter convex optimization TQWT” introduces the theory and process of the proposed algorithm. Section “Simulated analysis” verifies the diagnosis effect of the proposed algorithm on bearings under different working conditions.
Theoretical framework of TSCK guided parameter convex optimization TQWT
Tunable Q-factor wavelet transform
TQWT is a wavelet transform method designed from the perspective of frequency domain filtering. 26 Its implementation process depends on a decomposition filter bank and a reconstruction filter bank. Compared with the constant Q-factor of traditional wavelet transform, TQWT selects the quality factor according to the oscillation characteristics of the signal to be analyzed. The purpose of signal decomposition and reconstruction can be achieved by iteratively applying the two dual channel filter banks. The three-stage decomposition and reconstruction is taken as an example, and the corresponding dual channel filter banks are shown in Figure 1.
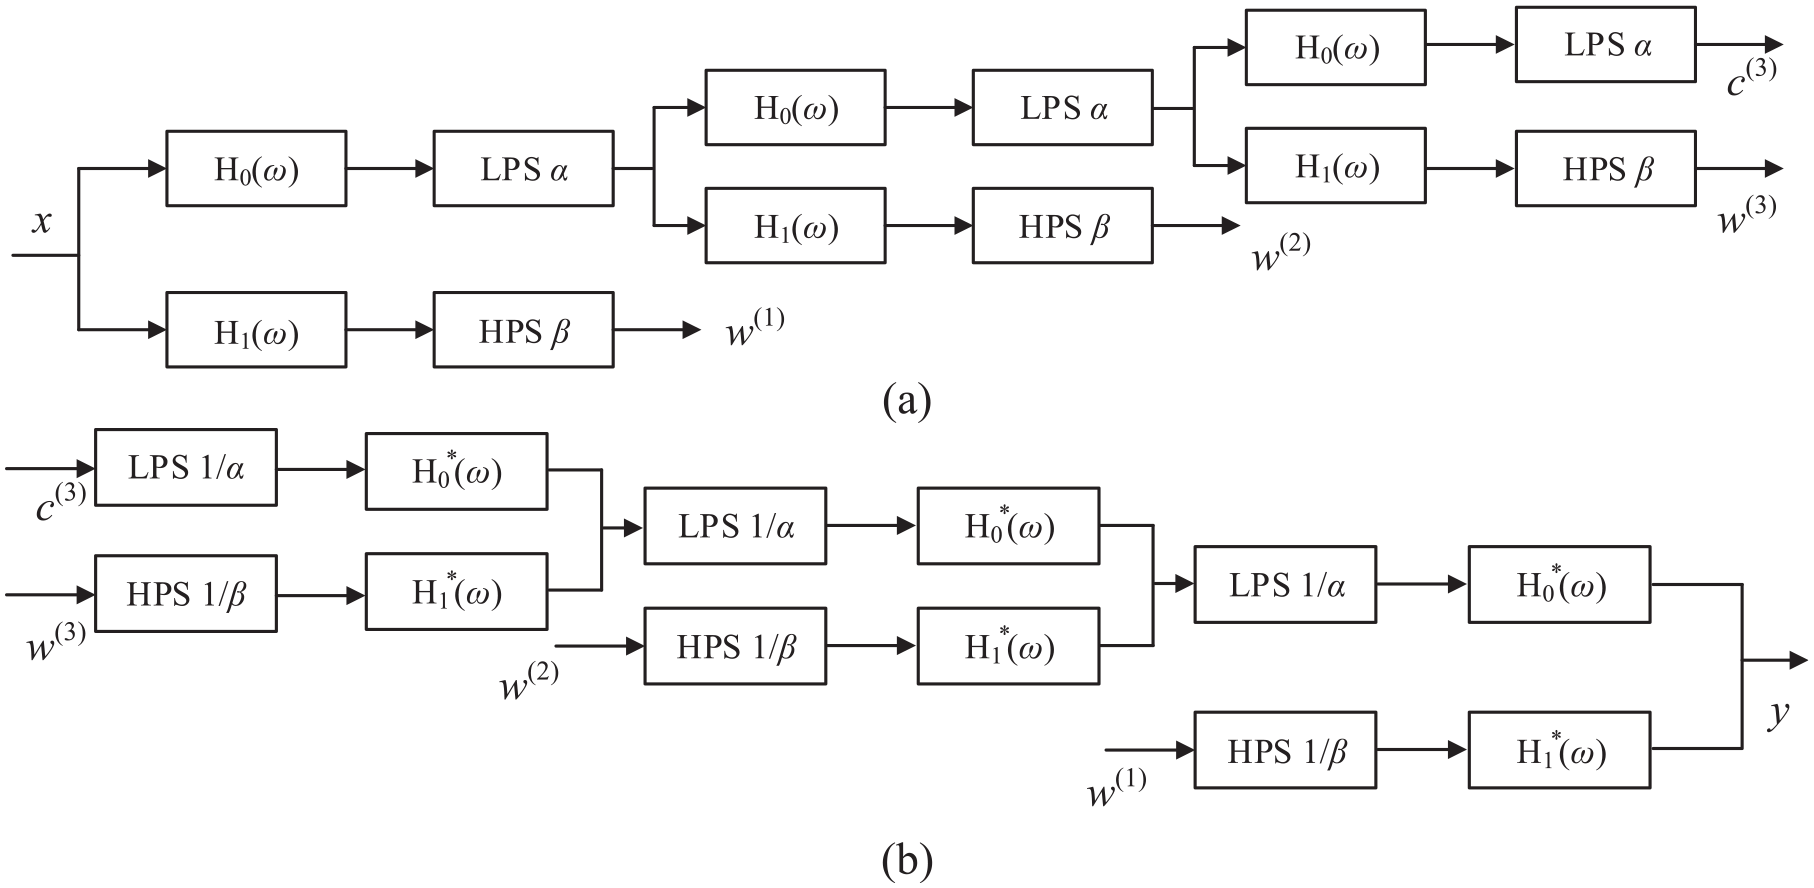
The corresponding dual channel filter banks of (a) decomposition process and (b) reconstruction process.
Low-pass filter response and high-pass filter response in TQWT are defined by Equations (1) and (2), respectively.
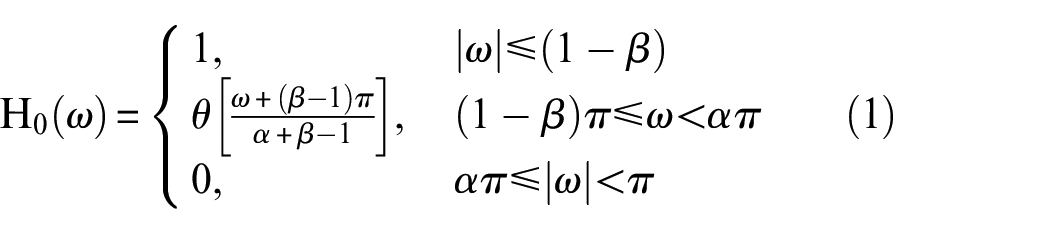
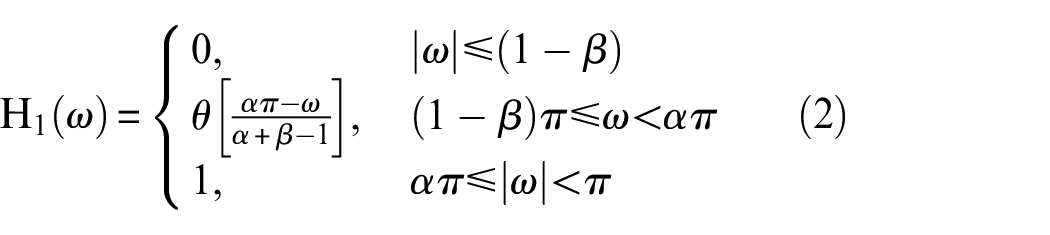
where
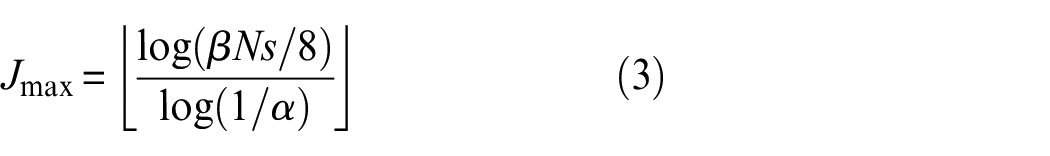
where N is the length of the signal to be analyzed. The scale factors
Teager energy spectrum correlation kurtosis
Teager energy operator (TEO) is a nonlinear operator, which amplifies the instantaneous energy component of the signal through nonlinear combination of the instantaneous value and its differential of the vibration signal, thus enhancing the impact characteristics of the signal. 27 It is suitable for detecting the impact component in the signal, and the envelope demodulation effect of TEO has higher time resolution than Hilbert transform.
For a continuous-time signal

where

where
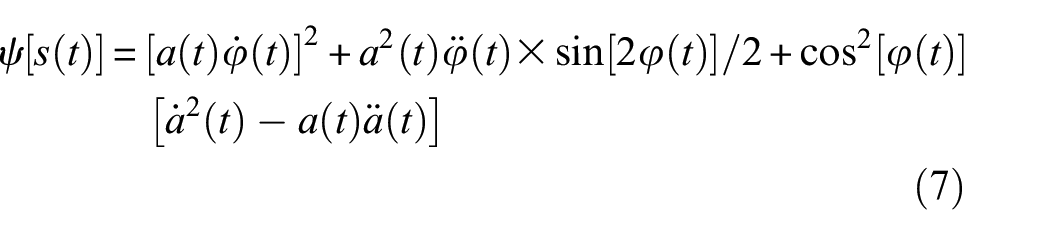
The change of the carrier signal is faster than that of the modulated signal, so the instantaneous amplitude and frequency of the modulated signal are relatively slow compared with the high-frequency carrier, and can be approximately equal to a constant. Therefore, Equation (8) can be obtained.
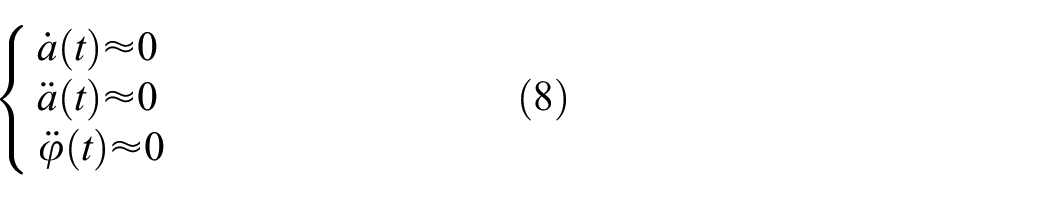
Equation (7) can be simplified to Equation (9).

The energy operator of the first-order differential of

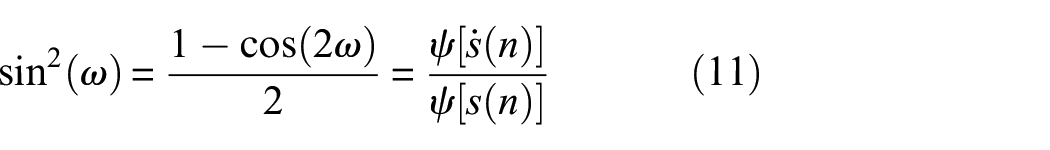
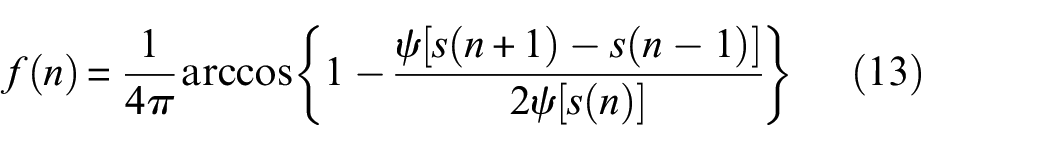
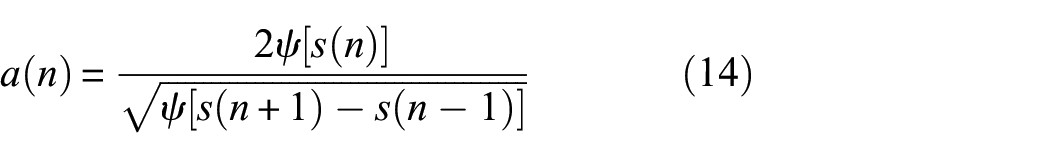
Equations (11) and (12) can be obtained from Equation (10).
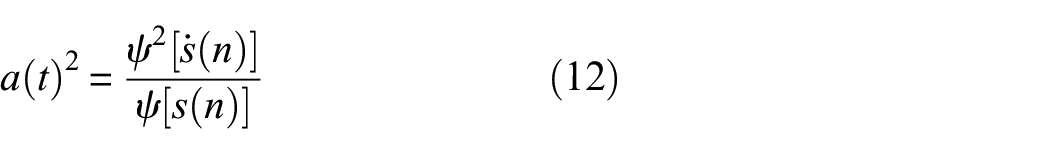
Note that if
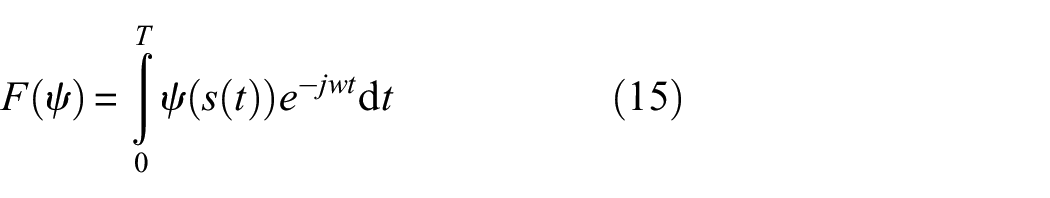
Furthermore, Fourier transform is used to process the signal processed by TEO, as shown in Equation (15).
The autocorrelation coefficient describes the relationship of the same signal at different times, which can be expressed by Equation (16).
where
The independent variable frequency of Teager energy spectrum is regarded as a generalized time variable. Combine Equation (15) with Equation (16) to obtain the autocorrelation function of Teager energy spectrum, as shown in Equation (17).
The process of Equation (17) can enhance the frequency components with coupling relationship in Teager energy spectrum and suppress the frequency components without coupling relationship.
The autocorrelation function of Teager energy spectrum often contains a large trend term, which can be removed by polynomial fitting. The autocorrelation function R in Equation (17) can be expressed by higher-order polynomial as shown in Equation (18).
where R is the data to be fitted, a is the undetermined coefficient, m is the order, and n is the data length
All sampled data can be calculated as shown in matrix relationship Equation (19).

where
The undetermined coefficient
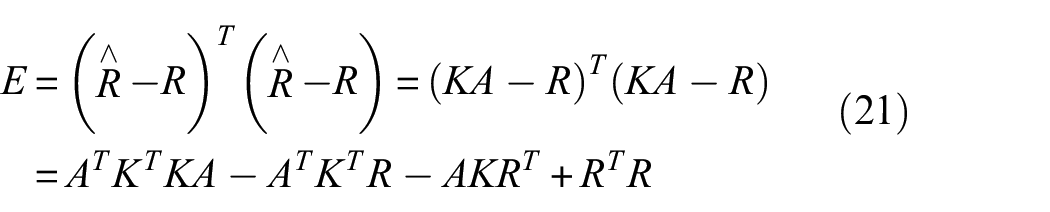
Calculate the partial derivative of E to
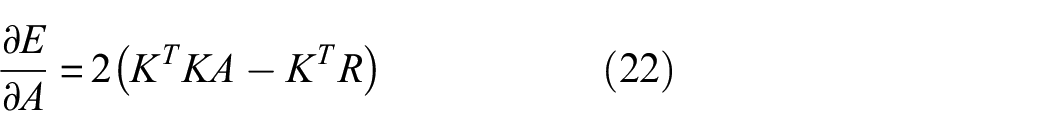
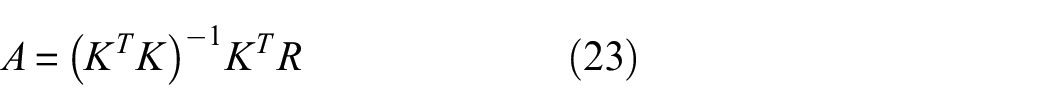
When the partial derivative is 0, the sum of squares of the errors is taken as the minimum, and the polynomial coefficients can be expressed by Equation (23).
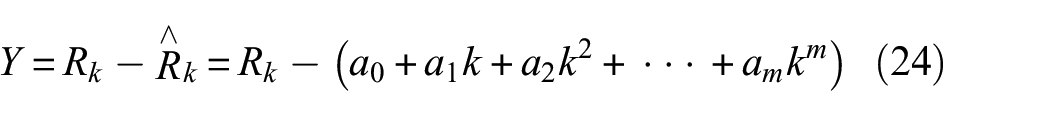
The result after removing the trend term can be expressed as shown in Equation (24).
In order to verify the robustness of the proposed TSCK to noise compared with Hilbert envelope spectrum correlation kurtosis (HSCK), Hilbert envelope spectrum dispersion entropy (HSDE), Dispersion entropy (DE), and Shannon entropy (SE),28–31 different levels of noise are added to the periodic pulse analog signal to simulate different signal-to-noise ratio (SNR) states. The mathematical model of the analog signal can be expressed by Equation (25). 32
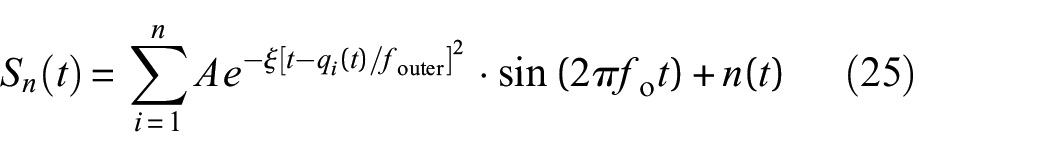
where A is the amplitude of periodic signal,
The time-domain waveform, envelope spectrum, and Teager energy spectrum of the simulated signals are shown in Figure 2(a)–(c). The variation trend of five different indicators under different SNR is shown in Figure 2(d). It can be seen from the figure that the slope of DE and HSDE curves is low, indicating low sensitivity and resolution to different SNR. SE has good sensitivity and resolution at high SNR stage (greater than −8 dB), but has poor stability at low SNR stage. TSCK and HSCK have good sensitivity and stability, and TSCK is better than HSCK.
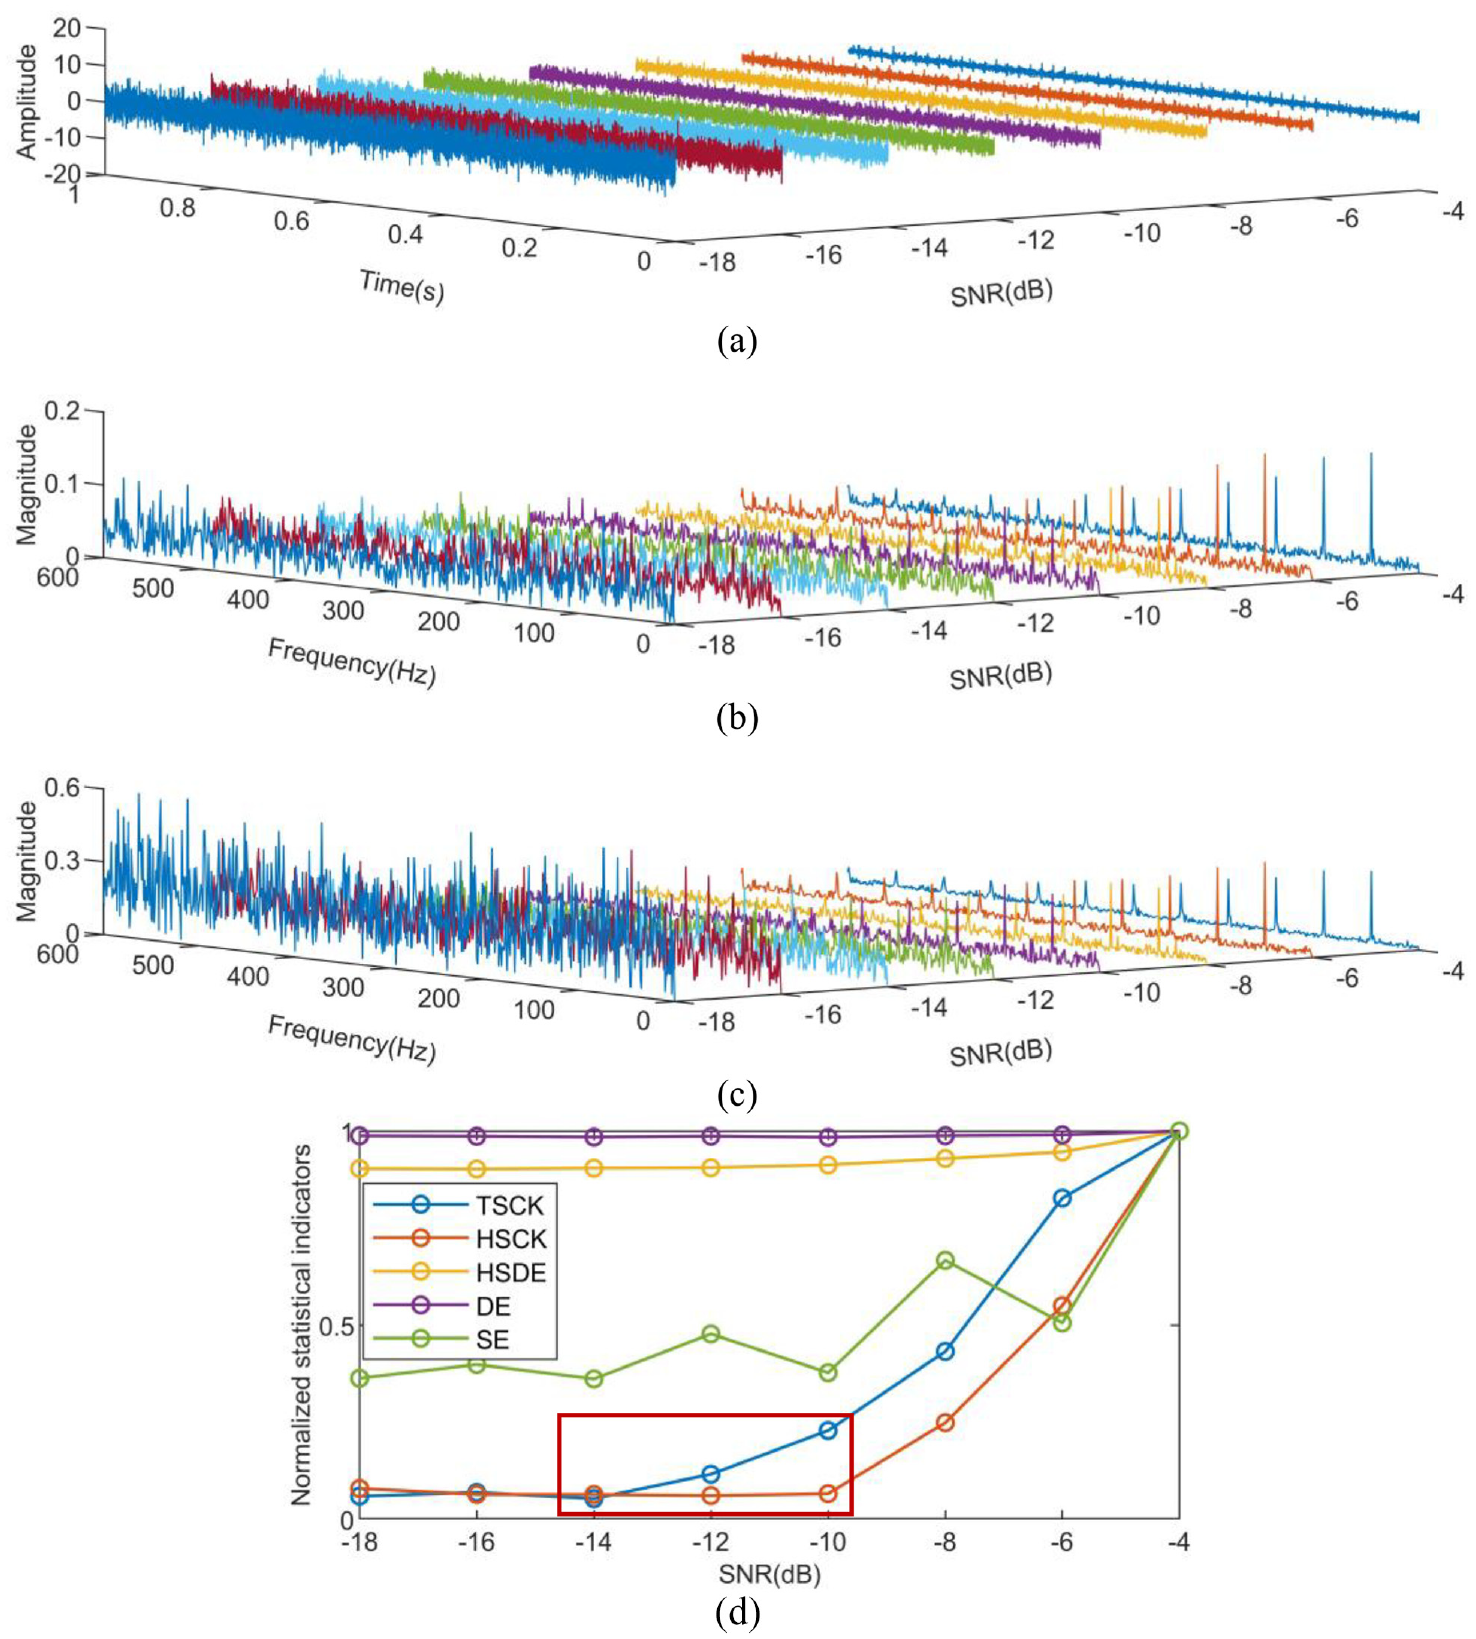
Simulated signal under different SNR: (a) time-domain waveform, (b) envelope spectrum, (c) Teager energy spectrum, and (d) variation trend of five different indicators under different SNR.
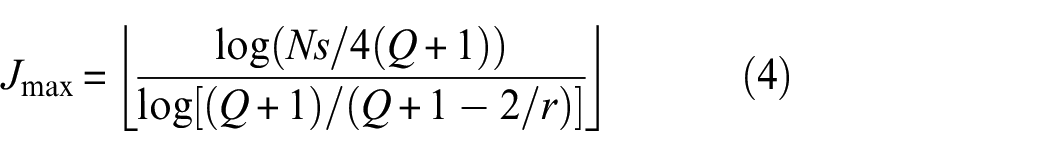
The greater the Q, the stronger the oscillation. The selection of the Q-factor determines the selection of the final filtering band, and the appropriate band evaluation index is the key to ensure the final filtering effect. The parameter r is the redundancy, which determines the coincidence degree between wavelet frequency responses. The greater the r, the higher the coincidence degree of frequency responses. Therefore, reasonable selection of parameter combination Q and r of TQWT is of great significance for effective separation of the periodic impulse components of wheelset bearing faults. Considering that TSCK has the special sensitivity to periodic impulse components and the ability to suppress nonperiodic transient impulse components and harmonic interference, TSCK is constructed as an objective function, and the parameter optimization of TQWT is realized by the parameter convex optimization method. The process is that the signal to be processed is decomposed by cyclic TQWT with different parameter combinations, the TSCKs of the subband after each decomposition is calculated, the maximum TSCK value is selected to represent the decomposition result, the characteristic matrix is constructed with the maximum TSCK values of each result of cyclic TQWT decomposition. Then, parameter convex optimization is used to obtain discrete points in the connected space, and 3D interpolation smooth fitting is performed to obtain the distribution of the maximum TSCK value under different parameter combinations. Finally, the distribution of the maximum TSCK values is projected to the Q and r parameter planes and meshed to obtain the optimal TQWT parameter combination at the maximum point.
The proposed diagnosis scheme
The flowchart of the proposed method is shown in Figure 3.
Parametric TQWT ([Q r]) is used to decompose the original signal, in which parameters Q and r are selected within a specific interval such as [1 10].
Each subband after TQWT decomposition is demodulated by the TEO, and the spectrum of each demodulated signal is analyzed to obtain the Teager energy spectrum.
The spectral independent variable of Teager energy spectrum is regarded as a generalized time quantity for autocorrelation analysis, and the autocorrelation function is obtained.
The trend term of autocorrelation coefficient of Teager energy spectrum is removed by polynomial fitting method to obtain a smooth autocorrelation coefficient sequence, and the kurtosis of the autocorrelation coefficient is calculated.
Combining steps (2), (3), and (4), the TSCK of each subband signal under parametric combination ([Q r]) can be obtained, and the optimal TQWT parameter combination ([Q*r*]) can be obtained by using the parameter convex optimization visualization method, so as to obtain the optimal decomposition mode.
The optimal subband interval is obtained under the optimal TQWT decomposition mode, and the fault feature frequency is extracted to diagnose the fault type.
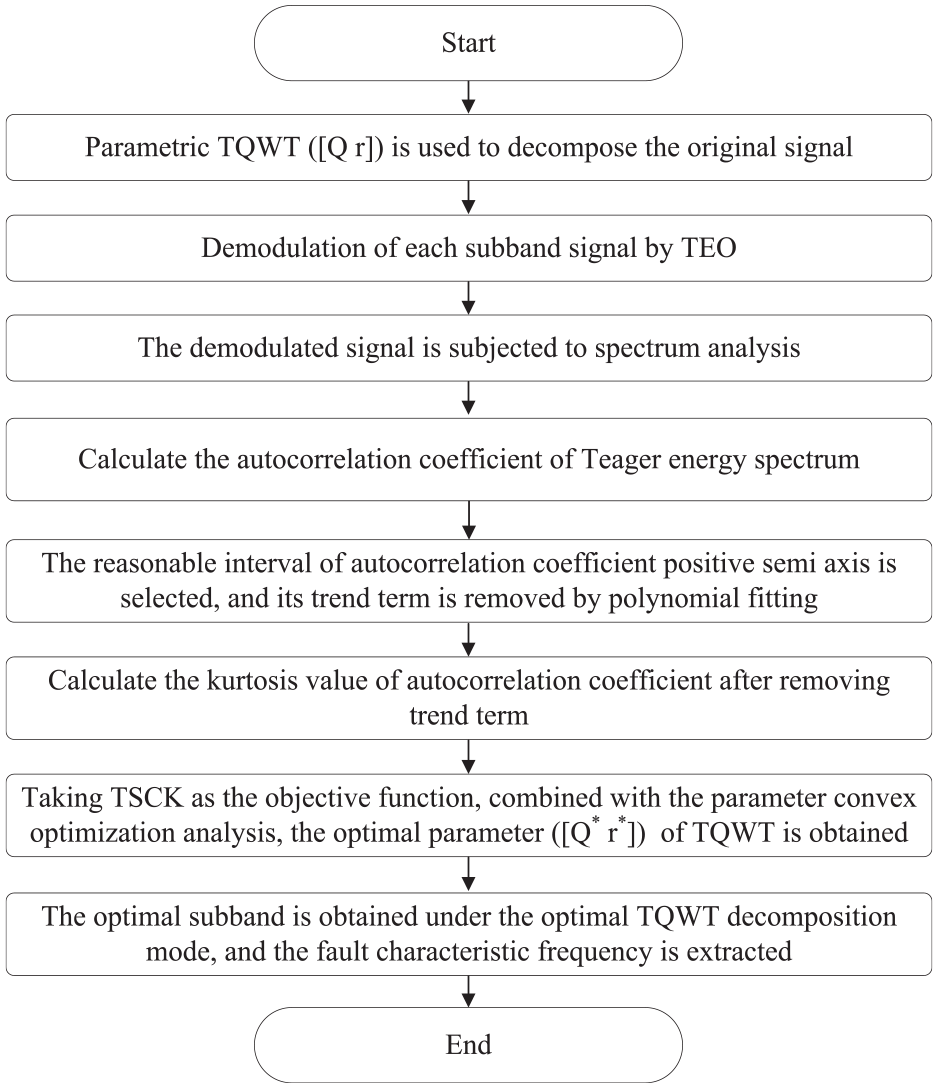
Flowchart of the proposed algorithm.
Simulated analysis
When monitoring the running state of the wheelset bearing, the sensors are generally arranged on the wheelset bearing seat or box. The signal components received by the sensors may be complex. In addition to the periodic impulse components of the bearing fault, they may also contain a variety of interference components, such as the nonperiodic transient impulse components introduced by the subgrade vibration, the noise components and harmonic components introduced by the transmission path. The schematic diagram of the generation, transmission, and superposition of each signal component is shown in Figure 4.
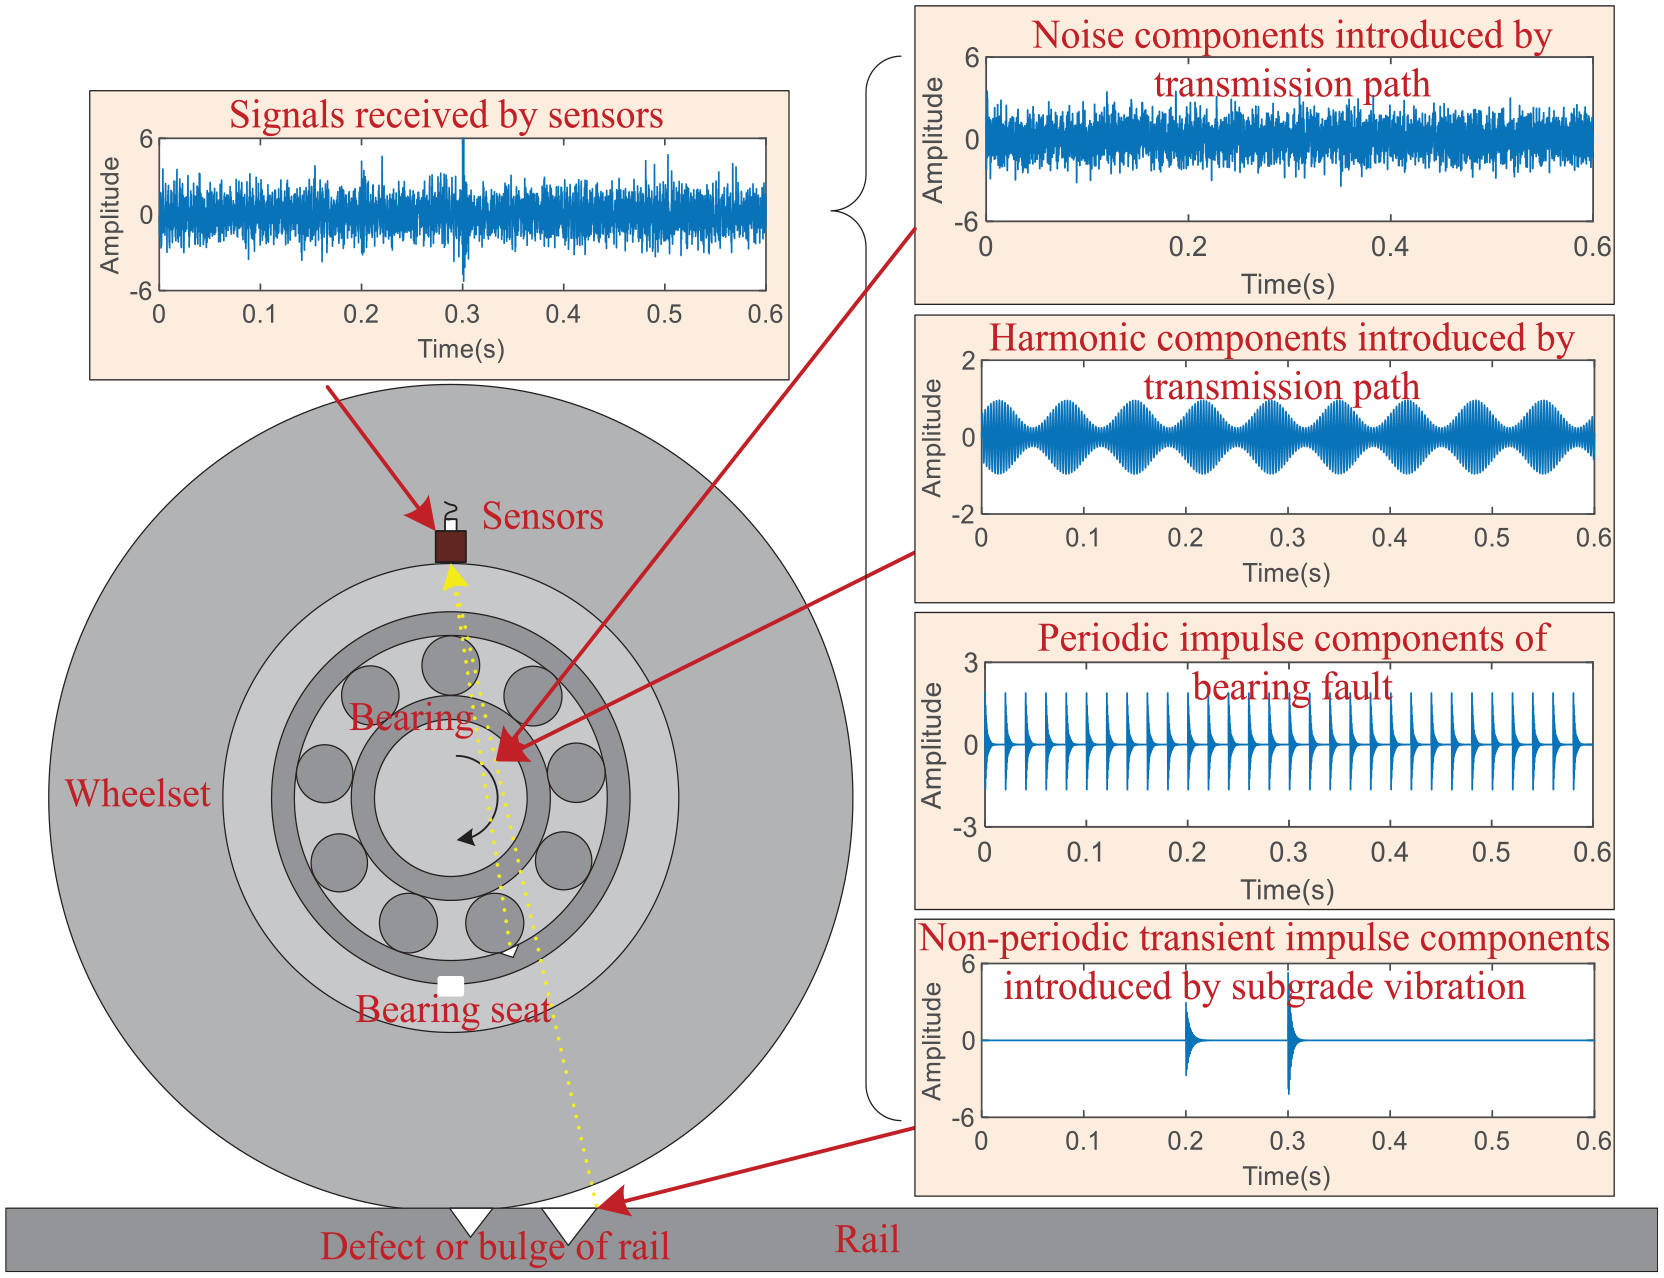
Schematic diagram of generation, transmission, and superposition of each signal components.
The mathematical model shown in Equation (26) is used to construct the simulated signal,
33
which mainly includes three parts, namely, periodic fault impulse components
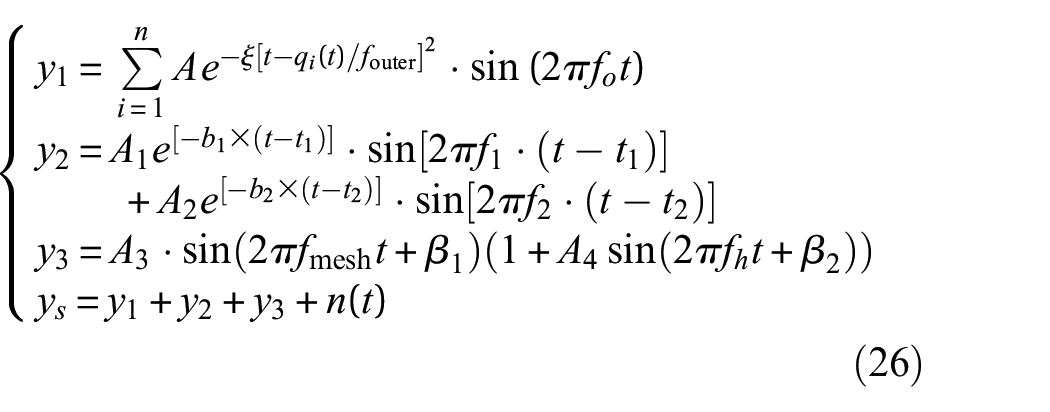
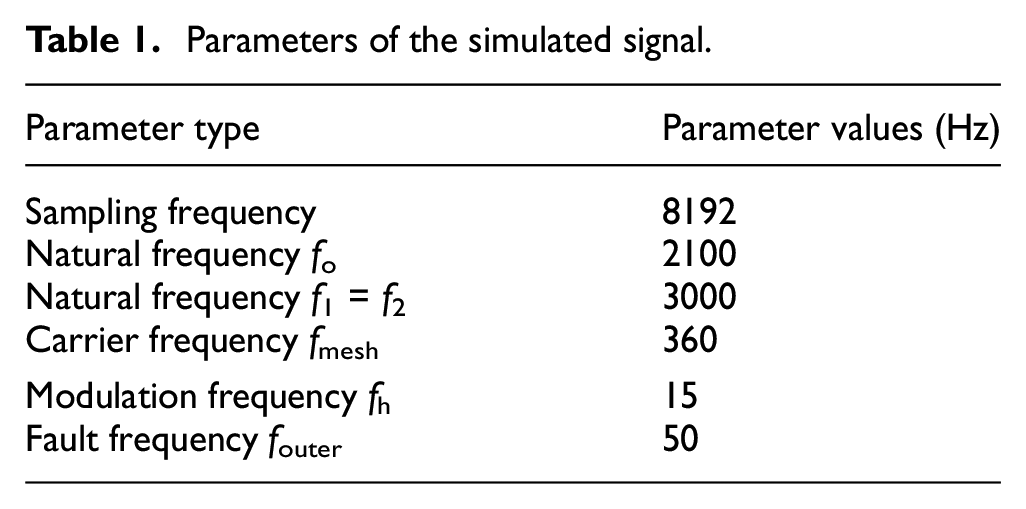
where A,
Parameters of the simulated signal.
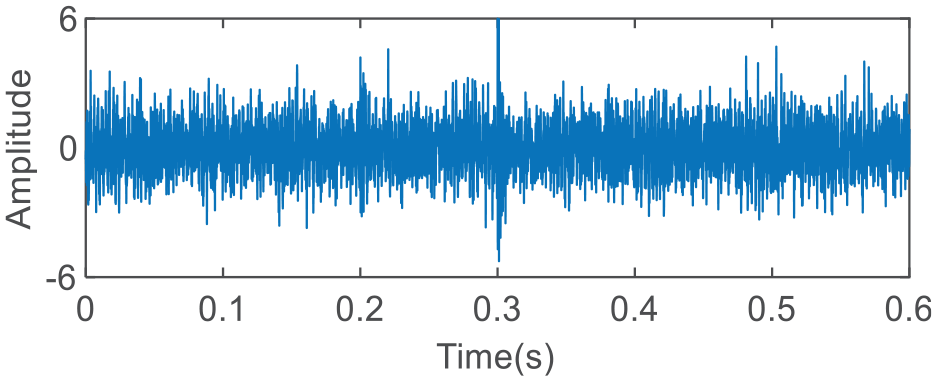
Time-domain waveform of the simulated signals.
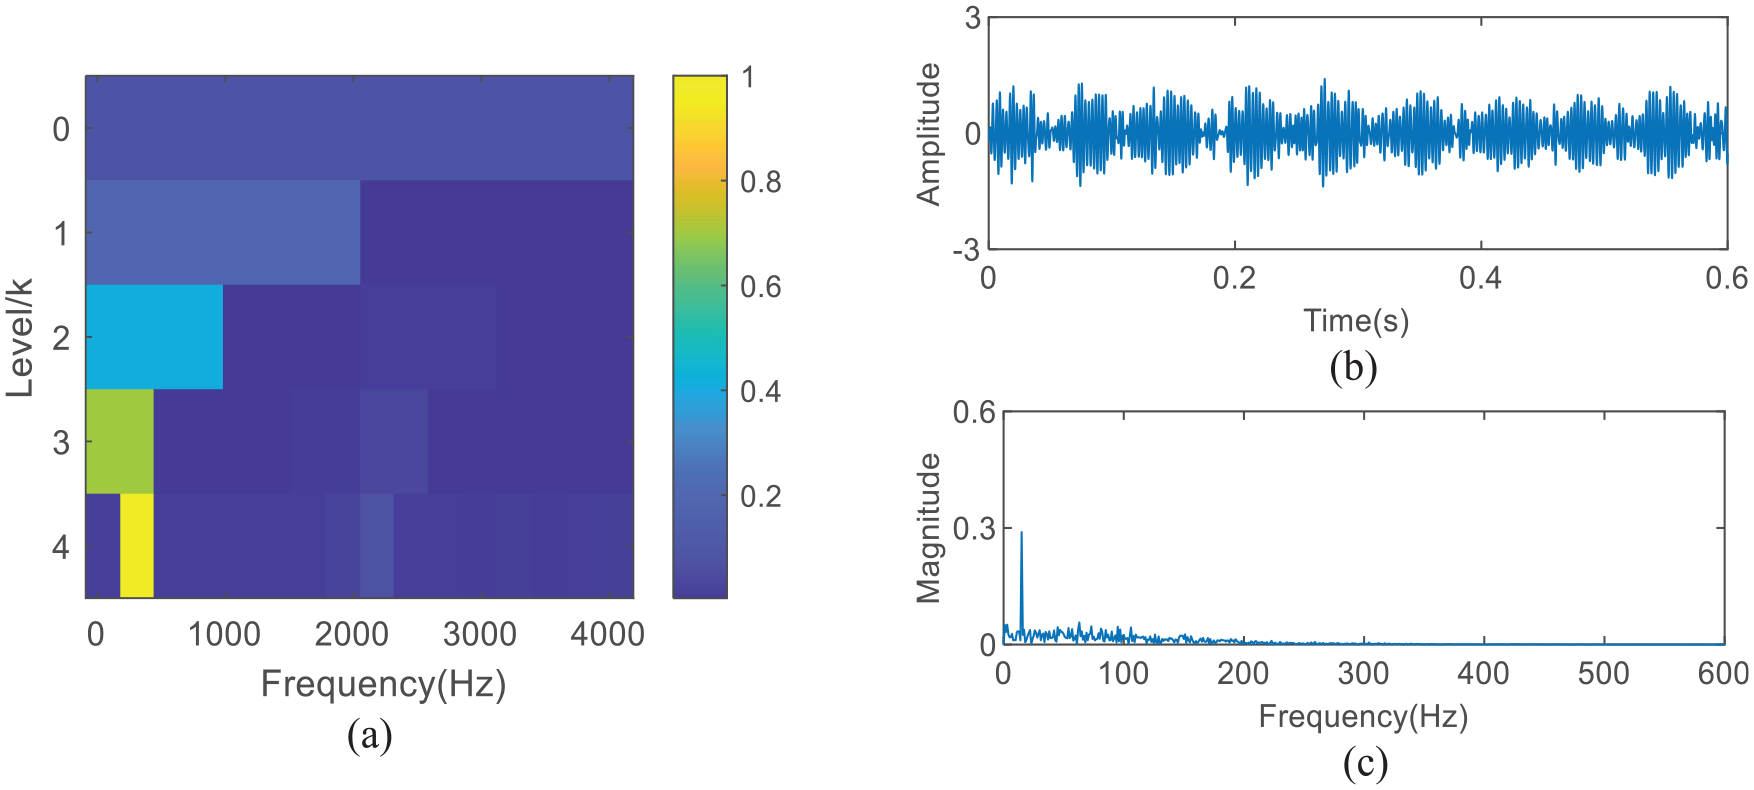
The calculation process of Kurtogram defined in the time domain is to decompose the original signal into a series of subband signals through tree filtering, and then calculate the kurtosis value of the time-domain sequence of each subband, and normalize it to obtain the kurtosis distribution of the subbands. The optimal subband determined by this method is located in the twelfth subband of the fourth layer (concentrated near 3000 Hz) (Figure 6(a)). The time-domain waveform and envelope spectrum of this subband signal are shown in Figure 6(b) and (c), respectively. The signal components of this subband are mainly nonperiodic transient impulse components, rather than the periodic impulse components to be extracted. The calculation process of Kurtogram defined in the frequency domain is to analyze the envelope spectrum of each subband after the tree decomposition, and then calculate the kurtosis value of the envelope spectrum sequence separately, and normalize it to obtain the kurtosis distribution of the subbands. The optimal subband located by this method is located in the second subband of the fourth layer (concentrated near 360 Hz) (Figure 7(a)). The time-domain waveform and envelope spectrum of this subband are shown in Figure 7(b) and (c), respectively. The signal components of this subband are mainly harmonic signal components. It can be seen that the Kurtogram algorithm defined by the frequency domain index will be affected by the harmonic components (which can be regarded as nonperiodic transient impulse components in the frequency domain), so it is unable to effectively identify the fault components.
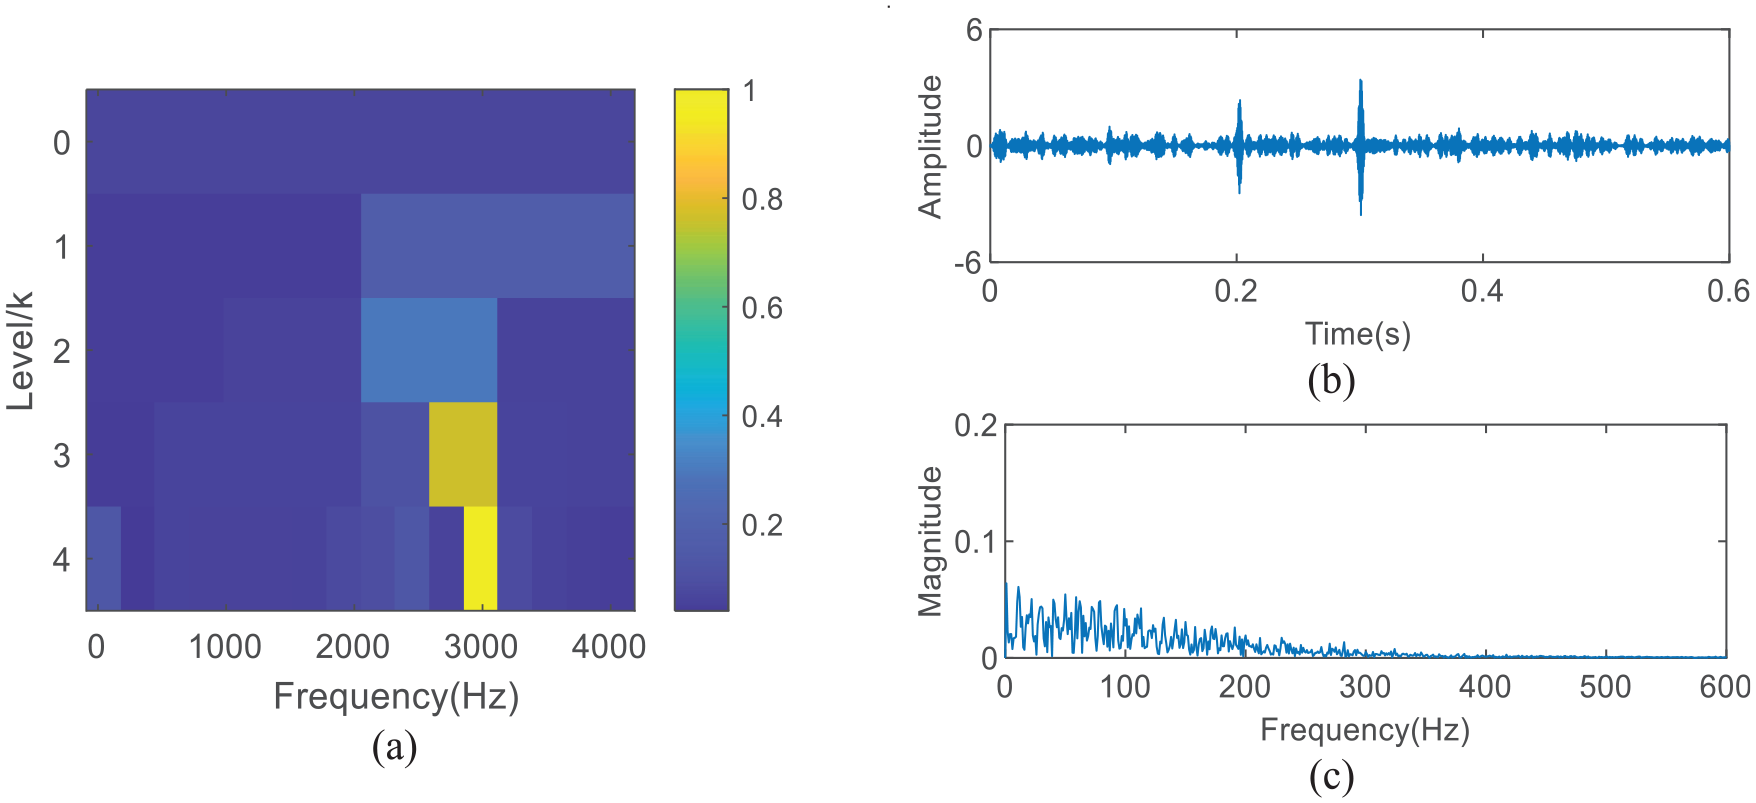
Analysis results of the simulated signals using the Kurtogram algorithm defined in time domain: (a) the optimal band to be located, (b) waveform of the selected subband, and (c) envelope spectrum of (b).
Analysis results of the simulated signals using the Kurtogram algorithm defined in frequency domain: (a) the optimal band to be located, (b) waveform of the selected subband, and (c) envelope spectrum of (b).
The method proposed in this paper is used for analysis. The process is that the simulated signals is decomposed by cyclic TQWT with different parameter combinations (the double parameter optimization interval of Q and r is 1 to 10), the TSCKs of the subband after each decomposition is calculated, the maximum TSCK value is selected to represent the decomposition result, and the characteristic matrix is constructed with the maximum TSCK values of each result of cyclic TQWT decomposition. Then, parameter convex optimization is used to obtain discrete points in the connected space, and 3D interpolation smooth fitting is performed to obtain the distribution of the maximum TSCK value under different parameter combinations. Finally, the distribution of the maximum TSCK values is projected to the Q and r parameter planes and meshed to obtain the optimal TQWT parameter combination at the maximum point. The results are shown in Figure 8. Figure 8(a) shows the maximum TSCK discrete data distribution of each subband after TQWT decomposition under different [Q r] parameter combinations. Figure 8(b) shows the result of 3D interpolation smooth fitting. Figure 8(c) shows the projection of Figure 8(b) on the 2D dimensional plane, and Figure 8(d) shows the grid division results of the parameter plane for the convenience of parameter selection. From Figure 8(d), it can be clearly seen that the optimal combination of TQWT decomposition parameters [Q r] that make the maximum value of TSCK index region is [8 2].
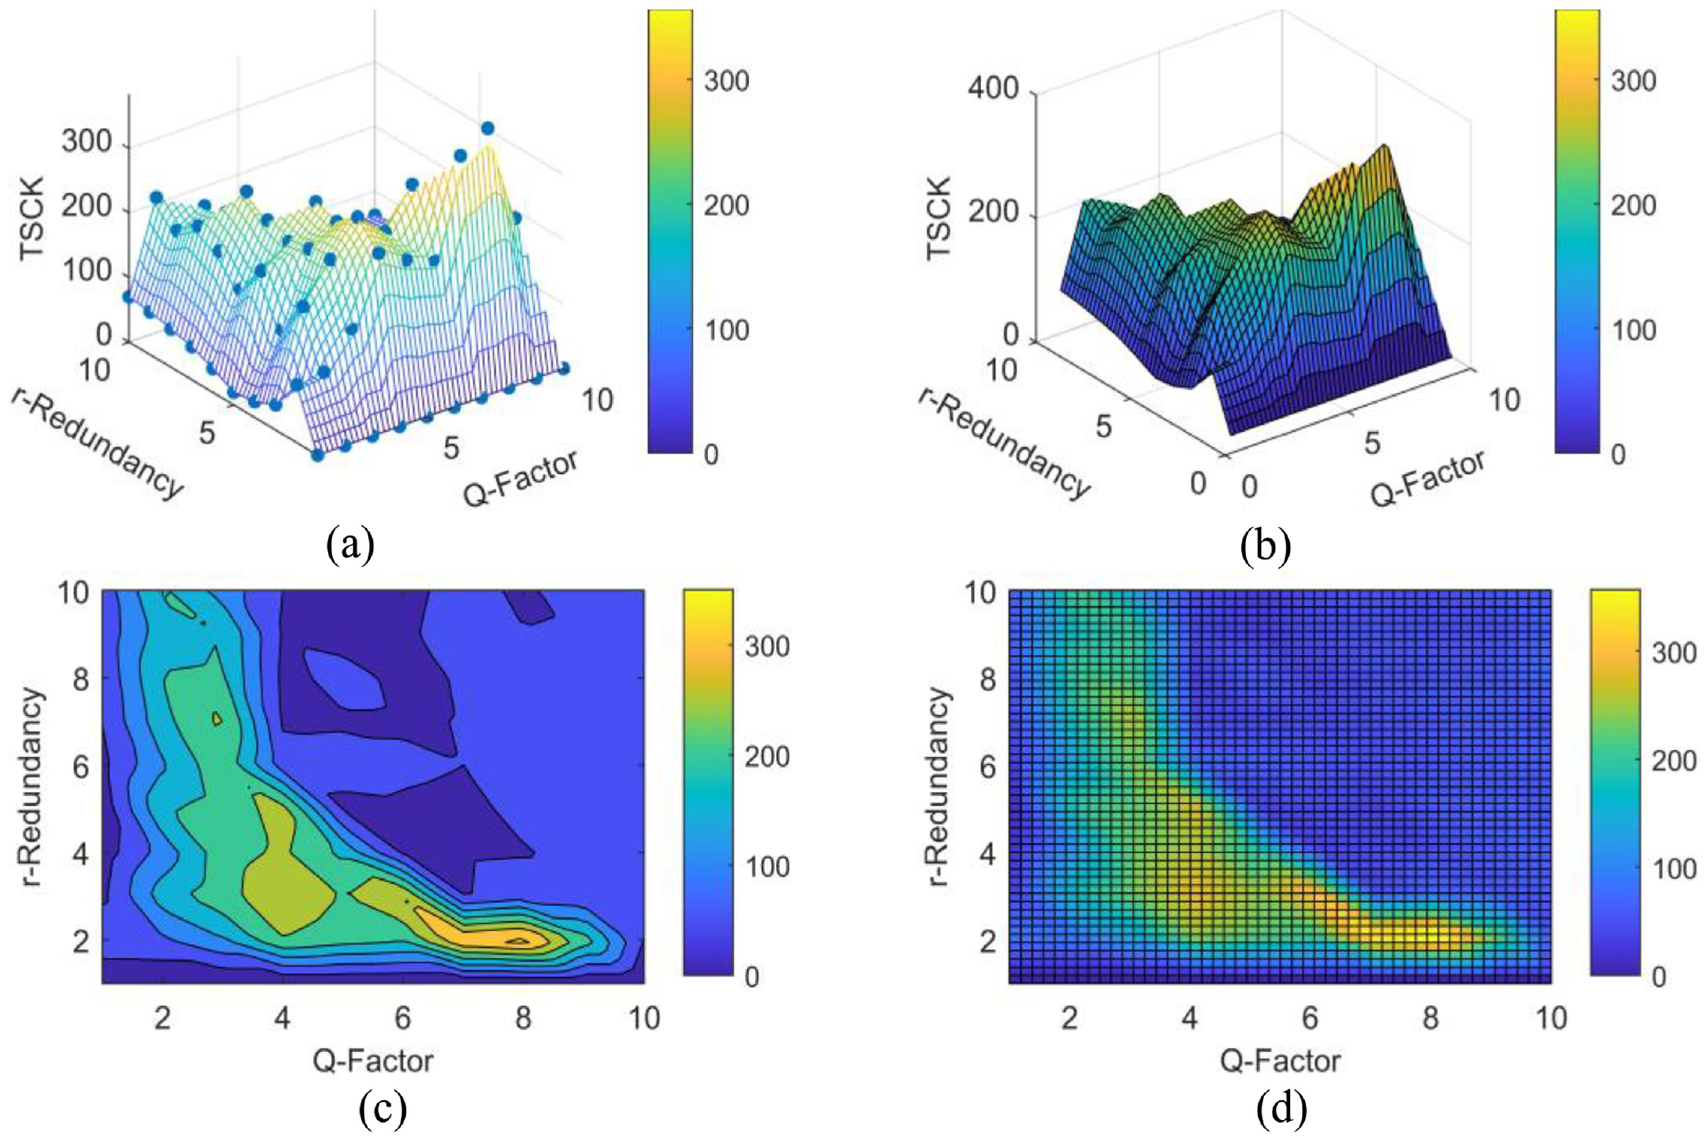
Analysis results of the simulated signals by the proposed method: (a) the maximum TSCK distribution of each subband after TQWT decomposition under different [Q r], (b) the result of 3D interpolation smooth fitting, (c) the projection on the 2D dimension plane of (b), and (d) grid generation result of parameter plane.
When the TQWT parameter combination is [8 2], the TSCK value of the sixth subband signal is the largest, and its frequency response results are shown in Figure 9(a). The frequency corresponding to the selected subband is concentrated around 2100 Hz, that is, the subband range of the periodic fault impulse components. The time-domain waveform and envelope spectrum of this subband are shown in Figure 9(b) and (c). There are obvious periodic impulse components in the time-domain waveform. The fault characteristic frequency and its multiple frequency can be seen in the envelope spectrum. Therefore, the proposed method can accurately extract the periodic impulse components.
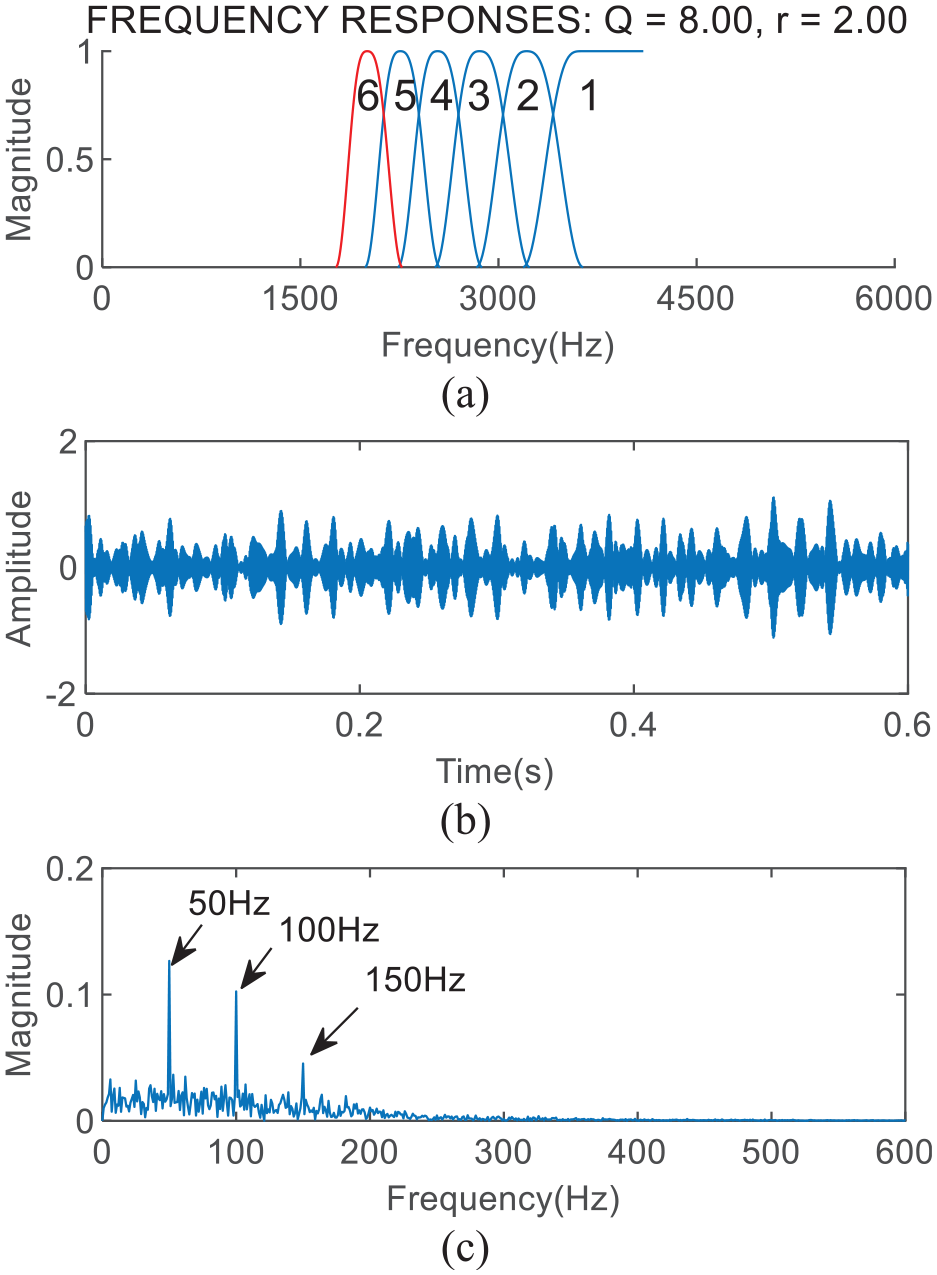
(a) Frequency responses with parameter combination [8 2], (b) time-domain waveform of the selected subband, and (c) envelope spectrum of (b).
Experimental analysis
Case 1: Experimental signals with nonperiodic transient impulse components
In order to further verify the effectiveness of the proposed method, experimental fault signals are used for analysis. The experimental equipment is the QPZZ-II simulated experimental platform. The structure of the test-bed is shown in Figure 10(a). The model of the bearing was 6205E, and electrical discharge machining is used to process faults on the inner, as shown in Figure 10(b). The entire test-bed is driven by a drive motor
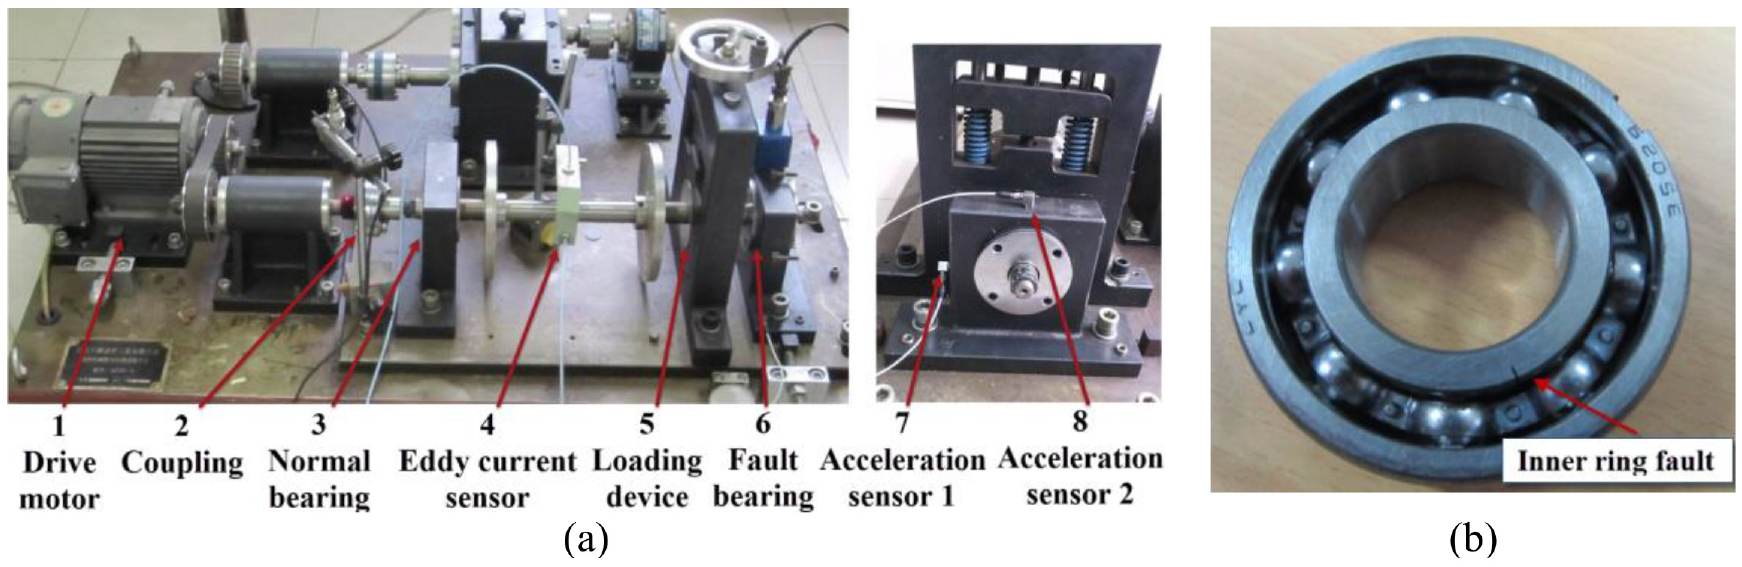
(a) Bearing fault experimental equipment of QPZZ-II, and (b) 6205E bearing with inner ring fault.
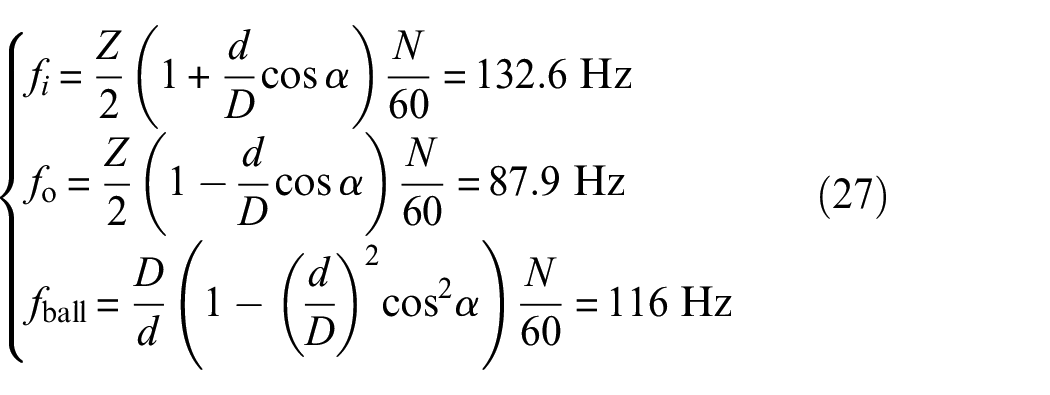
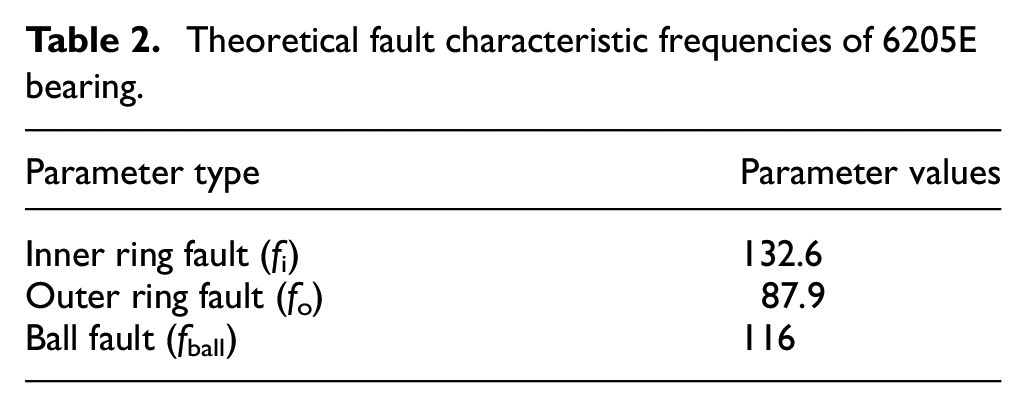
The theoretical fault characteristic frequency (as shown in Table 2) of the bearing can be calculated by using Equation (27) based on the bearing structural dimension parameters (as shown in Table 3) and rotating speed (1470 rpm).
Theoretical fault characteristic frequencies of 6205E bearing.
Structural dimension parameters of 6205E bearing.
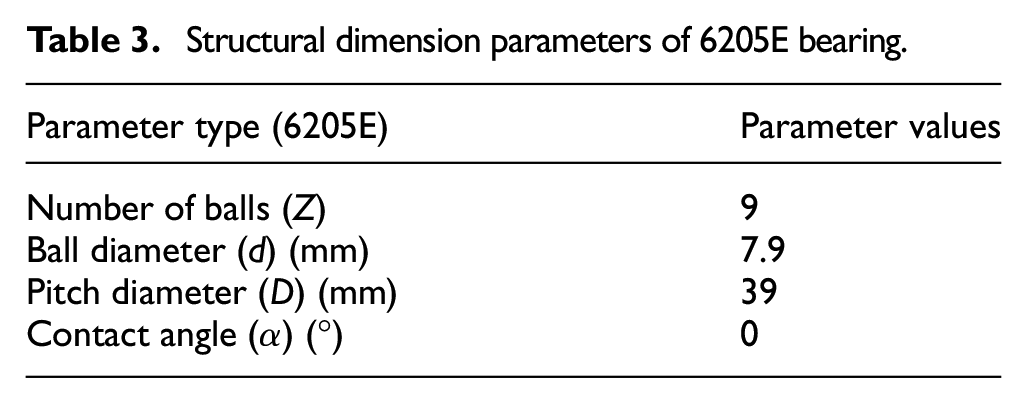
In the first group of experiments, the motor speed is 1470 rpm, and the sampling frequency is 12,800 Hz. The fault type is inner race fault, and the corresponding bearing structure parameters are shown in Table 3. The time-domain waveform of the experimental signals is shown in Figure 11. It can be seen that there is a large amplitude of nonperiodic transient impulse components between 0.3 and 0.4 s of the time-domain waveform.
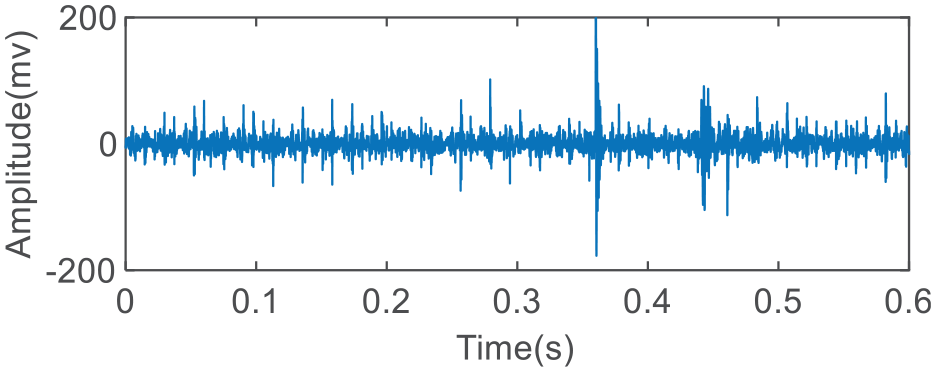
Time-domain waveform of the first group of experimental signals.
Kurtogram algorithm defined by kurtosis index in time domain is used to analyze the first group of experimental signals, and the results are shown in Figure 12. The optimal location area is located in the second subband of the third layer. The time-domain waveform and envelope spectrum of the subband signals are shown in Figure 12(b) and (c), respectively. The signal component of this subband is mainly the nonperiodic transient impulse components, rather than periodic impulse components caused by bearing failure in the experimental signals.
Analysis results of the first group experimental signals using the Kurtogram algorithm defined in time domain: (a) the optimal band to be located, (b) waveform of the selected subband, and (c) envelope spectrum of (b).
The method proposed in this paper is used for analysis. TQWT is used to decompose the first group of experimental signals, and the TSCK of the decomposed subband signal is used to convex optimize the parameters Q and r of TQWT to find the optimal parameter combination. The double parameter optimization interval of Q and r is 1 to 10. The results are shown in Figure 13. Figure 13(a) shows the maximum TSCK discrete data distribution of each subband after TQWT decomposition under different [Q r] parameter combinations. Figure 13(b) shows the result of 3D interpolation smooth fitting. Figure 13(c) shows the projection of Figure 13(b) on the 2D dimensional plane, and Figure 13(d) shows the grid division results of the parameter plane for the convenience of parameter selection. From Figure 13(d), it can be clearly seen that the optimal combination of TQWT decomposition parameters [Q r] that make the maximum value of TSCK index region is [10 6].
Analysis results of the first group of experimental signals by the proposed method: (a) the maximum TSCK distribution of each subband after TQWT decomposition under different [Q r], (b) the result of 3D interpolation smooth fitting, (c) the projection on the 2D dimension plane of (b), and (d) grid generation result of parameter plane.
When the TQWT parameter combination is [10 6], the TSCK value of the fifth subband signal is the largest, and its frequency band response results are shown in Figure 14(a). The time-domain waveform and envelope spectrum of this subband are shown in Figure 14(b) and (c). There are obvious periodic impulse components in the time-domain waveform. The fault characteristic frequency and its multiple frequency can be seen in the envelope spectrum. Therefore, the proposed method can accurately extract the periodic impulse components.
(a) Frequency responses with parameter combination [10 6], (b) time-domain waveform of the selected subband, and (c) envelope spectrum of (b).
Case 2: Experimental signals with harmonic components
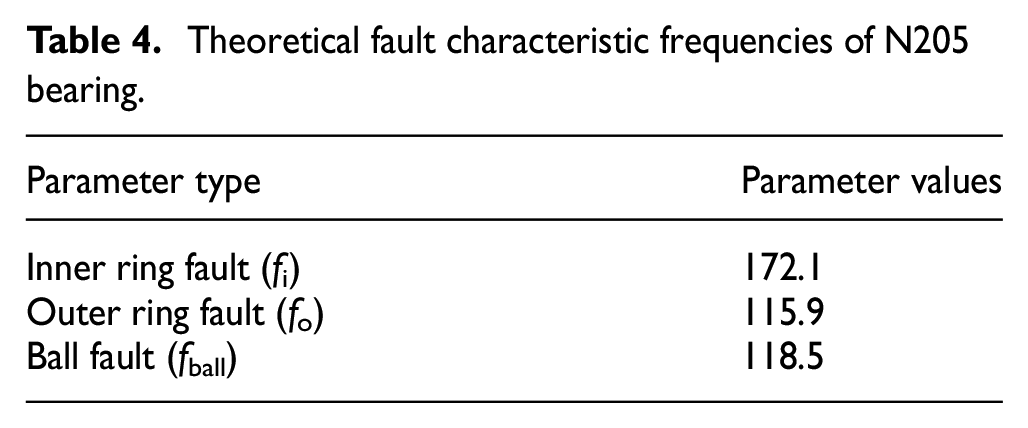
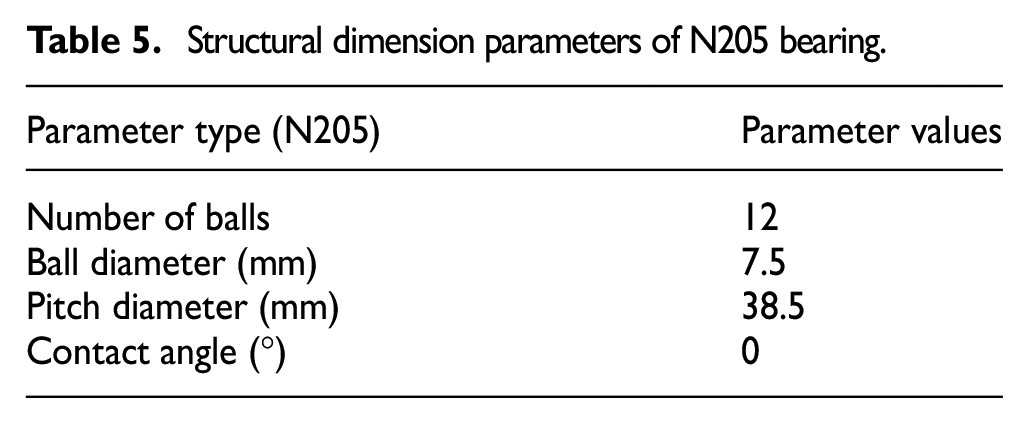
The second group of experiments is also carried out on the test bench in Figure 10(a). The experimental bearing is replaced with N205. The theoretical fault characteristic frequency (as shown in Table 4) of the bearing can be calculated based on the bearing structural dimension parameters (as shown in Table 5) and rotating speed. The fault type is outer ring fault (Figure 15). The motor speed was 1440 rpm, and the sampling frequency is 12,800 Hz. The time-domain waveform of the experimental signals is shown in Figure 16, from which a strong harmonic modulation component can be seen.
Theoretical fault characteristic frequencies of N205 bearing.
Structural dimension parameters of N205 bearing.
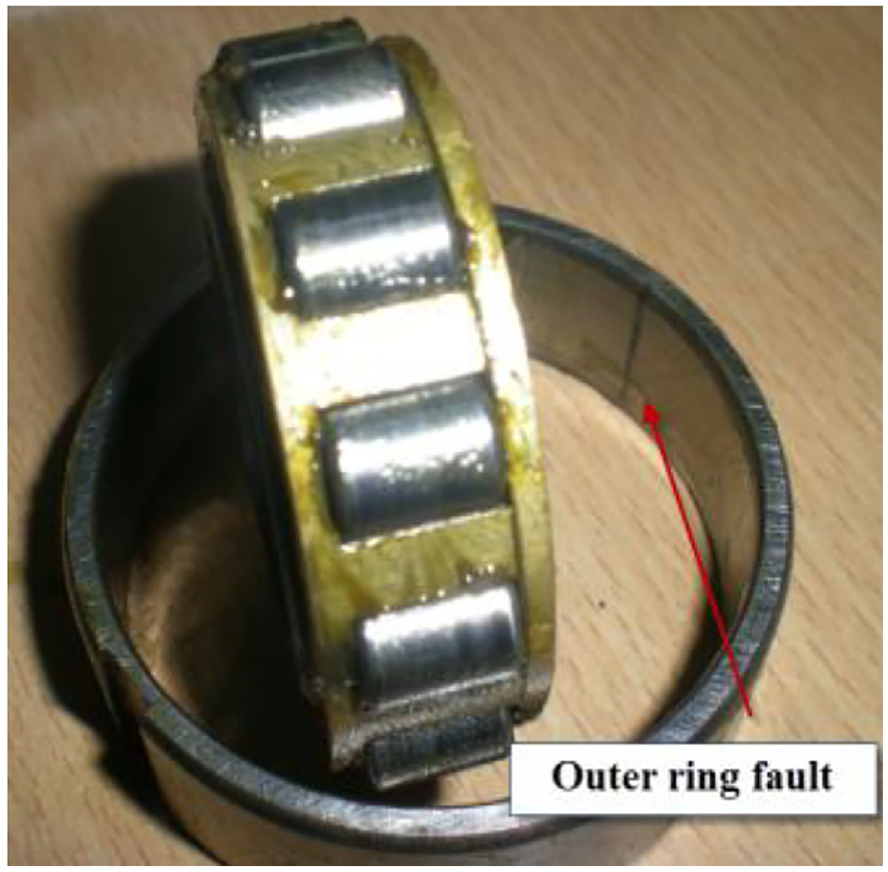
N205 bearing with outer ring fault.
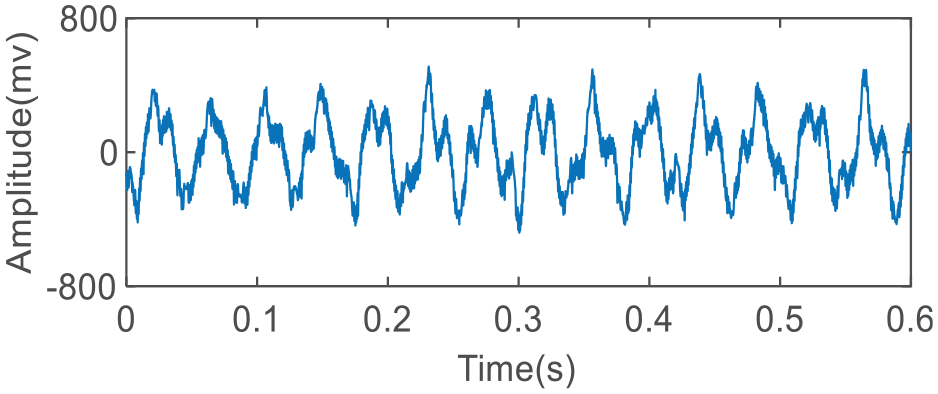
Time-domain waveform of the second group of experimental signals.
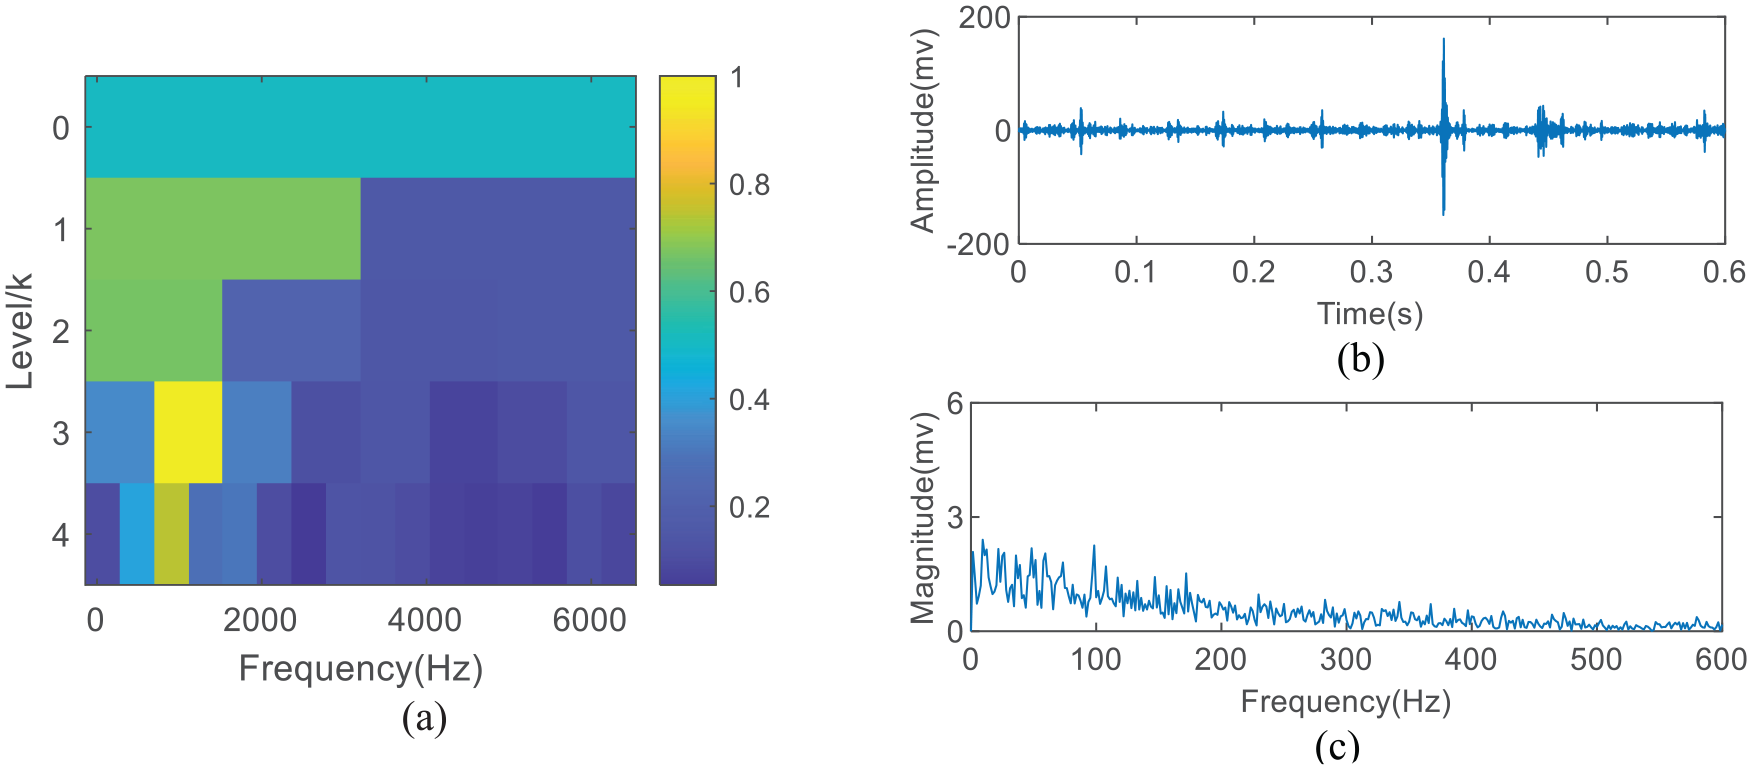
Kurtogram algorithm defined by kurtosis index of frequency domain envelope spectrum is used to analyze the second group of experimental signals, and the results are shown in Figure 17. The optimal subband located by this method is the first subband of the fourth layer. The time-domain waveform and envelope spectrum of this subband are shown in Figure 17(b) and (c), respectively. The signal components of this subband are mainly harmonic signal components, which cannot effectively extract the fault characteristic frequency.
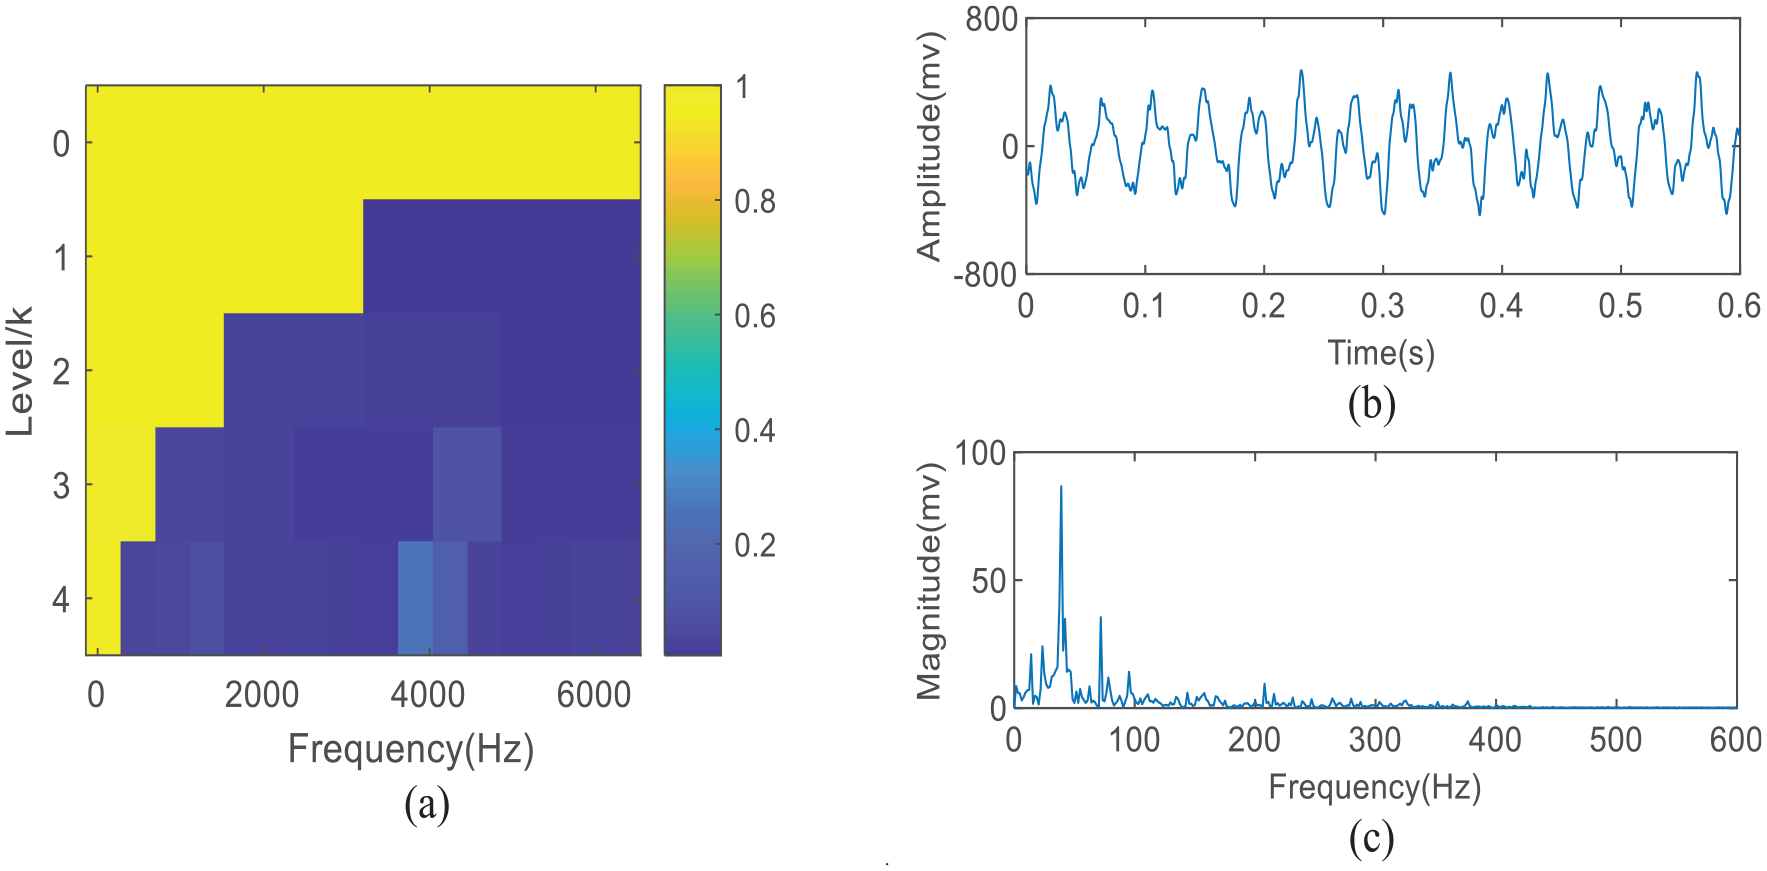
Analysis results of the second group experimental signals using the Kurtogram algorithm defined in frequency domain: (a) the optimal band to be located, (b) waveform of the selected subband, and (c) envelope spectrum of (b).
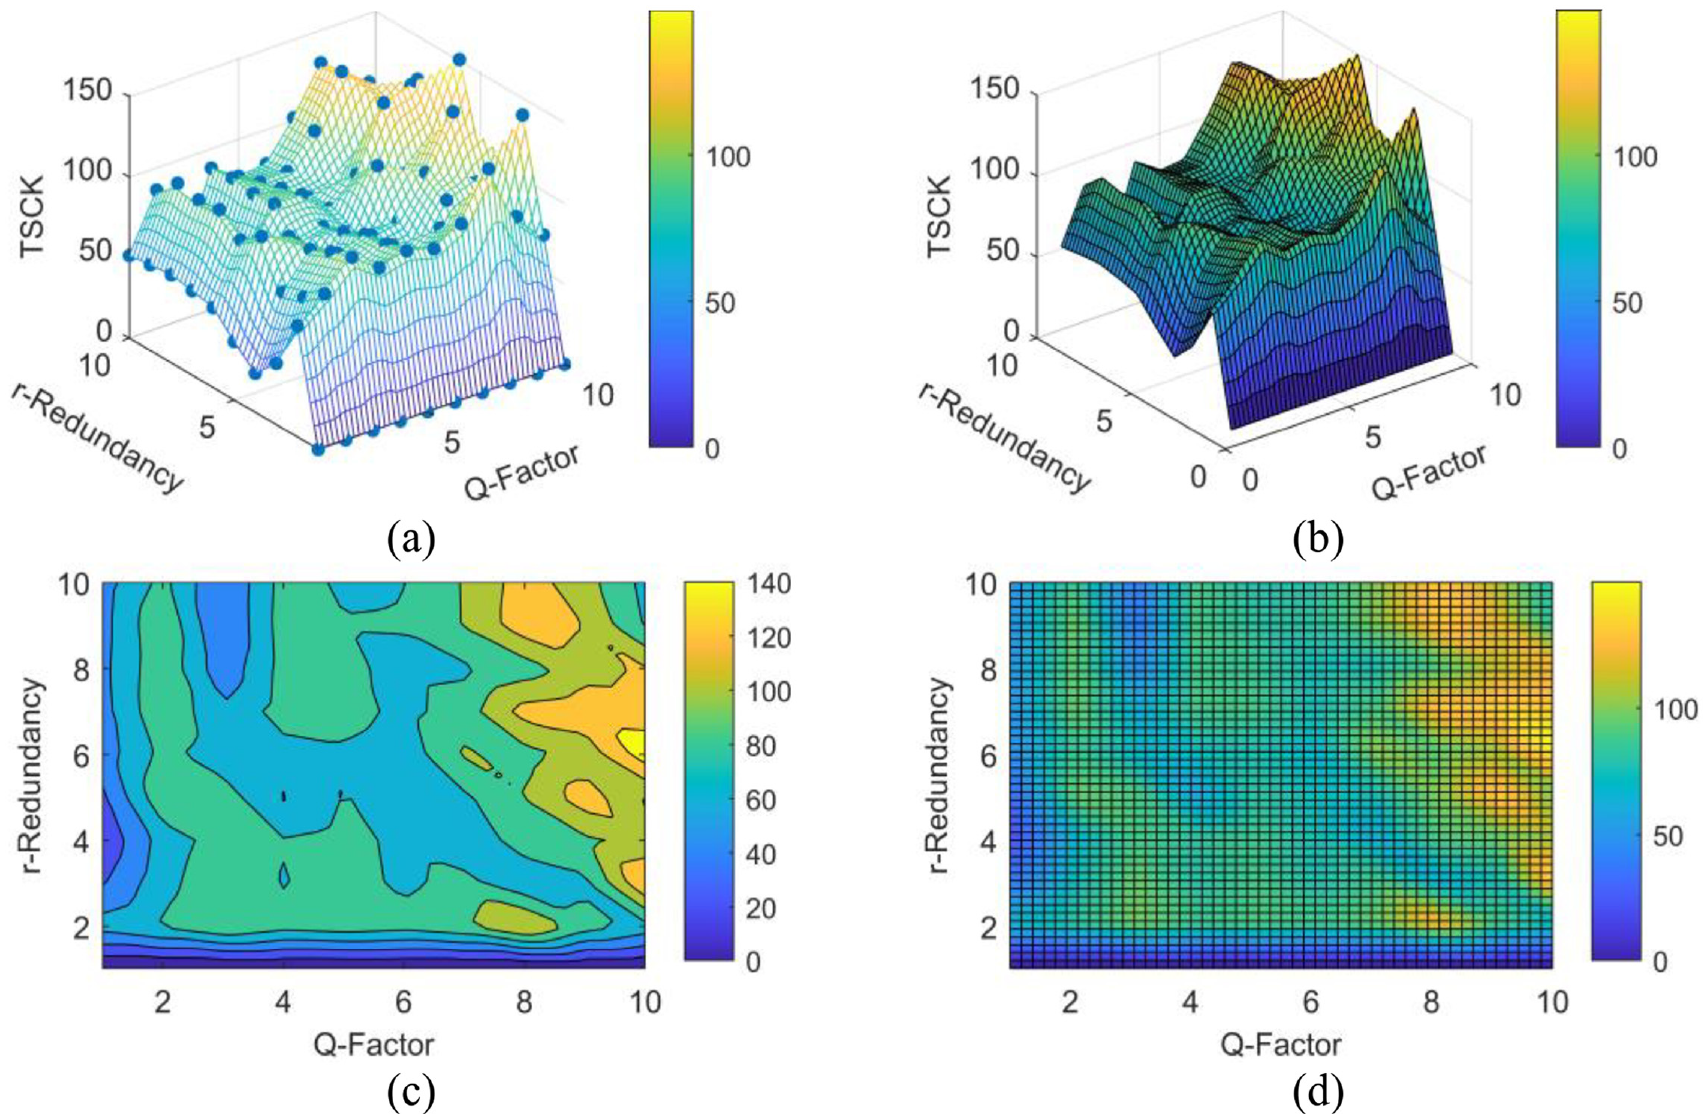
The second group of experimental signals is analyzed using the method proposed in this paper. TSCK is used to guide the decomposition parameters Q and r of TQWT to obtain the optimal combination of signal decomposition parameters. The parameter optimization range of Q and r is 1 to 10, and the optimization results are shown in Figure 18. Figure 18(a) shows the maximum TSCK discrete data distribution of each subband after TQWT decomposition under different [Q r] parameter combinations. Figure 18(b) shows the result of 3D interpolation smooth fitting. Figure 18(c) shows the projection of Figure 18(b) on the 2D dimensional plane, and Figure 18(d) shows the grid division results of the parameter plane for the convenience of parameter selection. From Figure 18(d), it can be clearly seen that the optimal combination of TQWT decomposition parameters [Q r] that make the maximum value of TSCK index region is [4 7].
Analysis results of the second group of experimental signals by the proposed method: (a) the maximum TSCK distribution of each subband after TQWT decomposition under different [Q r], (b) the result of 3D interpolation smooth fitting, (c) the projection on the 2D dimension plane of (b), and (d) grid generation result of parameter plane.
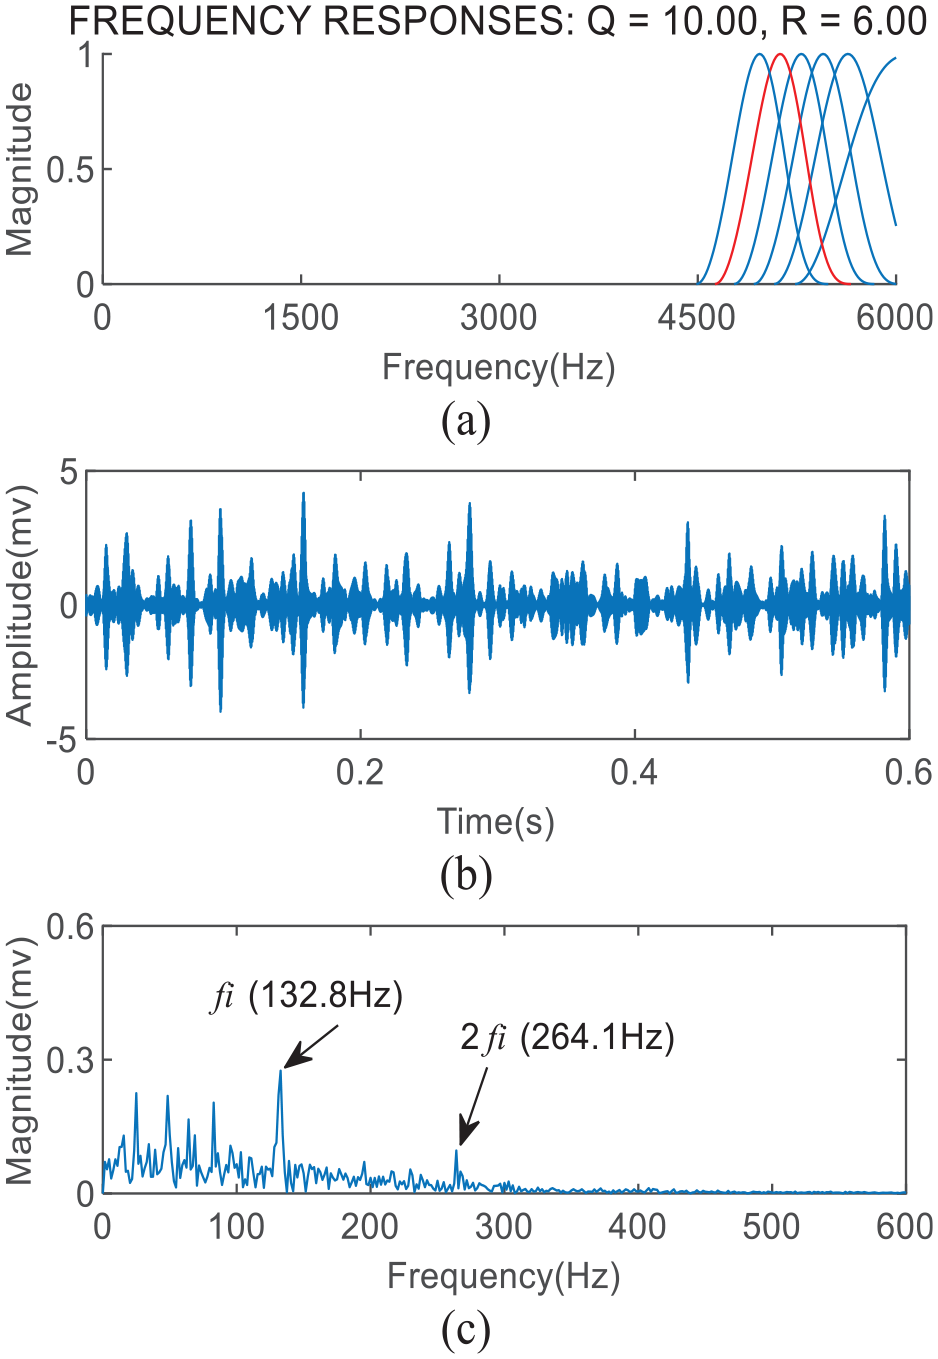
The TQWT with the combination of Q and r values as [4 7] decomposes the second group of experimental signals. Its frequency response results are shown in Figure 19(a). The TSCK value of the fifth subband is the largest. The time-domain waveform and envelope spectrum of the subband are shown in Figure 19(b) and (c). The time-domain signals contain periodic impulse components, and the fault characteristic frequency and its double frequency components can be extracted from the envelope spectrum.
(a) Frequency responses with parameter combination [4 7], (b) time-domain waveform of the selected subband, and (c) envelope spectrum of (b).
Signal analysis of wheelset bearing experiment
In order to verify the effectiveness of the proposed method on the wheelset bearing experiment signals, the experiment is carried out on the experimental platform as shown in Figure 20(a). The bearing with inner ring failure is shown in Figure 20(b). Vibration acceleration sensor is installed on the wheelset bearing seat. The sampling frequency is 25.6 kHz. The shaft rotational speed is set to 465 rpm (
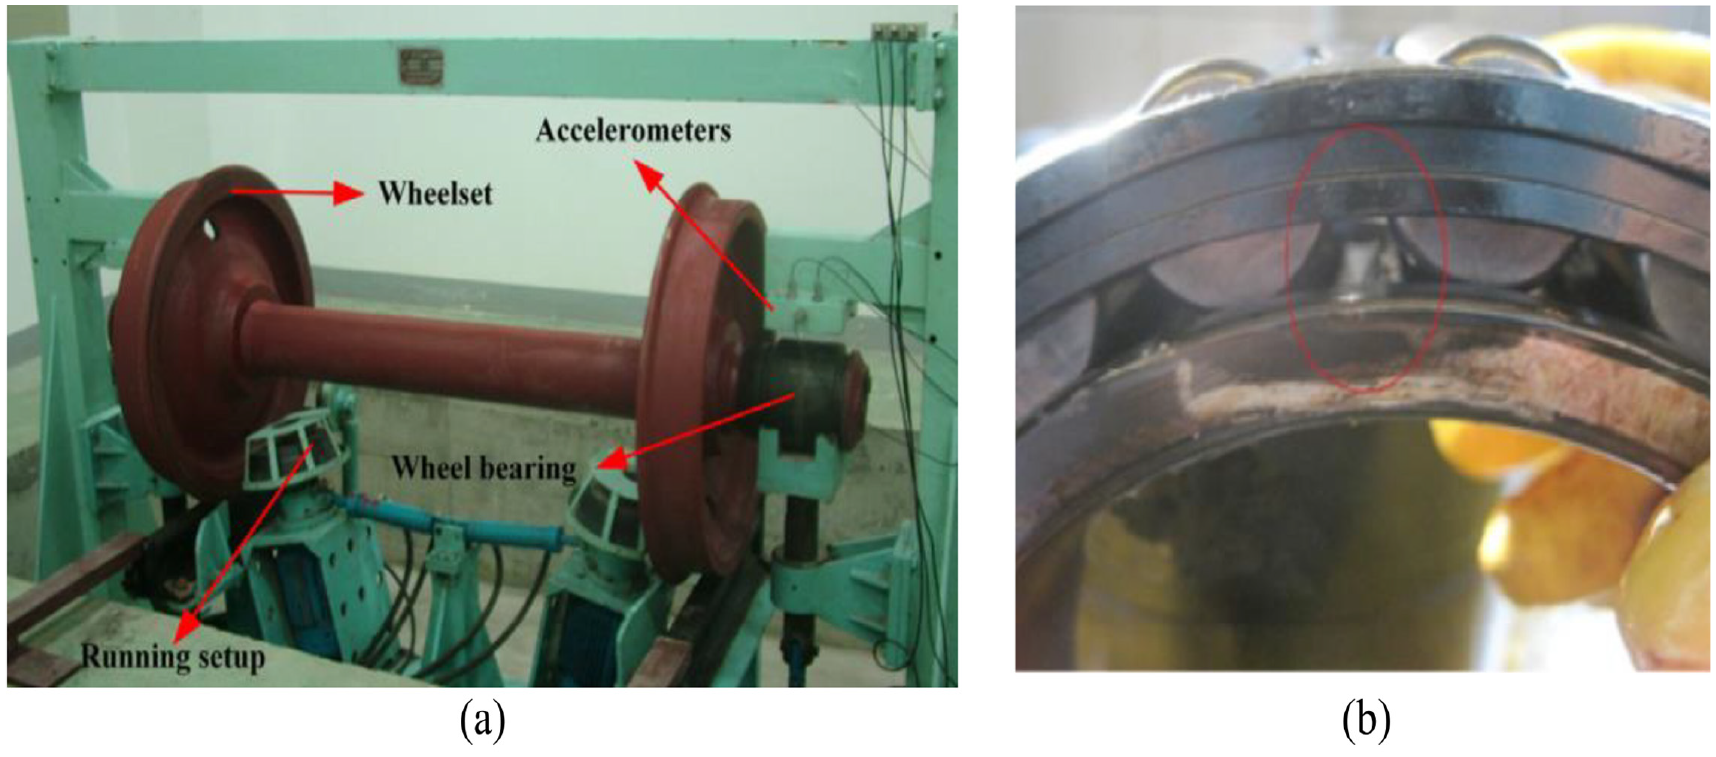
(a) Wheelset experiment platform, and (b) bearing with inner ring fault.
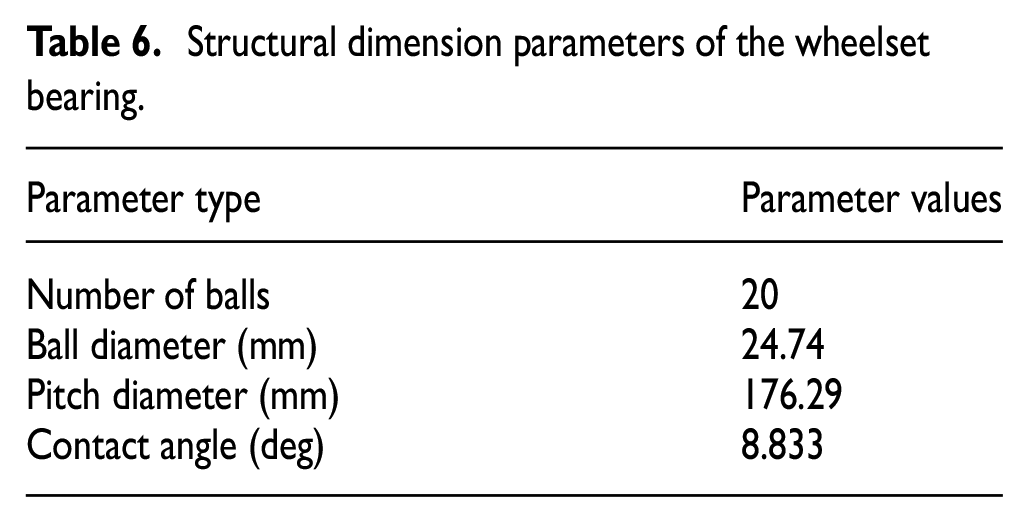
Structural dimension parameters of the wheelset bearing.
Theoretical fault characteristic frequencies of the wheelset bearing.
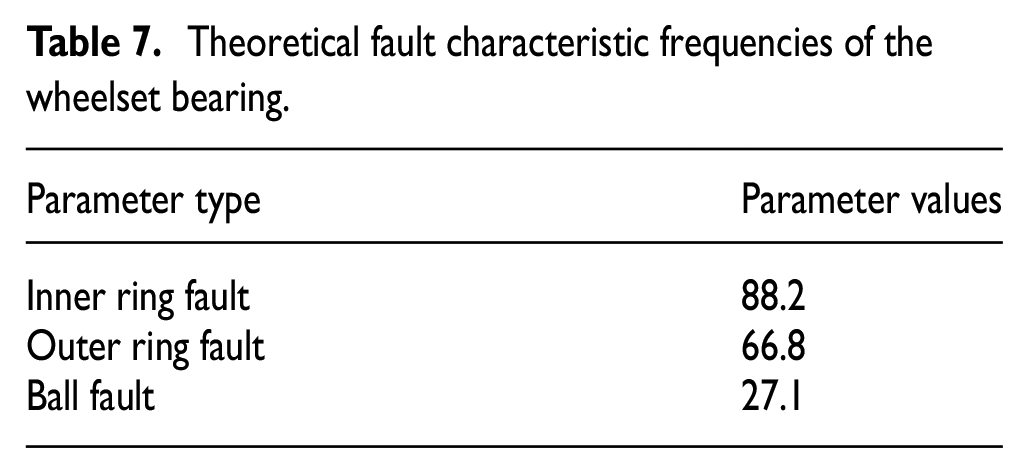
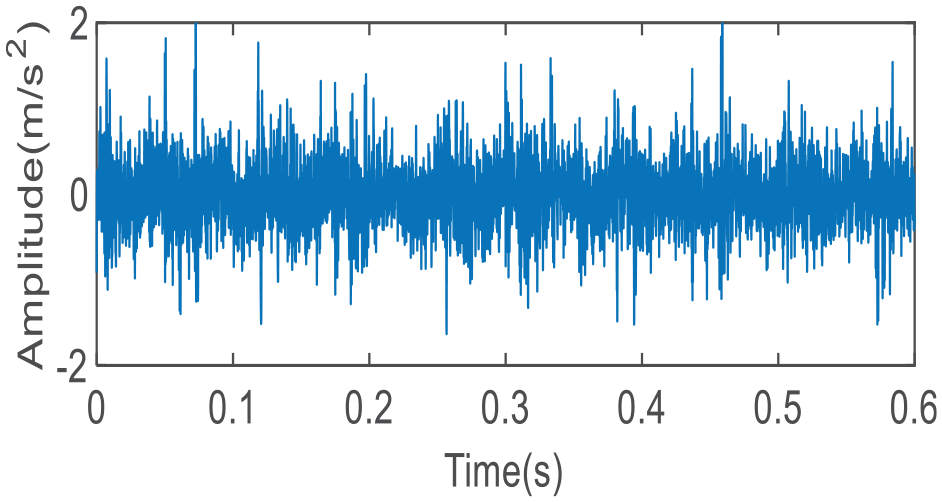
Time-domain waveform of the wheelset bearing signals.
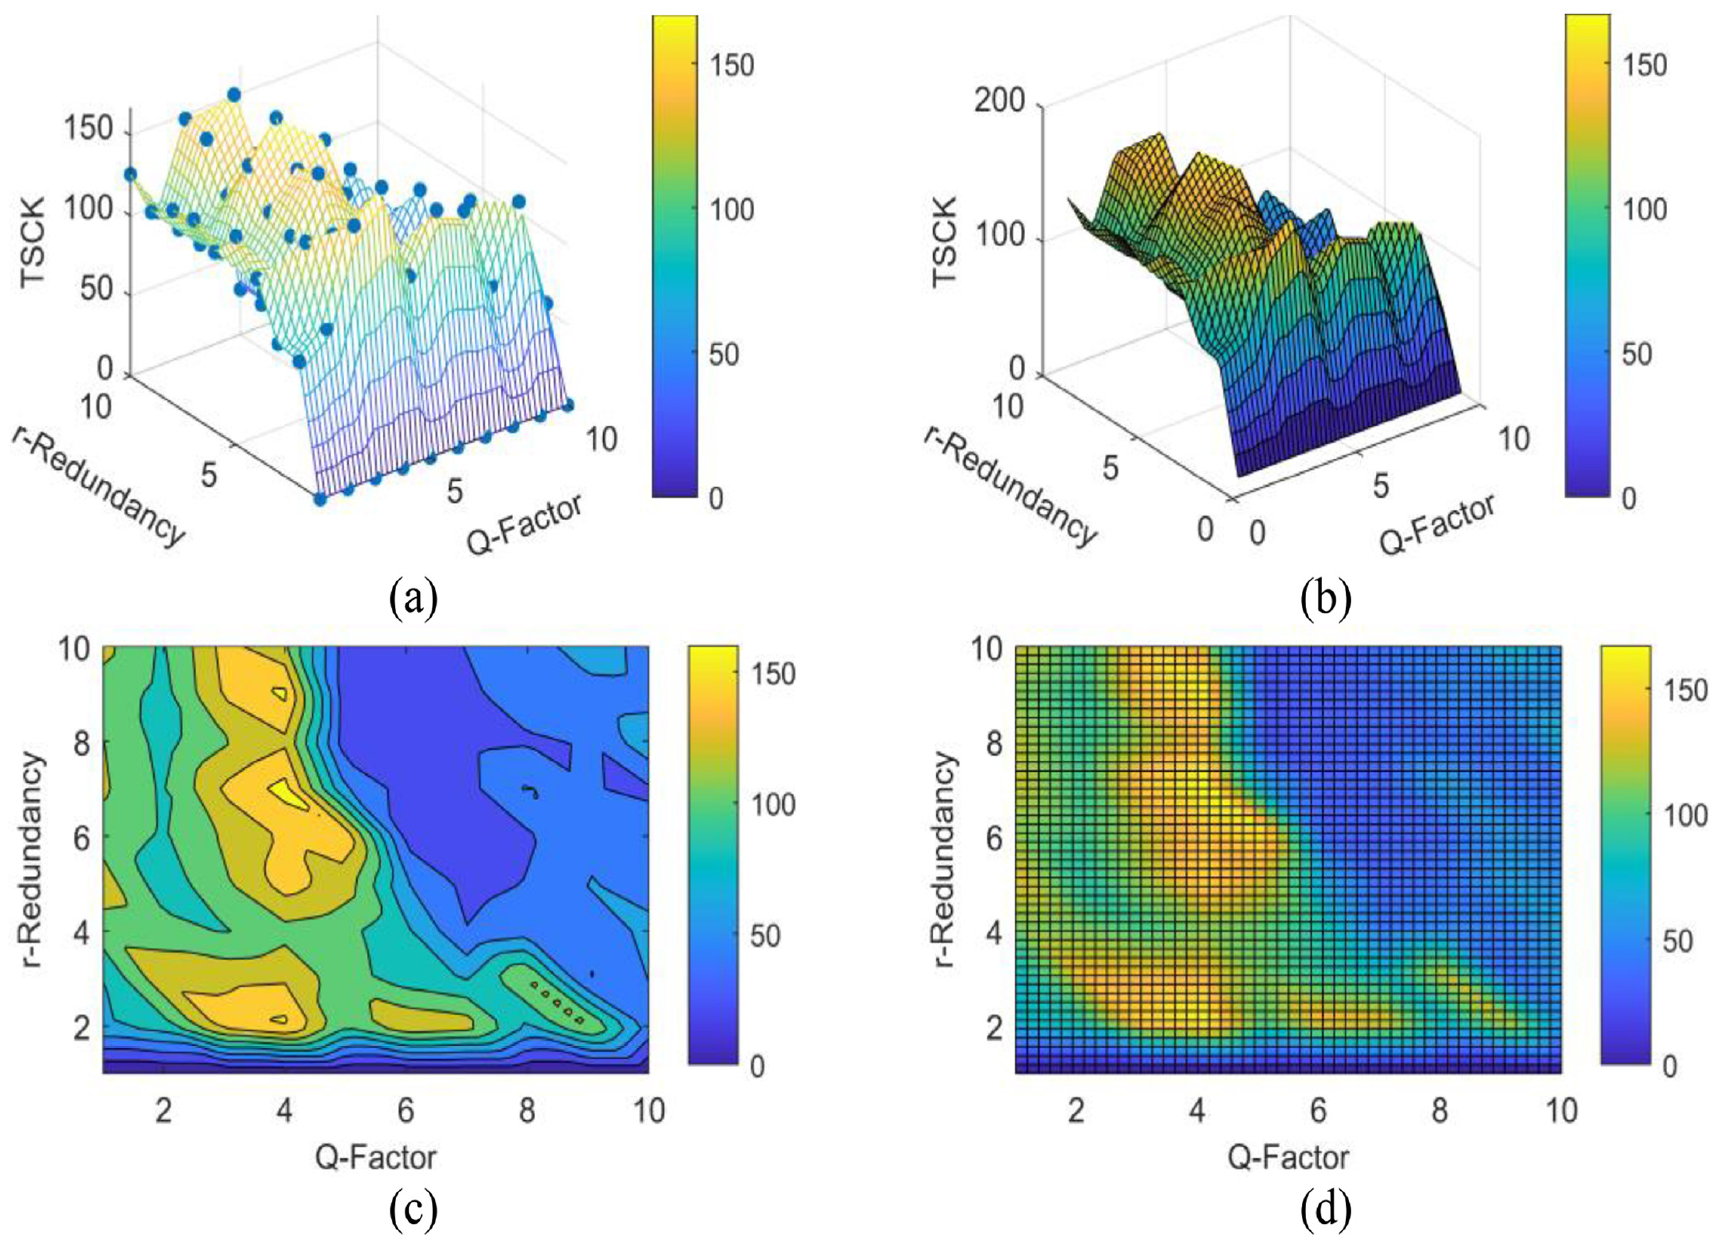
The method proposed in this paper is used to analyze the experimental signal of wheelset bearing. TSCK is used to guide the decomposition parameters Q and r of TQWT to obtain the optimal combination of signal decomposition parameters. The parameter optimization range of Q and r is 1 to 10, and the optimization results are shown in Figure 22. Figure 22(a) shows the maximum TSCK discrete data distribution of each subband after TQWT decomposition under different [Qr] parameter combinations. Figure 22(b) shows the result of 3D interpolation smooth fitting. Figure 22(c) shows the projection of Figure 22(b) on the 2D dimensional plane, and Figure 22(d) shows the grid division results of the parameter plane for the convenience of parameter selection. From Figure 22(d), it can be clearly seen that the optimal combination of TQWT decomposition parameters [Qr] that make the maximum value of TSCK index region is [10 2].
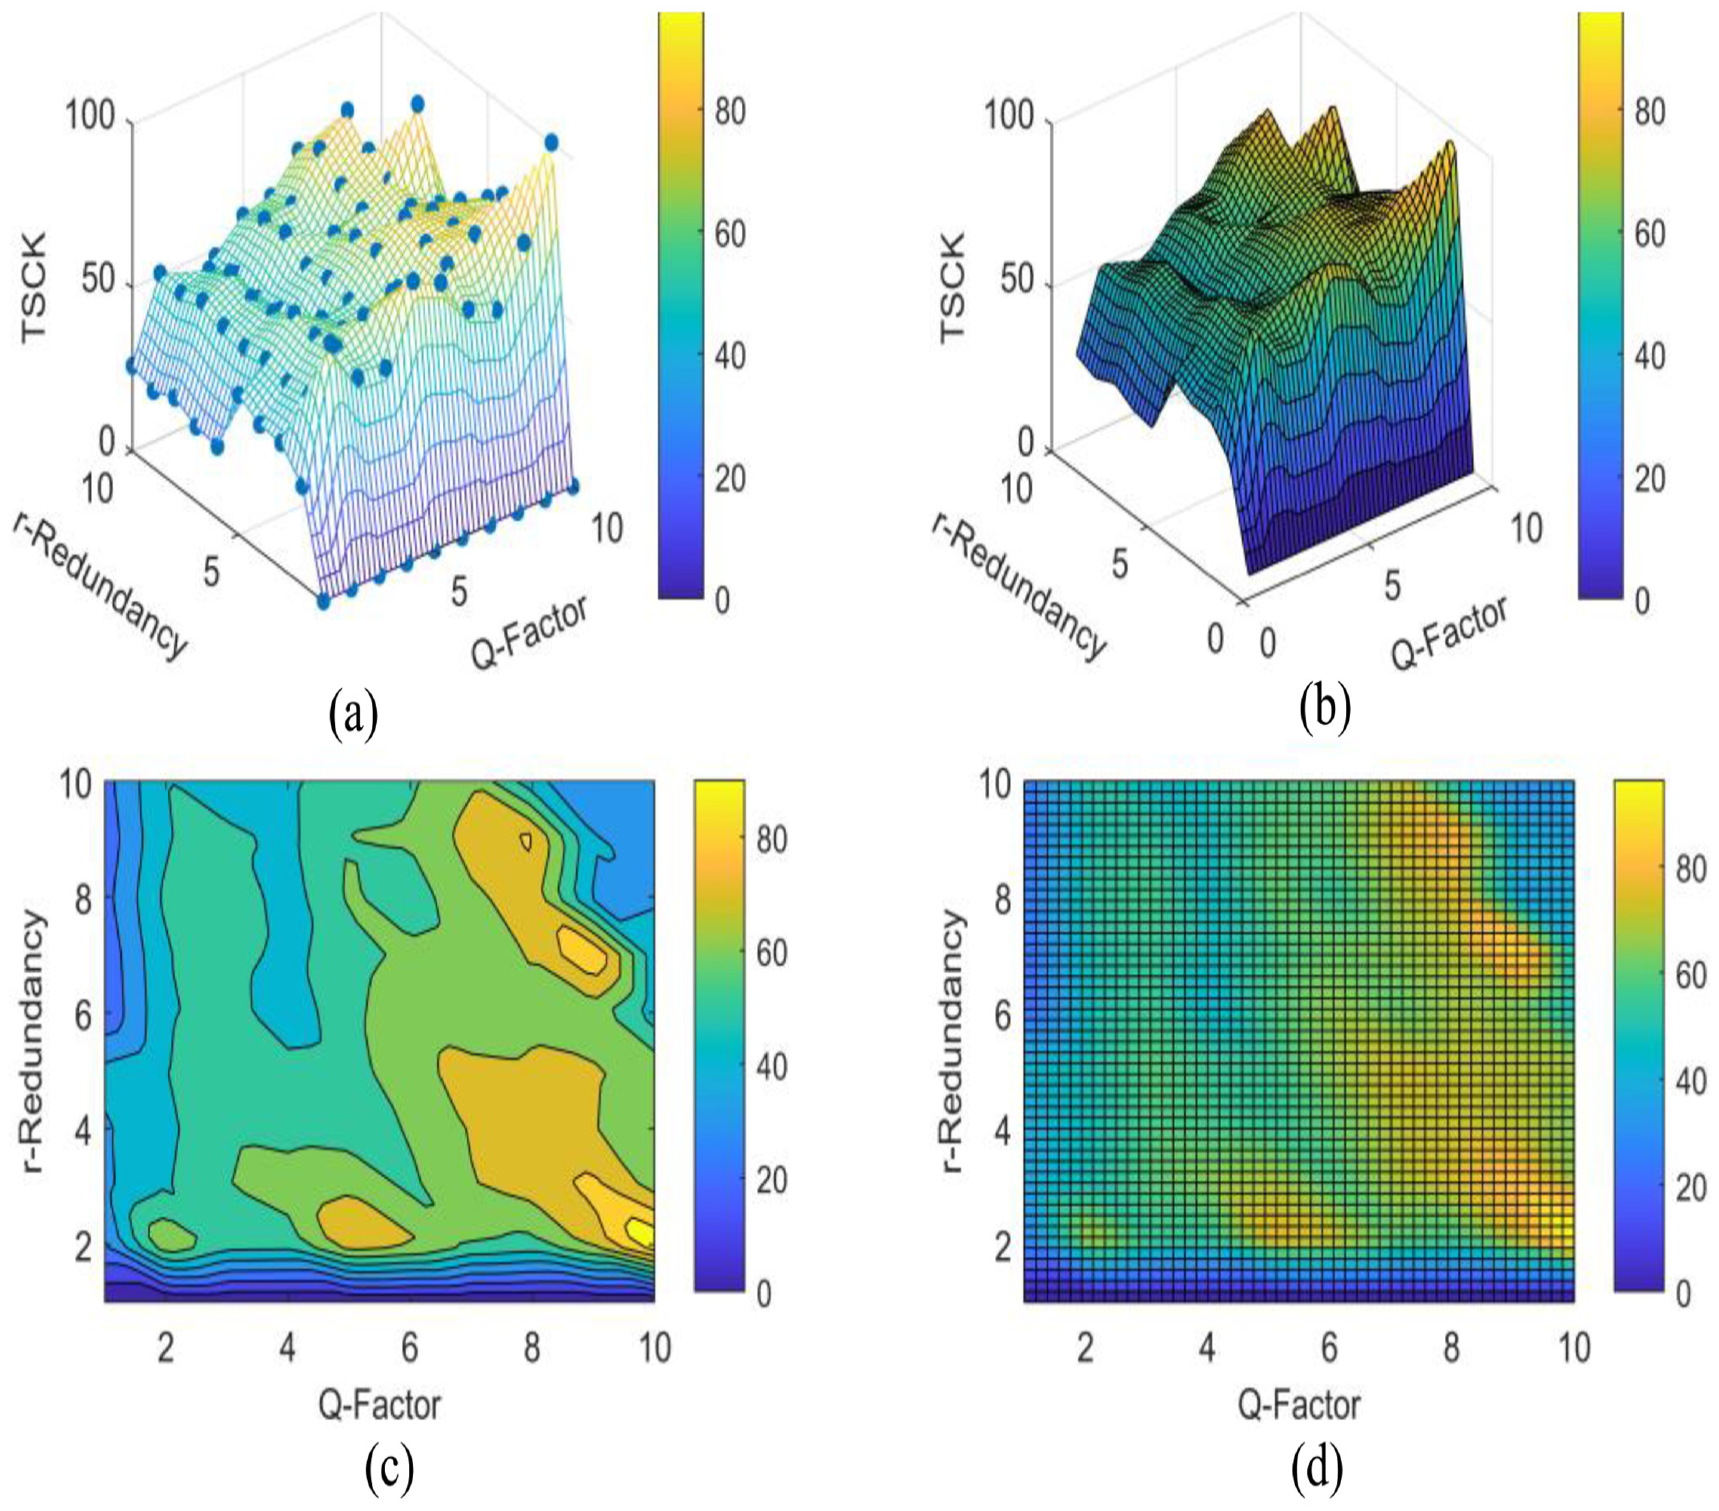
Analysis results of the wheelset bearing signals by the proposed method: (a) the maximum TSCK distribution of each subband after TQWT decomposition under different [Q r], (b) the result of 3D interpolation smooth fitting, (c) the projection on the 2D dimension plane of (b), and (d) grid generation result of parameter plane.
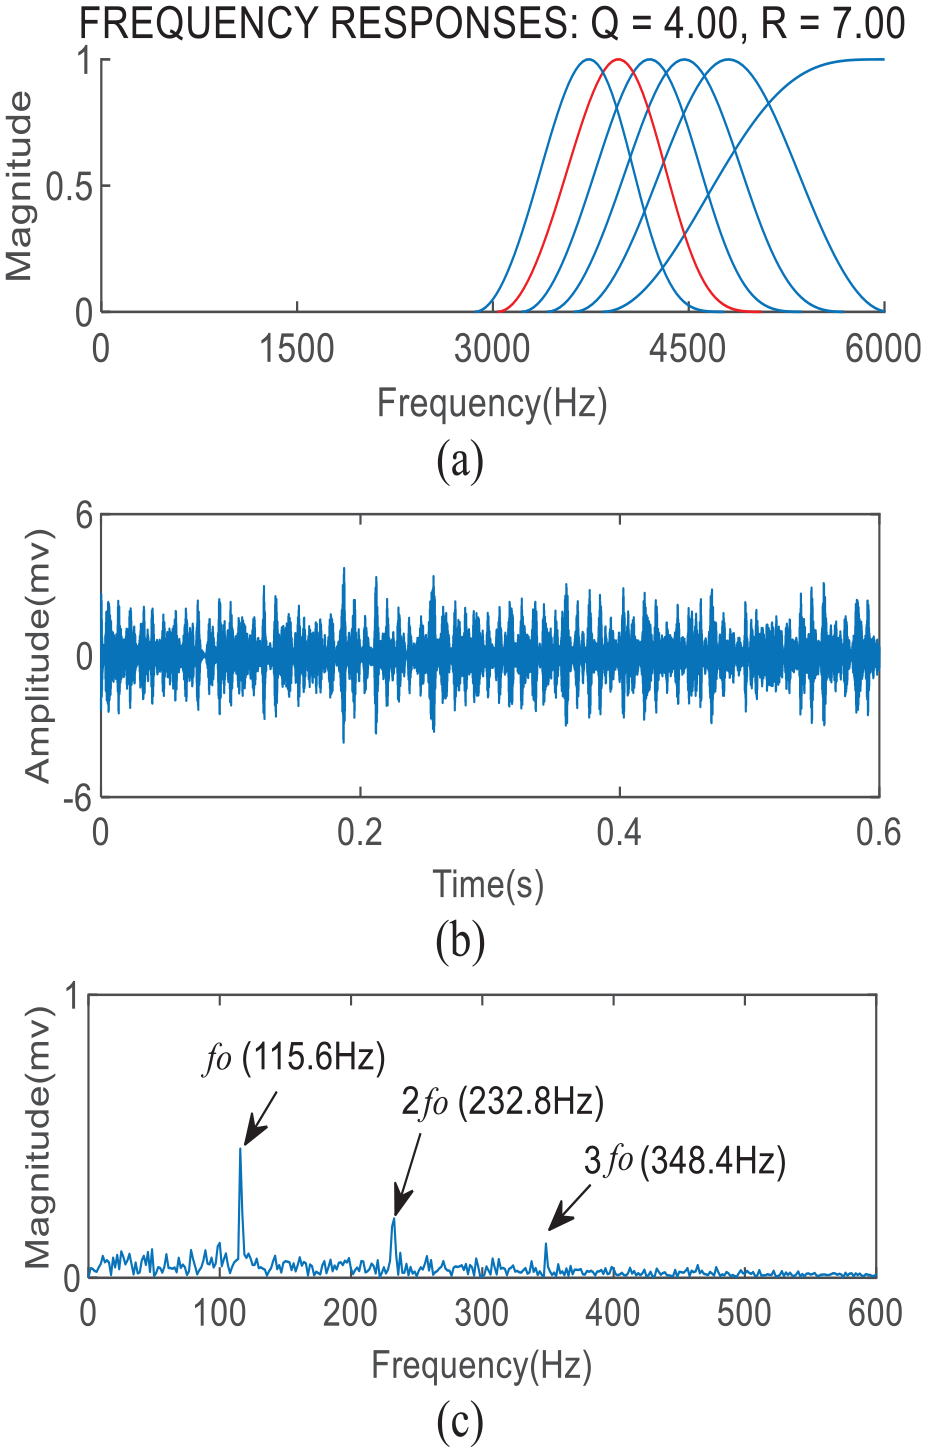
The combination of Q and r parameters of TQWT is set as [10 2] to analyze the experimental signal of wheelset bearing. Its frequency response results are shown in Figure 23(a). The TSCK value of the sixth subband is the largest. The time-domain waveform and envelope spectrum of the subband are shown in Figure 23(b) and (c). The time-domain signals contain periodic impulse components, and the fault characteristic frequency and its double frequency components can be extracted from the envelope spectrum.
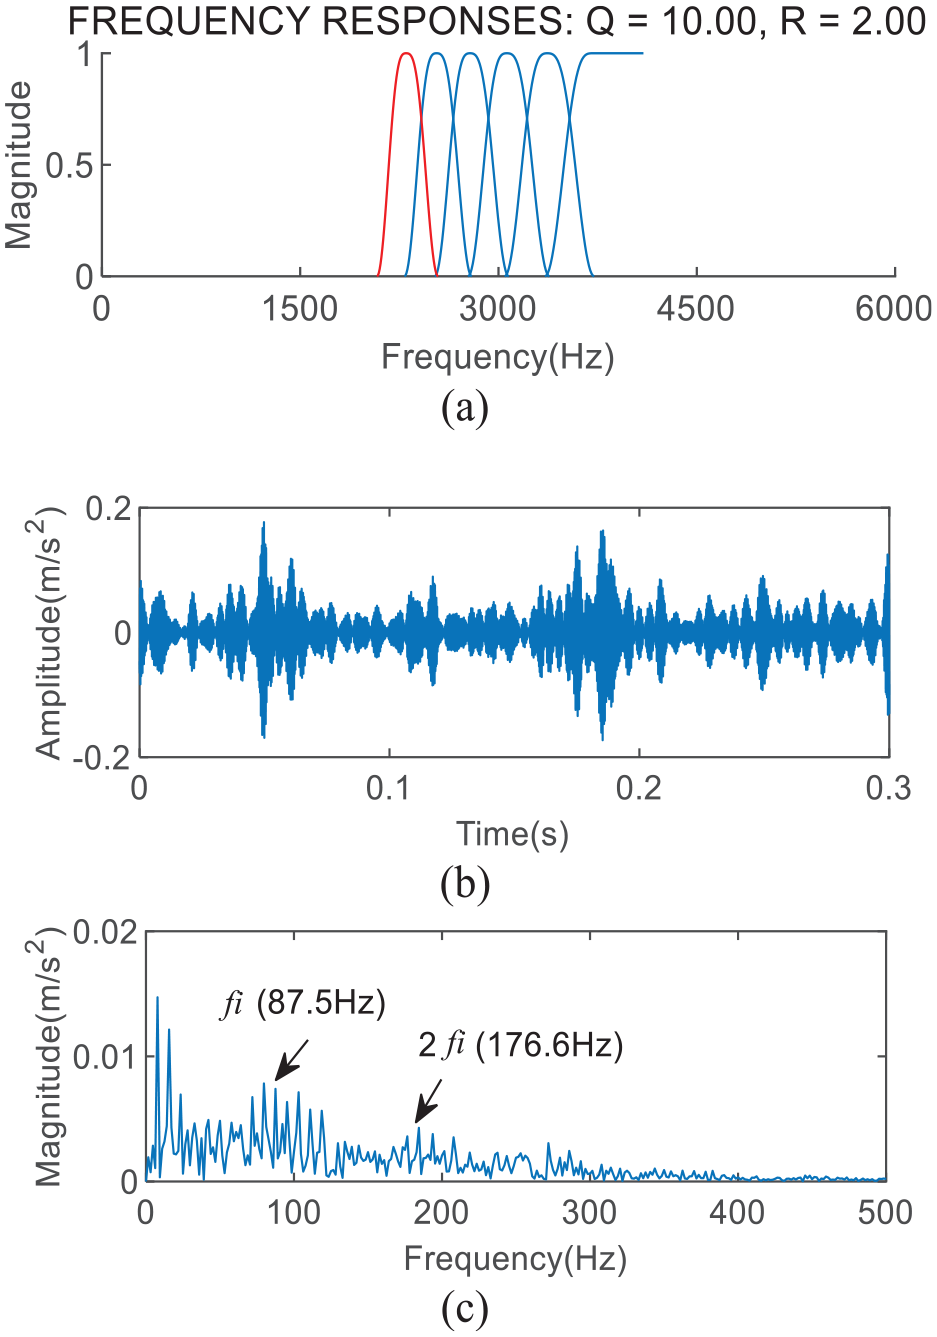
(a) Frequency responses with parameter combination [10 2], (b) time-domain waveform of the selected subband, and (c) envelope spectrum of (b).
Conclusions
The running state of the wheelset bearing is related to the running safety of the vehicle, and the vibration signal is a typical medium in the wheelset bearing monitoring. To solve the problem that it is difficult to extract the fault features of wheel bearing vibration signals due to the coupling interference of nonlinear, nonstationary, subgrade vibration and transmission path, this paper proposes a fault feature extraction method based on TSCK guided parameter convex optimization TQWT. This method constructs the TSCK which is particularly sensitive to the periodic impulse components of wheelset bearing fault as the objective function and combines with the parameter convex optimization method to find the key parameter combination (Q*r*) of TQWT, so as to achieve the goal of optimal sparse decomposition and feature extraction of the signals. Through the analysis of simulated signals and experimental signals, the advantages of the proposed method in dealing with the interference of nonperiodic transient impulse components, harmonic components, and noise components are verified.
Footnotes
Author contributions
Xiong Zhang: Data curation, Investigation; Shuting Wan: Validation, Funding acquisition; Xiong Zhang and Wenbo Wu: Formal analysis; Xiong Zhang and Jialu Li: Writing – original draft, Writing – review & editing.
Declaration of conflicting interests
The author(s) declared no potential conflicts of interest with respect to the research, authorship, and/or publication of this article.
Funding
The author(s) disclosed receipt of the following financial support for the research, authorship, and/or publication of this article: This work was supported by the National Natural Science Foundation of China (No. 52105098), the Natural Science Foundation of Hebei Province (No. E2021502038), the Fundamental Research Funds for the Central Universities (No. 2020MS111), and Science and Technology Plan Basic Research Foundation of Baoding City (2172P010).