
Abstract
Accurate diagnosis of the damage location of the frame structure is very important for the overall damage assessment and subsequent maintenance of the frame structure. However, the frame structure generally works in the noise environment, which increases the difficulty of health monitoring and fault diagnosis of frame structure based on vibration data. In order to realize the accurate damage location diagnosis of structural frame under noise environment, this paper proposes a fault diagnosis method based on wavelet denoising, convolutional neural network, Inception module, and long short-term memory (LSTM) on the basis of complete ensemble empirical mode decomposition with adaptive noise (CEEMDAN). In order to verify the effectiveness and superiority of the method proposed in this paper, the 4-story steel frame model of the University of British Columbia is taken as the research object, and the experiments are carried out with the method proposed in this paper, and under the same conditions, the comparative experiments are carried out with other similar methods. The experimental results show that the method proposed in this paper not only has high accuracy, but also has strong anti-noise ability, and its performance is better than other similar methods. Therefore, the fault diagnosis method proposed in this paper can effectively perform the accurate diagnosis of damage location of frame structure under noise environment.
Keywords
Introduction
As an important support, frame structure is widely used in civil engineering, mechanical engineering, aerospace, and other fields. 1 During the working process, due to heavy load, corrosion, and other reasons, the frame structure will be damaged or even collapsed, resulting in incalculable economic losses and major accidents to personnel. 2 Therefore, the health monitoring and fault diagnosis of frame structure is of great significance to ensure the safety of people’s lives and property. For frame structure, the common health monitoring and fault diagnosis method is to place acceleration sensors at key locations of the frame structure, and use appropriate signal processing methods to conduct health monitoring and fault diagnosis based on the collected vibration signals. 3 For health monitoring and fault diagnosis based on vibration signals, early methods include wavelet4,5 analysis, Fourier transform,6,7 cepstrum,8,9 etc. With the progress of science and technology, scientists have introduced some more excellent methods into structural health monitoring and fault diagnosis, such as k-means10,11 algorithm, support vector machines,12,13 artificial neural network14,15 and principal component analysis.16,17 Although the above methods have been widely used for structural health monitoring and fault diagnosis and achieved good application results, with the arrival of the big data era, massive vibration data, complex signal characteristics and fault types, and intelligent requirements for structural health monitoring and fault vibration make the above methods difficult to apply. Therefore, it is necessary to provide new methods for structural health monitoring and fault diagnosis to meet the requirements of the new era.
With the development of computer hardware and computing power, deep learning has been rapidly developed, which makes artificial intelligence usher in the third development boom. The main task of deep learning is to build a deep neural network and use a large number of sample data as input to obtain a model with strong analysis and recognition capabilities. Since deep learning was proposed, it has been successfully applied to image processing,18–20 object detection,21–23 speech recognition,24–26 natural language processing,27,28 and other fields. With the continuous development of deep learning, more and more scholars have applied it to the field of structural health monitoring and fault diagnosis. For fault diagnosis, the fault diagnosis of rotating machinery is a hot topic that cannot be avoided. The fault diagnosis of rotating machinery based on deep learning has been studied in depth and achieved fruitful results. In order to improve the accuracy and anti-noise ability of bearing fault diagnosis, Zhang et al. 29 proposed a network model named convolutional neural network with training interference (TICNN) based on convolutional neural network (CNN). Based on CNN, Ahmed and Nandi 30 extracted and classified the features of vibration gray images separated by RGB pixels, proposed a fault diagnosis algorithm named RGBVI-CNN, and applied it to the fault diagnosis of bearings, and achieved satisfactory results. Aljemely et al. 31 presented a wise local response CNN-based Naïve Bayes algorithm to solve the problems of noise and nonlinearity in fault diagnosis, and applied it to bearing fault diagnosis. In order to improve the accuracy of gearbox fault diagnosis, Chen et al. 32 proposed a deep learning algorithm based on the collected vibration signals, and used CNN to realize the recognition and classification of gearbox faults. In order to directly extract salient features from frequency domain signals and eliminate excessive use of manual features, Liu et al. 33 proposed a fault diagnosis method for gearbox based on deep learning method by using stacked automatic encoder.
In the past decade, deep learning has also been deeply studied and successfully applied to the field of structural health monitoring. Faced with a large number of collected sensor data and noise pollution, Dang et al. 34 developed a practical end-to-end structural health monitoring framework based on CNN and long short-term memory (LSTM), and used three case studies of different types of structures to prove the applicability and effectiveness of the proposed method. Facing the problem that structural health monitoring needs time-consuming measurement, Seventekidis et al. 35 proposed a method based on deep learning that data only comes from finite element calculation. In order to solve the problem of using unmanned aerial vehicles (UAVs) to collect data from key positions of structures, Kang and Cha 36 proposed a damage detection method based on deep CNN on the basis of using ultrasonic beacons instead of GPS to collect data from autonomous UAVs. In the framework of structural health monitoring, based on the parameterized model reduction technology and full CNN, Rosafalco et al. 37 proposed a simulation-based classification strategy to achieve online damage location. Abdeljaber et al.38,39 conducted fault diagnosis researches on grandstand frame and 4-storey frame structure by using one-dimensional convolutional neural network (1DCNN) in 2017 and 2018 respectively. However, it has poor anti-noise ability and needs a lot of manual data processing. Therefore, it is necessary to propose more excellent methods to reduce manual data processing and improve anti-noise ability, so as to realize accurate fault diagnosis of frame structure under noise environment.
Although the 1DCNN has strong and invisible feature extraction ability, the CNN extracts the feature information in the vibration data by using the convolutional kernel sliding method, thus splitting the correlation information of the feature changes before and after the vibration signal. Because the frame structure is complex, there are many kinds of faults and the vibration data of different damage locations are similar, it is necessary to improve the feature extraction ability of CNN to ensure the accuracy of damage diagnosis. Inception module 40 can extract multi-scale feature information, which can increase the feature extraction ability of neural network. Therefore, in this paper, the Inception module was embedded into the CNN to increase the accuracy of damage diagnosis. In addition, in the face of the problem that the vibration signal contains noise, which leads to the similarity of fault signal samples, the CNN is difficult to effectively classify features, which leads to the failure of fault diagnosis. In order to solve this problem, before the vibration signal enters the CNN, the signal needs to be de-noised. Therefore, this paper used complete ensemble empirical mode decomposition with adaptive noise (CEEMDAN) 41 and wavelet de-noising to filter the vibration signal. However, wavelet de-noising will lead to the problem of reducing the feature information extracted by the neural network. For this reason, this paper added LSTM 42 to the CNN model to extract more time-domain periodic and continuous features from the information after wavelet de-noising, so as to compensate for the lost feature information. For the above reasons, In order to improve the accuracy of damage location diagnosis of frame structure under noise environment, this paper proposed a fault diagnosis method based on wavelet denoising and CNN on the basis of CEEMDAN. The basic principle of this method is to use CEEMDAN and adaptive wavelet analysis to filter the noise in the signal, and use the CNN embedded with Inception module and LSTM to improve the classification accuracy of the model. In addition, in order to effectively avoid the overall misjudgment problem caused by using single sensor data for damage location diagnosis, an integrated damage location diagnosis method was proposed. Taking the four story steel frame model 43 of the University of British Columbia as the research object, the method proposed in this paper was tested and compared with other methods. The experimental results show that the method proposed in this paper not only has high accuracy, but also has strong anti-noise ability, and its performance is better than other similar methods.
In the rest of the paper, the source, size and composition of the frame structure model are introduced in Section ‘Description of the research object’, and nine damage cases of the frame structure are given. Section ‘Data preprocessing and denoising method’ introduces the preprocessing method of vibration signal and the generation of noise; based on this, CEEMDAN and adaptive wavelet analysis are used to decompose and reconstruct the signal to filter the noise. Section ‘convolutional neural network implanted with Inception and LSTM’ presents the improved TICNN named convolutional neural network implanted with Inception and LSTM (ILCNN) and analyzes its performance. The integrated damage location diagnosis results of the frame structure are obtained in Section ‘Integrated diagnosis results of damage location’, and the method proposed in this paper is compared with other similar methods in terms of accuracy and anti-noise ability. Section ‘Conclusions’ summarizes this paper and draws relevant conclusions.
Description of the research object
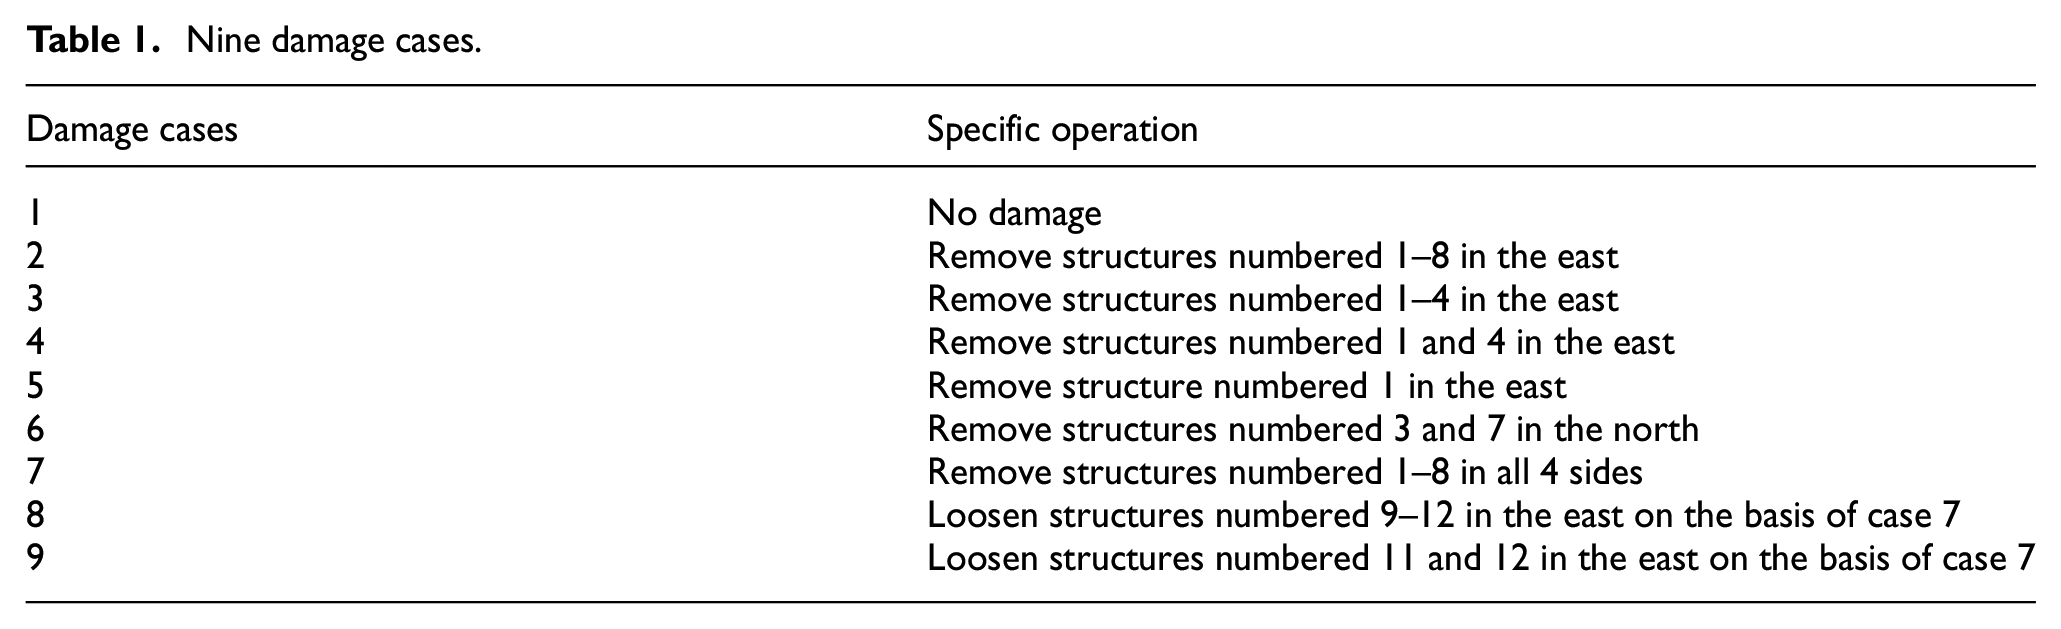
The frame structure model studied in this paper is a four story steel frame structure built by the University of British Columbia. Its structure is shown in Figure 1, 43 with a height of 3.6 m and a square bottom of 2.5 m × 2.5 m. It is composed of four faces: east, south, west, and north. The structural dimensions of each face are the same, so the same position is represented by the same code. Fifteen acceleration sensors were placed on the frame structure model, and three acceleration sensors were installed on each floor starting from the first floor: one acceleration sensor was installed in the west, one acceleration sensor was installed in the east, and the other acceleration sensor was installed near the central column. The acceleration sensors numbered 1–3 were placed at the ground base of the bottom layer, and the rest were placed on the top of each floor. Nine structural damage cases of frame structure were simulated by removing and loosening corresponding structures, as shown in Table 1.
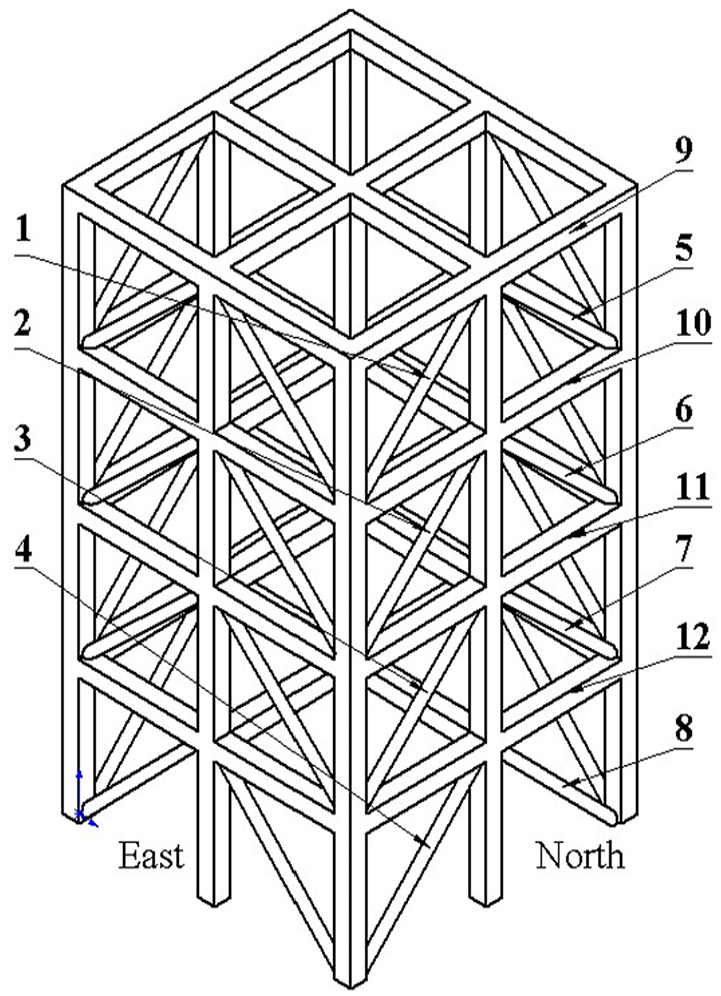
Frame structure model.
Nine damage cases.
Data preprocessing and denoising method
Data preprocessing
Data enhancement
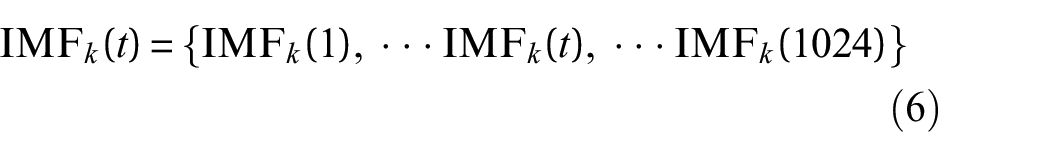
The fitting effect and generalization ability of CNN depend on the number of training samples. The more layers of the neural network, the stronger the ability of feature extraction. At the same time, the more data samples are needed to be trained in the neural network. In the actual engineering, it is impossible to spend a lot of time to collect vibration data, so it is necessary to enhance the data of the vibration signals collected at limited time. The most commonly used and effective data enhancement method is sliding window repeated sampling. Its principle is to create a sliding window with a length of l and to slide clip the original signal with a sliding step b. The number of samples clipped can be obtained.
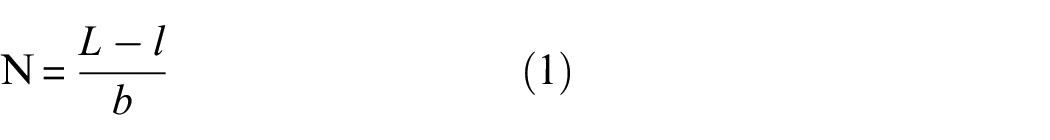
where N is the number of samples and L is the length of the original signal. The length of the input data samples of neural network can be obtained by changing the size of l, and the number of samples can be obtained by changing the size of b. When b = 1, the maximum number of samples under a certain window length l can be obtained.
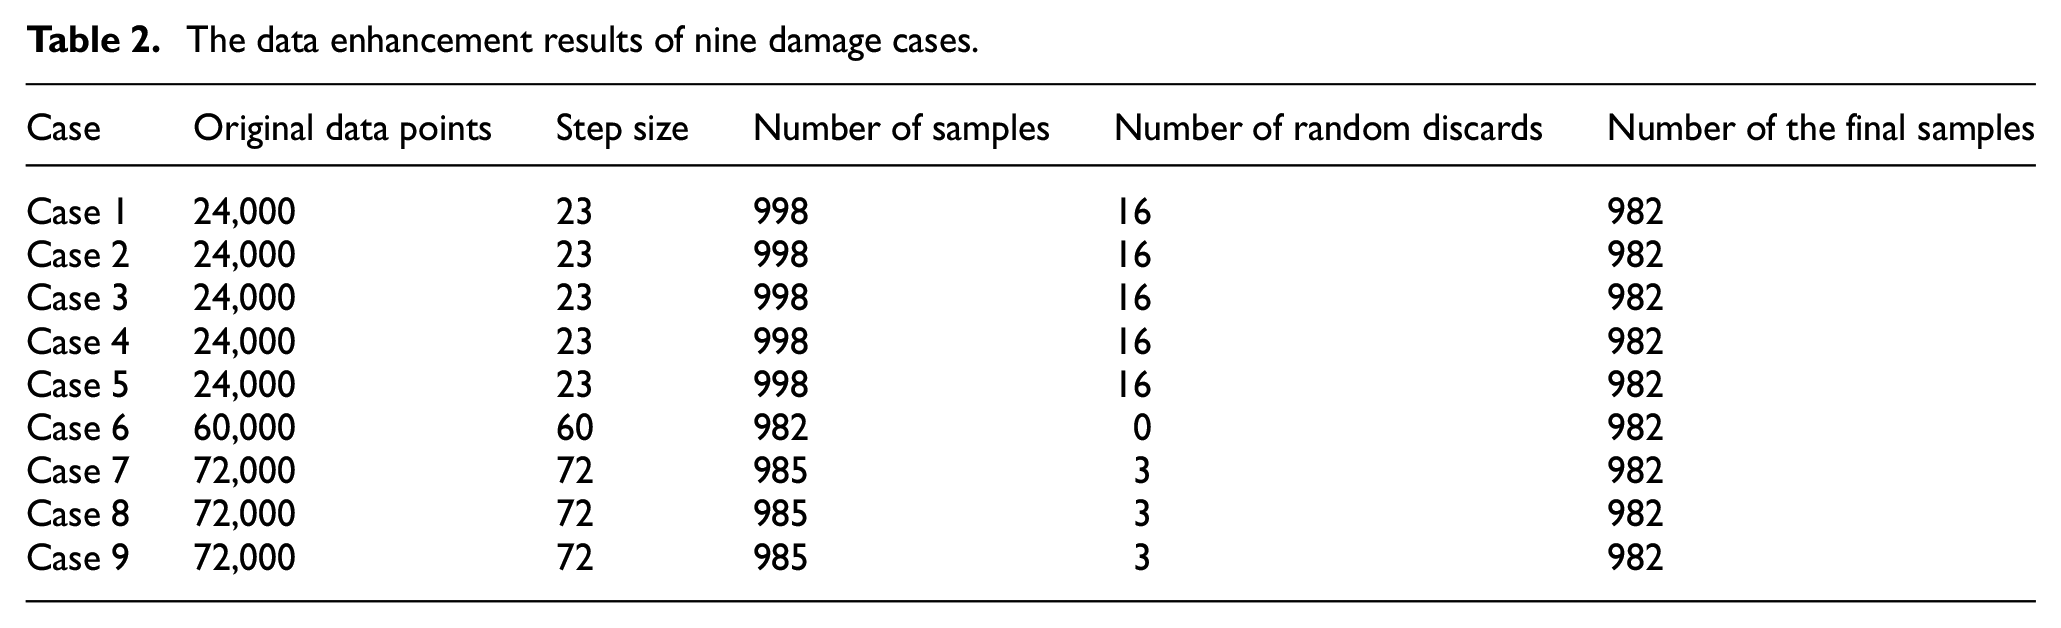
Since the data points of nine damage cases in the original data collected by each sensor are inconsistent (the original data points in cases 1–5 is 24,000, in case 6 is 60,000 and in cases 7–9 is 72,000), and the imbalance of the number of samples will affect the generalization ability of the neural network, in order to make the number of samples of each damage case consistent, the sliding window length was set to 1024, and different sliding steps were used to cut the data of the nine damage cases, of which the sliding step in cases 1–5 was set to 23, in case 6 was set to 60 and in cases 7–9 was set to 72. The minimum number of samples obtained from the nine damage cases is the number of the final samples, and the number of the final samples is 982. The data enhancement results of nine damage cases are shown in Table 2.
The data enhancement results of nine damage cases.
After data enhancement processing, 8838 data samples were obtained from the data collected by each sensor. 80% of the total data samples were made into training dataset and test dataset, of which 70% are training sets and 30% are test sets, therefore, the number of data samples in the training dataset is 4949 and the number of data samples in the test dataset is 2121. In addition, 20% of the total data samples are reserved for the verification experiment of damage location diagnosis.
Data normalization
The purpose of data normalization is to make all feature information shrink to the approximate domain, which is conducive to feature extraction of vibration signals by CNN. Common normalization methods include gray image method and ratio method. The gray image method divides each value in the data by the maximum value in the data, so the data can be normalized to [0, 1]. This method is widely used for color image normalization. Compared with the gray image method, the ratio method is more suitable for the normalization of vibration data. This method makes up for the problem that the gray image method cannot handle data with negative values. The ratio method can normalize the vibration data to [−1, 1], but only the absolute value of a certain value in the negative or positive half axis can be normalized to 1. In order to normalize the data and regularize the data at the same time, this paper adopted a normalization method to normalize the data to [−1, 1] and regularize the data. The principle is shown in the following formula.
The above formula can normalize the maximum value of the positive value part of the vibration data to 1 and the minimum value of the negative value part to − 1, thus effectively retaining the positive and negative characteristics of the vibration data. This method compresses the amplitude of the original signal and reduces the amplitude of the larger value to 1, while retaining the phase characteristics and periodic characteristics of the original data. Therefore, it provides relatively comprehensive feature information for feature extraction of neural network.
Denoising method
The basic principle of noise reduction in this paper is described as follows. Firstly, CEEMDAN is used to decompose the original vibration signal and calculate the sample entropy of each intrinsic mode function (IMF) component; then Gaussian noise with different intensity is added to the original vibration data to simulate different noise conditions in the work environment of the frame structure, and CEEMDAN is used to decompose the vibration signal with noise and calculate the sample entropy of each IMF component. Finally, the components were denoised by wavelet denoising after comparing both the sample entropies, and all the components were reconstructed after being denoised by wavelet denoising to achieve the goal of noise reduction.
Noise signal
Due to less noise contained in the original data, in order to study the damage location diagnosis of the frame structure under the noise environment, noise signals of different intensities were added to the original data to achieve this purpose. When adding noise signals to the original data, firstly, the randn function provided by Tensorflow was used to generate a set of series Y whose length is consistent with the length of original data and whose value is between [−1, 1] and follows the standard normal distribution.

Then the coefficient k was used to control the noise intensity and add the noise to the original data.
where
Thus, it can be obtained that the intensity of the noise signal added to original data is
where
Complete ensemble empirical mode decomposition with adaptive noise
To solve the problem of mode aliasing of empirical mode decomposition (EMD) algorithm 44 used to decompose signals, scholars proposed ensemble empirical mode decomposition (EEMD) 45 and complementary ensemble empirical mode decomposition (CEEMD). 46 These two algorithms reduce the mode aliasing of EMD decomposition by adding pairs of positive and negative Gaussian white noises to the signal to be decomposed. However, there is always some white noise left in the IMF components obtained by the two algorithms, which affects the subsequent signal analysis and processing. In order to solve these problems, Torres et al. improved the above algorithm and proposed CEEMDAN algorithm. EEMD decomposition and CEEMD decomposition are used to average the modal components obtained from EMD. CEEMDAN decomposition is used to calculate the overall average after the first order IMF component is obtained to obtain the final first order IMF component, and then repeat the above operations for the residual part, thus effectively solving the transfer and transmission problem of white noise from high frequency to low frequency.
Taking a sample in the data in this paper as the research object, CEEMDAN decomposition was performed on it under the conditions of without noise and with noise respectively, and the results are shown in Figure 2. It can be seen from Figure 2 that after CEEMDAN decomposition, the IMF 1 component and IMF 2 component of signal with noise are more confused than the IMF 1 component and IMF 2 component of signal without noise. The IMF components of the two signals are relatively close starting from IMF 3. Therefore, the noise signal mainly exists in IMF 1 and IMF 2 components, and the IMF 1 component contains most of noise signals.
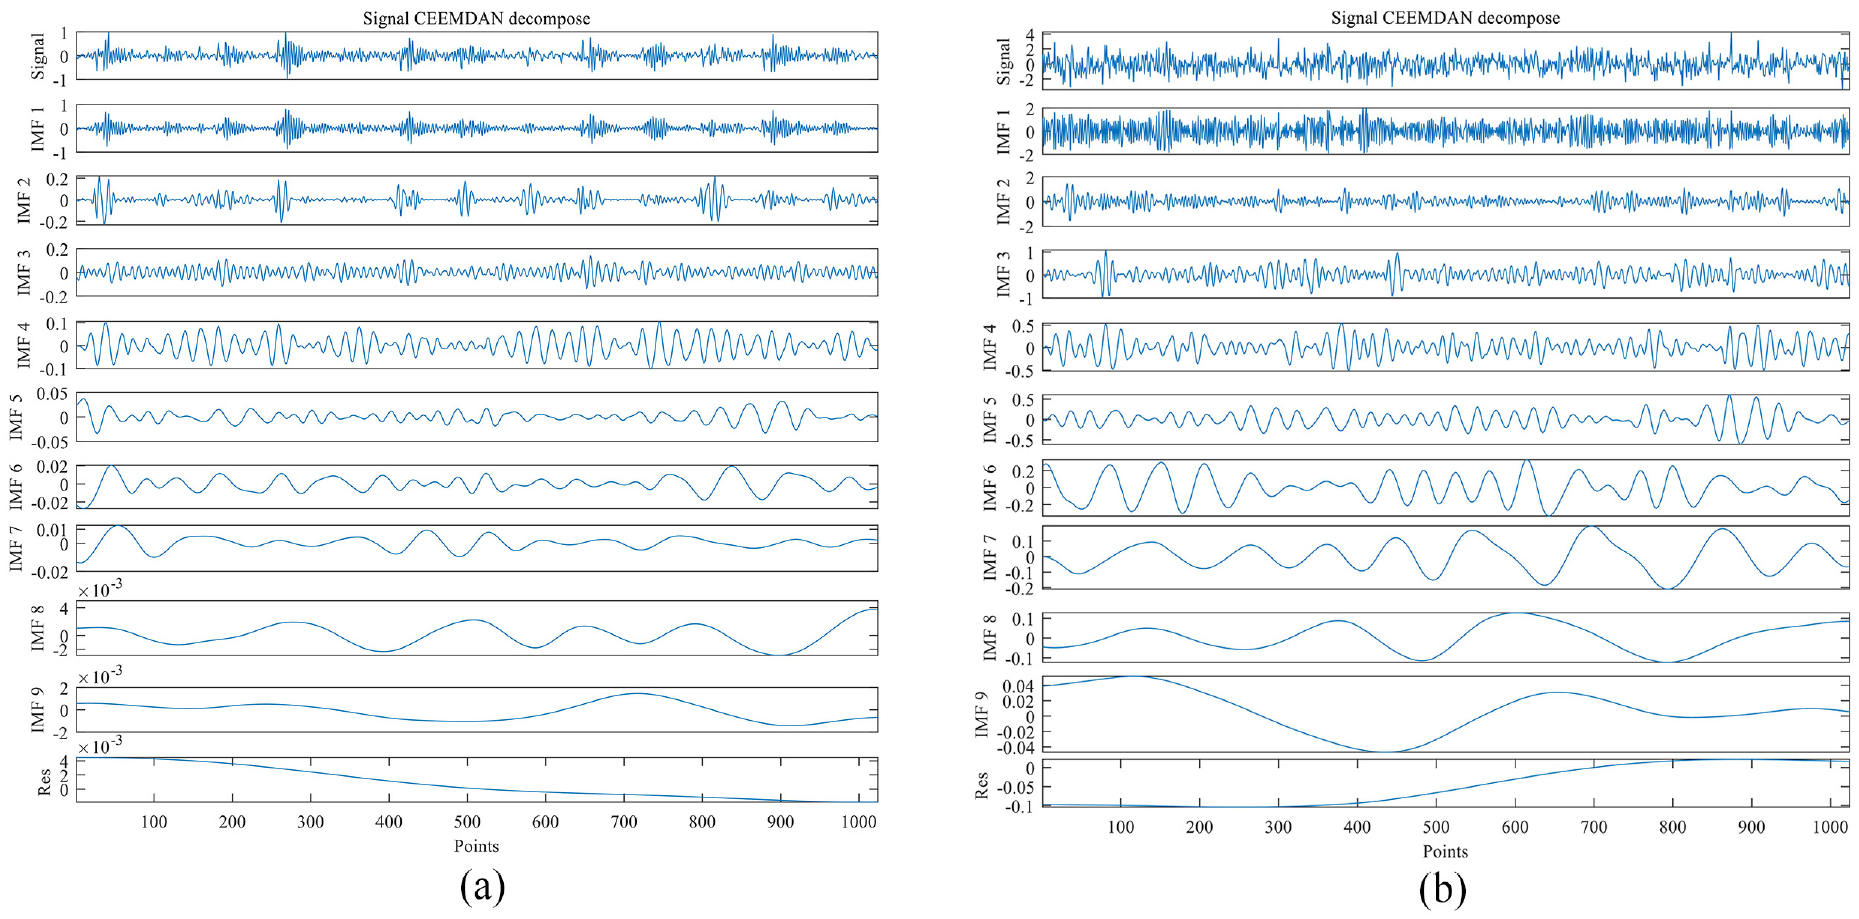
CEEMDAN decomposition of signal. (a) CEEMDAN decomposition without noise and (b) CEEMDAN decomposition with noise.
Sample entropy
The size of signal sample entropy can indicate the degree of signal confusion. The more chaotic the signal, the stronger the noise is in the signal; on the contrary, the smoother the signal, the weaker the noise is in the signal. The calculation method of sample entropy is as follows. 47
1) Suppose
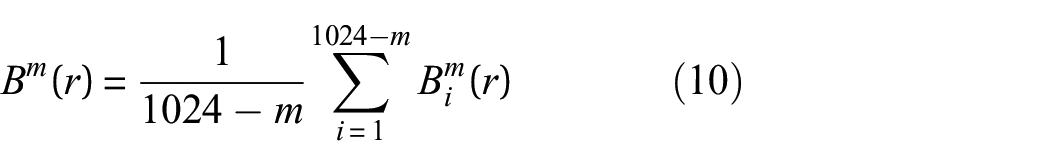
Assume that m is the dimension of reconstruction signal, then
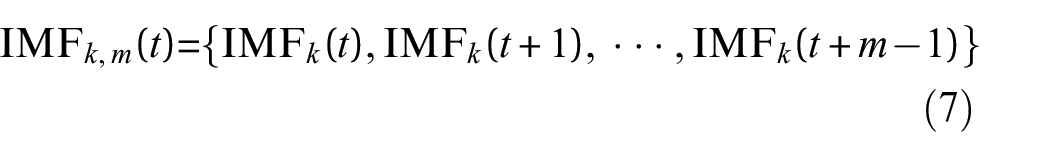
2) Use the following formula to calculate the distance between
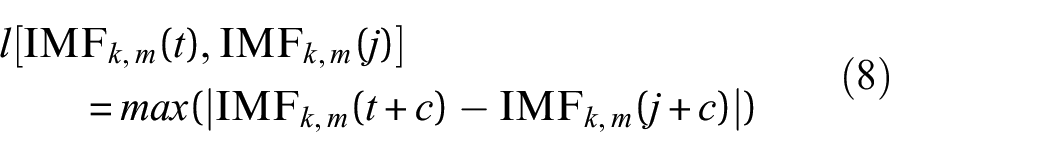
where c = 0, 1, …, m, according to the rule of thumb, m = 2.
3) Count the number that
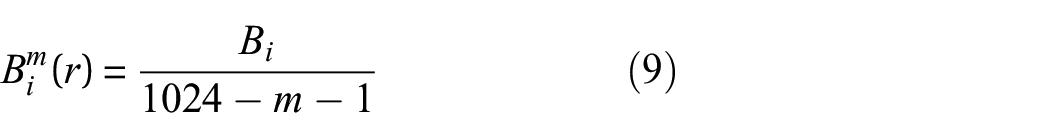
So
4) Similarly, the number whose distance between

The sample entropy of the signal decomposed by CEEMDAN in the previous section and the sample entropy of the signal under different intensity noise conditions can be calculated by the above formula, and the results are shown in Table 3.
Calculation results of sample entropy.
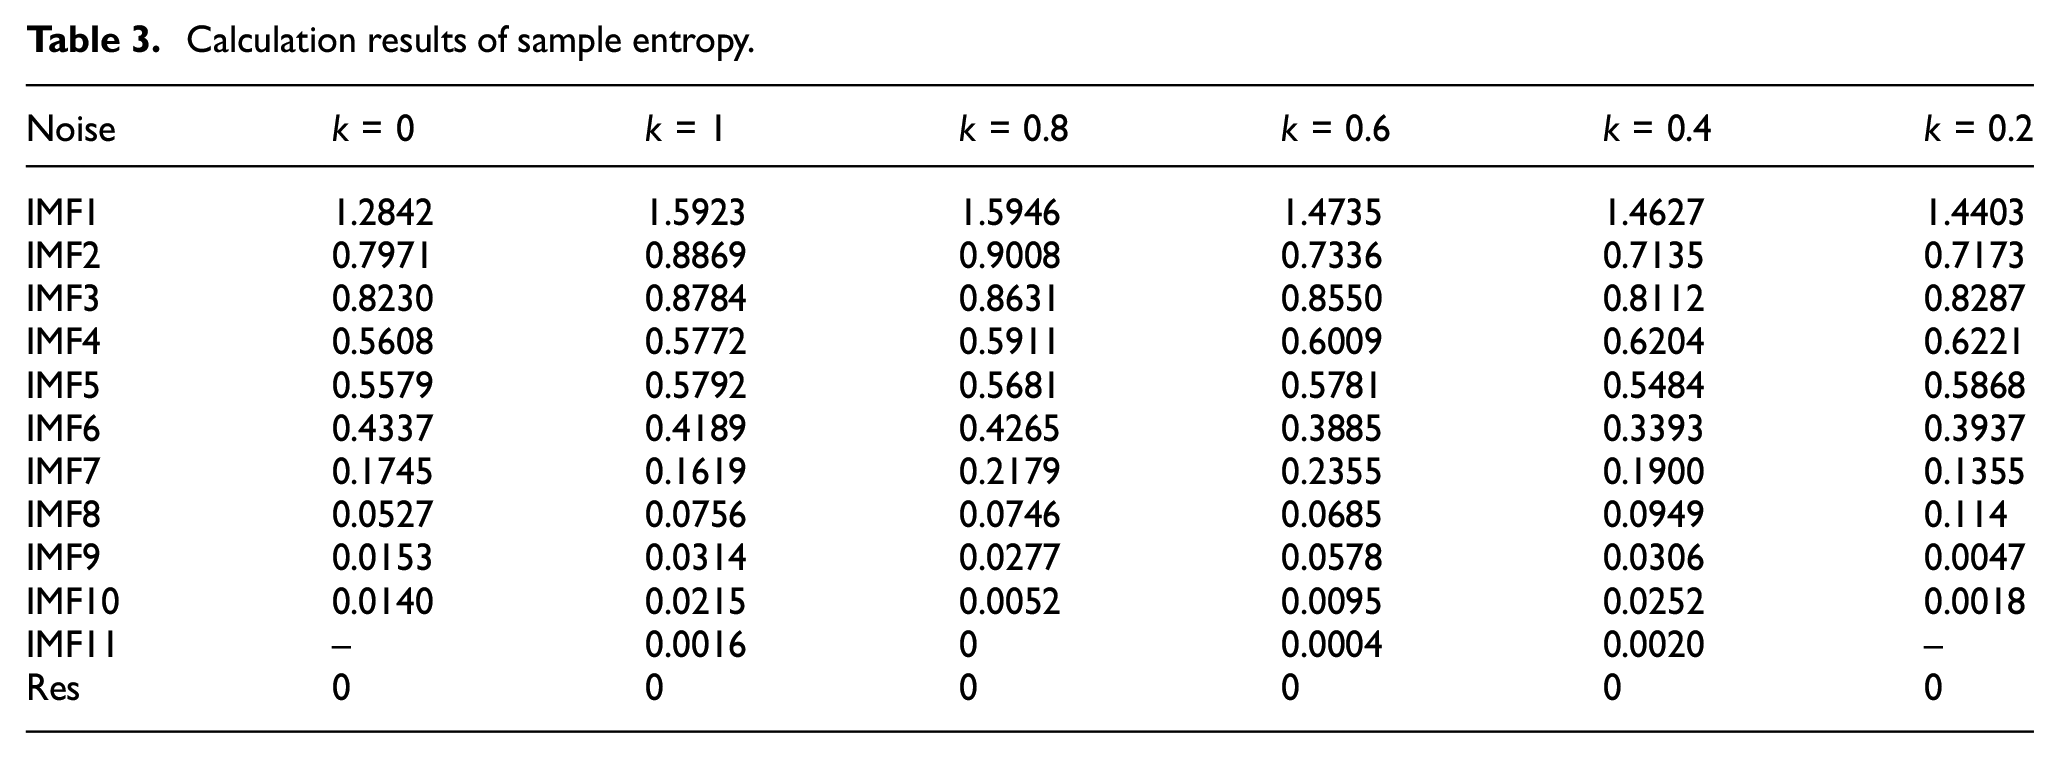
It can be seen from the sample entropy data in Table 3 that with the increase of IMF level, the sample entropy becomes smaller and smaller, which means that the high-level IMF components contain less noise information, while the low-level IMF components contain more noise information, so reducing the noise in the low-level IMF components can achieve the purpose of noise reduction. In addition, the signal without noise is decomposed into 10 IMF components. The signal with noise is decomposed into a maximum of 11 IMF components. In the process of noise reduction, with the increase of IMF level, not only the sample entropy becomes smaller, but also the signal frequency becomes lower and lower, which will not be erased by adaptive wavelet. Therefore, CEEMDAN combined with adaptive wavelet denoising method can retain the feature information in the original vibration signal to the greatest extent.
(4) Adaptive wavelet denoising
Noise signal often has high wavelet coefficients, while the traditional hard threshold and soft threshold wavelet denoising methods need to set threshold η and compare it with the wavelet coefficient wjk of the signal to filter the signal with η > |wj,k|, so that the noise signal in the original signal can be effectively filtered. Therefore, the setting of threshold η is very important. If η is too large, the noise will not be completely filtered, and if η is too small, the feature information in the signal will be partially filtered. In addition, the commonly used threshold
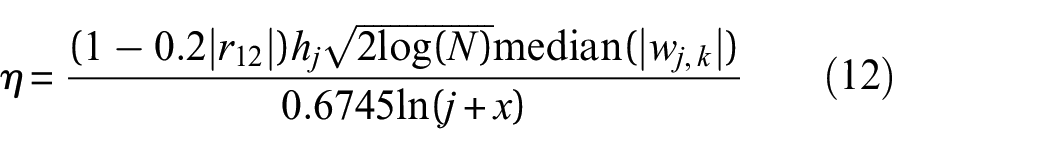
where
The adaptive threshold function can be written as
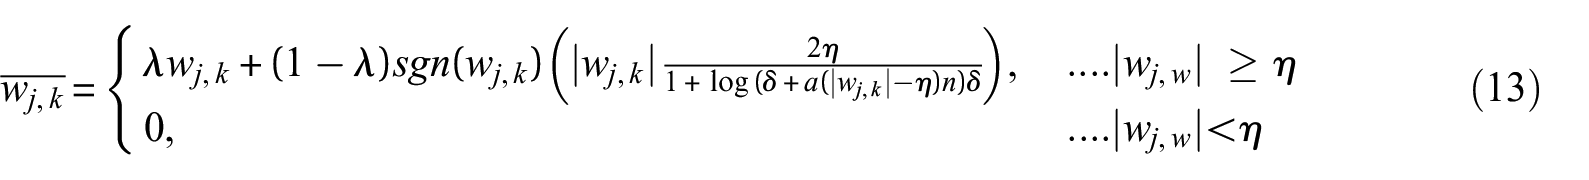
where
The signal decomposed by CEEMDAN in the previous section and the signal under different intensity noise conditions were filtered by adaptive wavelet, and the results are shown in Figure 3.
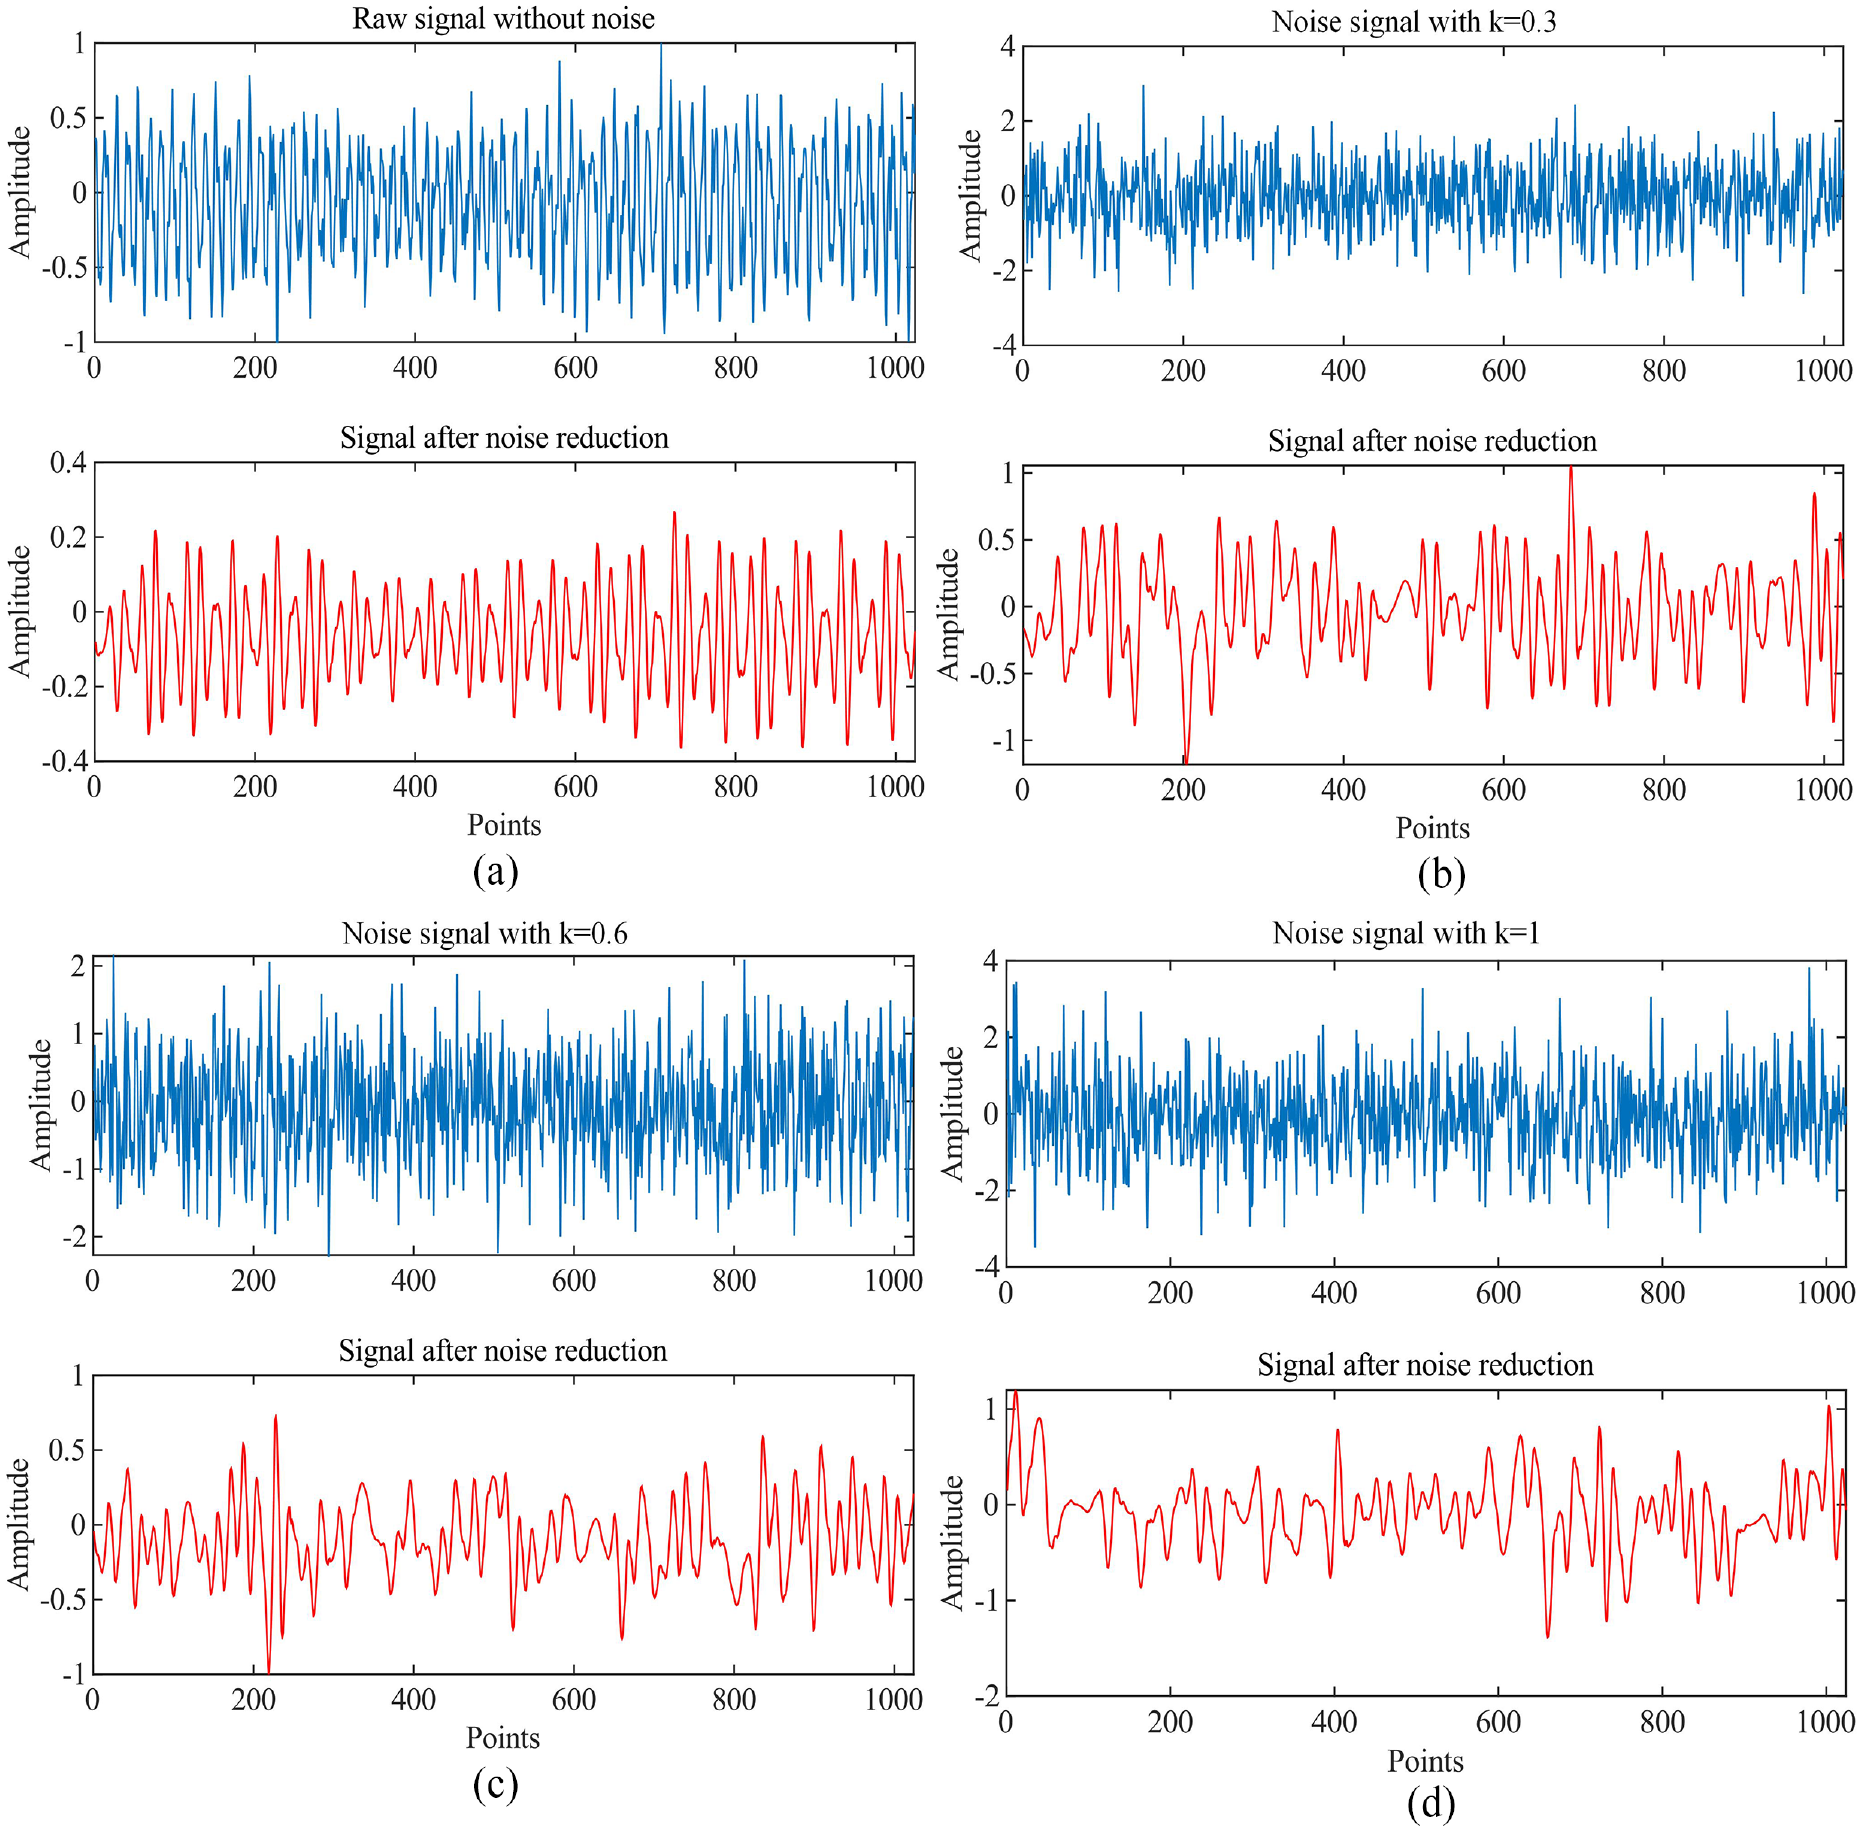
Results of adaptive wavelet denoising. (a) Signal without noise, (b) signal with noise when k = 0.3, (c) signal with noise when k = 0.6, and (d) signal with noise when k = 1.
It can be seen from Figure 3 that the adaptive wavelet denoising method used in this paper can effectively filter out noise signals in the face of different intensity noise signals, but the adaptive wavelet denoising method used in this paper still filter out part of high-frequency information, thus reducing the feature information that can be extracted by CNNs in terms of frequency.
Convolutional neural network implanted with Inception and LSTM
Network model structure
The TICCN model was proposed by Zhang et al. in 2018; it can be seen in reference. 29 The foundation of the TICNN model is VGG-Net. 49 Compared with VGG-Net, it increased the width of the convolution kernel of the first convolutional layer; after the first convolutional layer, it added Dropout and batch normalization layers, and the batch size is reduced during training. Zhang et al. successfully applied TICCN model to bearing fault diagnosis, and proved that it has high diagnosis accuracy and strong anti-noise ability, and can obtain satisfactory accuracy under different bearing working loads, and its performance is superior to other similar models.
In order to improve the recognition rate, feature extraction ability, anti-noise ability, and to avoid over fitting of the network model, this paper improved the existing TICNN model, and implanted the Inception module and LSTM into TICNN to form a new neural network model called ILCNN. First of all, according to the Hbebian theory, the repeated activation between every two layers of convolution in the CNN can make the neural network more capable of fitting. Therefore, the Inception module was used as a local sparse structure to replace the convolutional layer of TICNN with kernel size is 3 × 1; this increased the scale of convolution and made the feature information obtained by convolution kernels of different sizes different. Therefore, the feature parameters extracted by feature superposition are more comprehensive, which improves the recognition rate of the network. Then, in order to solve the problem of reducing the feature information extracted by the neural network due to adaptive wavelet denoising in Section ‘Denoising method’, this paper added LSTM to the TICNN model to extract more periodic and continuous characteristics in time domain from the wavelet de-noised information, thus compensating for the missing feature information. Because LSTM pays more attention to extracting the features of vibration signals with time series than CNN, when using 1DCNN to extract the feature information in vibration signals, it is split in time and cannot extract the correlation between features adjacent to tensors, thus losing some features. Therefore, LSTM was added to the full connected layer of TICNN in this paper, so as to improve the feature extraction capability of the network. The structure of ILCNN model is shown in Figure 4.
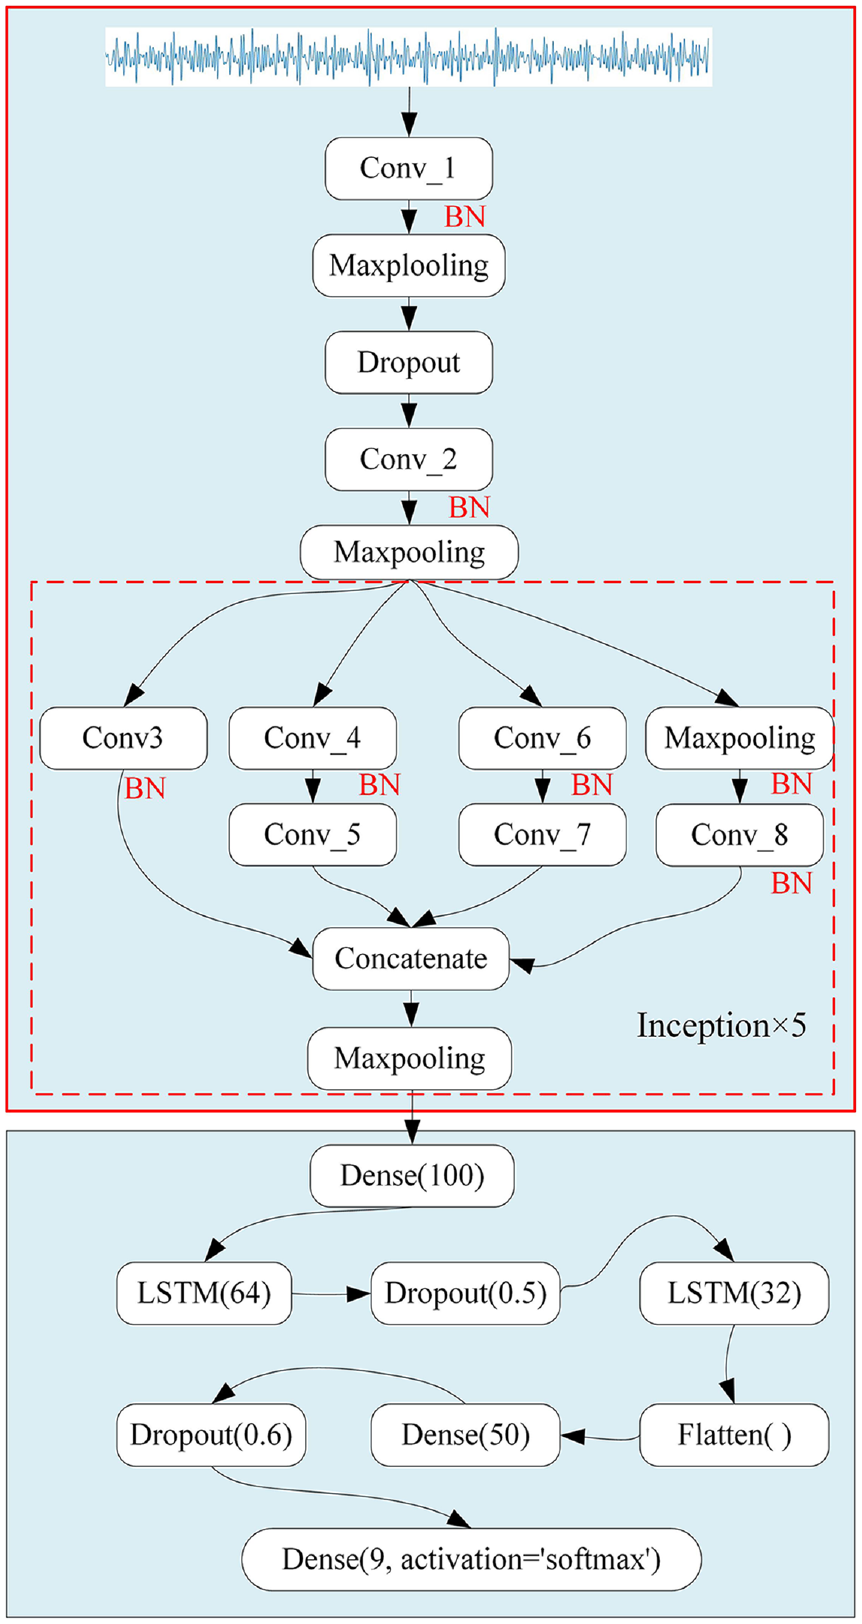
Structure of ILCNN model.
It can be seen from Figure 4 that after the vibration signal is input into ILCNN, Dropout is added after the first convolution layer to make the output data after convolution become randomly inactivated according to probability P, so that the network has a higher ability to resist data loss, and Dropout is also used in the full connected layer to avoid over-fitting in the training process. After the vibration signal passes through two large convolutional layers, five groups of Inception residual modules are used to improve the information recognition ability. At the same time, batch normalization is used after each convolutional layer to improve the anti-noise ability of the network. The specific structure of the Inception module is shown in Figure 5. After that, the feature information is inputted into a full connected layer, and the feature information is normalized again to [-1, 1] by the Tanh activation function. Then, the output of the full connected layer is inputted into two-layer LSTM. Finally, the feature information is retransmitted into a full connected layer. After flattening the feature information through Flatten layer, the Softmax function is used for nine classifications.
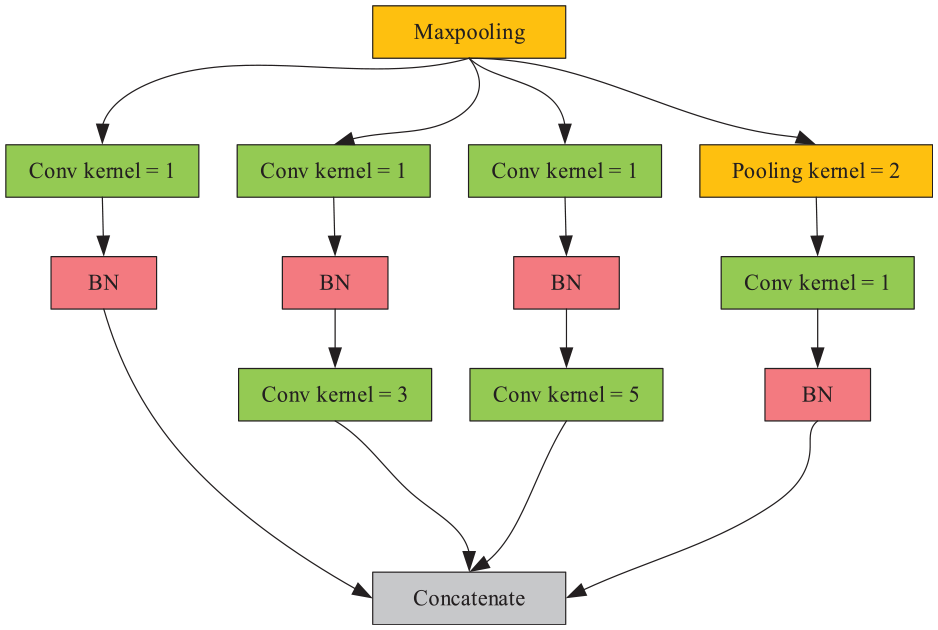
The specific structure of the Inception module.
Parameters design
It can be seen from reference Zhang et al. 29 that TICNN is a CNN model with high recognition rate and fast training speed, and ILCNN comes from TICNN. Therefore, when setting ILCNN parameters, the advantages of TICCN should be inherited and adjusted according to the actual situation. Since the input data length of ILCNN is half that of TICNN, the convolutional step of the first convolutional layer of ILCNN was set to 8 so that the size of the feature image after the convolution of the first convolutional layer of ILCNN can be consistent, thus continuing the high recognition rate and high anti-interference performance of the small convolutional layer of TICNN. In addition, for the Inception module and LSTM, it is only needed to set the number of channels, because you can clearly see the size of the convolution kernel of the Inception module from Figure 5. The specific parameters of ILCNN are shown in Table 4.
Parameters of ILCNN.
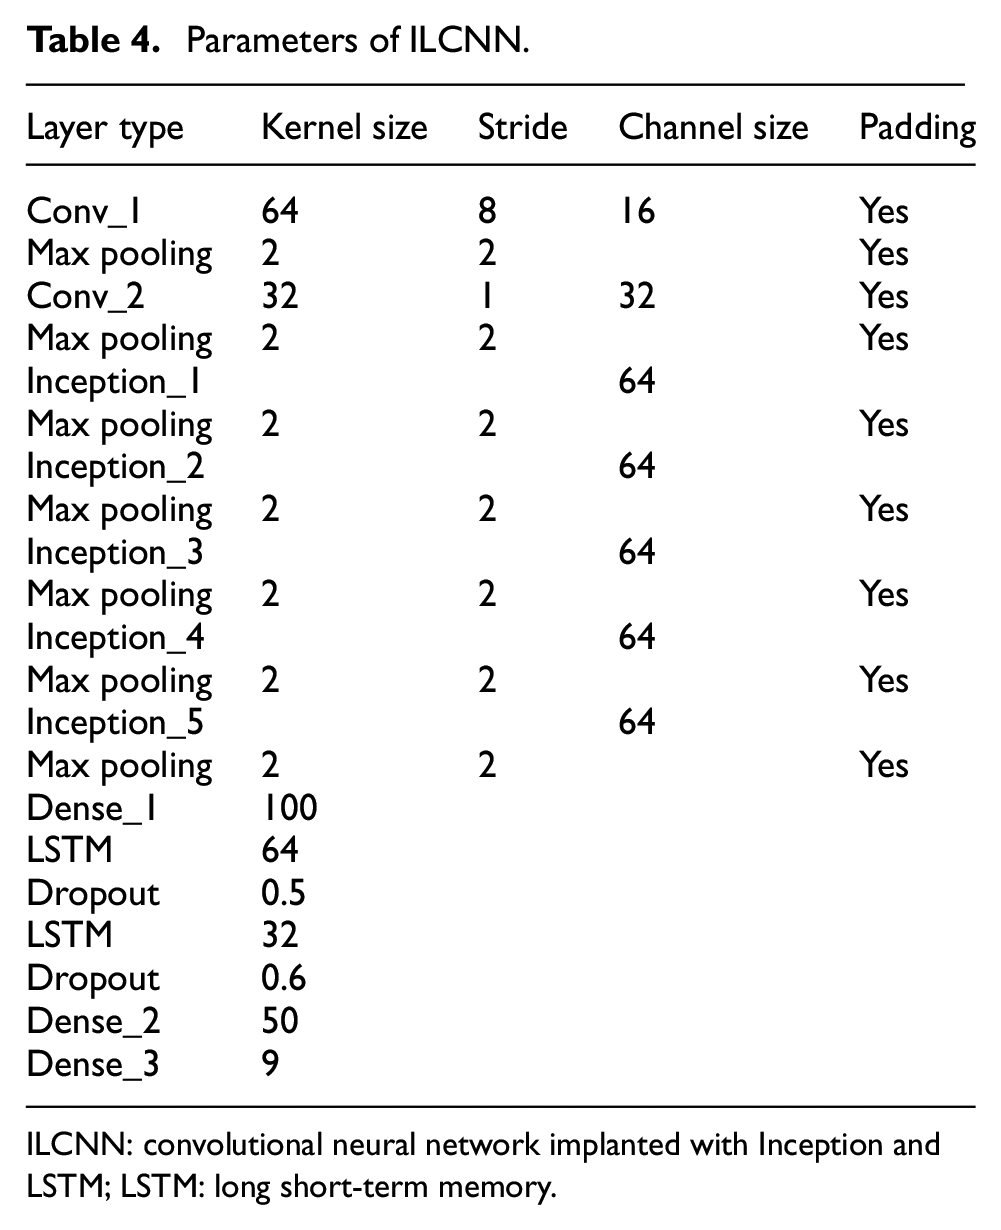
ILCNN: convolutional neural network implanted with Inception and LSTM; LSTM: long short-term memory.
Principle of integrated damage location diagnosis
Due to the different locations of sensors installed on the frame structure, some locations are relatively stable, and the damage of the frame structure has little impact on it, while some locations are relatively sensitive, and the damage of the frame structure can be timely reflected in the vibration data collected by the sensors at this location. Therefore, when the data collected by different sensors are used to diagnose the damage location of the frame structure, the diagnosis accuracy differs greatly. In addition, when using the data collected by a single sensor to diagnose the damage location of frame structure, large errors may be caused due to improper selection of sensor data. In order to solve the above problems and improve the accuracy and reliability of damage location diagnosis of frame structure, an integrated fault diagnosis method by using multiple sensor data to achieve accurate damage location diagnosis of frame structure was proposed based on the proposed ILCCN model. This method used the maximum average of the classification results obtained from multiple ILCCN models to determine the damage location of the frame structure. The main steps for damage location diagnosis of frame structures using this method are as follows.
Selection of training data
According to Section ‘Description of the research object’, there are 15 acceleration sensors installed on the frame structure, so 15 groups of vibration data representing nine damage cases can be obtained. Since the data obtained by sensors numbered 1–3 installed on the bottom floor is relatively stable, 12 groups of data collected by 12 sensors numbered 4–15 are generally used to diagnose the damage location of the frame structure. According to the integrated diagnosis principle of damage location of the frame structure, it is necessary to select several excellent groups of data from the 12 groups of data for training, that is, select the sensor data that is conducive to the accuracy of damage location diagnosis as the training sample. Here, it is assumed that n groups excellent vibration data have been selected from 12 groups of vibration data.
Calculation of damage location probability
Assume that
where
Since the damage location cannot be determined simply by
Selection of training samples
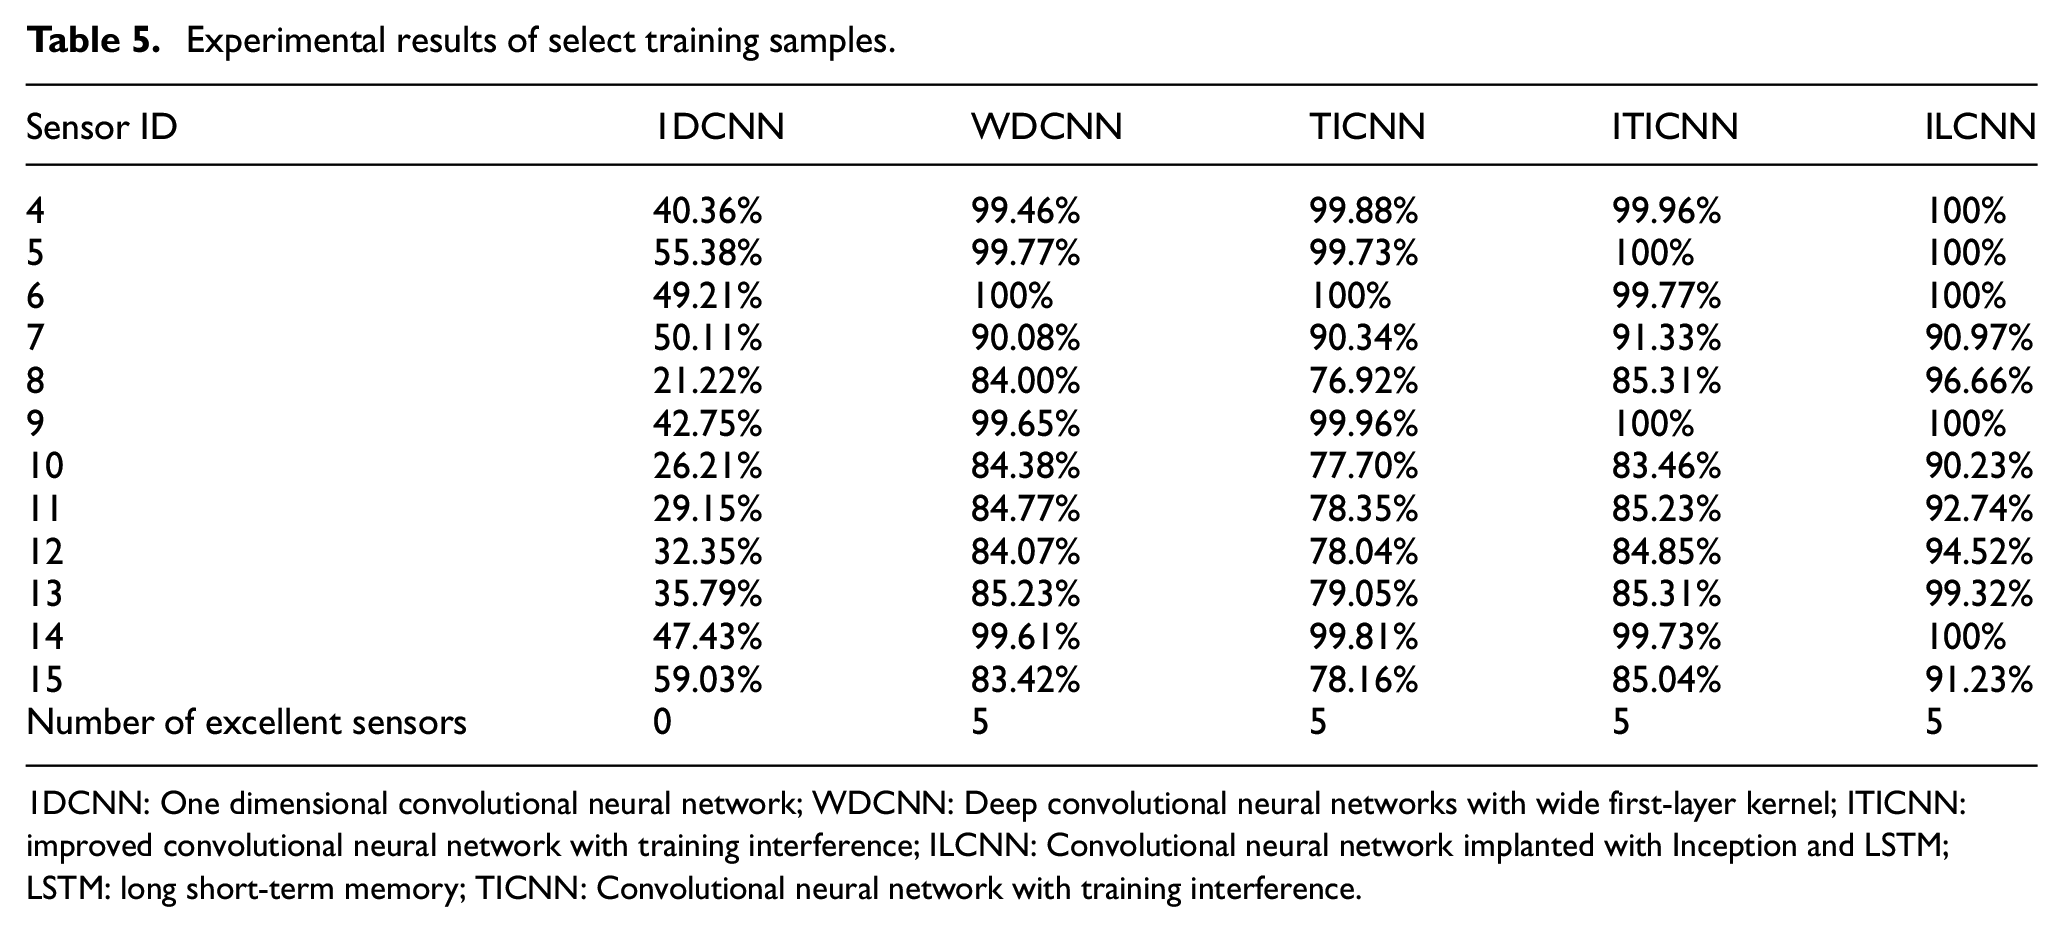
In order to obtain training samples suitable for accurate damage location diagnosis of frame structure, firstly, the data collected by 12 acceleration sensors were input into ILCNN model for training respectively, and then the required sensor data were selected as the final training samples according to the obtained diagnosis accuracy. In order to ensure the correctness and credibility of the results obtained, under the same experimental conditions, other networks such as 1DCNN, deep convolutional neural networks with wide first-layer kernel (WDCNN), TICNN and improved convolutional neural network with training interference (ITICNN) were used for comparative experimental research. 1DCNN proposed in reference.38,39 WDCNN was proposed by Zhang in 2017 50 ; it is an improved model of 1DCNN; its structural feature is that the first layer has a large convolution kernel, and the subsequent convolution layers have small convolution kernel with 3 × 1; it can automatically learn diagnostic-oriented features and automatically remove features that are not helpful for diagnosis. ITICNN was proposed by Xue et al. in 2022 51 ; it is an improvement of TICNN by reducing the input data length of TICNN, deepening the number of convolutional layers and adjusting a series of parameters of TICNN, which enhances the anti-noise ability.
In this paper, the specific configuration of the laptop for the experimental study is as follows. CPU: Intel Corei7-4710MQ, GPU: NVIDIA GT940M 2G and memory: 12G. During training, the data processing and CNN operating environments were Tensorflow 2.4.8, keras 3.4.2 and Python 3.8.0; the initial learning rate was the default value of Adam in the operating environment; the batch size was 64. Since the main purpose of this section is to select training samples that make the network converge quickly and have high accuracy, the training epoch in this section is 150, and the training epoch in the subsequent noise resistance comparison experiment and actual diagnosis is 600. The accuracy of the above five networks is shown in Table 5.
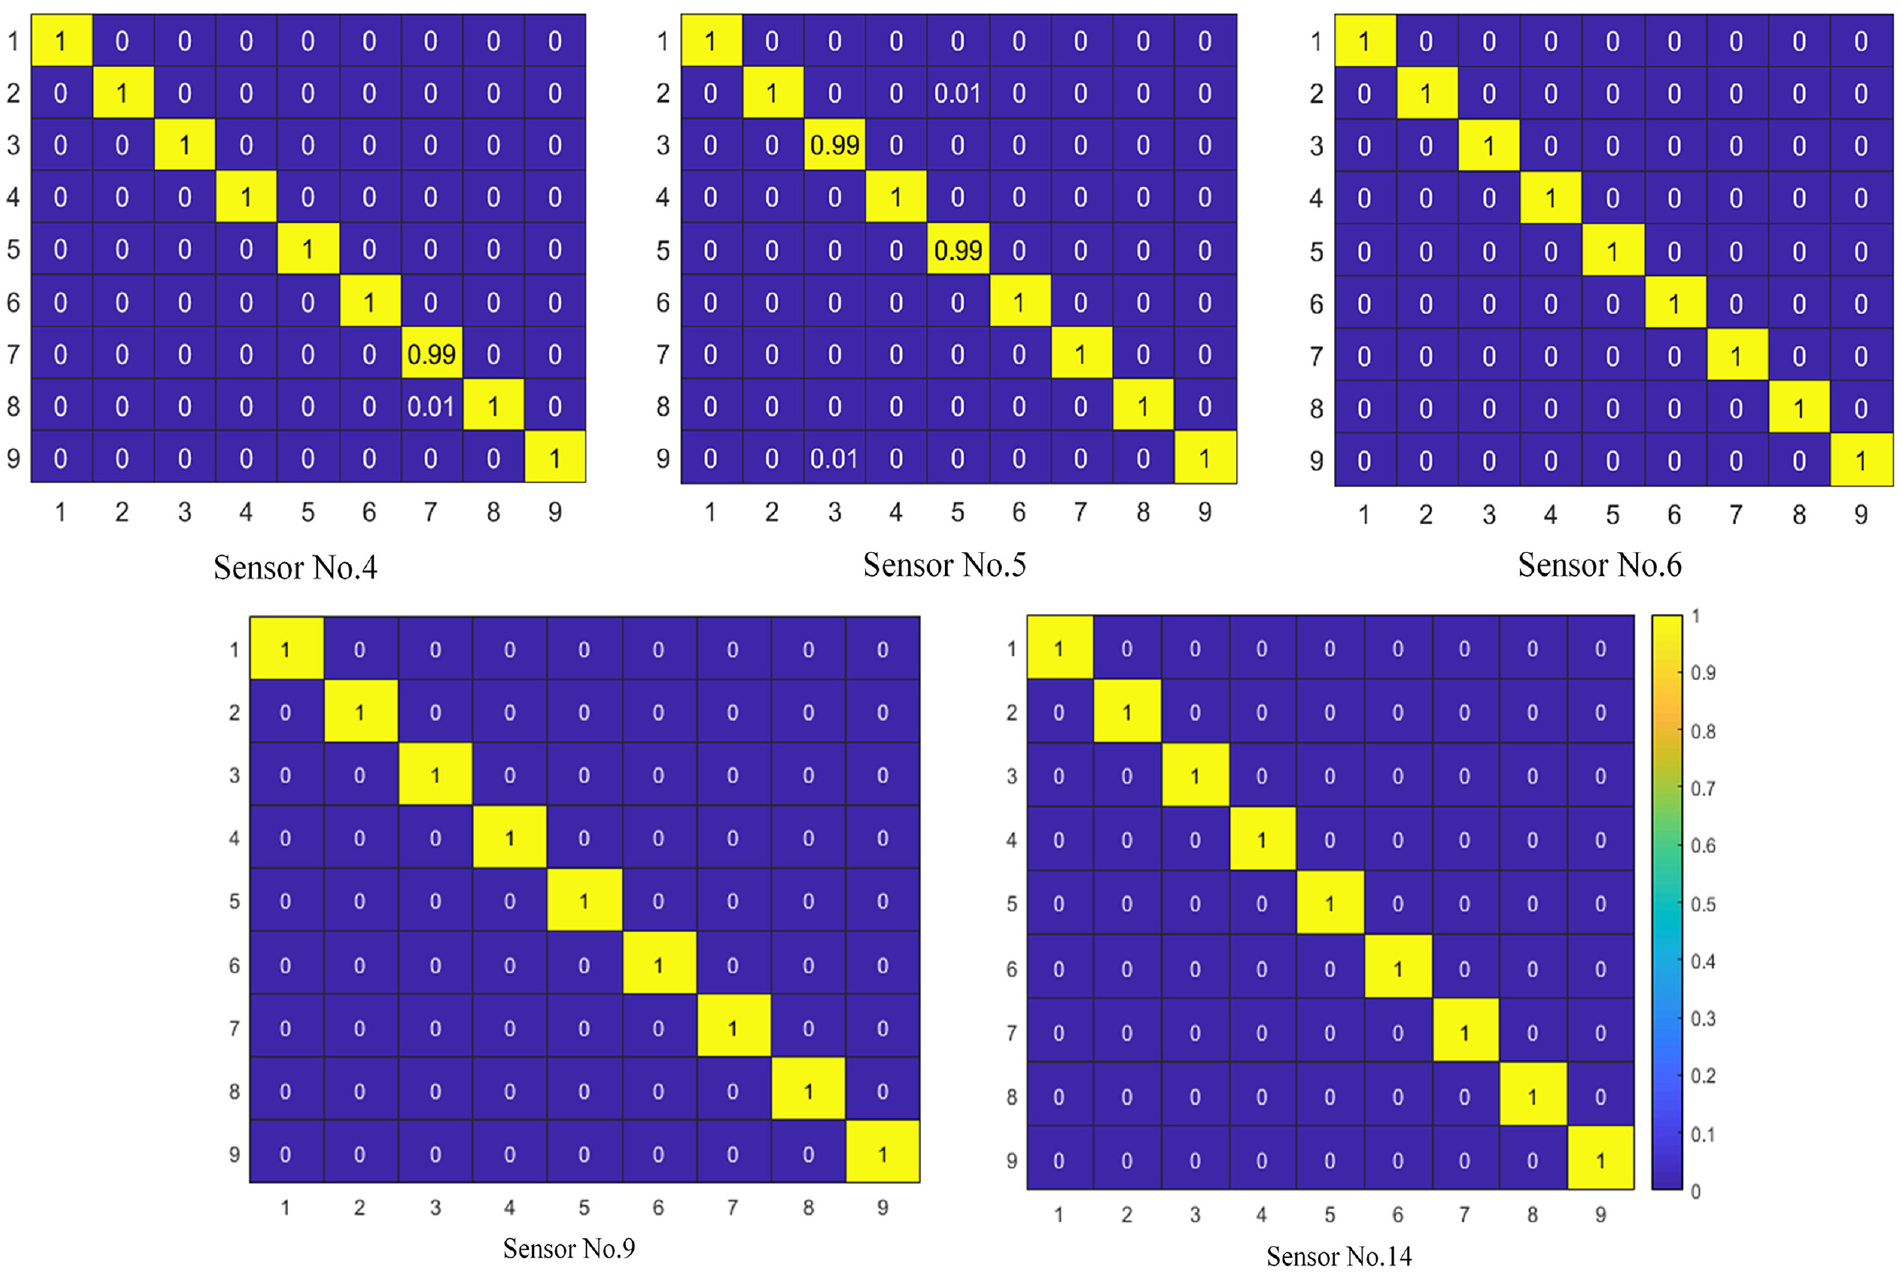
Experimental results of select training samples.
1DCNN: One dimensional convolutional neural network; WDCNN: Deep convolutional neural networks with wide first-layer kernel; ITICNN: improved convolutional neural network with training interference; ILCNN: Convolutional neural network implanted with Inception and LSTM; LSTM: long short-term memory; TICNN: Convolutional neural network with training interference.
According to the diagnosis accuracy of various network models in Table 5, when 1DCNN is used for damage location diagnosis, the diagnosis accuracy is relatively low, and excellent sensor data cannot be determined. When WDCNN, TICNN, ITICNN and ILCNN are used for damage location diagnosis, five groups of sensor data with high diagnosis accuracy have been selected, which are collected by acceleration sensors numbered 4, 5, 6, 9 and 14 respectively. Therefore, five groups of data collected by the above sensors will be selected for the research on damage location diagnosis of frame structure. In addition, from the accuracy data in Table 5, it can also draw the conclusion that ILCNN is superior to 1DCNN, WDCNN, TICNN and ITICNN in diagnosis accuracy.
Comparison of anti-noise ability
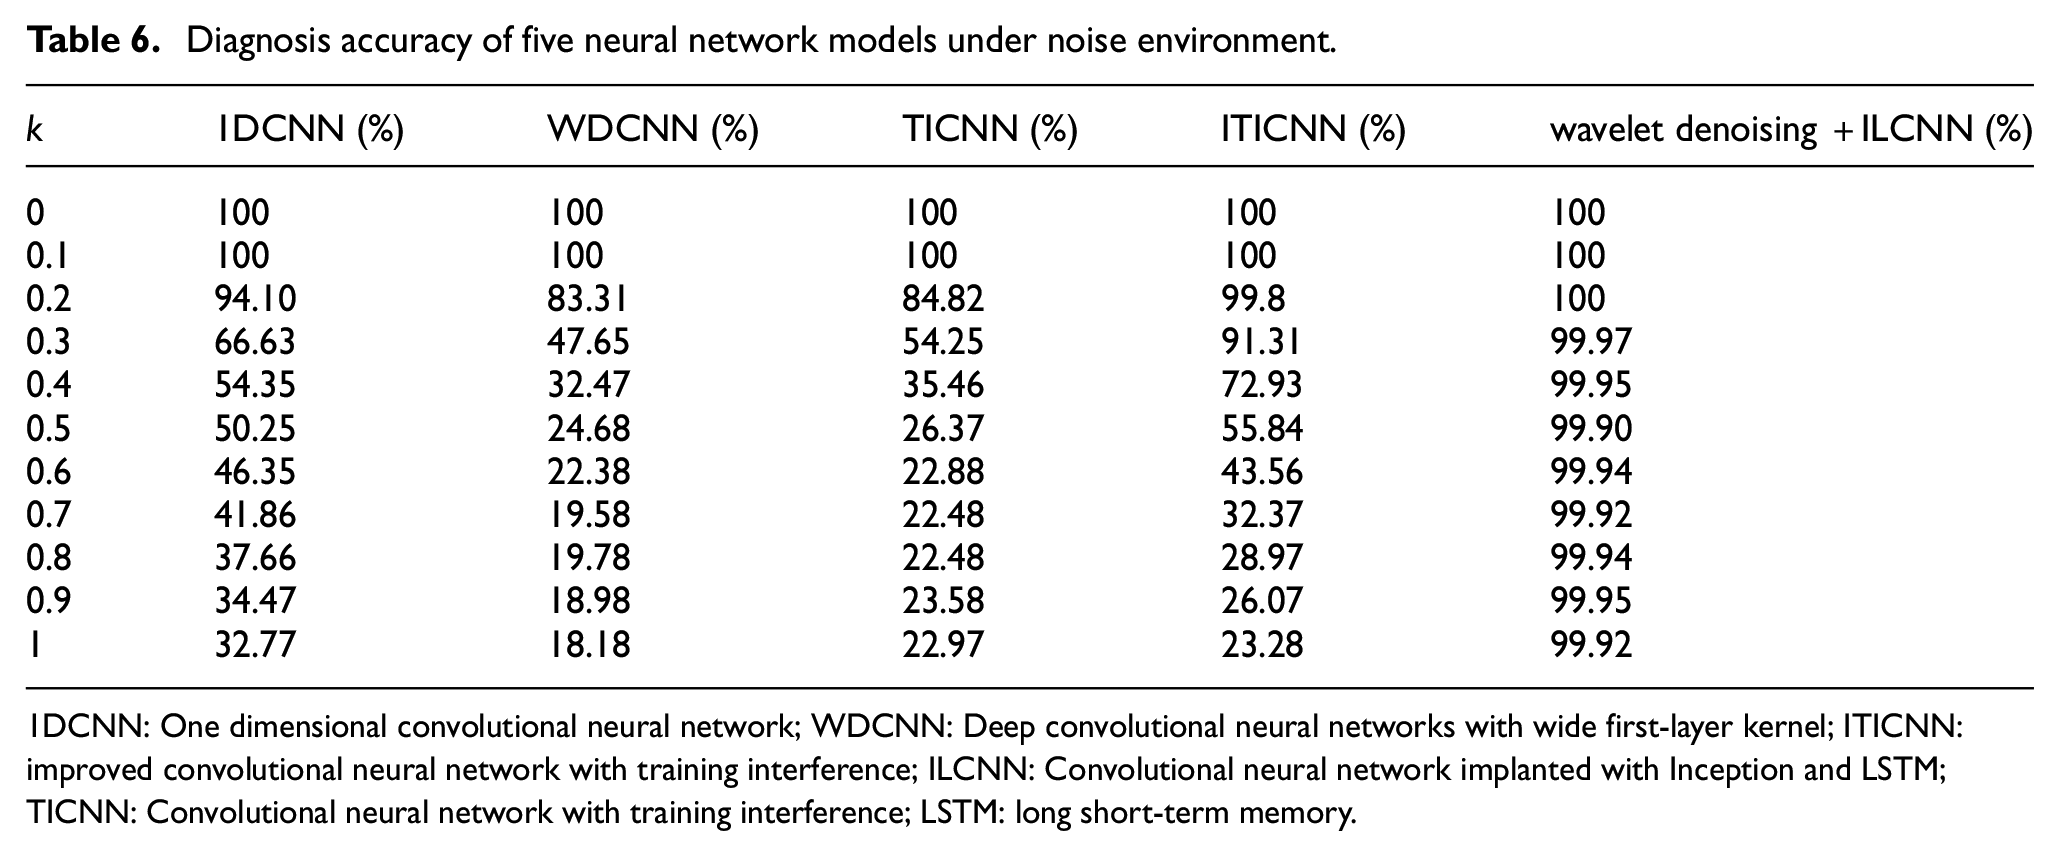
The anti-noise ability of the network model reflects its ability to work in a noisy environment. In order to verify the anti-noise ability of wavelet denoising +ILCNN model, the wavelet denoising +ILCNN model was tested by data coming from the sensor numbered 9 under different noise intensity. At the same time, 1DCNN, WDCNN, TICNN and ITICNN were used for comparative experimental research under the same noise conditions. In the experiment, the noise intensity was controlled by k. Different k represents different noise intensity. The diagnosis accuracy of five different models under different noise intensity is shown in Table 6.
Diagnosis accuracy of five neural network models under noise environment.
1DCNN: One dimensional convolutional neural network; WDCNN: Deep convolutional neural networks with wide first-layer kernel; ITICNN: improved convolutional neural network with training interference; ILCNN: Convolutional neural network implanted with Inception and LSTM; TICNN: Convolutional neural network with training interference; LSTM: long short-term memory.
According to the diagnosis accuracy data shown in Table 6, when the data samples do not contain noise or the noise intensity is low (k = 0 and k = 1), the accuracy of all models reaches 100%. With the gradual increase of noise intensity, except for the wavelet denoising +ILCNN model proposed in this paper, the accuracy of other models decreases rapidly with the increase of noise intensity. When k = 0.5, the accuracy of other models decreases to less than 50%. This shows that adding wavelet denoising to ILCNN model can filter most of the noise, thus ensuring that the accuracy of ILCNN model is basically not affected by noise. Therefore, the fault diagnosis method proposed in this paper has a strong advantage in anti-noise ability, and can realize the accurate diagnosis of damage location of frame structure in strong noise environment.
Visualization analysis
Although the classification effect of the neural network model can be expressed by accuracy and loss, it is not intuitive. In order to express the classification results of neural network model more intuitively, TSNE clusters are commonly used to convert the output dimension of the full connected layer into a one-dimensional scatterplot. In this paper, TSNE cluster was selected to visualize the results obtained by classifying the data coming from the acceleration sensor numbered nine with the model proposed in this paper under noiseless conditions, and the visualization results are shown in Figure 6.
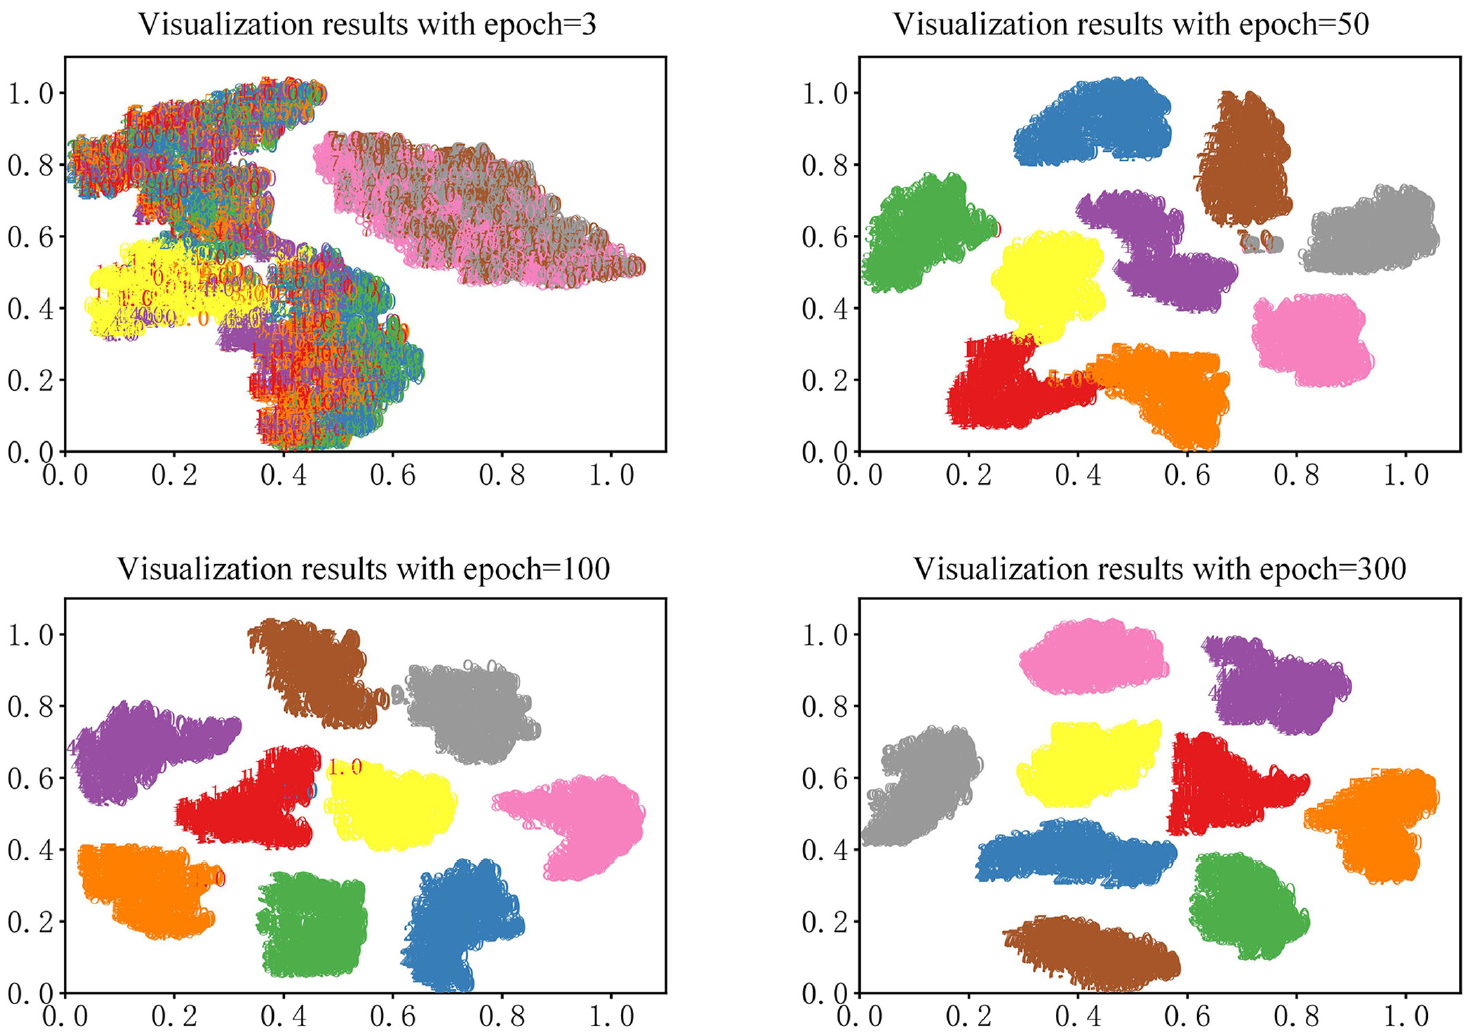
Visualization results.
Figure 6 shows the visualization results when the training epoch is equal to 3, 50,100, and 300 respectively. It can be seen from the visualization results that when the neural network model is just started to train, the model cannot separate the nine mixed damage cases of the frame structure; with the increase of training epoch, the classification ability of the model is gradually enhanced. When the training epoch is equal to 50, the model can basically distinguish nine damage cases; when the training epoch is equal to 100, the model can accurately classify nine damage cases; when the training epoch is equal to 300, the distance between nine damage cases is further expanded, and the discrimination is further increased. At this time, the model has stronger identification ability, which can meet the requirements of accurate damage location diagnosis of frame structures.
In order to more intuitively reflect the advantages of the method proposed in this paper, under the same experimental conditions, the visualization results of 1DCNN, WDCNN, TICNN and ITICNN when the training epoch is equal to 300 were obtained, as shown in Figure 7. It can be seen from Figure 7 that 1DCNN cannot distinguish nine kinds of damage cases at all; WDCNN divided the damage case 5 into two parts; TICNN has a poor effect in distinguishing damage case 4 from damage case 9; ITICNN also divided the damage case 5 into two parts, but the effect is better than WDCNN; Using the method proposed in this paper, nine kinds of damage cases can be completely separated and their clustering is more compact. Therefore, the method proposed in this paper is superior to the above four methods.
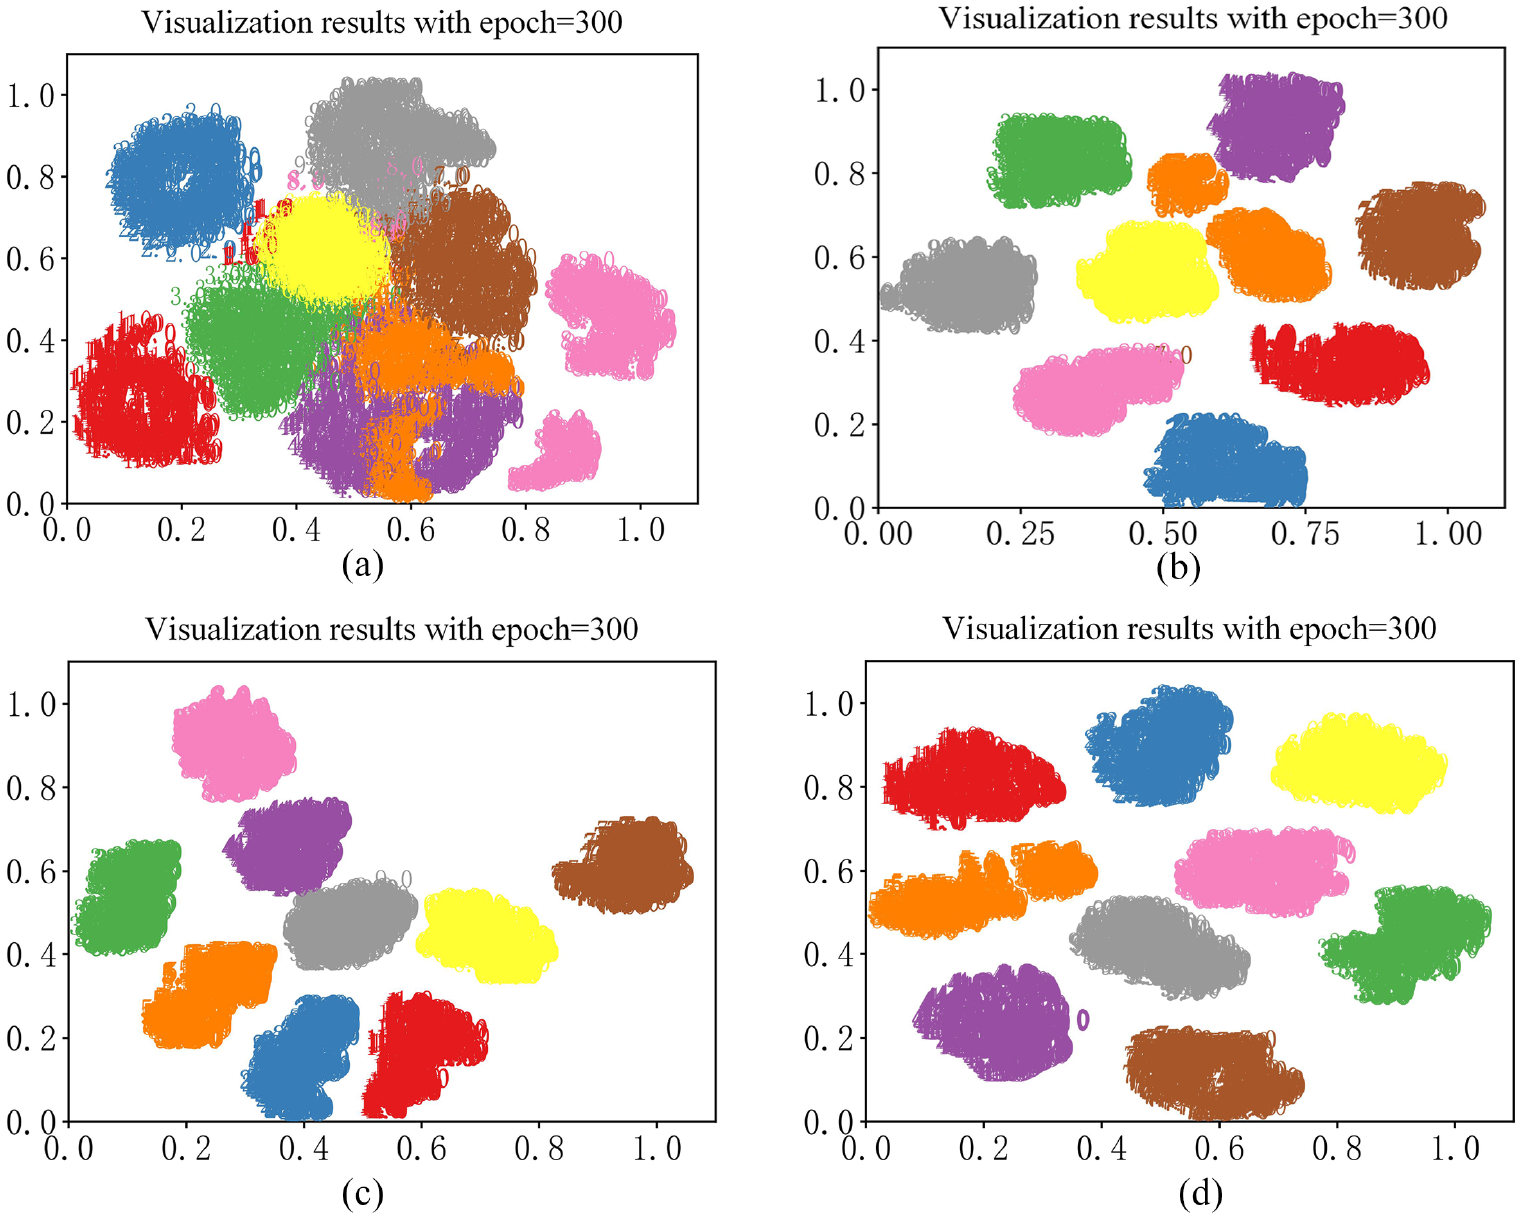
Visualization comparison results of five models. (a) Visualization results of 1DCNN, (b) visualization results of WDCNN, (c) visualization results of TICNN, and (d) visualization results of ITICNN.
In order to better explain the reasons for the above visualization results, the accuracy curves and Loss curves in the training process of the above five models were given, as shown in Figure 8. It can be clearly seen from Figure 8 that accuracy and Loss of 1DCNN and WDCNN fluctuate greatly in the training process, resulting in that the models have not converged; accuracy and Loss of TICNN fluctuate slightly when the training epoch is 120; accuracy and Loss of ITICNN fluctuate slightly when the training epoch is about 100; in the whole training process, the accuracy and Loss curves of the method proposed in this paper are smoother and the convergence is better. These results again prove the superiority of the method proposed in this paper.
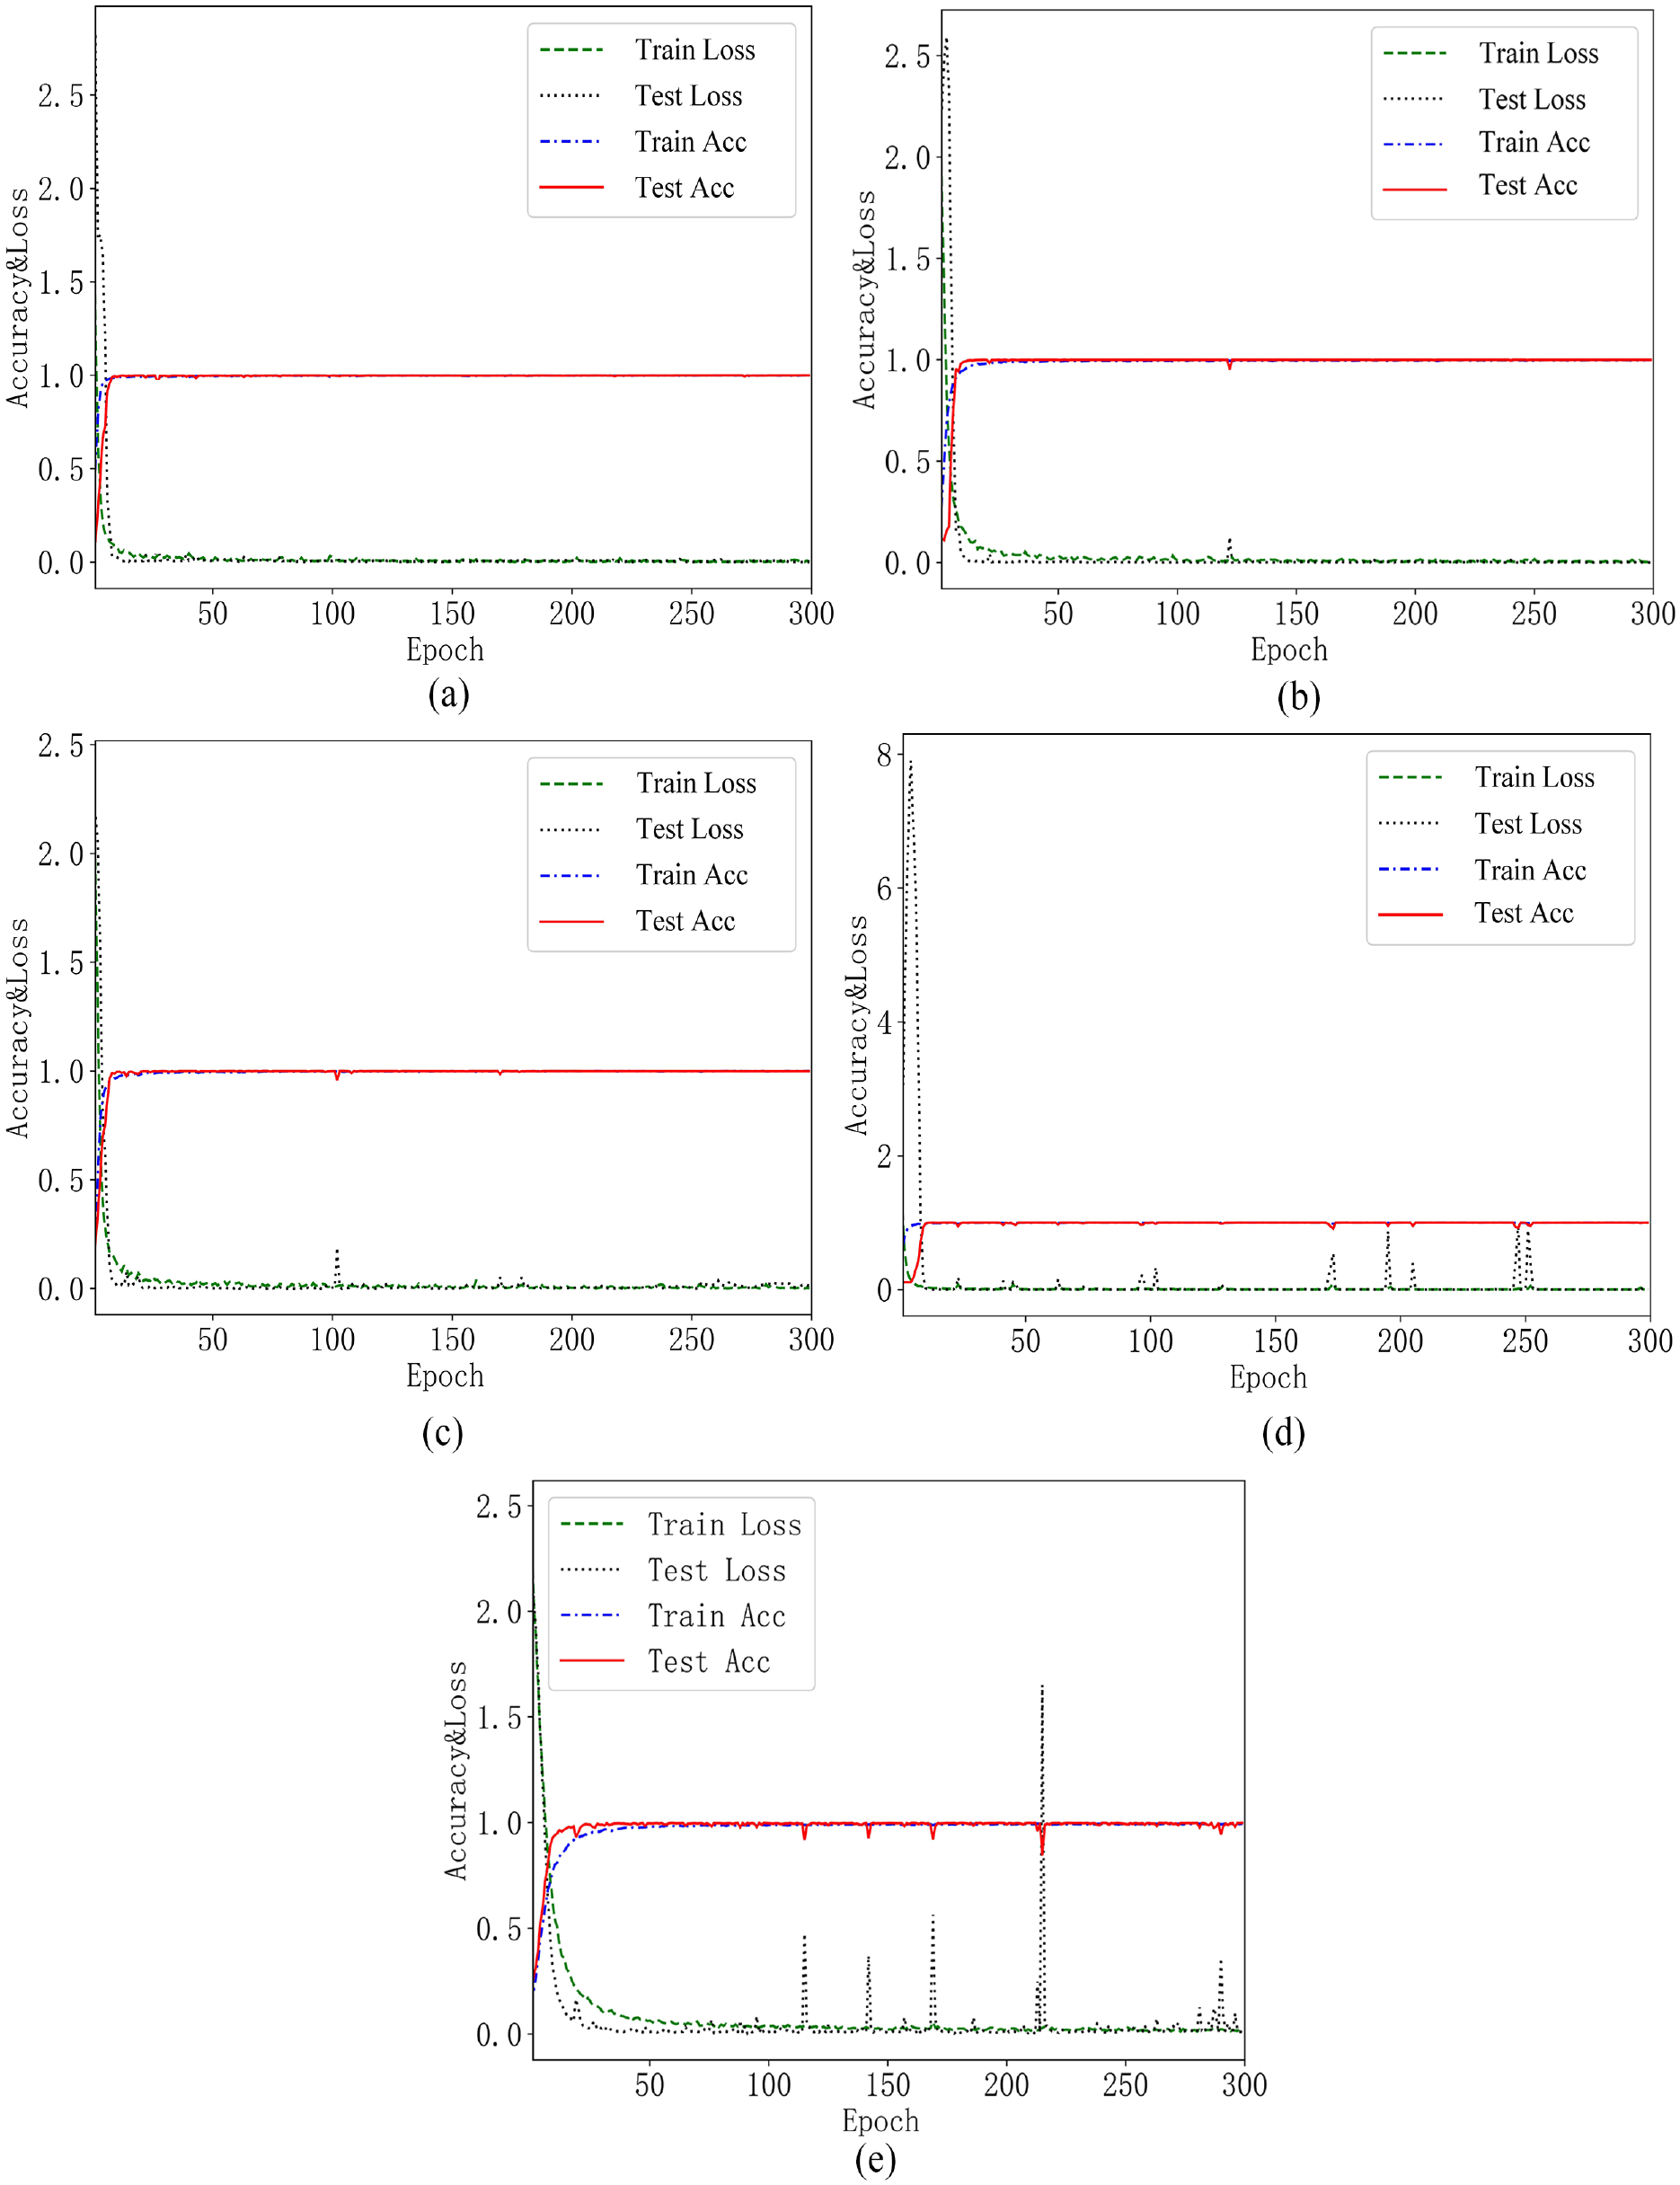
Accuracy and Loss curves of five models. (a) Accuracy and Loss curves of ILCNN, (b) accuracy and Loss curves of TICNN, (c) accuracy and Loss curves of ITICNN, (d) accuracy and Loss curves of WDCNN, and (e) accuracy and Loss curves of 1DCNN.
Ablation experiment of LSTM and Inception
In order to show the role of LSTM and Inception and its impact on the model, ablation experiment was carried out by using ILCNN, ILCNN without Inception, ILCNN without LSTM and ILCNN without Inception and LSTM. Visualization results and accuracy and Loss curves of ablation experiment are shown in Figures 9 and 10 respectively.
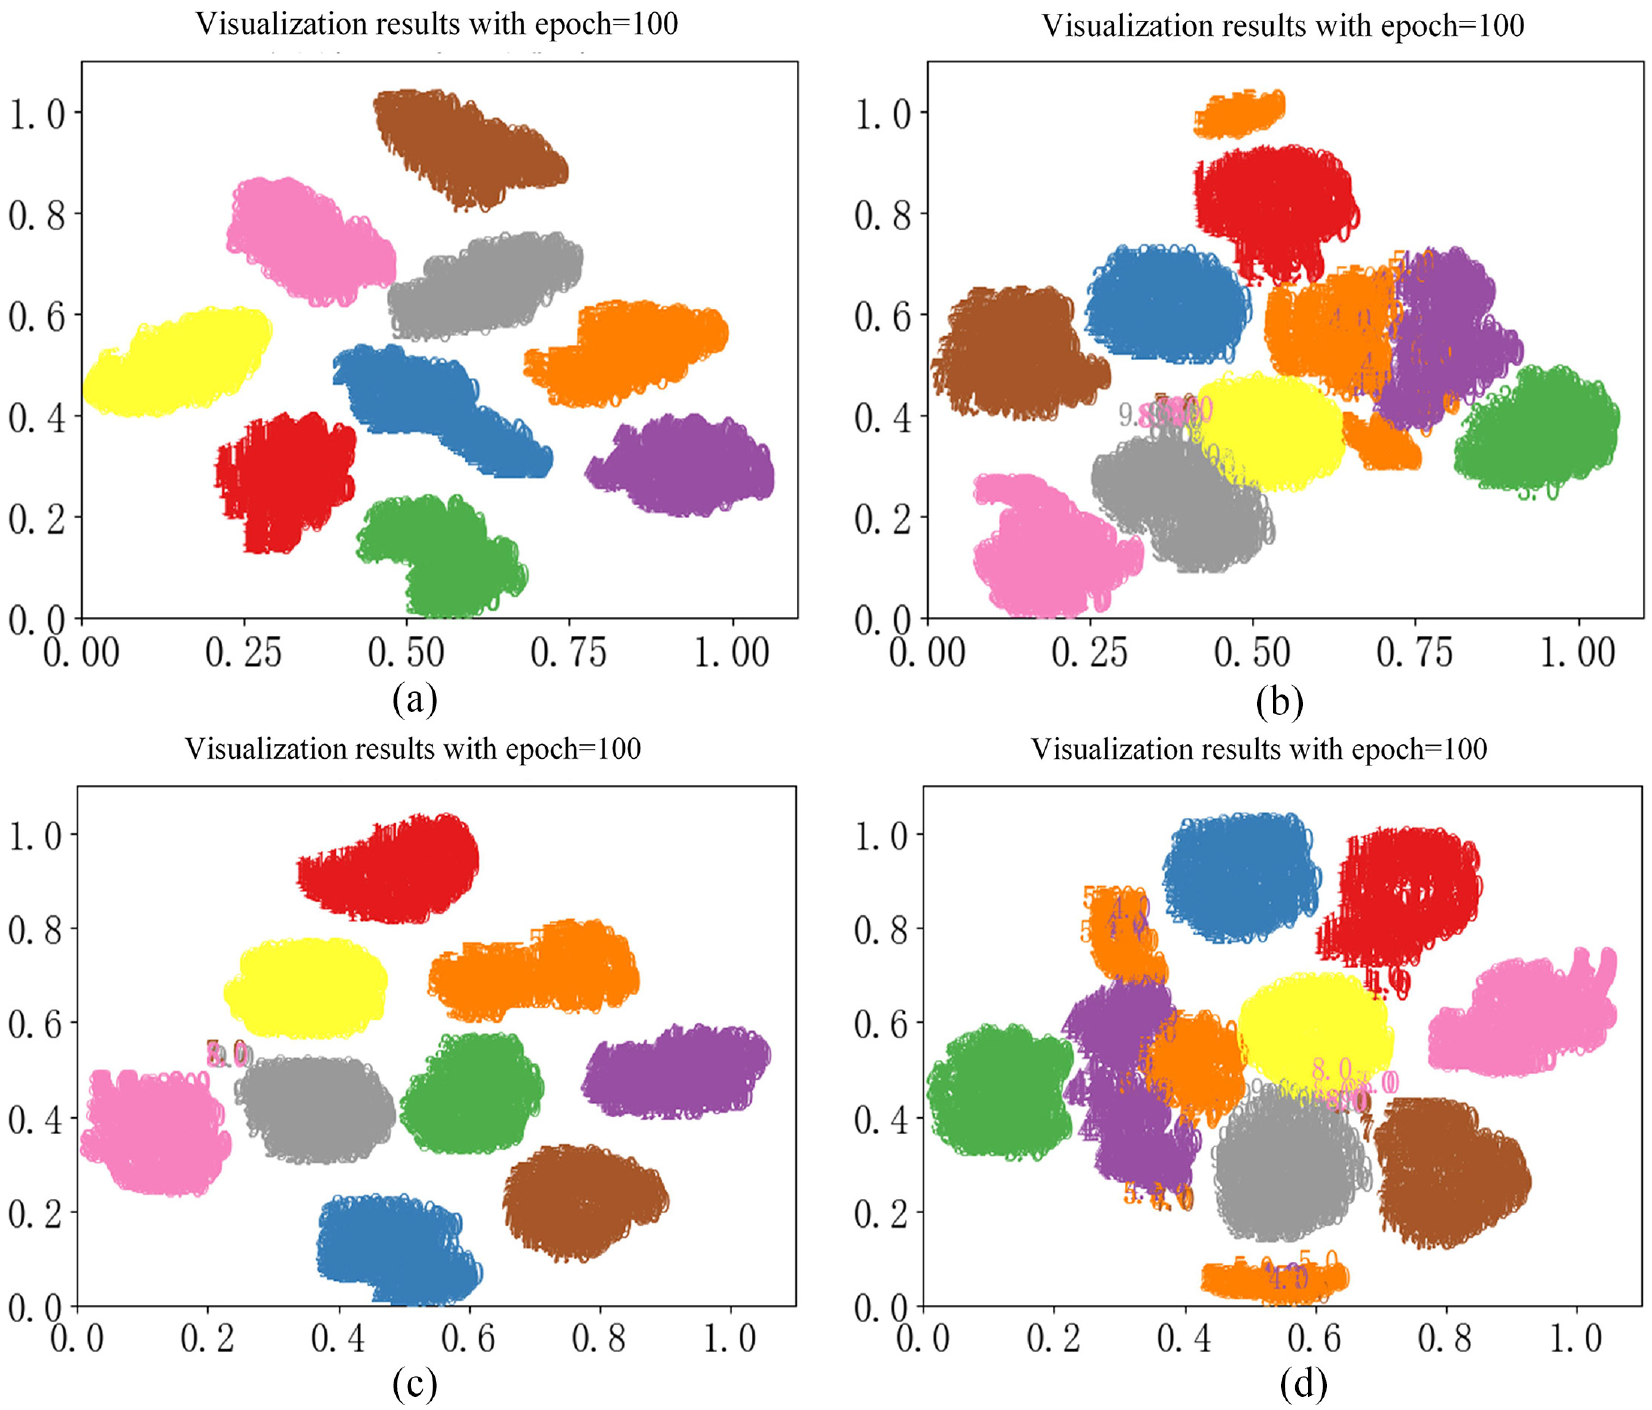
Visualization results of ablation experiment. (a) ILCNN, (b) ILCNN without Inception, (c) ILCNN without LSTM, and (d) ILCNN without Inception and LSTM.
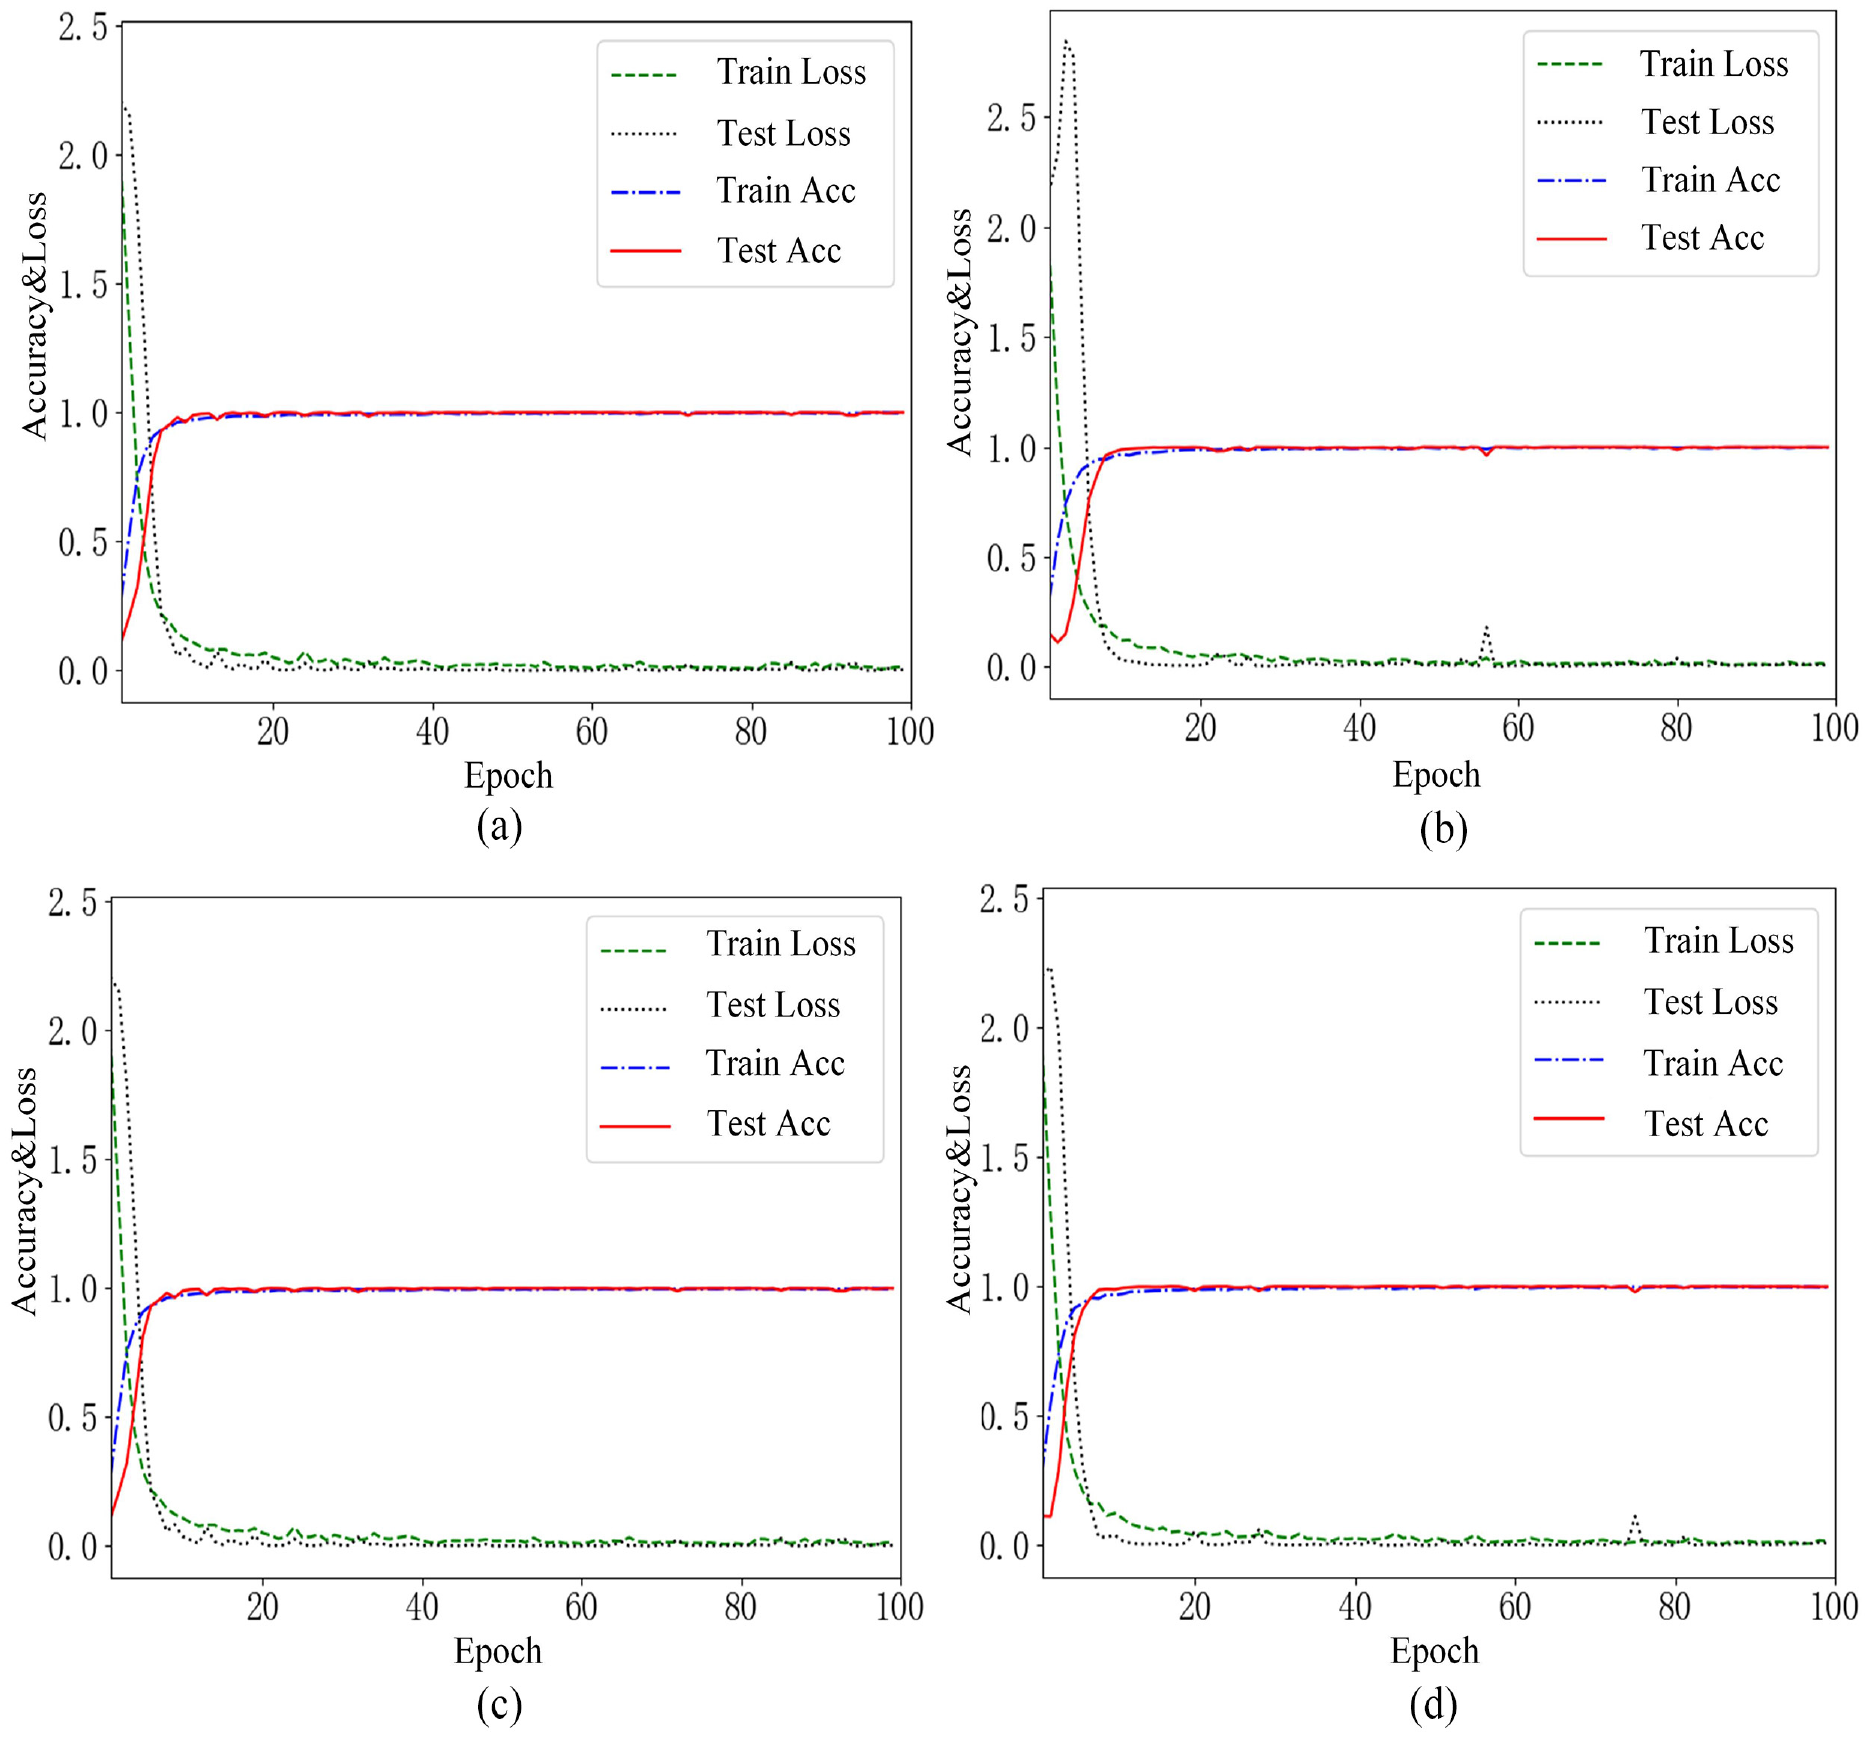
Accuracy and Loss curves of ablation experiment. (a) ILCNN, (b) ILCNN without Inception, (c) ILCNN without LSTM, and (d) ILCNN without Inception and LSTM.
It can be seen from the results in Figures 9 and 10 that when the Inception module in ILCNN is removed, the accuracy and loss fluctuate when the training epoch reaches about 55, and there is adhesion in visualization results. When the LSTM in ILCNN is removed, there is no significant impact on the training curves and data clustering results of convolutional layer; however, when the training epoch is between 60 and 80, the gap between train loss and test loss is larger than that in ILCNN, at the same time, the damage case 8 and damage case 9 in visualization results have partial adhesion. Therefore, both Inception and LSTM have an impact on the classification effect of the model; when Inception and LSTM are not used, the classification effect of the model will become worse, and the impact of Inception on the model is greater than that of LSTM on the model. In addition, from the comparative experimental results, it also can be seen that when using ILCNN without Inception, the model has converged when the training epoch reaches about 50; when using ILCNN without Inception and LSTM, the model can converge when the training epoch reaches 70, and the accuracy and loss have fluctuated. In contrast, when there is Inception in the model, the accuracy and loss do not fluctuate, and the training curve becomes relatively smooth. Therefore, Inception has a stronger impact on the training stability of the model than that of LSTM, and LSTM has better improved the classification performance of the model.
Integrated diagnosis results of damage location
This section mainly applied the aforementioned integrated fault diagnosis method to diagnose the damage location of the frame structure. In order to verify the advantages of the method proposed in this paper in terms of diagnosis accuracy and noise resistance, 1DCNN, WDCNN, TICNN and ITICNN were respectively used for comparative experimental research.
Diagnosis results of wavelet denoising +ILCNN without noise
Taking the sensor data selected in Section ‘Selection of training samples’ as the training samples, the method proposed in this paper was used for training respectively, and five models that can be used for damage location diagnosis of frame structure were obtained. Then the five trained models were used to predict the damage location by using the reserved data, and calculate the probability (Pij) of each damage case as shown in Figure 11.
Pij predicted by five models for nine damage cases.
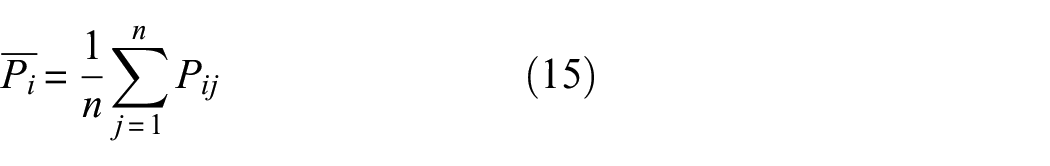
It can be seen from the probability values shown in Figure 11 that the five models trained from the data of the five sensors have high accuracy in damage location diagnosis of the frame structure. Among them, the accuracy of models corresponding to sensors numbered 6, 9, and 14 is 100% under all nine damage cases, and accuracy of the model corresponding to sensor numbered 4 is all 100% except for 99% under damage case 7, The accuracy of the model corresponding to sensor numbered 5 is all 100% except for 99% under damage case 3 and case 5. There are two main reasons why each model has such a high accuracy in each damage case. First, the samples used for training are selected and have high identification; second, the method proposed in this paper has strong feature extraction ability and strong anti-noise ability, and can obtain high accuracy. After calculation, the average value
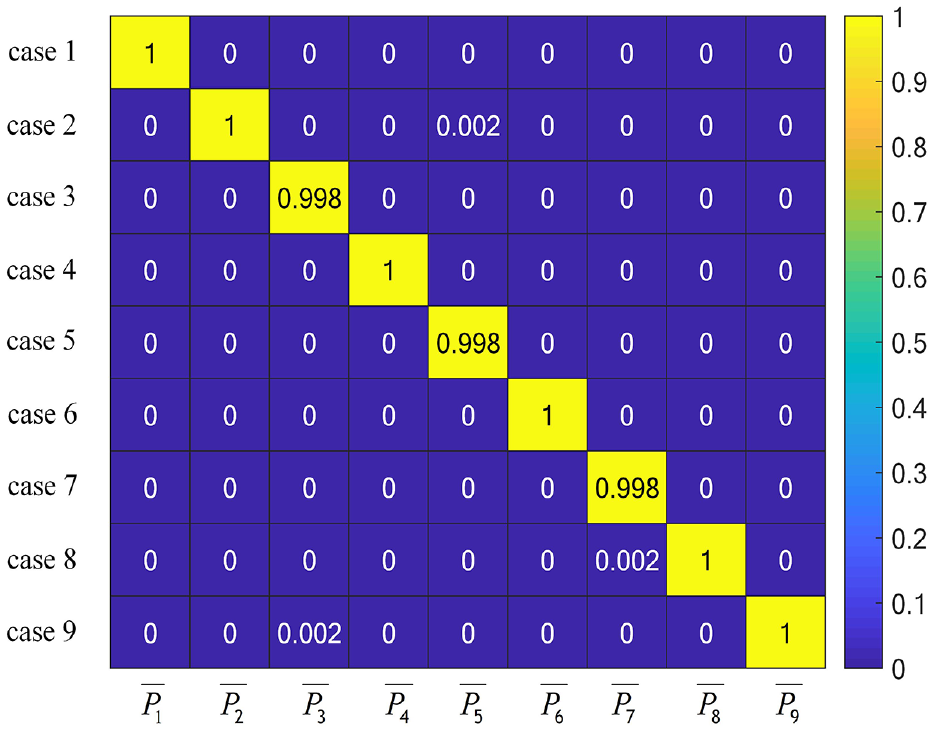
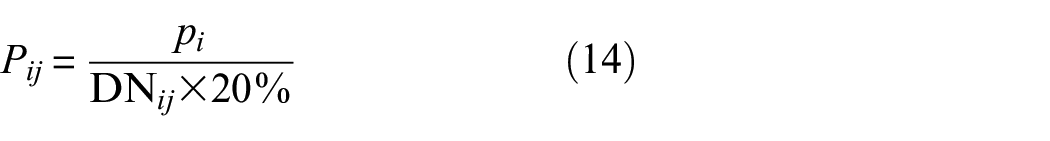
It can be seen from the data in Figure 12 that the maximum average value of Pij under nine damage cases is all 100% except for case 3, case 5 and case 7, which are 99.8%. This shows that the method proposed in this paper has a very low probability of miscalculation when diagnosing the damage location of the frame structure, and has high accuracy. The integrated damage location diagnosis accuracy can be calculated according to the data in Figure 12. The diagnosis accuracy formula is as follows.
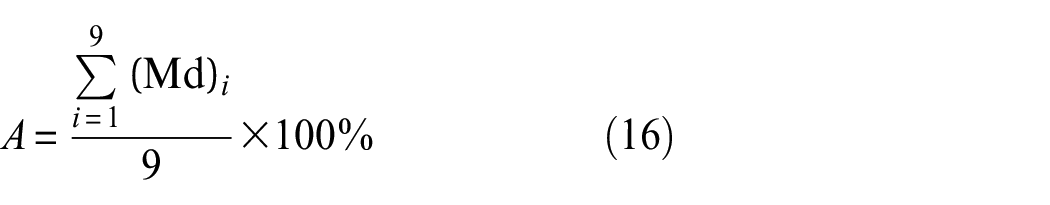
where
Influence of noise on diagnosis results
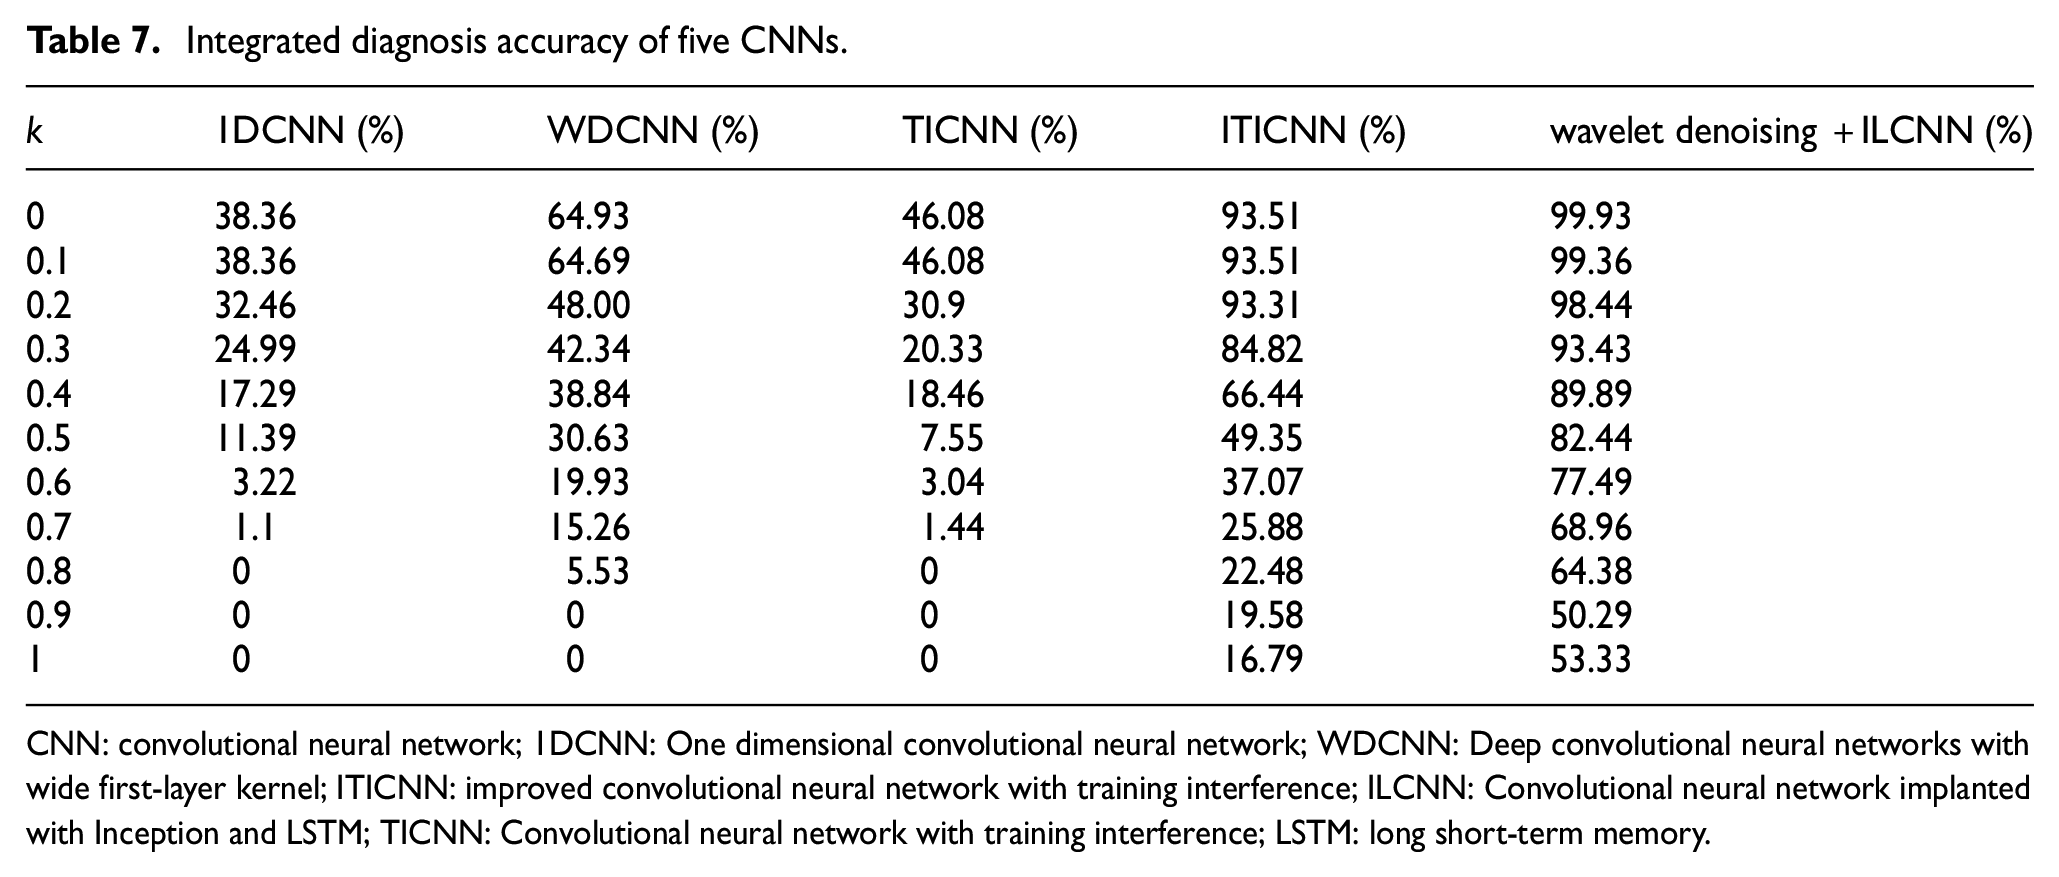
In Section ‘Comparison of anti-noise ability’, the anti-noise ability of 1DCNN, WDCNN, TICNN, ITICNN and the model proposed was compared in this paper when using single sensor data to diagnose the damage location of frame structure through experiments. This section focuses on the anti-noise ability of the above five models in the integrated damage location diagnosis of structural frame. In the experiment, firstly, noise of different intensities were added to the selected sensor data, and then the above five network models were used to conduct integrated damage location diagnosis on the frame structure; finally the diagnosis accuracy of the above five network models was obtained and was used to compare their anti-noise ability. The accuracy of integrated damage location diagnosis of five network models under different noise intensities is shown in Table 7.
Integrated diagnosis accuracy of five CNNs.
CNN: convolutional neural network; 1DCNN: One dimensional convolutional neural network; WDCNN: Deep convolutional neural networks with wide first-layer kernel; ITICNN: improved convolutional neural network with training interference; ILCNN: Convolutional neural network implanted with Inception and LSTM; TICNN: Convolutional neural network with training interference; LSTM: long short-term memory.
It can be seen from the data in the table that when the signal does not contain noise, the method proposed in this paper has the highest accuracy, which verifies the superiority of the method proposed in this paper in the diagnosis accuracy. With the enhancement of noise, the diagnosis accuracy of all models is declining, but the diagnosis accuracy of the method proposed in this paper declines most slowly; when k = 0.3, the accuracy can still reach 93.43%; when k = 0.8, the accuracy is 64.38%, while the accuracy of other models is already very low; when k = 1, the accuracy is 53.33%, at this time, except for ITICCN, the accuracy of other models has been zero. Therefore, the damage location diagnosis method proposed in this paper has the highest integrated diagnosis accuracy, is superior to other CNN models, and has obvious advantages in terms of noise resistance. It can be used as a convolution neural network model for accurate damage location diagnosis of frame structure under noise environment.
Conclusions
In order to realize the accurate damage location diagnosis of structural frame under noise environment, this paper proposed a fault diagnosis method based on wavelet denoising and convolution neural network on the basis of CEEMDAN. In order to verify the effectiveness and superiority of the method proposed in this paper, the 4-story steel frame model of the University of British Columbia was taken as the research object, and the experimental research was carried out with the method proposed in this paper, and under the same conditions, the experimental comparative research was carried out with other similar methods, such as 1DCNN, WDCNN, TICNN, ITICNN. Through performance analysis and comparative experimental research on the proposed methods, the following conclusions can be obtained.
The use of CEEMDAN + adaptive wavelet denoising method can not only effectively remove the noise in the signal, but also retain the feature information of the signal to the greatest extent. Combining this denoising method with CNN can greatly improve the anti-noise ability of the model.
In the case of the same diagnosis model, the diagnosis results obtained by selecting different sensor data as training samples have obvious differences. Therefore, it is necessary to select excellent sensor data as training samples to conduct integrated diagnosis of the damage location of the frame structure. The data collected by five sensors numbered 4, 5, 6, 9, and 14 can be used as training samples.
The method proposed in this paper not only has high accuracy, but also has strong anti-noise ability, and its performance is better than 1DCNN, WDCNN, TICNN, ITICNN. Therefore, the fault diagnosis method proposed in this paper can effectively solve the accurate diagnosis of damage location of frame structure under noise environment.
Footnotes
Declaration of conflicting interests
The author(s) declared no potential conflicts of interest with respect to the research, authorship, and/or publication of this article.
Funding
The author(s) disclosed receipt of the following financial support for the research, authorship, and/or publication of this article: This work was supported by the Nature Science Foundation of Hebei Province grant no. E2020402060, and Key Laboratory of Intelligent Industrial Equipment Technology of Hebei Province (Hebei University of Engineering) under Grant 202204 and 202206.