
Abstract
This paper presents a virtual sensing approach for monitoring the elevator installations. The aim of the proposed virtual sensing approach is to monitor the condition of elevators without installing additional sensors. The adopted virtual sensing approach comprises a coupled-electromechanical elevator model presented in state space domain and a generalized output equation which includes not only the available measurements but also a set of virtual sensors. This virtual sensing approach employs an observer, and this observer estimates other physical quantities that cannot be directly measured with the already installed sensors. The estimated physical quantities are then employed for the calculation of four easy-to-interpret Key Performance Indicators (KPIs). These four indicators will enable to report the condition and triggers maintenance actions of elevator installations. Two of the indicators are related to the elevator ride quality and the energy efficiency which are currently employed by elevator manufacturers for evaluating their elevators. The rest two indicators are related to guide system diagnosis and electrical traction machine diagnosis. Finally, the proposed procedure is experimentally evaluated, by comparing the KPIs calculated based on the estimated virtual sensors and actual measurements, with the values obtained from the additional set of sensors installed in an elevator test tower.
Introduction
Nowadays, the main worldwide trend supporting growth in the elevator business is the growth of urban areas. The urban areas will continue to grow because it is expected that around 70% of the global population will be living in these areas by the end of this century. Currently, more than 1 billion people are lifted every day in the world by 15 million elevators. This volume of elevators involves a worldwide market for the elevator business of approximately $99 billions, and it is expected to grow up to $167 billions by 2025. 1 The sales structure of the elevator business is shown in Figure 1, according to the market study. 2 New elevator installation sales account for 50%–55% of the turnover whereas the rest of the turnover accounts for maintenance (32%–36%) and modernization (13%–14%) services.
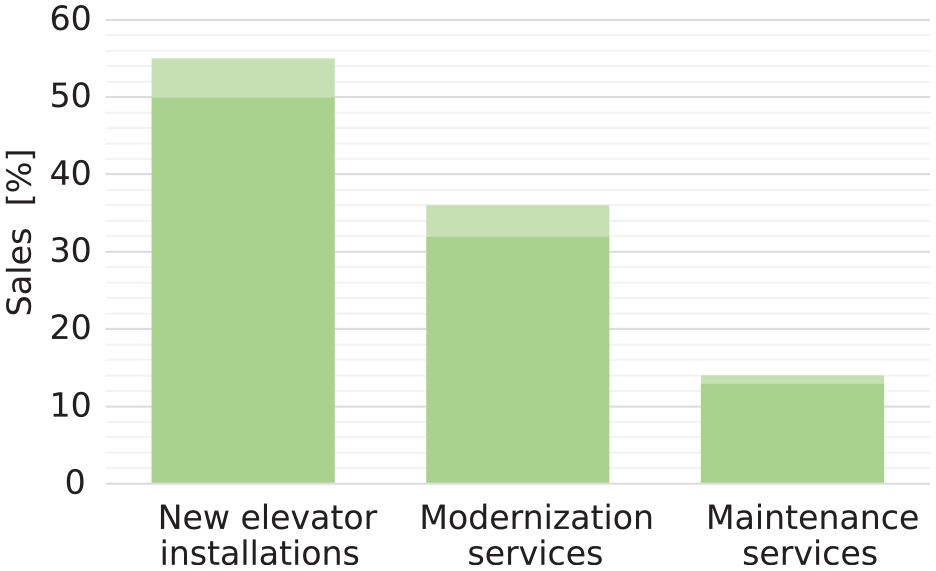
Sales structure of the elevator business.
Contrary to modernization services, maintenance services generate revenues through the entire life of the elevator installation. 3 In fact, the average annual revenue of maintenance service is around $2400 for each elevator installation. 4 However, the profit in maintenance services is decreasing due to the escalation of costs. 5 The cost structure of the maintenance services is shown in Figure 2. The cost of in situ inspections, including the labor costs and materials, account for 90% of the total cost whereas the fixed costs (10%) are mainly due to fees that are not related to inspections, transportation, and supplies. Reducing the number of in situ inspections would allow to decrease the cost of maintenance services and consequently increase the profit margins.
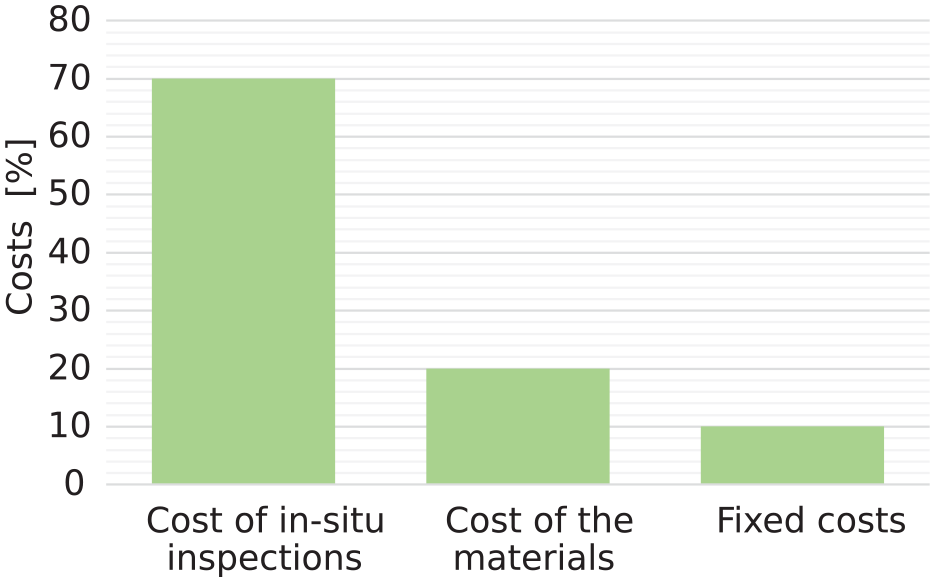
Actual cost structure of the elevator business.
New trends in maintenance technologies such as condition monitoring, data mining, or cloud computing have been proposed as potential ways for reducing the number of in situ inspections.6,7 In fact, recently some leading elevator companies, such as ThyssenKrupp, Otis, or Kone, have started using condition monitoring in their inspection systems for maintenance services.8–11 These inspection systems monitor the condition of elevators by acquiring data from already installed sensors and additional sensors.
An elevator installation comprises both mechanical and electrical subsystems as it is shown in Figure 3. The elevator car (1) comprises the cabin and the frame. The cabin is an enclosed space where the passengers or loads are carried upwards or downwards. The frame provides the supporting structure for the cabin, and the suspension ropes are attached to it. The mass of the car and its load are partially counterbalanced by the counterweight (2), to reduce the torque demanded to the electrical traction machine (3). The electrical traction machine drives through a traction pulley onto the suspension ropes (4) which interconnects the elevator car and the counterweight. Both the elevator car and the counterweight move vertically, constrained by a pair of rails each (5). These rails are fixed to the hoistway (6). The electrical traction machine is controlled by a regulator. This regulator controls both velocity and torque in a closed-loop configuration. The velocity signature is calculated for each ride, depending on the starting car position and its final height. This regulator also acquires signals from the set of sensors available in the elevator.
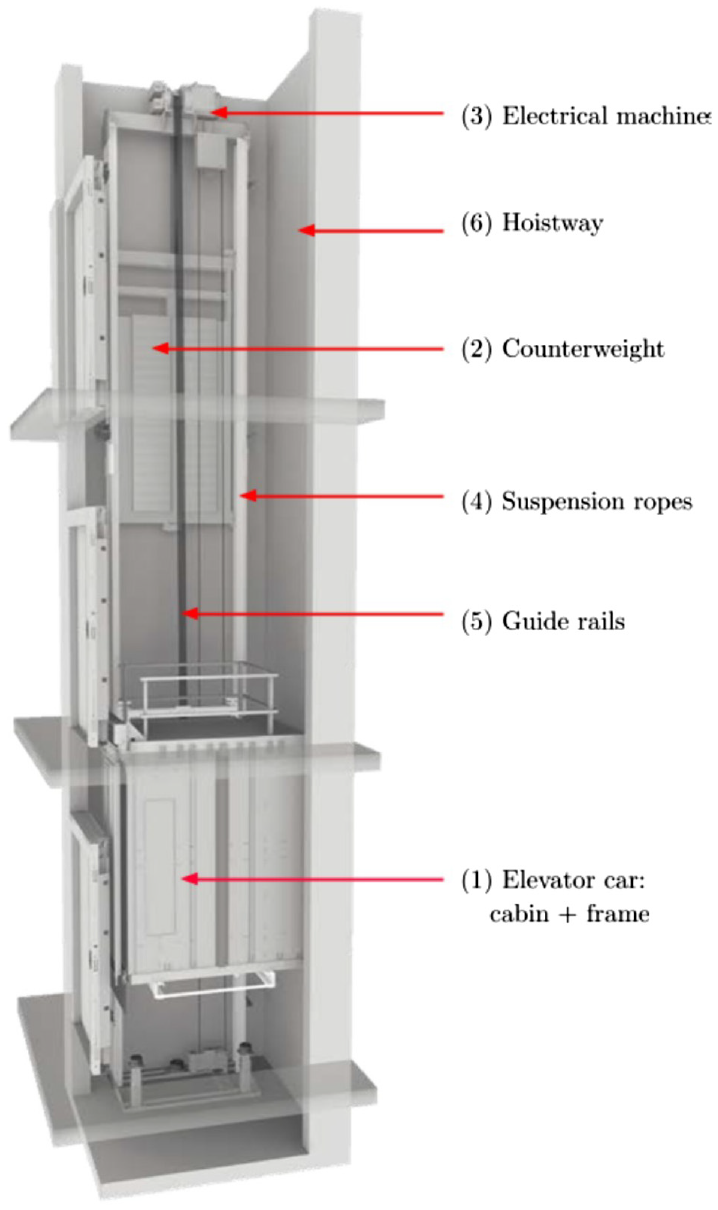
A typical passenger elevator.
The typical set of sensors available in an elevator installation is shown in Figure 4. 12 The encoder of the machine (1) is used for measuring the angular position of the rotor shaft, the current and voltage sensors (2) are used as feedback for controlling the electrical traction machine. A draw-wire encoder (3) measures the vertical position of the elevator car. Limit switches (5) detect the highest and lowest car position in the hoistway. Infrared sensors (6) are installed in the elevator car to detect obstacles at doors. The load inside the cabin is measured by a force sensor installed at the bottom of the elevator car (4).
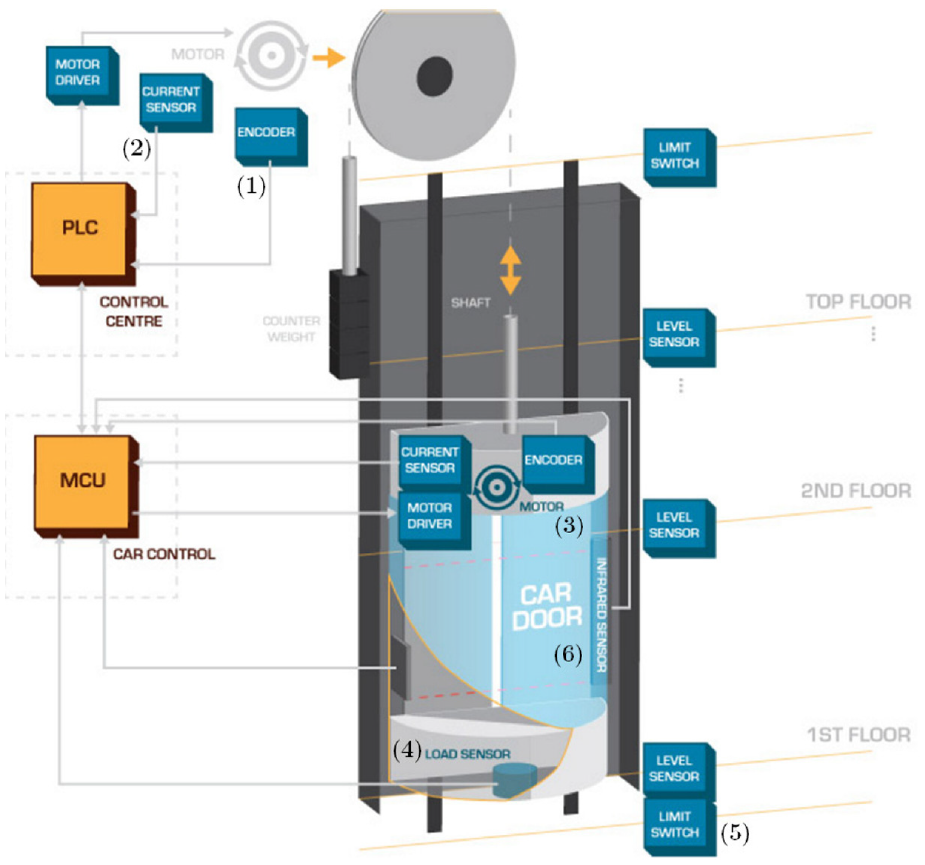
An elevator installation sensing system.
The use of these sensors for monitoring could be a competitive advantage for elevator companies due to the following facts.
The already installed sensors are proven to be robust and they are necessary for operation.
Employing available signals facilitates the implementation of remote monitoring systems, 13 because new additional sensors would impose additional costs and they can also be prone to malfunction.
Condition monitoring comprises different monitoring techniques and their selection depend, among other factors, on the prior knowledge about the monitored system and the set of sensors available. An excellent survey of condition monitoring techniques can be found in14,15 where model-based and data driven approaches are compared. Data-driven approaches are suitable for applications where a limited a priori knowledge of the monitored system is available. 16 The performance of data-driven approaches is also highly dependent on the quality and the quantity of the available data.17,18 Regarding model-based approaches, they rely on the availability of a mathematical model for the monitored system, which can be derived from physical modeling principles. 19 The performance of model-based techniques depends to a large extent on the accuracy of the model when describing the dynamics of interest. Furthermore, a model-based approach should require a sufficiently generic model to address variations in the elevator configuration. Nevertheless, model-based approaches have been successfully employed for electromechanical systems monitoring and control applications.20–22
A summary of condition monitoring techniques proposed in the literature for the early detection of elevator failures is presented in Table 1. Condition monitoring techniques are classified depending on the failure they focus on and the sensors they use.
Condition monitoring techniques proposed for elevator installations.
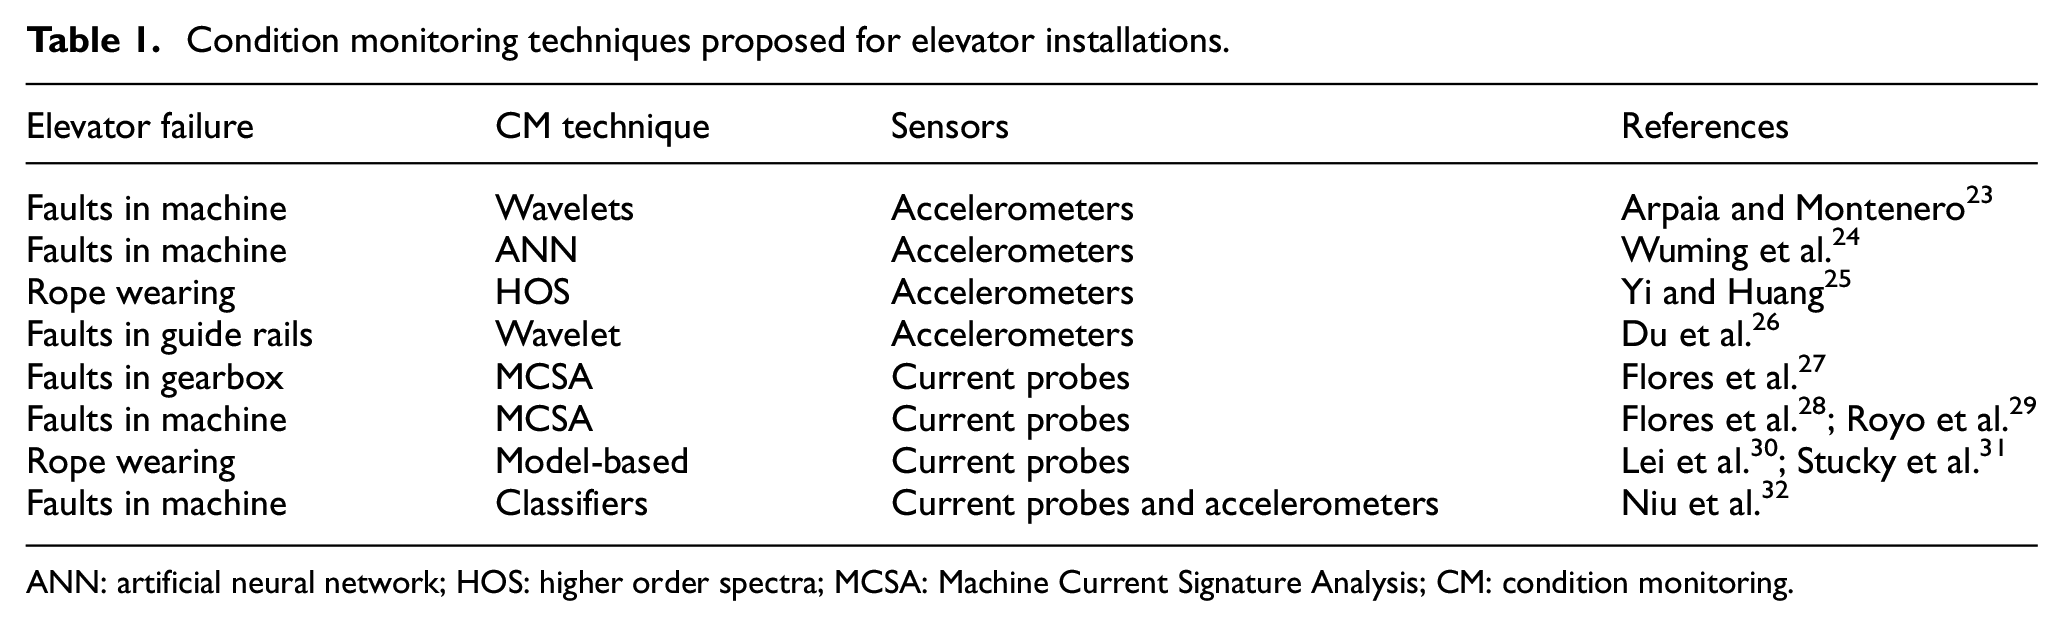
ANN: artificial neural network; HOS: higher order spectra; MCSA: Machine Current Signature Analysis; CM: condition monitoring.
Condition monitoring techniques employed in23–26,32 are based on processing acceleration signals by means of classifiers such as artificial neural network (ANN), time-frequency domain techniques, wavelets and higher order spectra (HOS). These techniques are highly dependent on the quality of data, and furthermore, they employ accelerometers which are not readily available in the elevator. Condition monitoring approaches proposed in27–28 are based on the Machine Current Signature Analysis (MCSA) technique. MCSA analyzes the machine current frequency spectrum and the variations in the spectrum are employed for detecting failures based on feature patterns for each failure. Failure patterns for different failures are well known in the literature when the machine is working in steady conditions. 33 However, the elevator operates in a time-varying regime. Therefore, MCSA-based condition monitoring approach is not well suited for monitoring the condition during a ride. The references30,31 propose model-based techniques for monitoring steel ropes by measuring their electrical resistance. However, these approaches employ sensors which are not readily available in the elevator.
Model-based approaches such as those based on observers (e.g. Kalman filter (KF) or the sliding mode observer algorithms), have been proposed for monitoring elevators with already existing signals.34,35 However, using existing signals and estimating system parameters, other modeled quantities which cannot be directly measured can be estimated. This is also known as model-based virtual sensing strategy,36–38 where the estimations such as those based on observers are the virtual sensors.
Some common virtual sensing algorithms39,40 for monitoring time-varying systems such as the elevator vertical dynamics are shown in Table 2.
Observer algorithms for virtual sensing and its applicability for monitoring elevators.
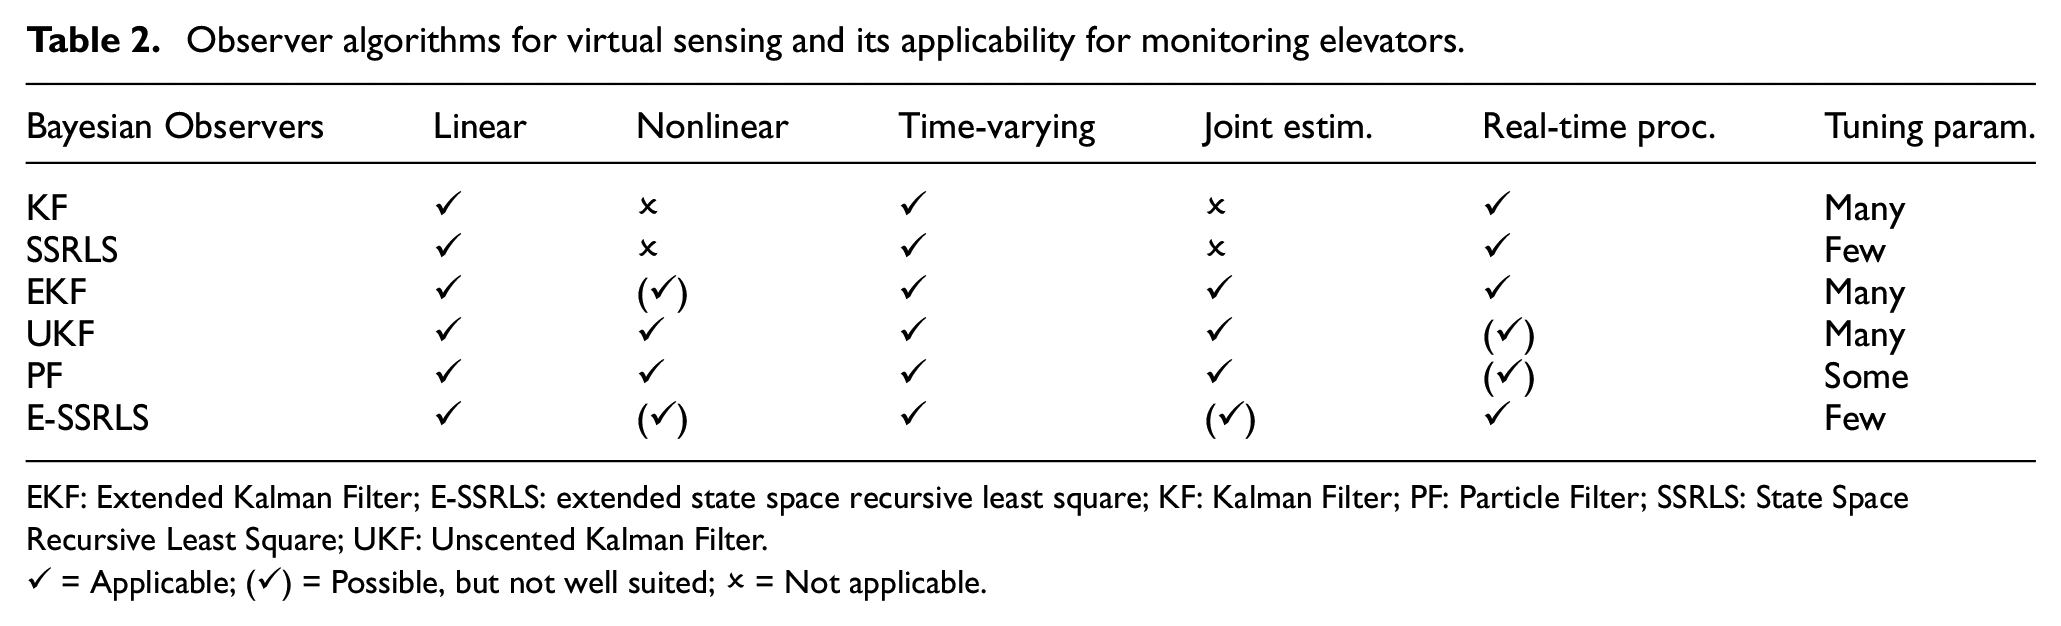
EKF: Extended Kalman Filter; E-SSRLS: extended state space recursive least square; KF: Kalman Filter; PF: Particle Filter; SSRLS: State Space Recursive Least Square; UKF: Unscented Kalman Filter.
✓ = Applicable; (✓) = Possible, but not well suited; ✗ = Not applicable.
Bayesian observer algorithms, both the KF and the State Space Recursive Least Square (SSRLS) were initially developed as observers for linear systems. 41 The main advantage of the SSRLS over the KF algorithm is that fewer tuning parameters are required. 42 None of them can be used for estimating simultaneously states and parameters by means of a joint estimation approach. For the joint estimation approach, the Extended Kalman Filter (EKF) might be employed, by linearizing the monitored system around an operating point for each time step. If the model cannot be linearized, other algorithms such as the Unscented Kalman Filter (UKF) or the Particle Filter (PF) have been proposed in the literature. 43 UKF and PF require higher computational effort than the EKF.44,45
The extended state space recursive least square (E-SSRLS) algorithm has recently been proposed as an extension of the SSRLS algorithm for nonlinear systems, 46 similarly to EKF for KF.
Once the system states and parameters of interest are monitored using virtual sensor algorithms, tools can be used to trigger maintenance actions. A valuable tool for triggering maintenance actions are the Key Performance Indicators (KPIs).47,48 A useful KPI for maintenance, identifies the issues causing maintenance effects and helps to determine the right maintenance actions, improving both equipment reliability and maintenance performance. 49
Currently, the main KPIs employed for evaluating an elevator are related to the ride quality 50 and the energy efficiency. 51 The evaluation of the elevator ride quality is standardized by the ISO 18738-1:2012 standard. This standard encourages industry-wide uniformity in the measurement and processing of elevator car vibration signals by defining several KPIs. 52 Most of the KPIs established by this standard are calculated by processing the elevator car acceleration in the vertical direction. Currently, the ride quality is evaluated according to the aforementioned standard and employing commercial equipment designed specifically for inspecting elevators. The EVA-625 53 and the Lift PC 54 are portable systems that evaluate the ride quality. The use of these commercial systems requires installing an accelerometer on the floor of the elevator car.
The calculation of energy efficiency KPIs is standardized by the ISO 25745-1:2012 standard. This standard defines energy KPIs based on the energy consumption. Based on these KPIs, elevator installations are classified according to their energy efficiency (from lower efficiency G to higher efficiency A).
The information extracted from monitoring systems can be used for estimating these KPIs continuously. Furthermore, monitoring systems can be used to define a set of easy-to-interpret indicators, which can indicate the condition of an elevator while it is operating.
This paper proposes a virtual sensing approach for monitoring and maintenance of the elevator installations. This approach is based on the joint estimation of states, parameters, and virtual sensors employing an observer algorithm and an elevator model derived from physical modeling principles. Then, estimations are used for defining a set of novel KPIs. These KPIs enable to report the condition and trigger maintenance actions of elevator installations from failures which cannot be detected solely from actual measurements.
The rest of the paper is organized as follows. In Section ‘the virtual sensing-based monitoring and maintenance approach’ employed in elevator installations is explained. In Section ‘Definition of the key performance indicators obtained from the virtual sensing approach’, novel KPIs extracted from the virtual sensing algorithms are defined. In Section ‘Experimental testing in a real elevator installation’, virtual sensing-based monitoring approach is experimentally validated in a real elevator installation and finally several conclusions are discussed in the last section.
Virtual sensing-based monitoring and maintenance approach
The virtual sensing-based monitoring and maintenance in elevator presented in this paper follows the flowchart shown in Figure 5. This flowchart is divided into six steps.
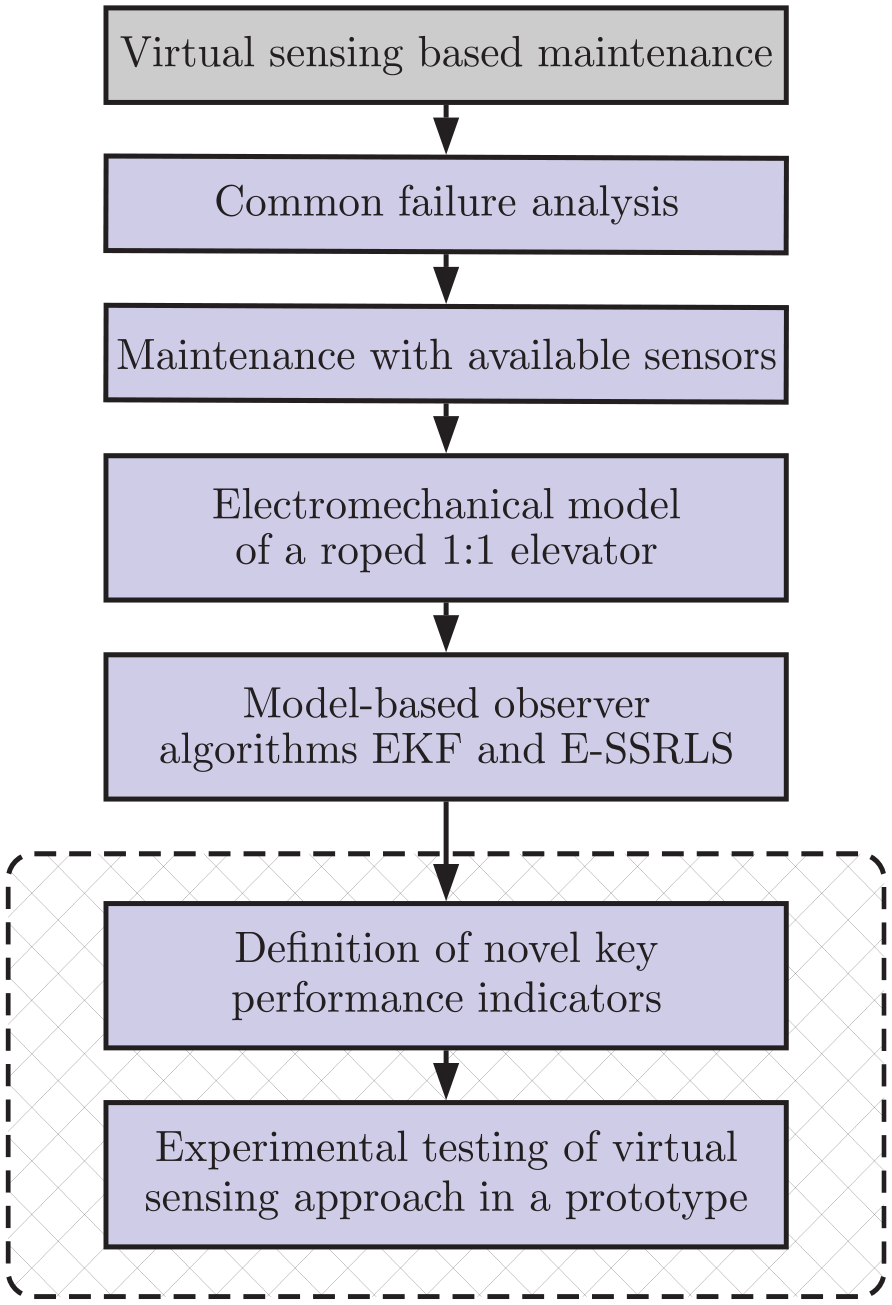
Flowchart of the virtual sensing-based monitoring and maintenance.
Firstly, common failures in elevator installations are analyzed by failure analysis techniques such as fault tree analysis, risk classification or failure modes and effects analysis. 55 Based on these techniques, the only published quantitative analysis of failure causes in elevator installations, known by the author, is presented in. 56 The analysis presented in 56 is based on failure statistical data compiled by the Korea Elevator Safety Institute. More than one thousand different elevator installations are analyzed (see Figure 6). Damage of electrical components and mounting errors of the guiding system account for 66% of the elevator breakdowns. The degradation of the suspension ropes and the excessive vibration of the elevator car account for 9% of the elevator breakdowns. The rest of the breakdown causes are mainly related to the malfunction of other components such as safety devices and doors.
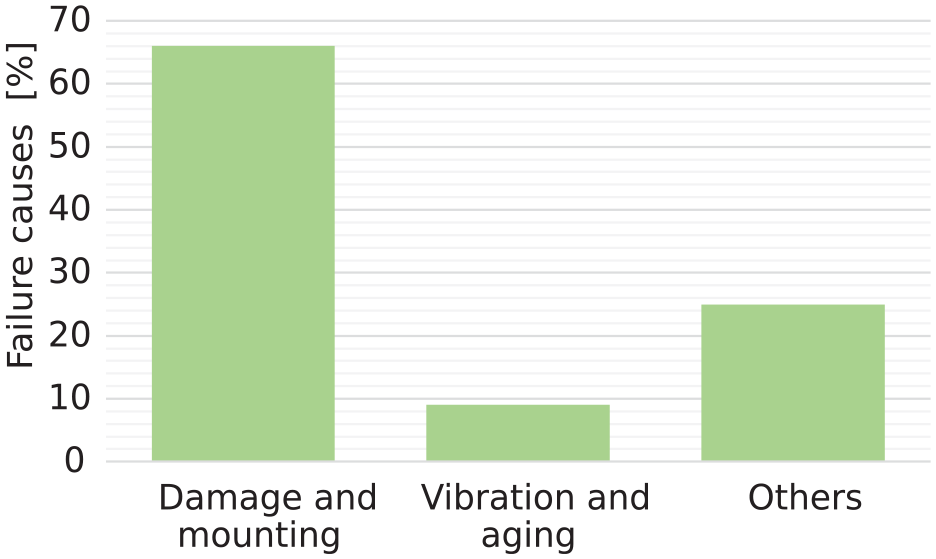
Elevator structure according to failure causes.
Therefore, early detection of the aforementioned failures by means of condition monitoring have received major attention in the literature23–27,30,32 in order to reduce the number of breakdowns.
Secondly, the sensor set is selected based on the available sensors in a system and considering the information provided by each sensor for detecting the aforementioned failures. The available sensors in an elevator system is described in Figure 4 and the information provided by each sensor can be analyzed by sensitivity analysis methods (e.g. Fisher Information Matrix (FIM) 57 or information filters46,58). These methods determine the amount of information that a set of sensor has about a parameter, by calculating partial derivative of the measured outputs with respect to model parameters. 59 The main advantage of sensitivity analysis methods is that it can be employed for considerably large or nonlinear systems. 60 In a roped 1:1 elevator system, the information filters such as the Extended Information Filter (EIF) algorithm can be employed for the optimal sensor set selection for identifying unknown parameters of interest. The main advantage of the proposed information filters for sensor set selection compared to other sensor set selection techniques based on the Fisher sense, is that the information filters not only take into account the information from measurements but also the information of the process and its uncertainties. Therefore, information filters can present a more robust parameter identifiability analysis than those based solely on Fisher information. 46 As it is shown in previous works of the Authors 46 the sensor set selected for monitoring the common failures in an elevator system are: the electrical magnitudes (voltages, currents, and encoder signals) from the regulator and the draw-wire encoder installed in the elevator car. This sensor set selection is experimentally evaluated in a scaled elevator test bench.61,62
The third and fourth steps of the virtual sensing approch is the development of an elevator model and the application of an observer algorithm respectively. The elevator model employed in this work is based on a previous model developed by the authors.34,63 In that paper, the authors presented a coupled electromechanical model for monitoring the ride quality of an elevator car by means of EKF or E-SSRLS algorithms. This model comprises both the mechanical and the electrical subsystems, including the electrical traction machine and a closed-loop Field Oriented Control (FOC). This model considers the vertical dynamics of the mechanical subsystem, but includes the friction forces caused by the lateral car-rail and counterweight-rail forces. The rest of the uncertainties of the model are considered as additive Gaussian process noise in the EKF algorithm or as a forgetting factor in E-SSRLS algorithm.
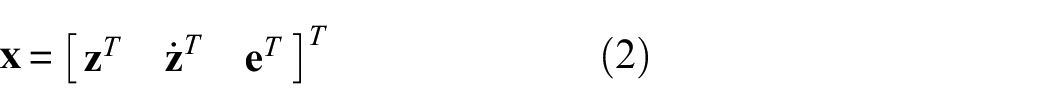
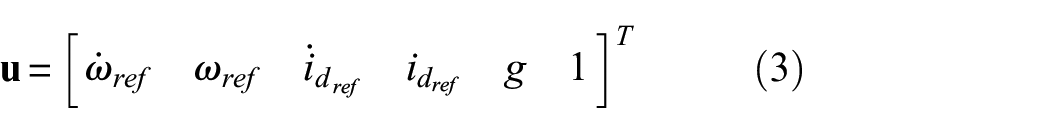
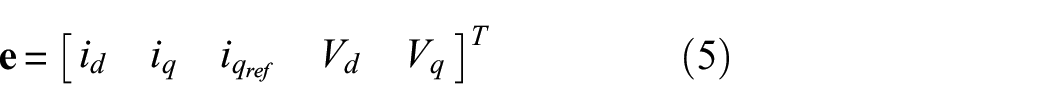
As shown in(Esteban et al.,34,63 the elevator model including the friction forces can be represented in the state space domain as follows,

where
where

Regarding the output equation of a state-space representation, the output depends on the available sensors in the system. 64 The output equation presented in 34 is a linear system written in matrix form as follows,

where
The output equation can be generalized including the elevator rail friction forces as a set of virtual sensors. These virtual sensors can be modeled as a linear combination of the states and inputs as follows,

where
The general output model with virtual sensors for the elevator system is obtained after combining the Equations (6) and (7) in matrix form as follows,
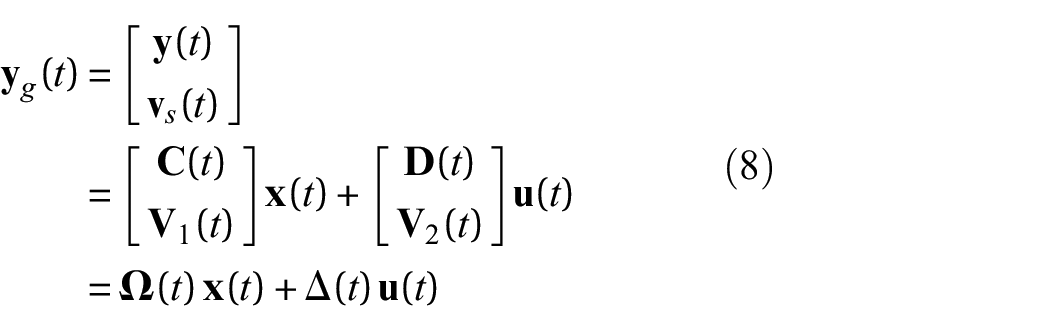
where
For selecting a specific set of observations, the general output equation, Equation (8) can be multiplied by a binary matrix
1
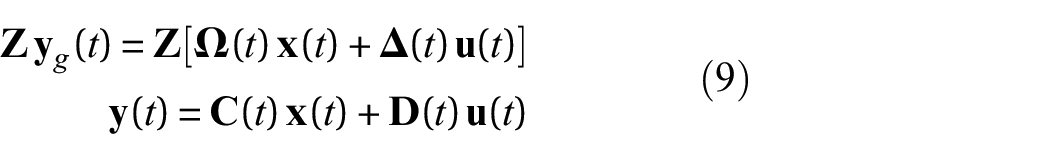
where the output vector is
The Equations (1) and (9) are the state-space representation of the elevator model including the virtual sensors required for monitoring the elevator rail friction forces. These two equations can be employed with the observer algorithms presented in Table 2 by means of the joint estimation approach. As it is shown in previous works of the Authors the elevator system is monitored by the estimations obtained with the EKF and E-SSRLS observer algorithms. 46
The last two steps (highlighted in the flowchart) are the definition of the novel KPIs and their experimental evaluation in an elevator prototype which are proposed in this paper.
Definition of the key performance indicators obtained from the virtual sensing approach
The following set of easy-to-interpret indicators are defined in this section: KPIs for evaluating the condition of the guiding system; KPIs for evaluating the condition of the electrical traction machine and KPIs for evaluating energy efficiency. Additionally, four ride quality KPI defined by the ISO 18738:1-2012 standard are estimated without using additional accelerometer in the elevator car.
These KPIs can be estimated using the elevator models previously presented, the observer and already installed sensors from the elevator. Finally, the KPIs based on estimations are compared with those obtained based on actual measurements in a real elevator installation.
KPIs for the guiding system
Car-rail and counterweight-rail friction coefficients,
where these equations are the virtual sensors of elevator rail friction forces. Identifying
As an illustrative example, the estimations of the parameters
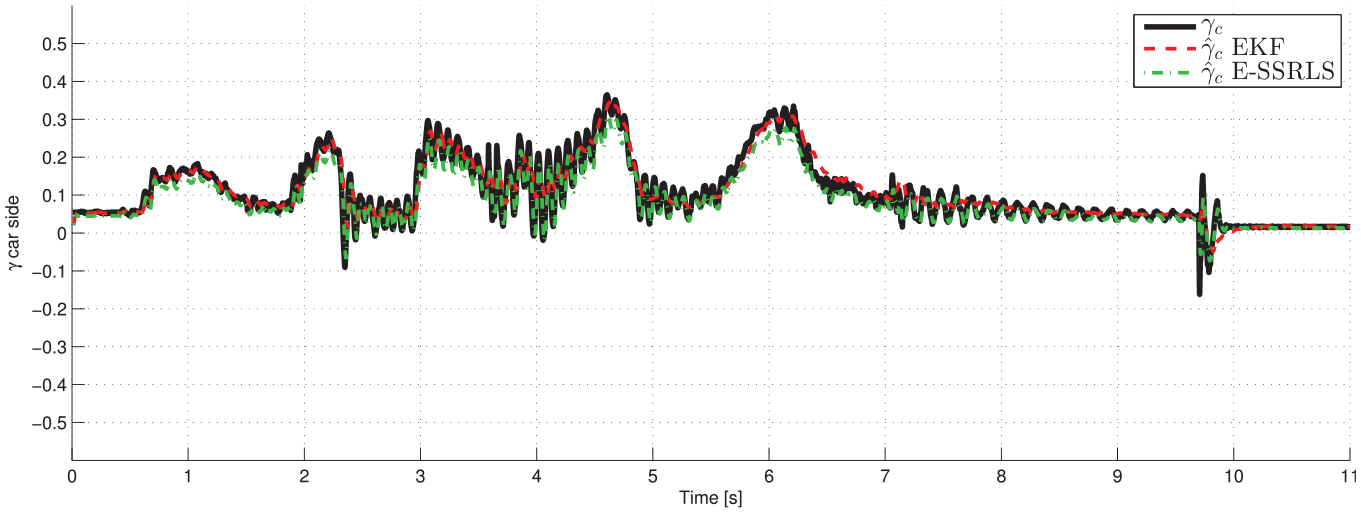
Comparison of the parameter
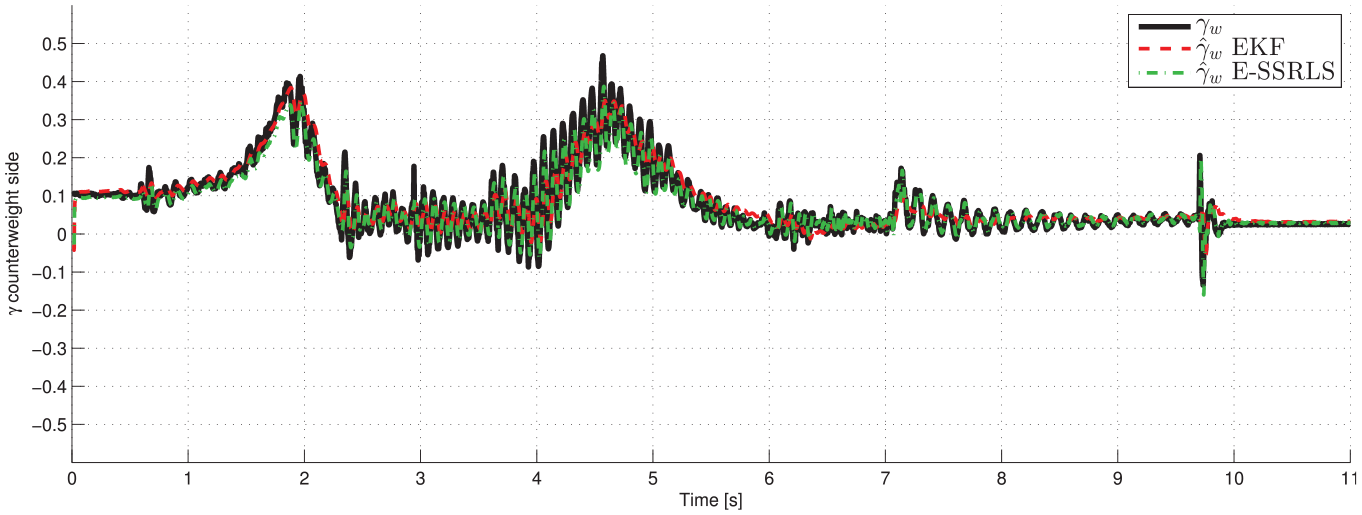
Comparison of the parameter
Both KPIs can be instantaneously estimated during a ride, so they can be related to height. This facilitates the maintenance of the guiding system because the evolution of the friction is represented in height and the technician can detect where the failure is.
KPIs for the machine
KPIs are proposed for detecting the mutual torque ripple for the machine. The torque exerted by the machine,
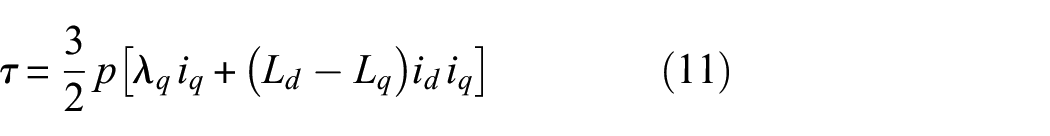
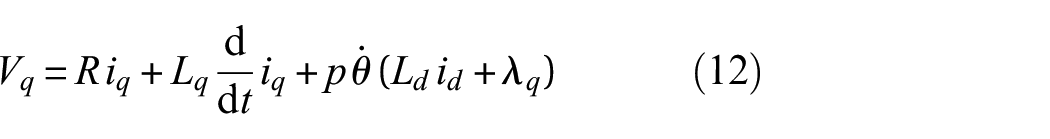
where, V, i and L denote the voltages, current and inductance, and the subscripts d and q denote the direct and quadrature axis respectively. The resistance of the stator is denoted by R,
The mutual torque ripple,

The identification of the magnitude and phase of the mutual torque ripple is essential in order to reduce the noise and vibration in PMSMs. 68 In fact, as stated in references,69–71 the 6th harmonic of the mutual torque ripple is the most critical in PMSM driven elevators, because it acts as a disturbance load, causing vertical vibrations on the elevator car.
The magnitude and phase of the mutual torque ripple is related with the rotor magnetic flux linkage,72,73 which can be expanded as a Fourier series as follows, 68
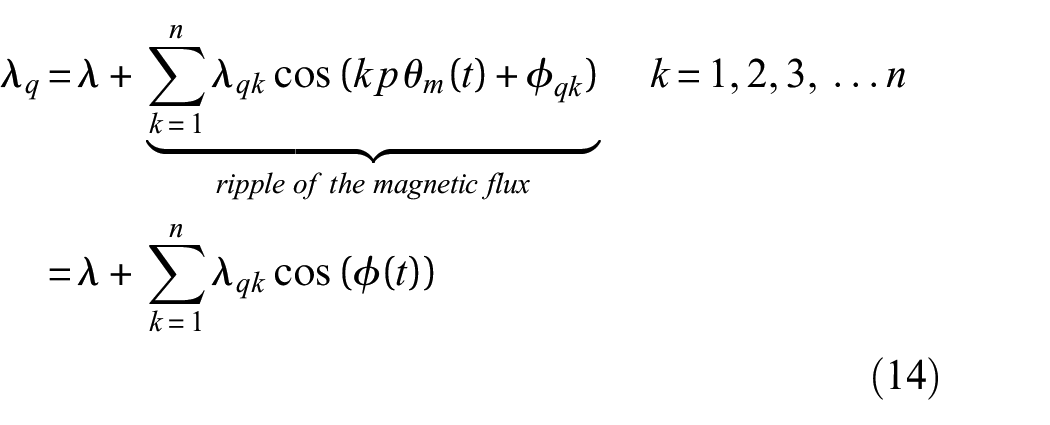
where
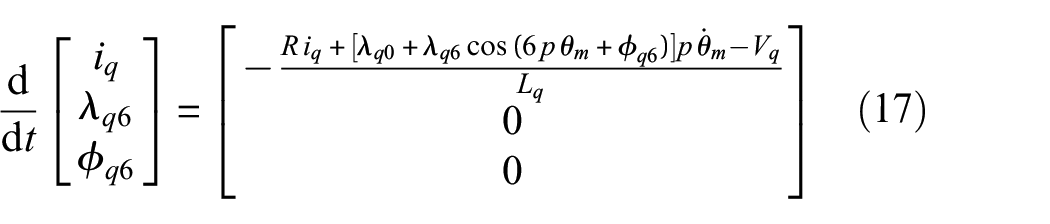
Introducing Equation (14) in Equation (12), the following electrical equation and considering only the effect of the 6th harmonic mutual torque ripple can be obtained.
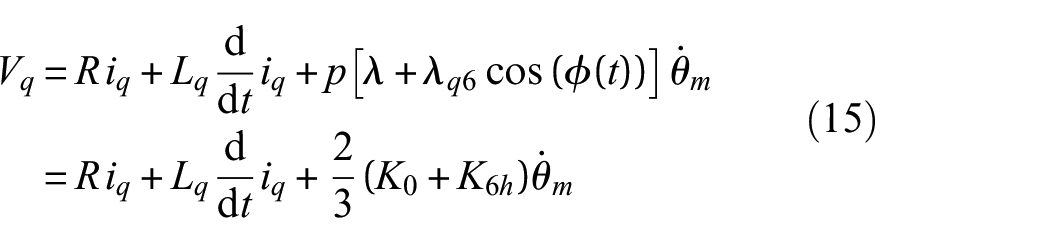
where
where
The amplitude
Estimation of the parameters
and
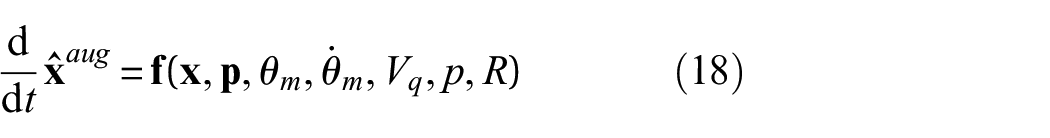
The encoder of the machine, as well as the quadrature voltage and currents are measured for estimating the parameter vector
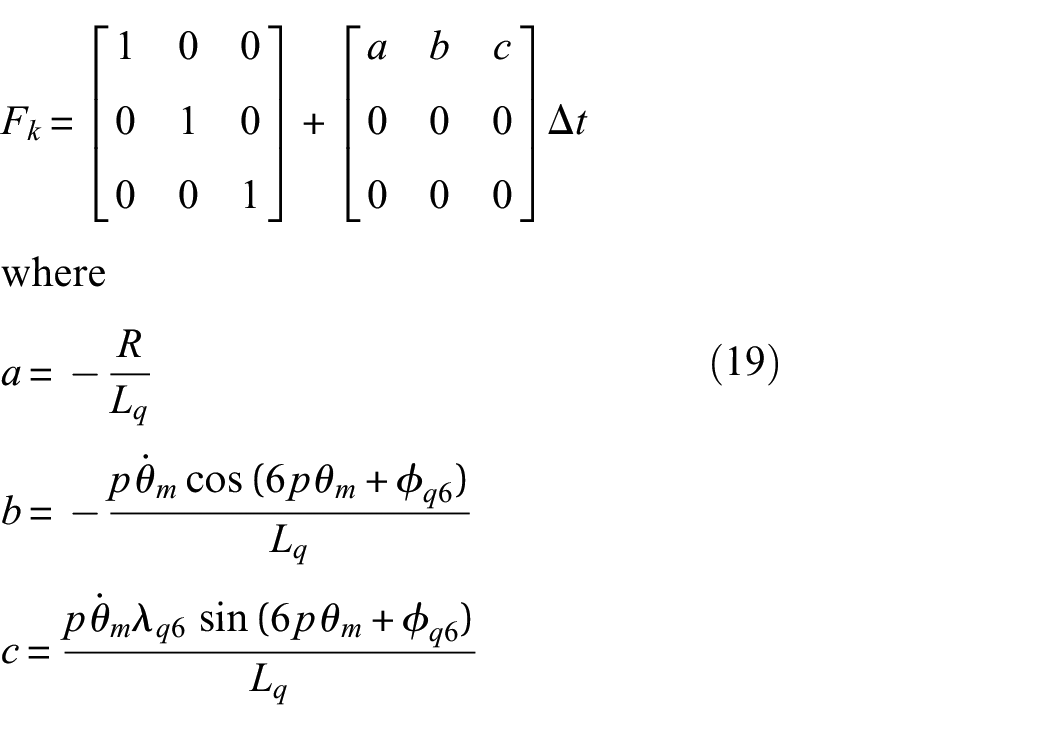
The discrete Jacobian of the system,

The Equations (17) and (20) are the state-space representation of the electrical traction machine including the parameters required for detecting the mutual torque ripple. These two equations can be employed with the observer algorithms presented in Table 2 by means of the joint estimation approach.
KPIs for evaluating the energy efficiency
An elevator system can consume or generate energy depending on the operating mode of the elevator, as shown in Figure 9. In operating modes (1) and (2), the torque exerted by the machine and the rotation of the pulley are in the same sense of rotation; hence, an elevator consumes energy. In operating modes (3) and (4), the torque exerted by the machine and the rotation of the pulley rotate in the opposite sense and the elevator generates energy.
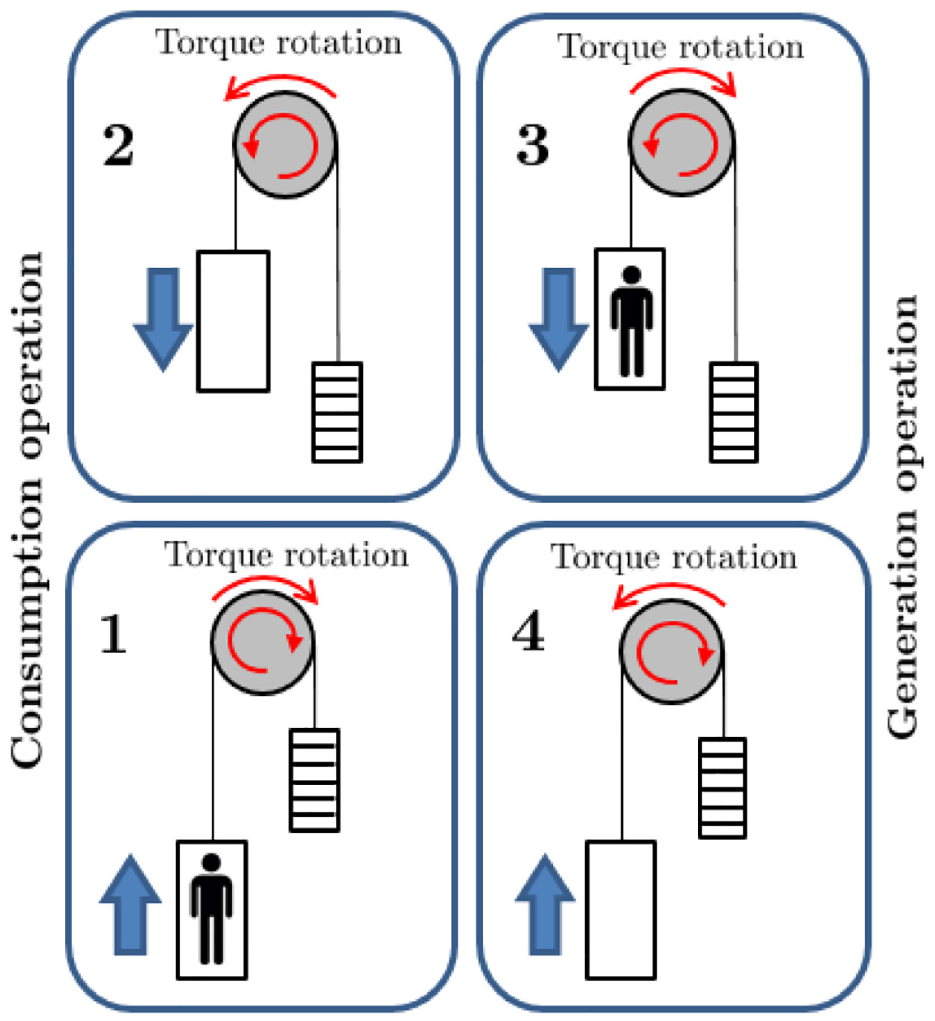
Operating modes of an elevator.
Five KPIs are proposed for evaluating the energy efficiency (see Table 3). These KPIs provide information about energy losses of the elevator in the electrical and mechanical subsystems. The machine energy efficiency KPI,
KPIs for monitoring the elevator energy efficiency.
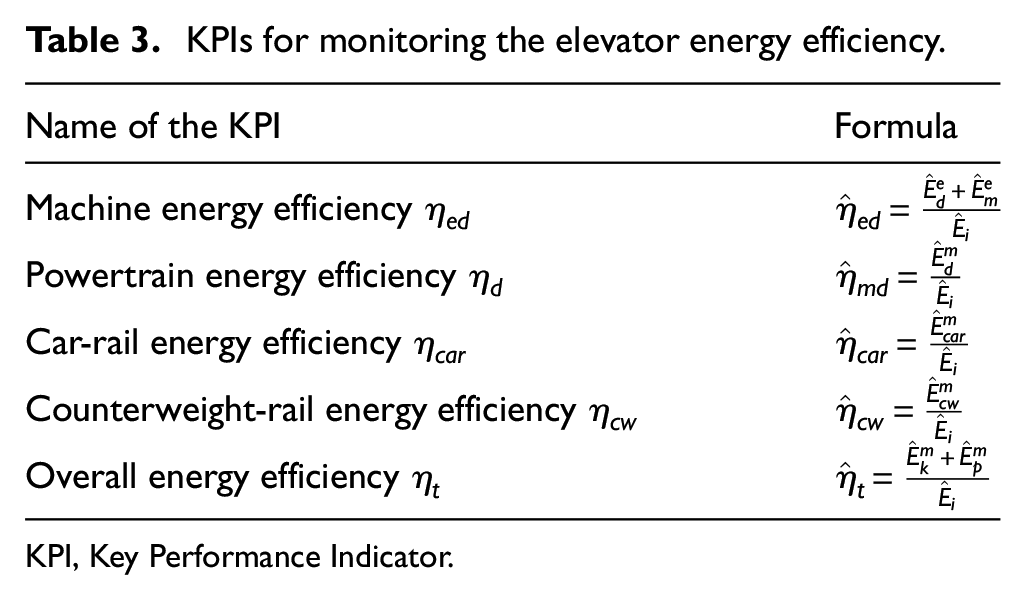
KPI, Key Performance Indicator.
These five KPIs are calculated based on energy balance models which can be derived from the elevator model Equation (1) (see Supplemental Appendix 1 for the details). The energy balance equation of an elevator is,

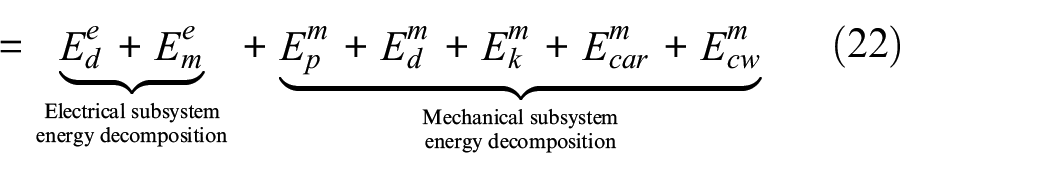
where
Ride quality KPIs
Four indicators defined by the ISO 18738:1-2012 standard are proposed as KPIs for ride quality: the maximum velocity and maximum jerk of the car, as well as the V95 and the A95 indicators
75
that they are related to passenger comfort.
75
The A95 is defined as the 95 percentile of the maximum car vibration amplitude during the ride, whereas the V95 is defined as the 95 percentile of the maximum car velocity amplitude during the ride. These four indicators are based on processing the estimated car acceleration. Instead of measuring the car acceleration signal which requires additional sensors, the car acceleration signal
As an illustrative example, the estimated car accelerations employing both the EKF and the E-SSRLS algorithm are compared with the measured acceleration in Figure 10. The car acceleration estimation results for both algorithms are understimated compared to the measured acceleration. The measured car acceleration is done with a DC accelerometer, model Henning QS2 which has a different signal-to-noise ratio than the draw-wire encoder signal employed for the observers. This deviation can be attributed to the high precision of the draw-wire encoder signal which is used as a measure of the elevator car position in the observers.
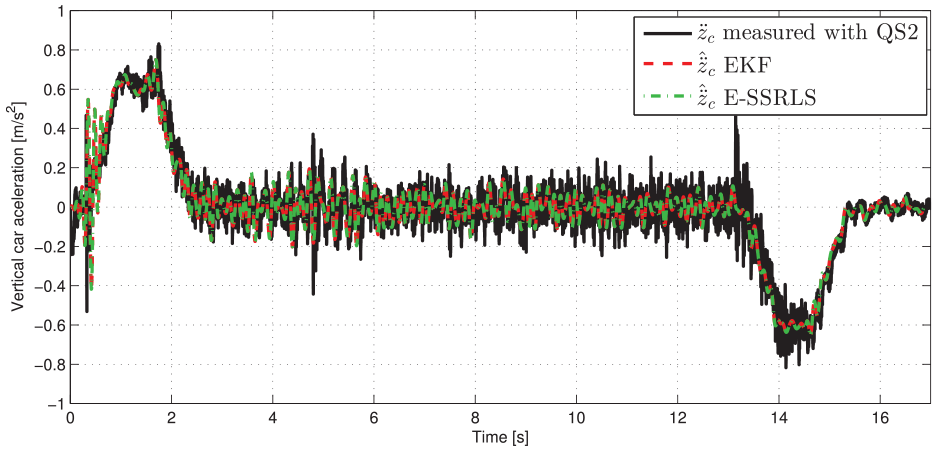
Comparison of the estimated car acceleration based on both EKF and E-SSRLS with actual measurements.
Experimental testing in a real elevator installation
Experimental tests were carried out in an elevator at ElectraVitoria test tower, address Pol. Ind. de Jundiz, Zurrupitieta Kalea, 30, 01015 Vitoria-Gasteiz, Araba (see Figure 11). The aim was to evaluate experimentally the model-based virtual sensing approach in a real elevator installation. The unknown states (
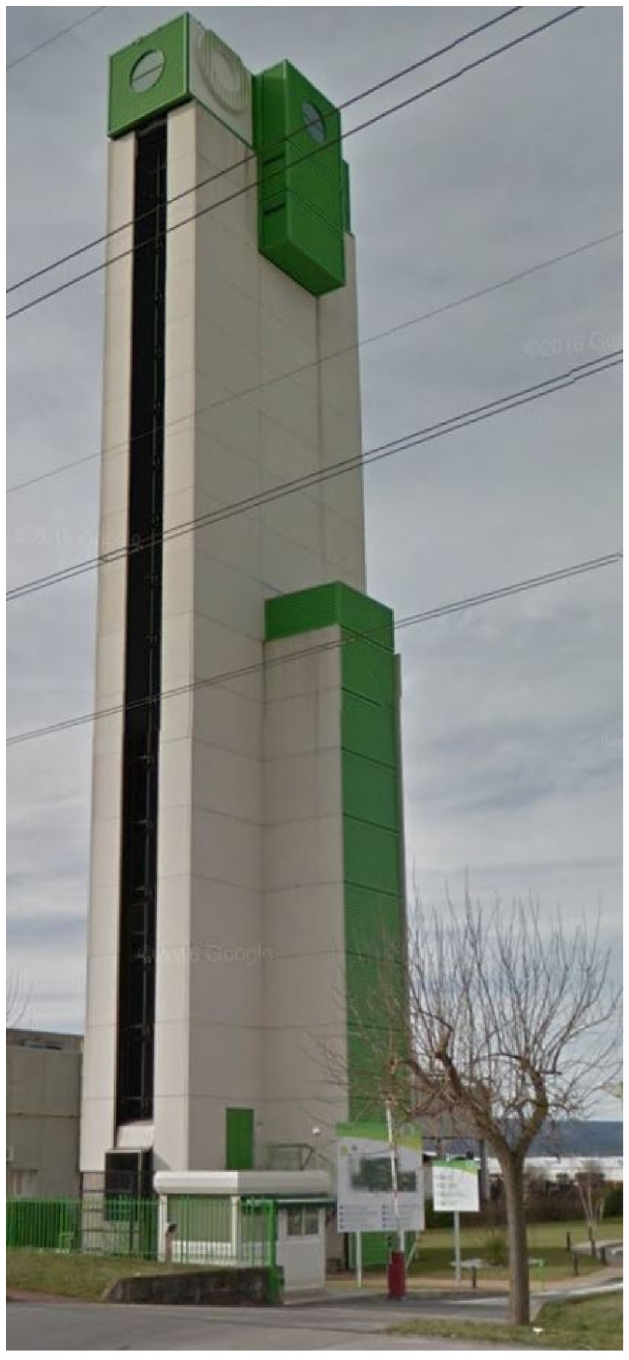
Elevator test tower.
This elevator has a 1:1 rope configuration with several ropes in parallel and it is driven by a PMSM with a three-phase wye-wound stator. The PMSM is controlled using a regulator with a FOC architecture. The height of the hoistway is 18 [m] with a total ride distance of 15 [m], and the mass of the counterweight is 50% larger than the car mass. The mass of the elevator car is off-centered regarding the tensile force applied by the ropes, whereas the mass of the counterweight is centered. The elevator car is moving upwards during the analyzed test ride. Table 4 shows the sensors measured in the test.
Sensor set employed during the tests and their corresponding usage.
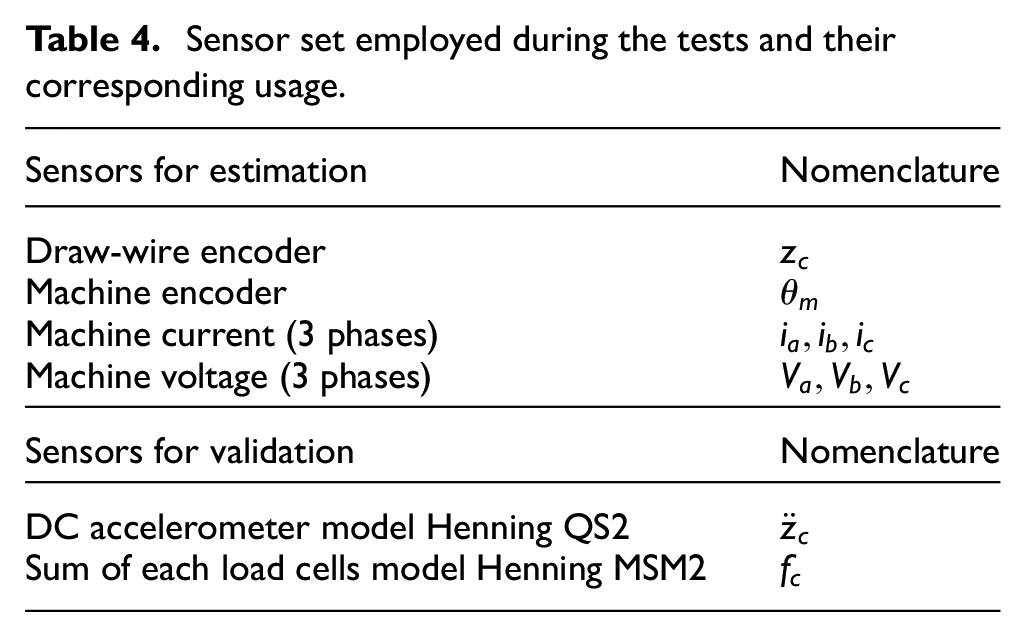
All the sensed magnitudes have been acquired with a sampling frequency of 50 kHz, and they have been recorded by a NI 9225 module and two NI 9239 modules, fixed to a National Instruments cDAQ-9178 acquisition rack. Additionally, a DC accelerometer, model Henning QS2, is installed on the floor of the car, and rope load sensor, model Henning Weightwacher MSM2, are installed at each rope at the car-side. These additional sensors are employed for validating the estimations of the car-side rope tensile force and the estimations of the car vertical vibrations.
Initialization of the elevator model and the observer algorithms
The initial value for the state vector is obtained at
The EKF algorithm is tuned by setting the process error covariance matrix as
The E-SSRLS algorithm is tuned by setting
Test estimation results
The states,
The Root Mean Square Error (RMSE) has been employed for evaluating the performance of both observer algorithms with respect to the actual measurements. As seen in Table 5, the RMSE values for both observer algorithms are virtually the same. The RMSE of the estimated car rope tensile force by the E-SSRLS is 228.52 [N], which accounts for less than 9% of the maximum rope tensile force. Regarding the RMSE of the estimated car acceleration for both EKF and E-SSRLS estimates, it is about 0.022 [m/s], which accounts for less than 3% of the maximum car acceleration.
RMSE of the estimations by EKF and E-SSRLS.
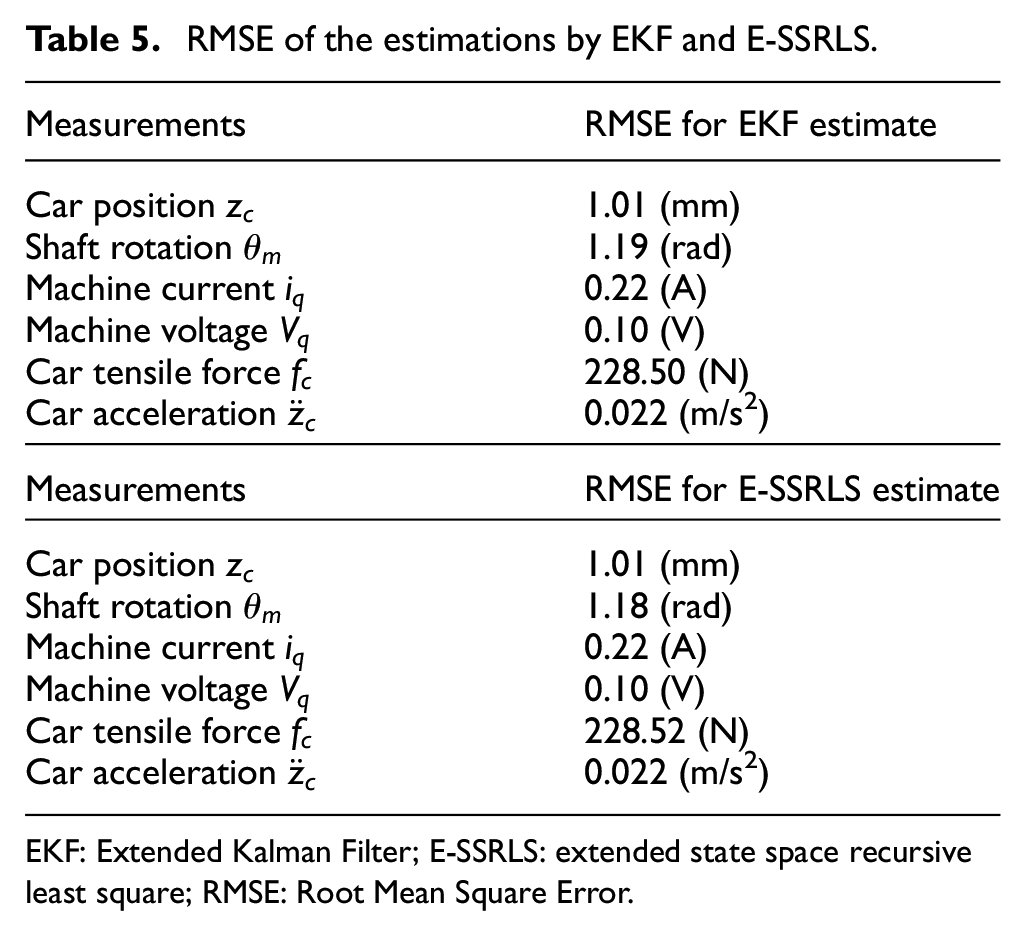
EKF: Extended Kalman Filter; E-SSRLS: extended state space recursive least square; RMSE: Root Mean Square Error.
KPIs for the real installation
The KPIs based on actual measurements are compared to those based on estimated parameters and states during the ride test in the real installation.
KPIs for energy efficiency
The estimated KPIs for evaluating the elevator energy are graphically represented in Figure 12. The abscissa axis is the elevator car position in height and the ordinate axis shows KPI of each indicator during the ride where the instantaneous power is integrating during the ride and it is normalized with respect to the total power.
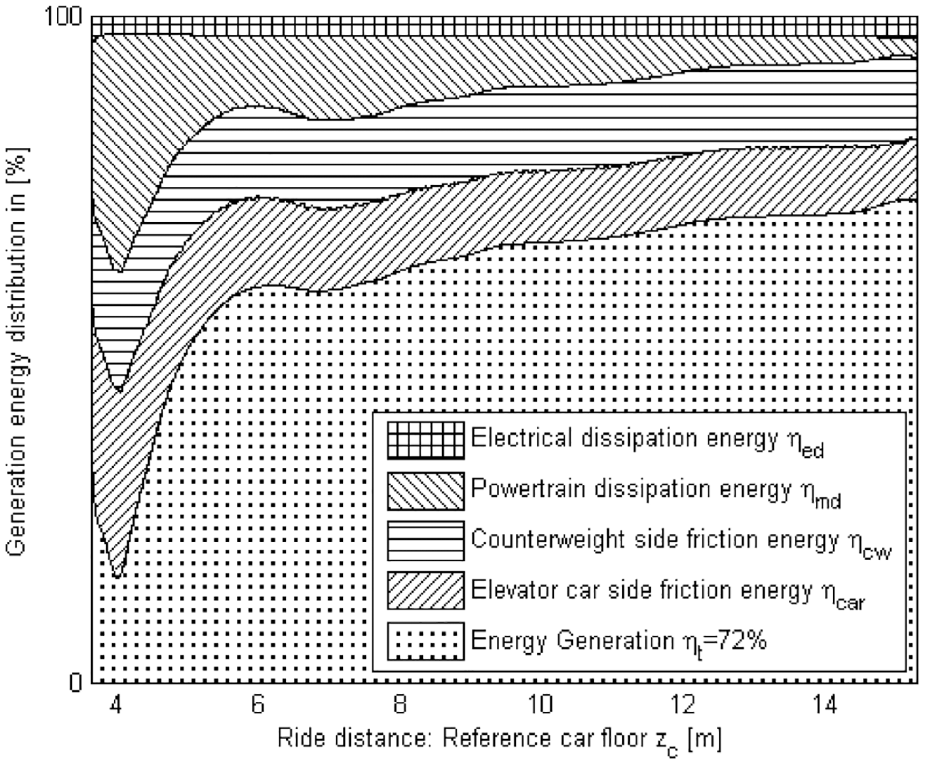
Energy efficiency KPIs based on estimations.
This ride is an operating mode (4) because the counterweight is heavier than the car when the car is moving upwards. The 72% of the energy is returned to the electrical grid. At the beginning of the ride (at 4 [m]), approximately 35% of the energy is lost in the powertrain, mostly due to the breakaway friction. Regarding the car and counterweight side friction loses, both represent approximately 20% of the overall energy consumption. This friction energy is nearly constant during the ride. Hence, the guiding system seems to be uniformly assembled as there are no significant friction fluctuations.
Guide diagnosis KPIs
The evolution of the estimated friction coefficient
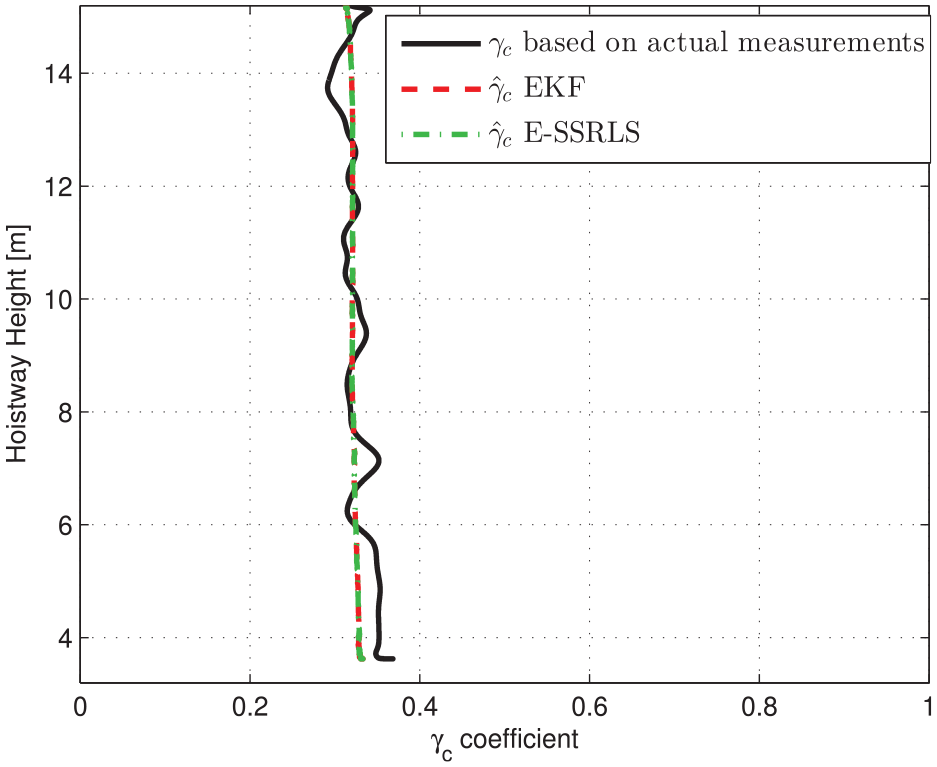
Comparison of
As observed in Figure 13, the estimated car-side friction coefficient
Figure 14 shows the estimated friction coefficient
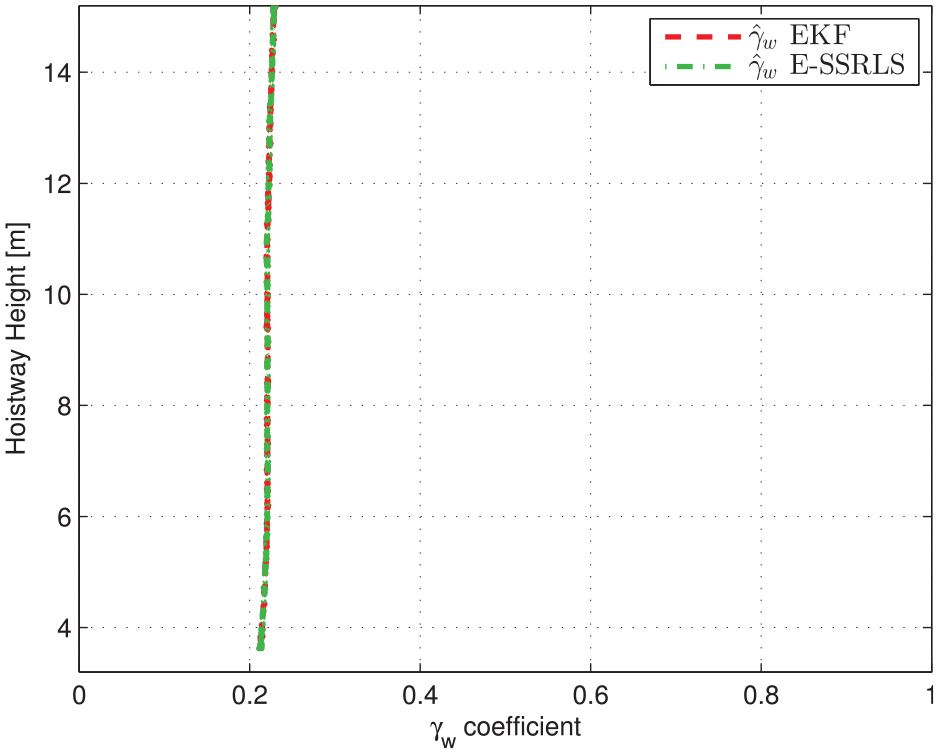
Comparison of
Ride quality KPIs
The ride quality KPIs are presented in Table 6. The deviation between the KPIs obtained based on measurements and those based on estimations are less than 7%. Estimated car acceleration and the actual measurement are visually indistinguishable and the deviation of the four ride quality KPIs is small.
Estimated ride quality KPIs.
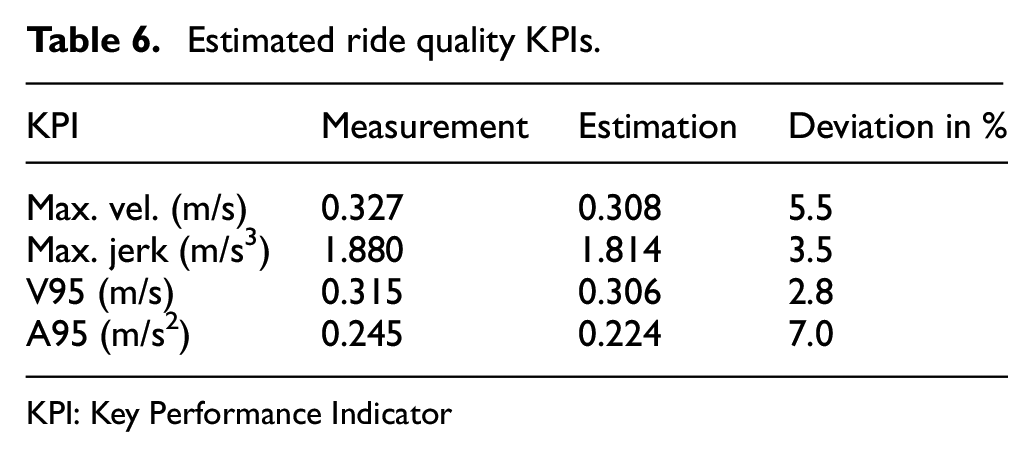
KPI: Key Performance Indicator
Machine diagnosis KPIs
As the mutual torque ripple has not been measured during the ride, only the estimated results are presented. The proposed two KPIs,
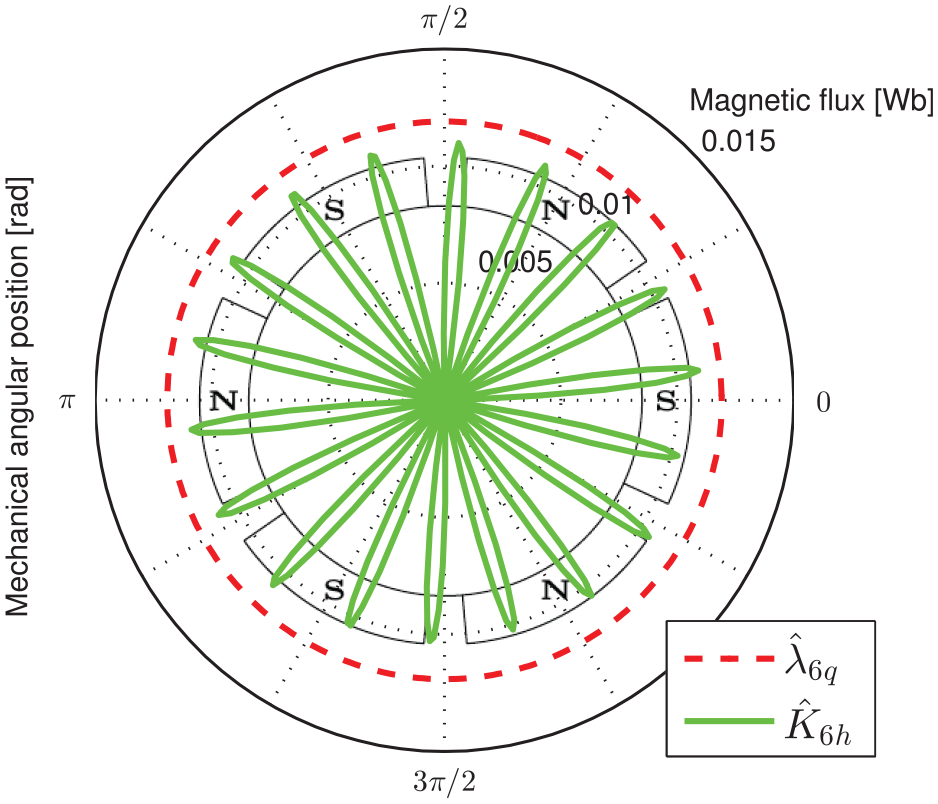
Polar diagram of the
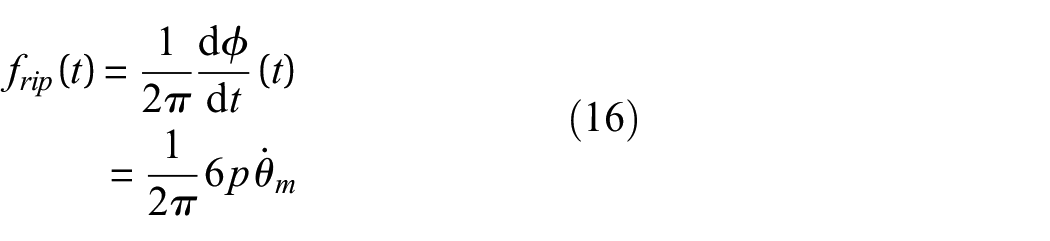
As the quadrature voltage signal has information about the magnitude and instantaneous phase of the mutual torque ripple (see Equation (15)), a time-varying spectrogram of the voltage signal would allow to check the presence of the mutual torque ripple. Figure 16 shows a spectrogram of the quadrature voltage calculated by the Welch algorithm 76 with 80% overlapping and 2048 samples for each window. The solid line is the estimated torque ripple frequency using Equation (16). The frequency of the voltage spectrogram matches with the estimated torque ripple frequency during the ride, showing the presence of the mutual torque ripple.
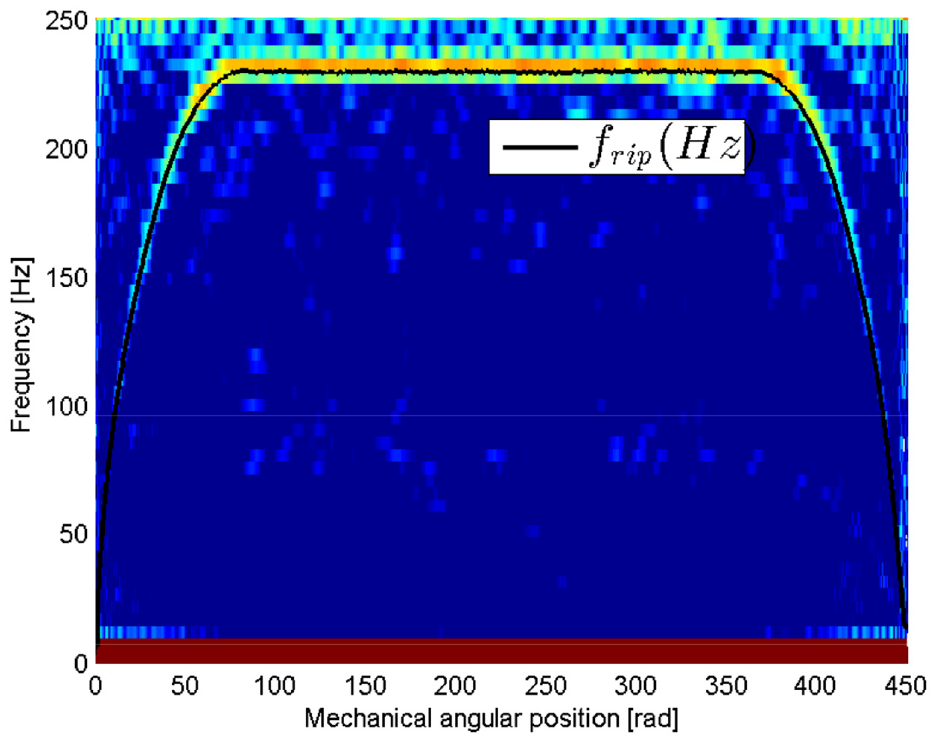
Spectrogram of the quadrature voltage signal compared to ripple frequency of Equation (16).
Conclusions
The main conclusion of this paper is that the condition of the guides, elevator car vibrations, and the electrical traction machine from roped 1:1 elevator installations can be monitored by means of a coupled elevator model, an observer algorithm and using available signals from the regulator.
The proposed KPIs can be calculated from the estimations in an elevator installation without using signals from additional sensors. These KPIs can be easy to interpret and they can be used for evaluating the elevator installations. The KPIs for evaluating the condition of the guiding system can be calculated after estimating the car-rail and counterweight-rail friction coefficients. The KPIs for evaluating the condition of the machine can be obtained by expanding the model of the electrical traction machine with Fourier series and using the signals from the regulator. The ride quality KPIs can be obtained from estimated car vertical acceleration. KPIs for energy efficiency can also be estimated giving a vision of where more energy is lost.
According to the experimental tests made in an elevator installation, it can be concluded that both the EKF and the E-SSRLS algorithms are able to estimate states and parameters simultaneously using solely the signals from the regulator.
The coupled elevator model, the observer algorithms, and the KPIs could be integrated in each real elevator regulator for monitoring purposes. The calculated KPIs should report the condition of each elevator system and they could be sent to a cloud service for on-line monitoring.
The application of the proposed model-based virtual sensing approach could also be extended to other elevator rope configurations such as 2:1, 3:1 or 4:1.
Footnotes
Appendix 1: Derivation of the energy balance model for electrical and mechanical subsystems
Multiplying both sides of Equation (12) by the quadrature current
Appendix
Acknowledgements
The authors also gratefully acknowledge Orona EIC S. Coop. for supporting this research line. Any opinions, findings and conclusions expressed in this article are those of the authors and do not necessarily reflect the views of funding agencies.
Declaration of conflicting interests
The author(s) declared no potential conflicts of interest with respect to the research, authorship, and/or publication of this article.
Funding
The author(s) disclosed receipt of the following financial support for the research, authorship, and/or publication of this article: This study is partially funded by the Basque Government under the Emaitek 2014 Program (MECOFF project, IE13-379) and by the Ministry of Economy and Competitiveness of the Spanish Government under the Retos-Colaboración Program (LEMA project, RTC-2014-1768-4) and the AVISANI (DPI2015-71198-R, Spanish Government) project.