
Abstract
In this article, a novel approach for assessment and ranking of maintenance process indicators as well as maintenance cost indicators and maintenance equipment indicators using the fuzzy sets approach and genetic algorithms is presented. Weight values of these indicators are defined using the experience of decision makers from analyzed small and medium enterprises (total number of 197 persons) and calculated using the fuzzy sets approach. In the second step, a model for ranking and optimization of maintenance performance indicators and small and medium enterprises by using genetic algorithm is presented. The presented approach enables multi-objective optimization of selected key performance indicators in the scope of optimization of maintenance performances. The value of optimization was tested on a group of small and medium enterprises which proved that improvement of maintenance performance could be more significant (or performed at the shorter period of time) if the specific key performance indicators were targeted for improvement. The presented solution could provide identification of strengths and weaknesses (comparing key performance indicators), learning from a leading organization (in prioritization of key performance indicator improvement) and improvement of maintenance performance.
Introduction
Considering the fact that poor maintenance leads to loss of productivity, a reduction in profitability and therefore, in many cases, to a loss of clients and a general bad company image, maintenance function has become more and more important. Today, maintenance function has an important role in keeping and improving availability, performance efficiency, quality products, on-time deliveries, environment and safety requirements, and total plant cost-effectiveness at high levels, so its impact in the corporate long-term profitability of complex systems has increased. 1 An effective maintenance policy could influence the productivity and profitability of a manufacturing process through its direct impact on quality, efficiency and effectiveness of operation. 2
In order to achieve maintenance objectives in accordance with business goals, it is necessary to measure maintenance performance. The maintenance performance measurement (MPM) is a part of maintenance management processes and a management tool for long-term economic viability of business organization. Well-defined performance indicators can potentially support identification of performance gaps, between the current and desired performance, and can provide indication of progress toward closing the gaps. 3 This is important for decision makers and managers to be able to find weak spots and provide improvement actions. In order to enable decision makers to choose the optimal maintenance performance indicators (in accordance with the desired results and focus on particular areas of the production system), it is necessary to assess and rank maintenance key performance indicators (KPIs).
Today, there are several potential directions as well as sets of issues in the research of MPM. Most of the focus has been on designing a performance measurement system (PMS), with a few studies illustrating the issues in implementing and using PMS. 4 Other researches 5 concluded that the area of maintenance performance and management requires significant and systematic research in the future, together with additional efforts aimed at solidifying theoretical constructs and promoting the utilization of more practical applications. A number of researches were focused on the right selection of KPIs or different frameworks applied in different industries. MPM framework has also been developed and discussed for specific industries such as mining industry or military aviation6,7 or a specific class of companies such as small and medium enterprises (SMEs). 8
The environment changes rapidly or becomes uncertain, thus making different values that are associated with relative importance of identified KPIs difficult or impossible to quantify. It seems a more realistic approach to use linguistic variables 9 instead of precise numbers. In this article, modeling of the relative importance of KPIs is based on fuzzy sets theory10,11 with respect to the following reasons: (1) the fuzzy sets theory resembles human reasoning in its use of approximate information and uncertainty to generate decisions, and (2) fuzzy sets theory can be the most appropriate way for modeling linguistic expressions. 12
The goal of the article is quality improvement of maintenance process through incensement of KPI values. The authors will present an approach for assessment and ranking of maintenance performance indicators using the fuzzy set and MATLAB GA toolbox. The presented approach is tested on real-life data which are obtained from 53 metal processing SMEs from Serbia. Assessment of the relative importance of KPIs is performed by 197 managers. When search space size is large, genetic algorithm (GA) as a heuristic method allows a smaller volume of computation and shorter time on a large search space found near the global optimal solution. 13
The presented solution could provide identification of strengths and weaknesses (comparing KPIs), learning from a leading organization (in prioritization of KPI improvement) and improvement of maintenance performance.
Literature review
Coming from the previously described problem, there are two separate issues that need to be addressed. The first one is the selection of the most appropriate and most applicable KPIs and the second one is providing the right approach for the definition of weights, rank and optimization of indicators for a specific problem.
Each process should be measured with one or more metrics that characterize the essentials of its performance. Such a metric is called a KPI. 14 Many authors have identified KPIs for performance measurement and have classified them based on specific aspects of performance measurement.15−23 Kutucuoglu et al. 24 analyzed the role of PMS in maintenance, with particular reference to developing a new PMS using the quality function deployment (QFD) technique and a developed framework for managing maintenance performance, 25 which can be used as a benchmarking tool, therefore helping to identify weak points in the current practices. Parida and Kumar 26 identified various issues and challenges associated with the development and implementation of an MPM system and developed a concept of total maintenance effectiveness and integration of hierarchical levels and multi-criteria maintenance performance indicators. Alsyouf 27 developed a framework for strategic MPM using a balanced scorecard approach and discussed the impact of maintenance function on elements of business performance. Based on the existence of different criteria for maintenance indicators, at various hierarchical levels of an organization, Parida and Chattopadhyay 28 analyzed and developed a multi-criteria hierarchical framework, for effective measurement of maintenance performance, which is balanced, holistic and integrated to various levels of an organization, for regular use by stakeholders. Muchiri et al. 3 carried out empirical analysis of MPM in Belgian industries. They determined the KPIs that are most commonly used how they are chosen and how they can be effectively used in decision support and performance improvement. The authors found that the dominant MPMs are equipment, maintenance cost and safety KPIs, while maintenance process KPIs are less used. The authors went a step further and, in the next article, 29 performance indicators of the maintenance process and maintenance results were identified for each category and a conceptual framework was proposed that provides guidelines for choosing maintenance function performance indicators. This framework is used as a basis for the assessment and optimized ranking of the defined maintenance process KPIs, maintenance cost KPIs and maintenance equipment KPIs to find optimal solutions for improving the maintenance process. By the ranking of maintenance performance KPIs based on data from Serbian metal processing SMEs, it is possible to identify mean maintenance weaknesses in these SMEs and find space for improvement.
On the other hand, it is very important to select an appropriate approach for ranking and assessment of the selected KPIs under uncertainties. 30 In the literature, there are many articles in which evaluating and ranking of maintenance KPIs problems are solved by using different fuzzy multi-criteria methods and/or heuristic methods. Chan and Prakash 31 used fuzzy multi-criteria decision making (MCDM) approach for maintenance policy selection in manufacturing firms. Zeydan and Çolpan 32 introduced a new decision support system for performance measurement using combined fuzzy Technique for Order of Preference by Similarity to Ideal Solution (TOPSIS)/Data Envelopment Analysis (DEA) approach. In the literature, the fuzzy analytic hierarchical process (FAHP) is a widely used method for solving considered problem in domain maintenance process. The evaluating performance has been used in different sectors in the work of Lee et al. 33 and Kalpande et al. 34 Yuan et al. 35 used improved FAHP for an evaluation index system for maintenance management performance. Ratnayake and Markeset 36 used AHP in selecting a maintenance strategy. The GAs have proved to be high-quality multi-objective optimization tools and they have been widely used for different problems of planning, optimization and testing for different maintenance issues. 37 Sortrakul and Cassady 38 successfully applied the GA procedure to the integrated optimization model, for production scheduling and preventive maintenance planning, with a total weighted expected tardiness objective function. Villanueva et al. 39 used GA for testing and maintenance optimization of safety-related systems based on unavailability and cost estimation, acting for uncertainty in equipment reliability characteristics.
In this article, the relative importance of maintenance KPIs is stated as fuzzy group decision making problem. Their values are evaluated by decision makers. They use pre-defined linguistic expressions that are modeled by triangular fuzzy numbers (TFNs). A further issue is the ranking of the KPIs and the calculation of overall maintenance performance rank using the values from real-life SMEs. Different KPIs with different relative importance need the multi-objective optimization approach in order to provide the optimal solution for specific KPIs and maintenance performance overall. So in this article, the maintenance performance KPIs were ranked using multi-objective optimization GA ranking using MATLAB GA toolbox.
Definition of a maintenance process’ metrics
Numerous SMEs from metal processing sector are considered. Formally, these SMEs are presented by set
Formally, categories of maintenance performance measures can be presented by the set of indices
The KPIs of each identified sub-maintenance performance measure are presented by the set of indices
Maintenance process KPIs. 29
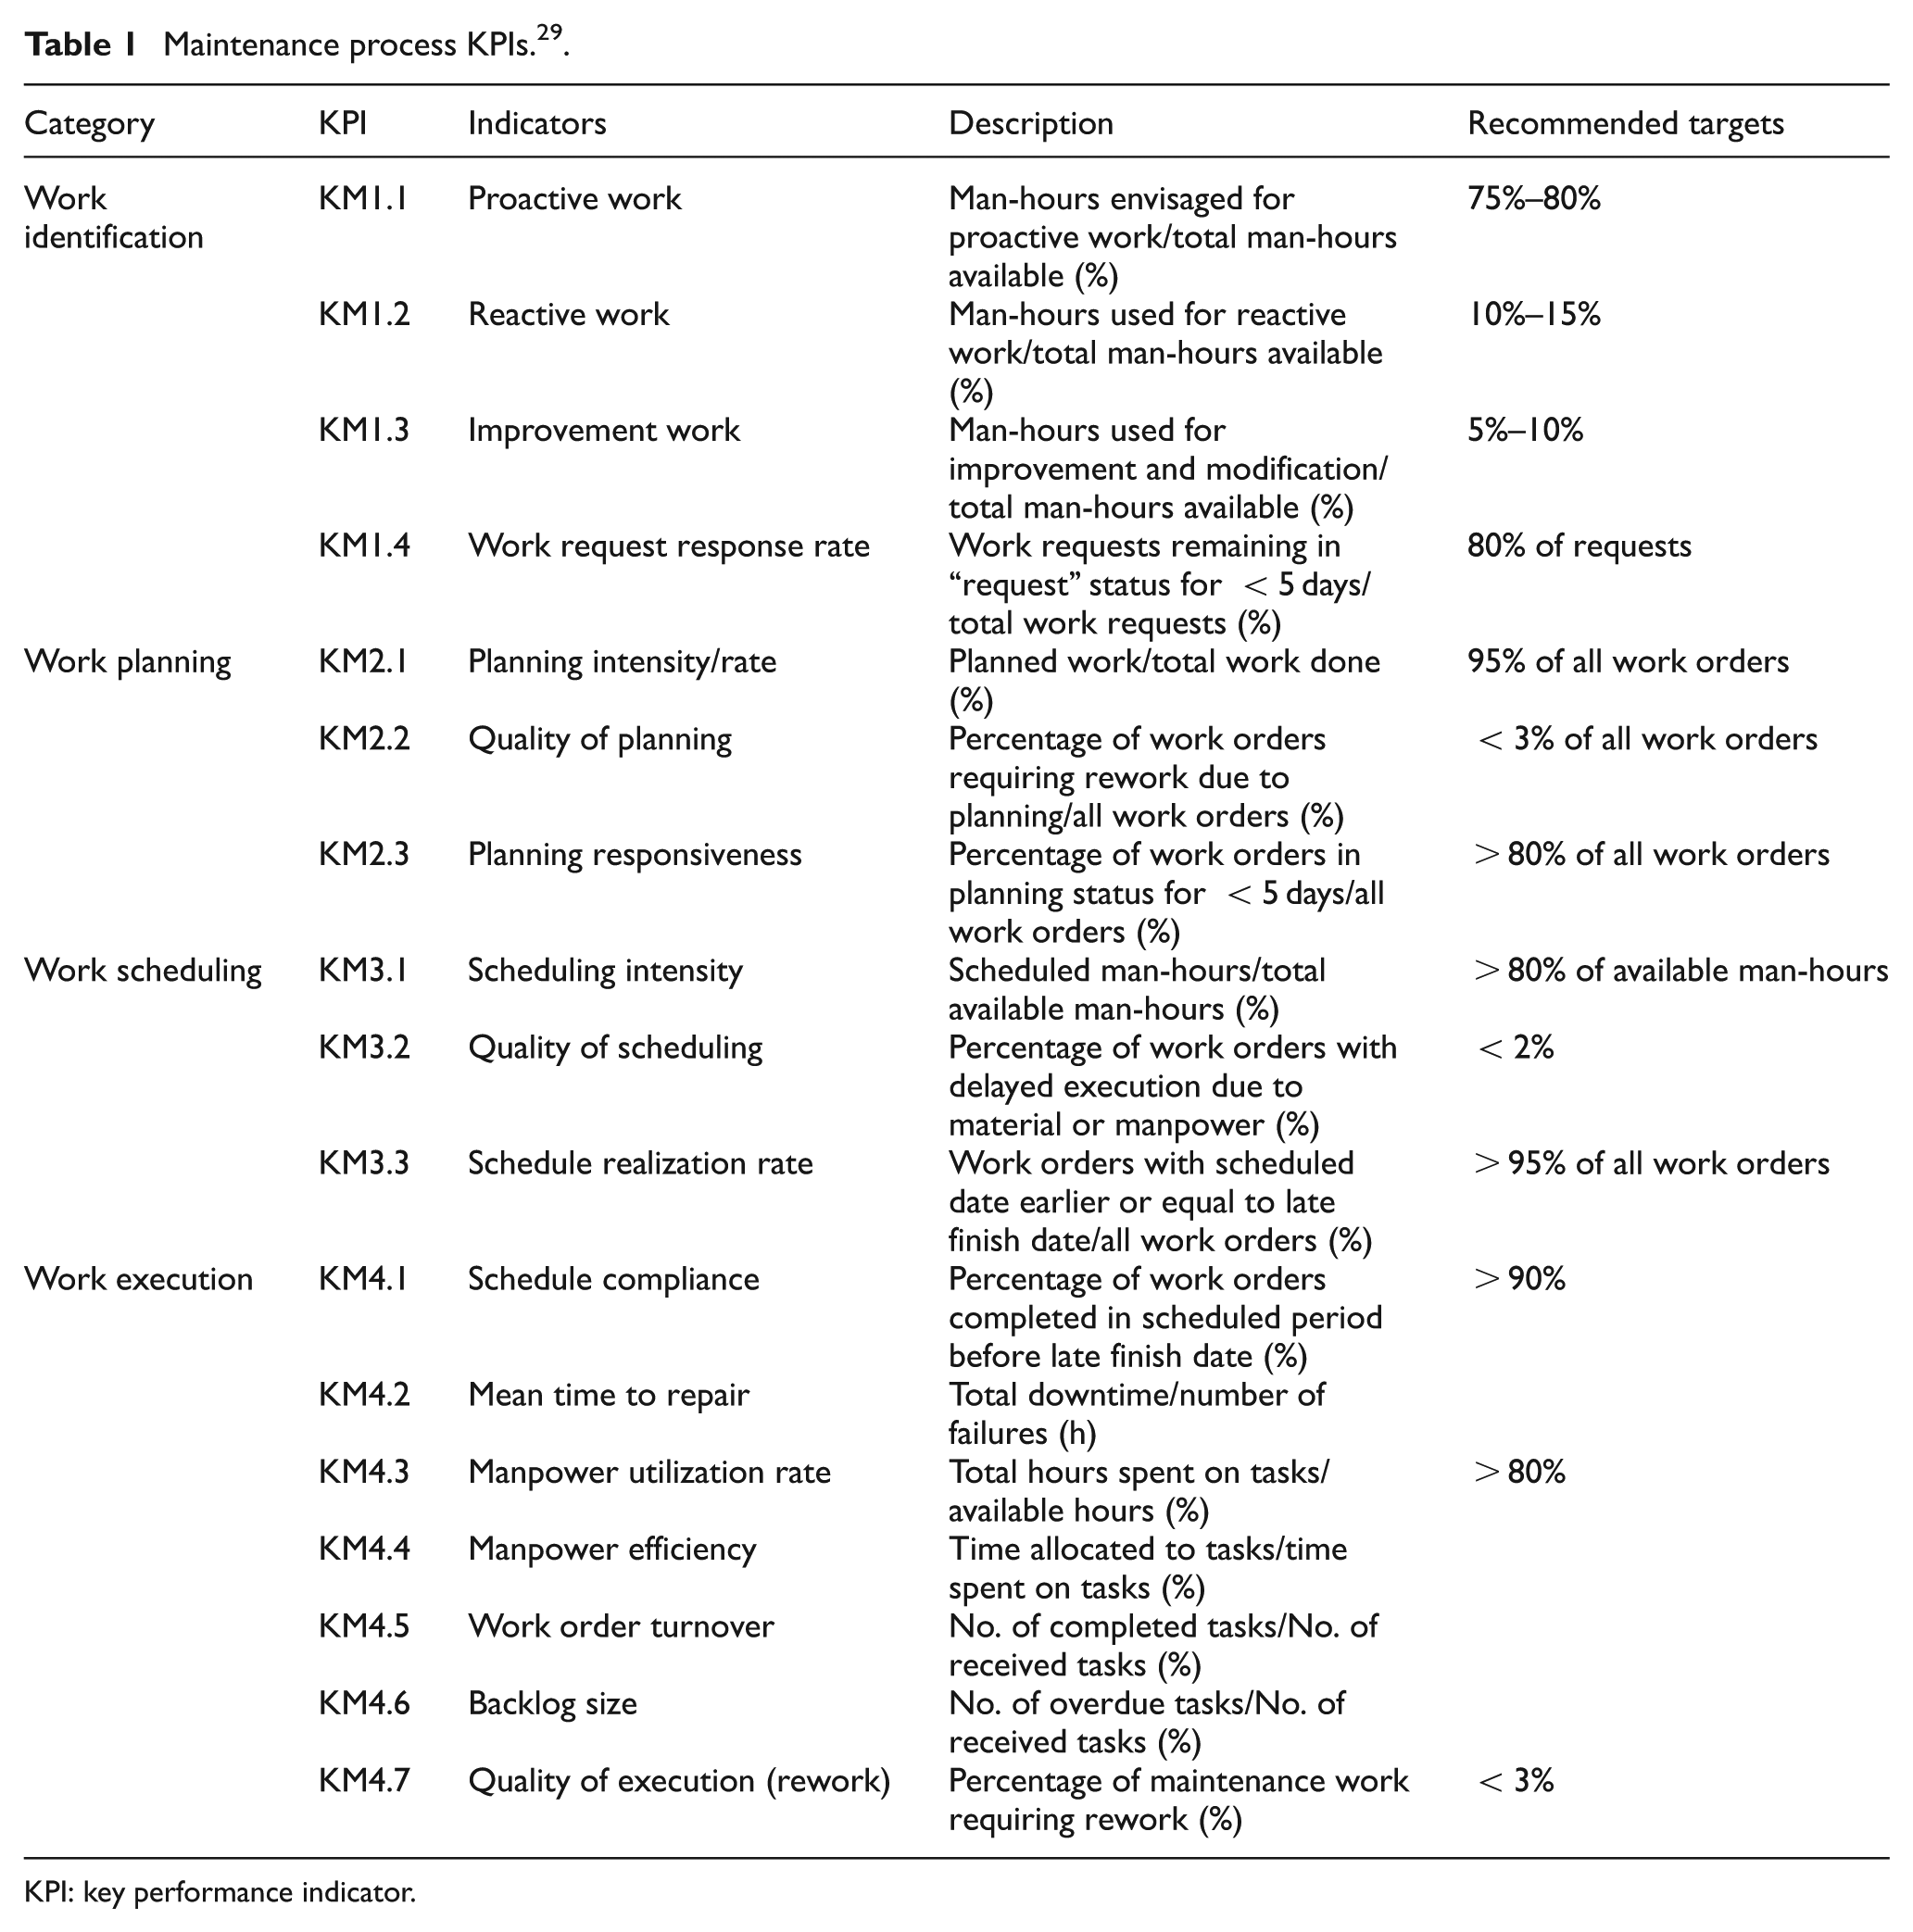
KPI: key performance indicator.
Maintenance cost KPIs. 29
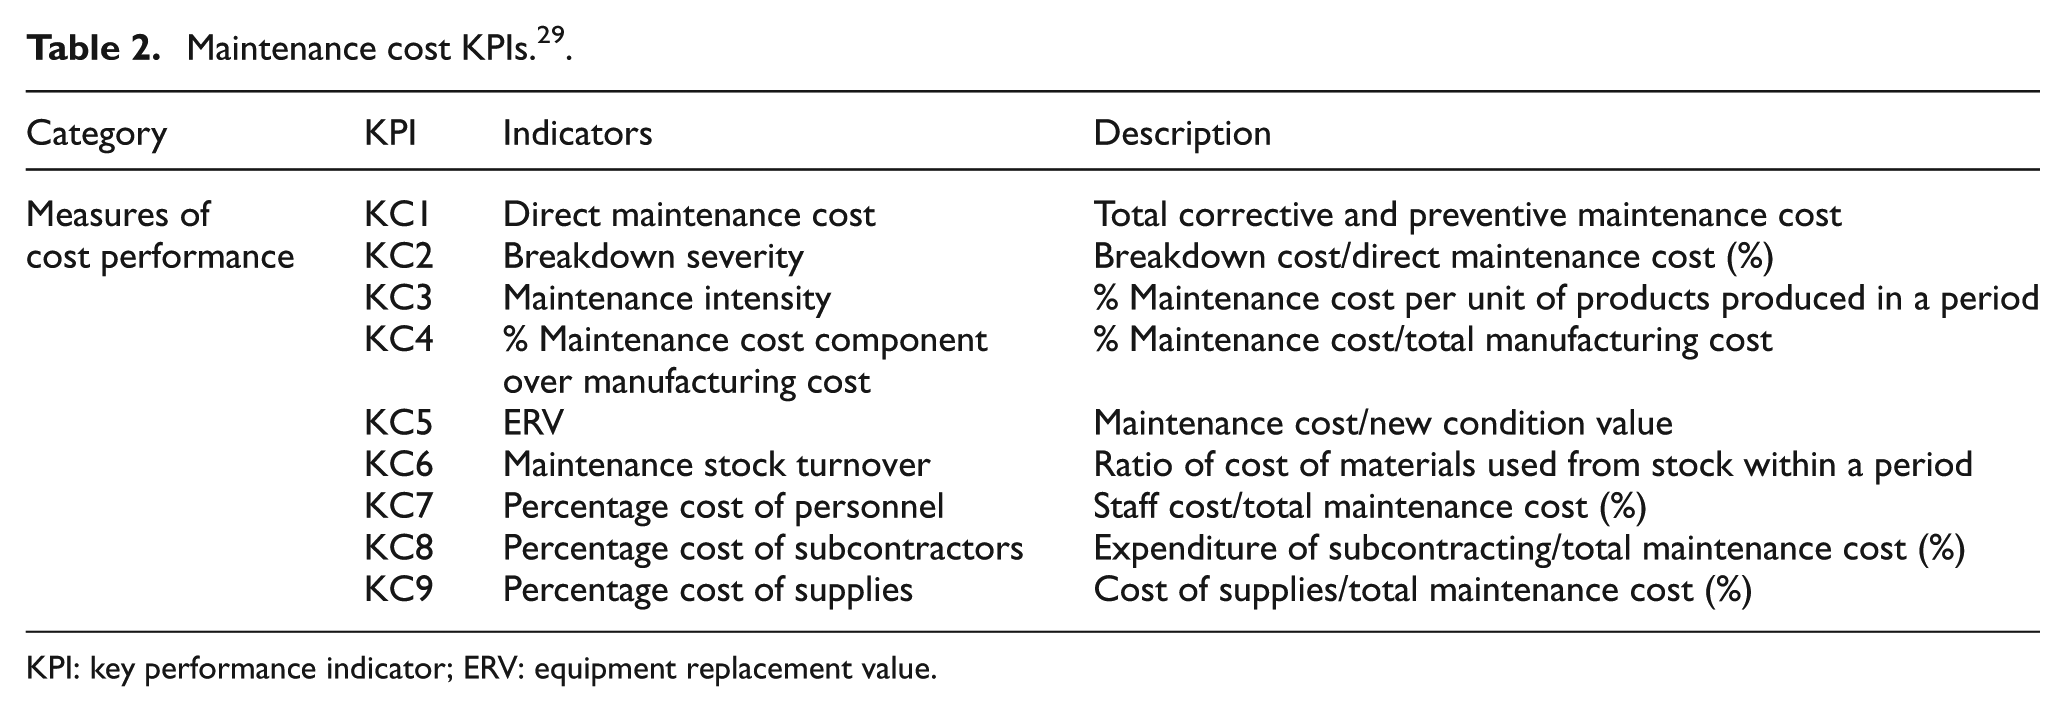
KPI: key performance indicator; ERV: equipment replacement value.
Maintenance equipment KPIs. 29
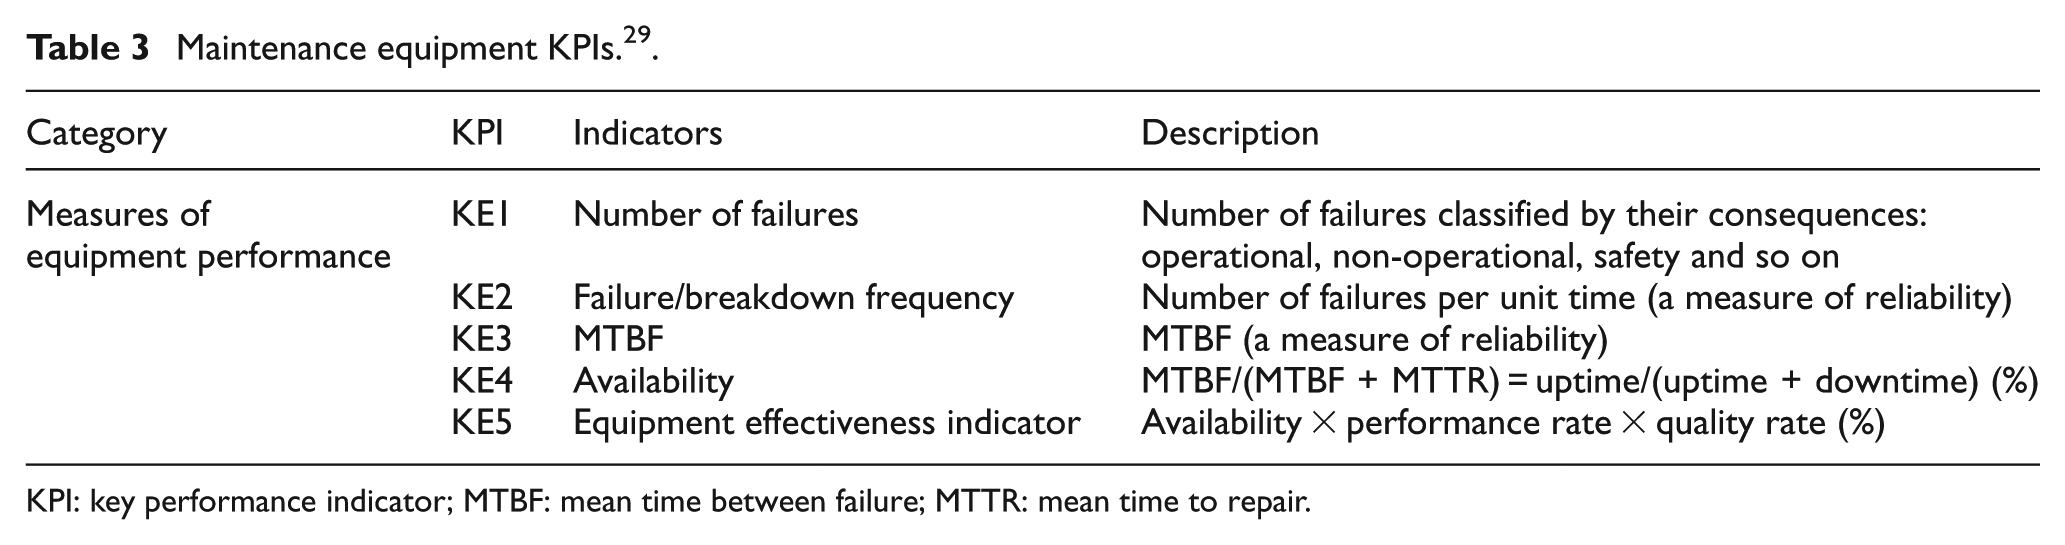
KPI: key performance indicator; MTBF: mean time between failure; MTTR: mean time to repair.
The fuzzy rating of the relative importance of KPIs and sub-maintenance performance measures are performed by each decision maker d, d = 1, …, D. These assessments are modeled by five TFNs,
The fuzzy rating of the relative importance of KPIs at the level of each group of decision makers,
The value of each KPI is determined at the level of each SME by using evidence data. These values are crisp and labeled as
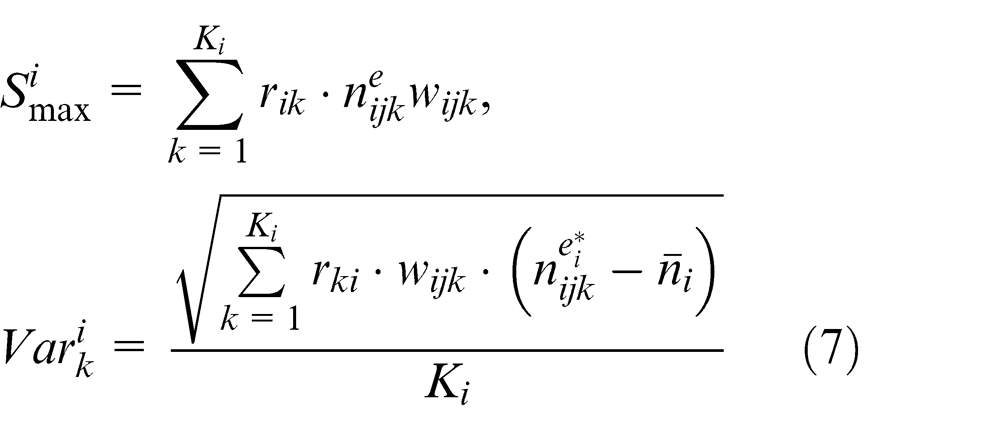
By applying the proposed procedure, the near-optimal solutions of two different complex optimization tasks could be found. First, the ranking of the SMEs and KPIs of MPMs is stated as multi-objective optimization task. The optimization objective functions are the function of the ranks’ sum,
The second task can be defined as determining the optimal strategy for improving maintenance process quality with respect to maintenance performance measures in any SME. The maintenance process quality can be improved if appropriate management initiatives that lead to an increase in the value of one or more KPIs of the treated maintenance process under maintenance performance measures i, i = 1, …, I are applied. Formally, there are an infinite number of possible improvement strategies, so this problem is extremely suitable for the selected (GA) approach.
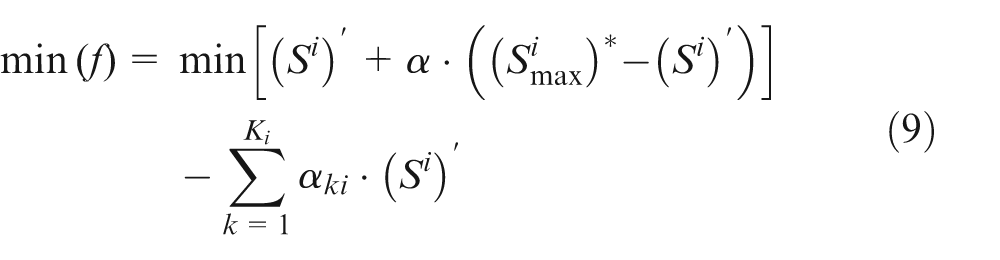
In this case, the optimal increase in KPI values is obtained from the condition of the minimum proposed one objective function f with simultaneously satisfaction of conditions. Decision variables of defined one objective function are as follows: the function of the ranks’ sum
In general, the proposed procedure can be applied to maintenance performance measures. In this article, the improvement of the maintenance process of selected KPIs is considered because only maintenance process KPIs can be influenced directly. On the maintenance costs and equipment KPIs cannot be influenced directly, but only indirectly through improvement of maintenance process KPIs.
A proposed algorithm based on the fuzzy sets theory and GA for evaluation of maintenance process quality
The algorithm of the proposed fuzzy model (Figure 1) is presented as follows:
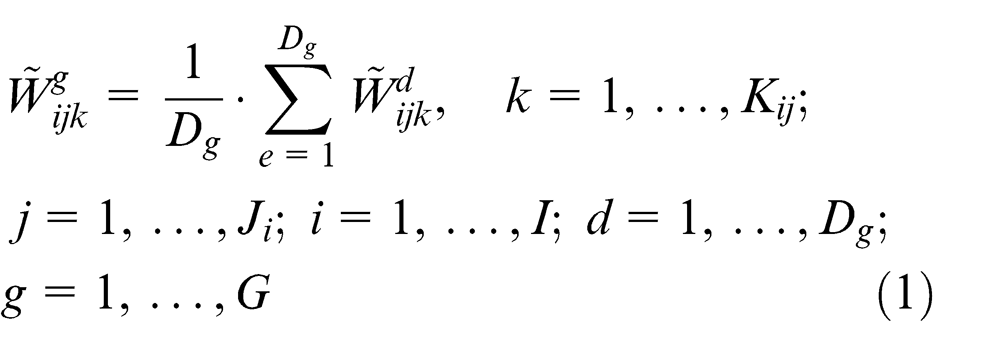
Step 1. Calculate the aggregated values of KPIs at the level of each decision makers’ group
Step 2. Calculate the weighted aggregated relative importance of KPIs by using FOWA

where
Step 3. Transform all TFNs,
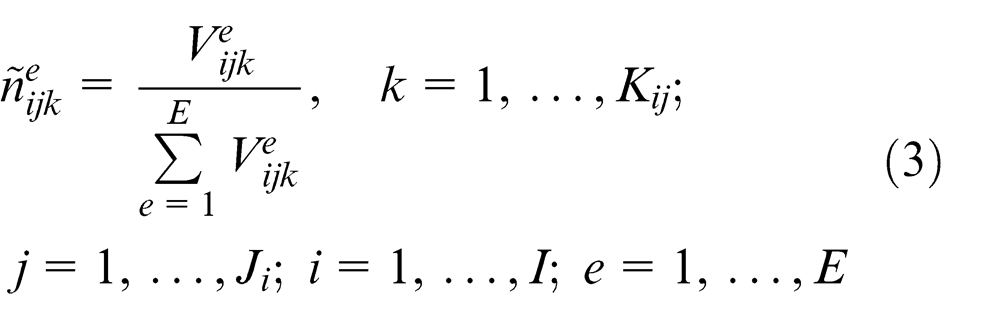
Step 4. Determine the normalized relative importance KPIs,
Step 5. Transform all the cardinal KPI values
For a benefit type of KPI
For a cost type of KPI
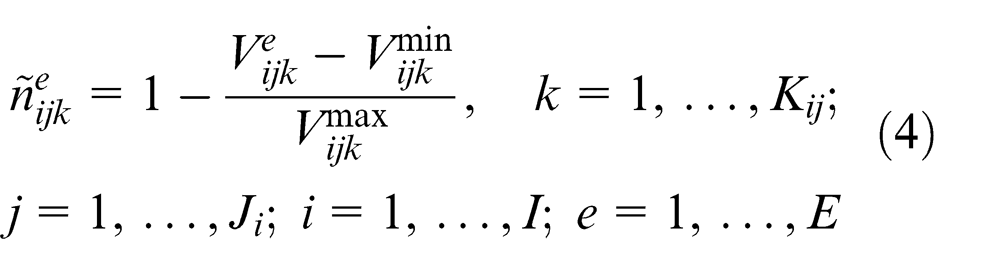
where
Step 6. Determine the overall weighted coefficient of SMEs,
where
Step 7. Determine the rank of SMEs and the rank of KPIs according to the values’ overall weighted coefficients,
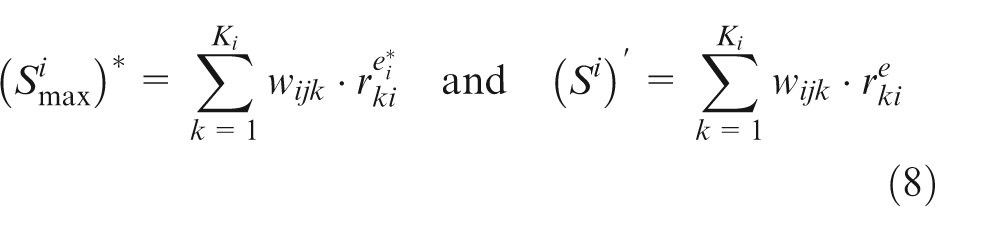
Step 8. Determine the overall weighted coefficient of KPIs for the SME which is placed at first place with respect to each measure in the rank,
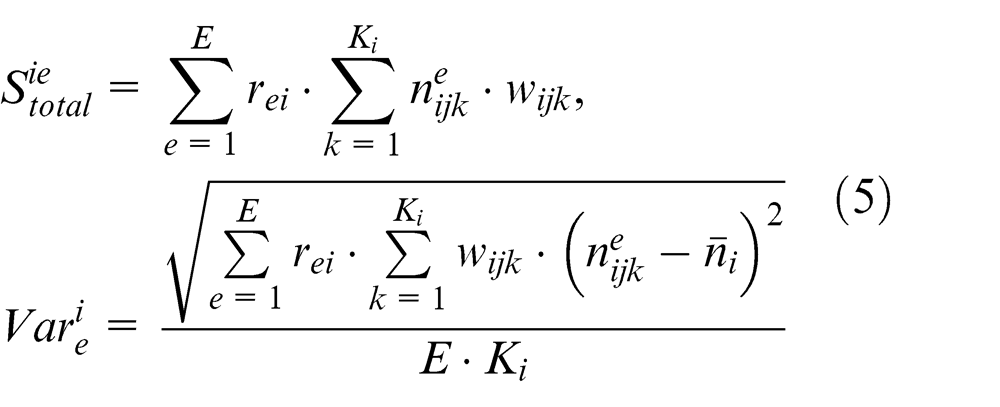
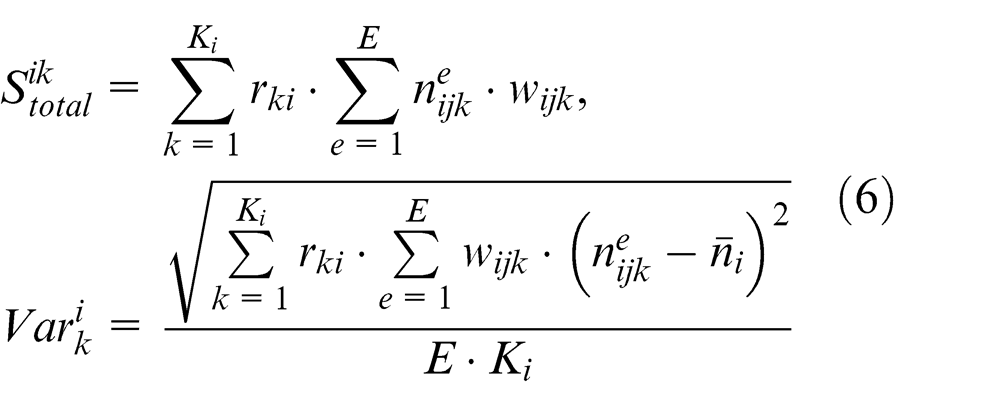
Step 9. Calculate the values of the function of the ranks’ sum of KPIs, for the SME which is placed at first place in the rank,
Step 10. The optimization task can be defined as follows:
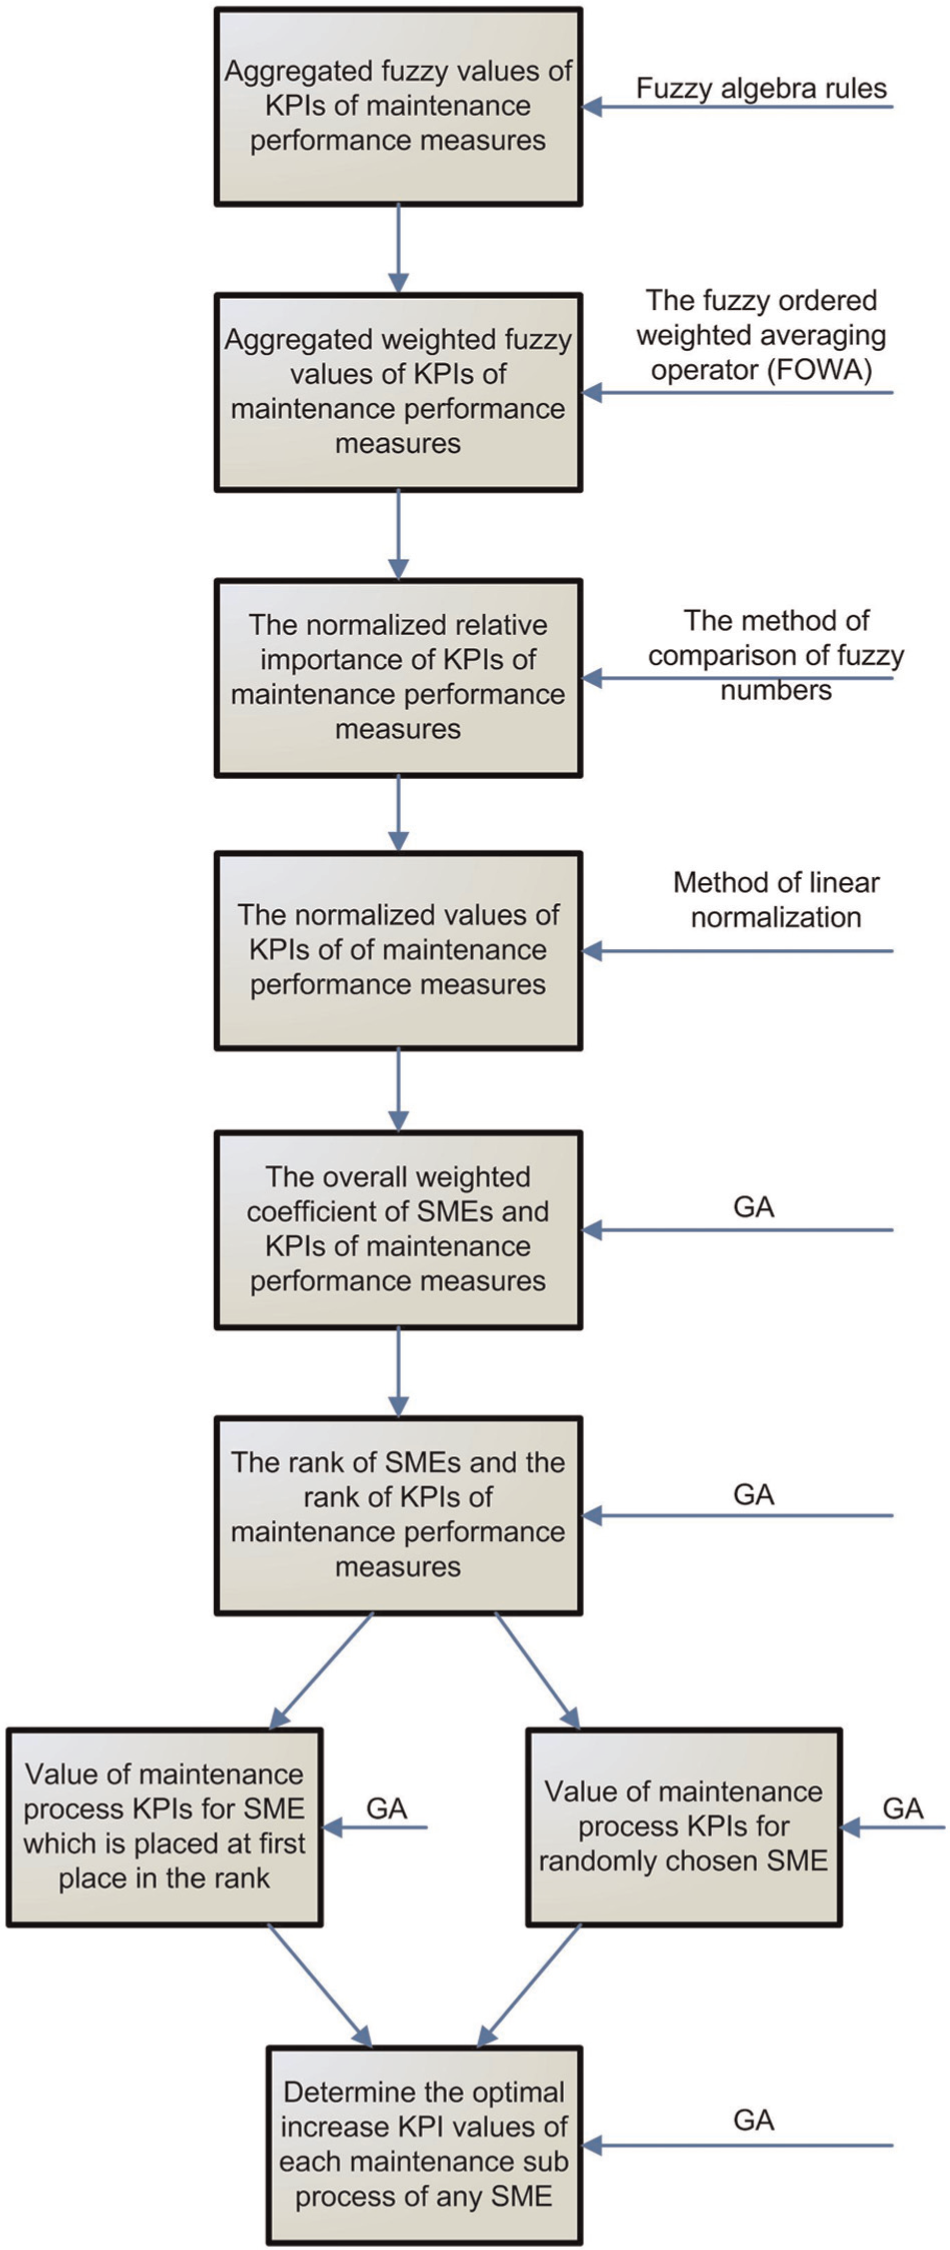
Flow chart of the proposed algorithm
Objective function
Constrains
The order of improvements is determined according to the weighted normalized values of KPIs and the relative importance of sub-maintenance process,
Development of a software solution for ranking and optimization of KPIs and maintenance performances
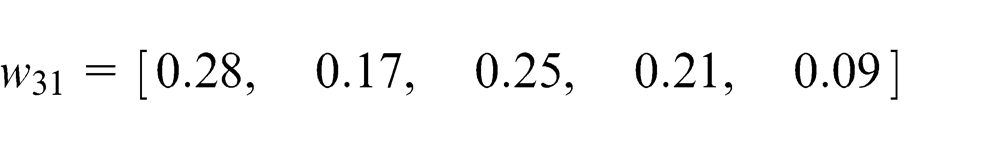
The first general task is to develop a software solution that will provide ranking of KPIs for each identified category of the maintenance process. The starting point for calculation is the relative importance of KPIs and inputs from 53 SMEs that have measured the values of KPIs in their business environment. According to the result of classification, 5 SMEs (30 decision makers) belong to group A, 12 SMEs (42 decision makers) belong to group B and 38 SMEs belong to group C (125 decision makers). The weights of the given groups of SMEs and the importance of evaluation decision makers are determined with respect to the results of good practice. In this case, the weights of decision makers of group A is
In the following, determining the relative importance of the KPIs of the maintenance equipment by using the proposed algorithm (Steps 1–4) is presented
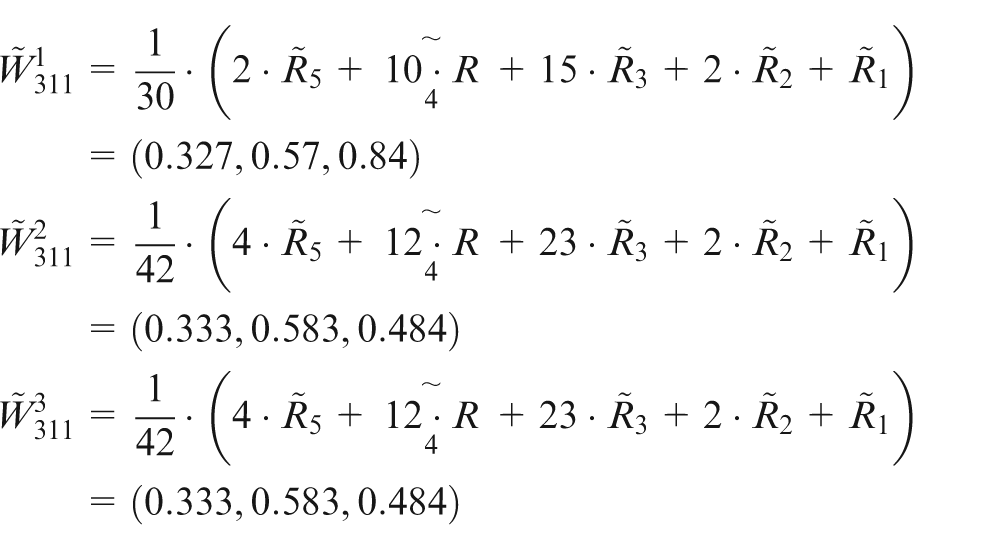
The relative importance of KPI denoted as the number of failures of maintenance equipment,
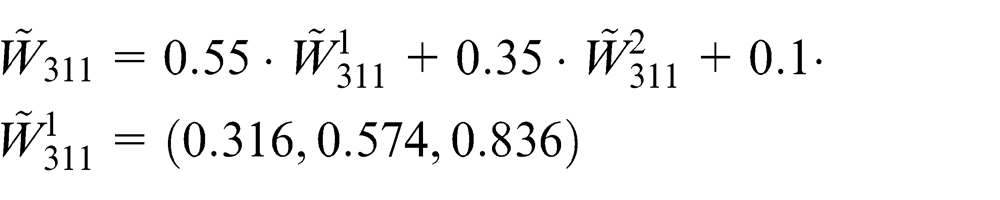
In a similar way, the relative importance of the rest of KPIs of maintenance equipment is determined. These values are
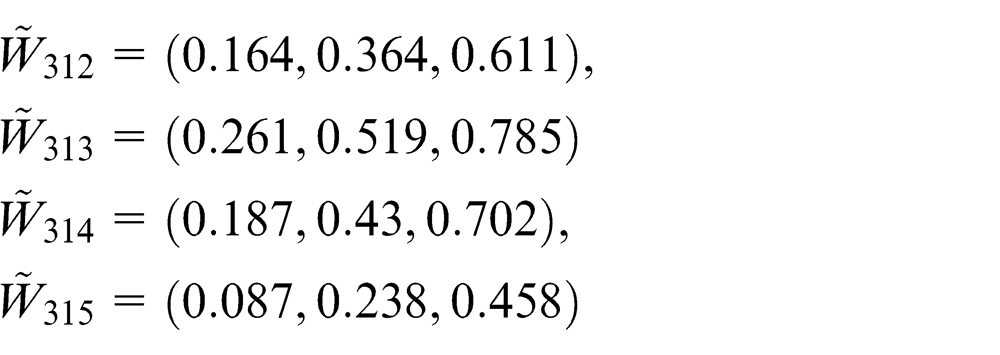
The highest value of the degree of belief that the number of failures is more or equally important as all other KPIs is
In a similar way, the relative importance of KPIs of maintenance process indicators
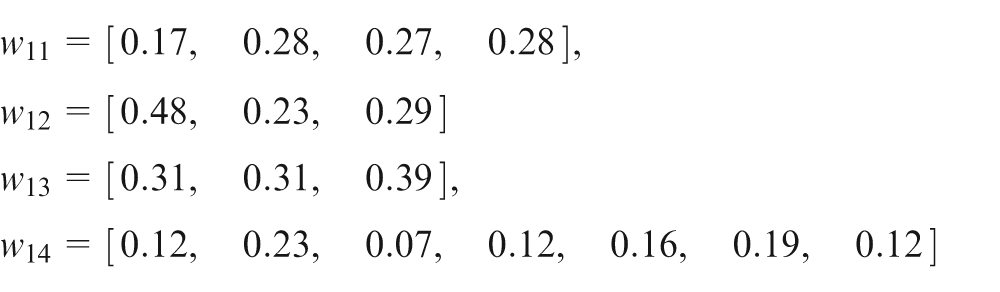
The relative importance of sub-maintenance performance measures under the first maintenance performance measures is
The relative importance of KPIs under maintenance cost is
By using the proposed algorithm (Step 5), the normalized values of KPIs are determined.
The input data that are given by using the proposed algorithm (Steps 1–5) are carried in the created graphic user interface of the MATLAB GA toolbox. In MATLAB GA toolbox, variation in the values of GA parameters (population size, population type, selection function, mutation function, crossover function, stopping criteria) was performed (see Table 4). MATLAB GA toolbox is used in order to solve two different tasks. The first one is to rank the considered SMEs and rank KPIs for each maintenance performance measure of maintenance process (maintenance process, maintenance cost and maintenance equipment).
Variations in used parameters for GA in MATLAB
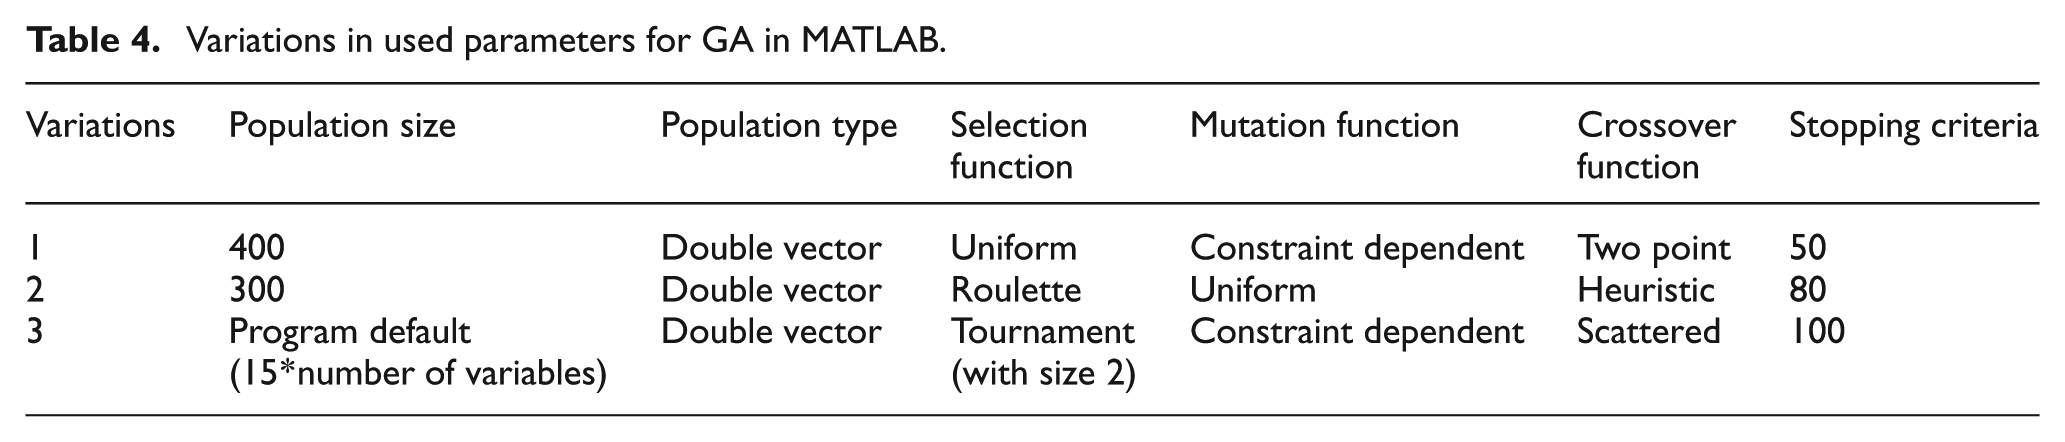
The rank of SMEs and the rank of KPIs with respect to the considered maintenance performance measures are calculated by using the algorithm (Step 6) for each variation in the values for parameters that are presented in Table 4.
After performing calculations, the solutions for both optimization functions are represented as points on the Pareto front. To rank the maintenance performance indicators, two functions are used: the weighted score of the maximum sum of the observed indicators and the weighted score variance of the observed indicators. After performing calculations, both functions are at a point on the Pareto front. Pareto optimal solution ranking of indicators of the maintenance performance, based on the entered weight values for each indicator and for all the grades given by experts for each enterprise and for each indicator, is shown in Figures 2(a)–(c). Pareto optimal solutions are shown in asterisks. Each of these asterisks is one possible solution, from the set of optimal solutions, ranking the maintenance performance indicators in the analyzed manufacturing SMEs. On the x-axis is the presented solution of equation (6) and on the y-axis is the solution of equation (7).
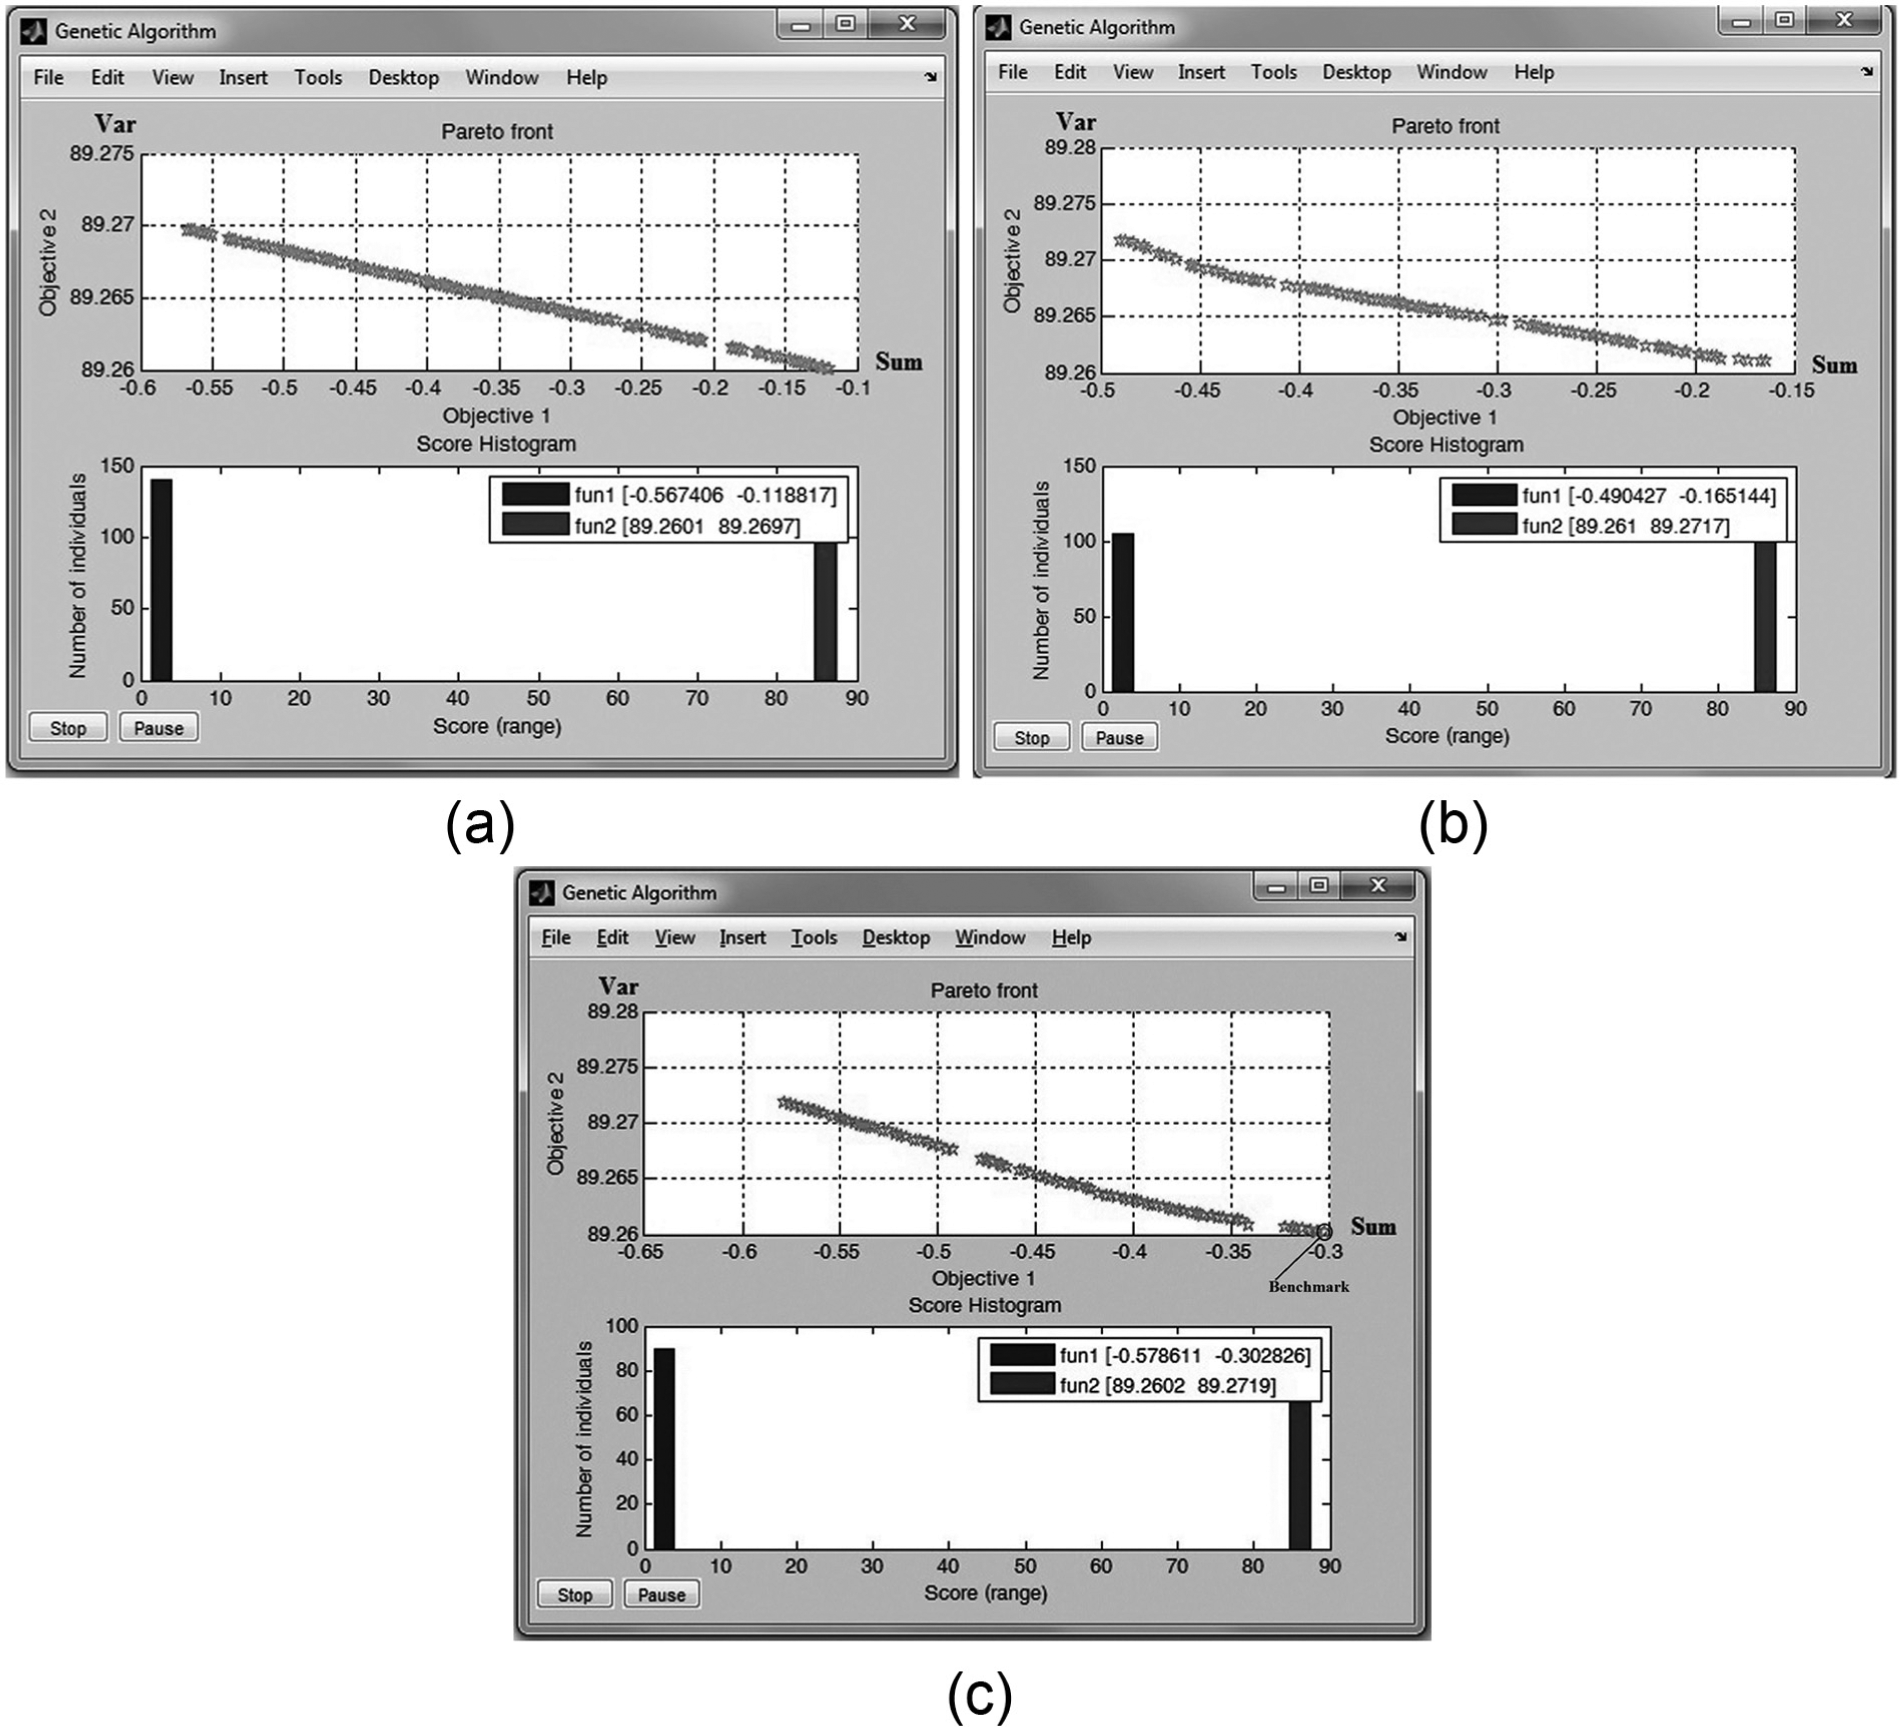
Pareto optimal solutions for ranking the maintenance process indicators for (a) variation 1, (b) variation 2 and (c) variation 3.
We select the solution with the lowest value of variance and the lowest dispersion coefficients wijk (Figure 2(c)). This allows us to rank enterprise with smaller deviations (better ranked indicators will not get extremely high grades, and lowest ranked indicators will not get extremely low scores). This solution was selected from 90 mutually non-dominant different optimal solutions and is presented in Figure 4. The number of optimal solutions depends on the number of variables which exist in the expression for calculating the total sum of manufacturing SMEs’ indicators. On the x-axis are process indicators, and on the y-axis are the corresponding weight values for indicators.
The rank of SMEs and the rank of KPIs under each treated maintenance performance measure i, i = 1, …, I, are given by the proposed algorithm (Steps 6 and 7) and shown in Figure 3 and Figure 5(a)–(c).
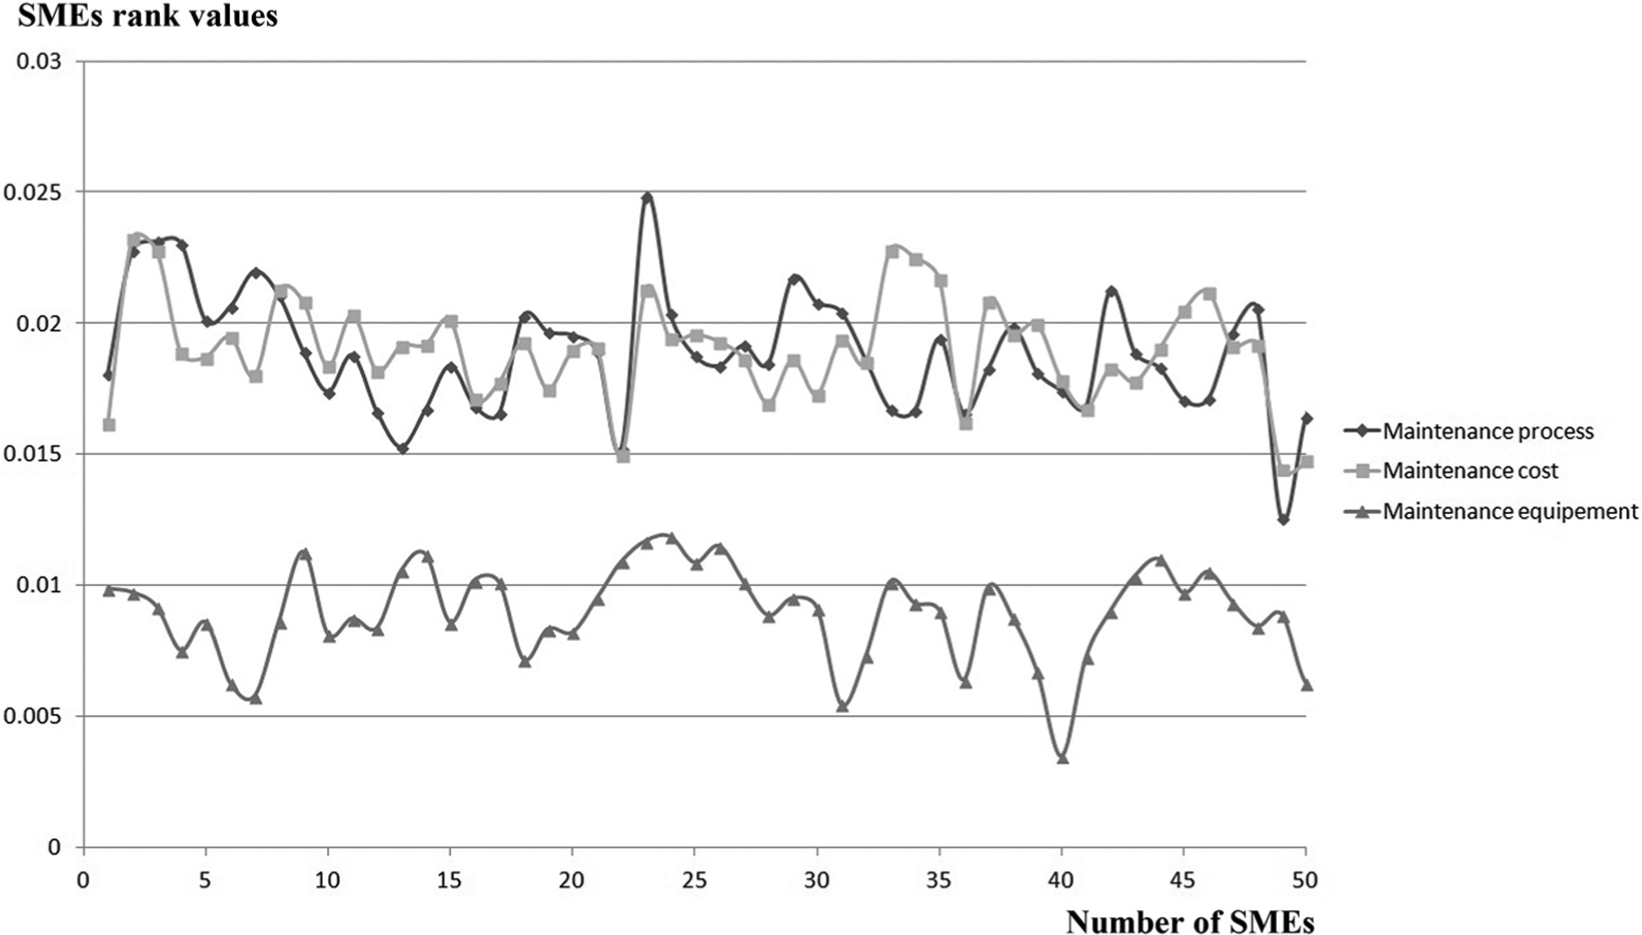
Rank of manufacturing SMEs under each maintenance performance measure.
The figure clearly shows that only one SME has significant high rank values compared to the other considered SMEs. The best ranked SME is
The Work request response rate indicator (KM1.4) has the most influential rank in the scope of the maintenance process in Serbian SMEs. It is very important for efficiency of the maintenance process that work requests remain in “request” status for less than 5 days. The Reactive work indicator (KM1.2) has the second influential rank because it is very important that man-hours used for reactive work be as short as possible. Quality of scheduling process indicator (KM3.2) is the third indicator for which the importance stands out of. This indicates that delaying the execution of work orders, due to material or manpower, has the big impact on the efficiency and effectiveness of the maintenance process and therefore on its quality. The rest of the process indicators have approximately the same influence for the analyzed SMEs. The Schedule Compliance indicator (KM4.1) and Manpower Utilization rate indicator (KM4.3) have the lowest importance because in Serbia work orders completed in a scheduled period before a late finish date are rare.
The results of optimized ranking of the maintenance cost indicators (Figure 4(b)) are more or less expected. They showed that Direct Maintenance Cost indicator (KC1) has the most influential rank in the scope of maintenance cost in the Serbian metal processing SMEs. This is logical if one considers that the increasing intensity of maintenance leads to an increase in direct cost. The Maintenance Cost component over Manufacturing Cost indicator (KC4) has the second influential rank because it indicates the effect maintenance cost in the total manufacturing cost. The rest of the maintenance cost indicators have approximately the same importance for the analyzed SMEs.
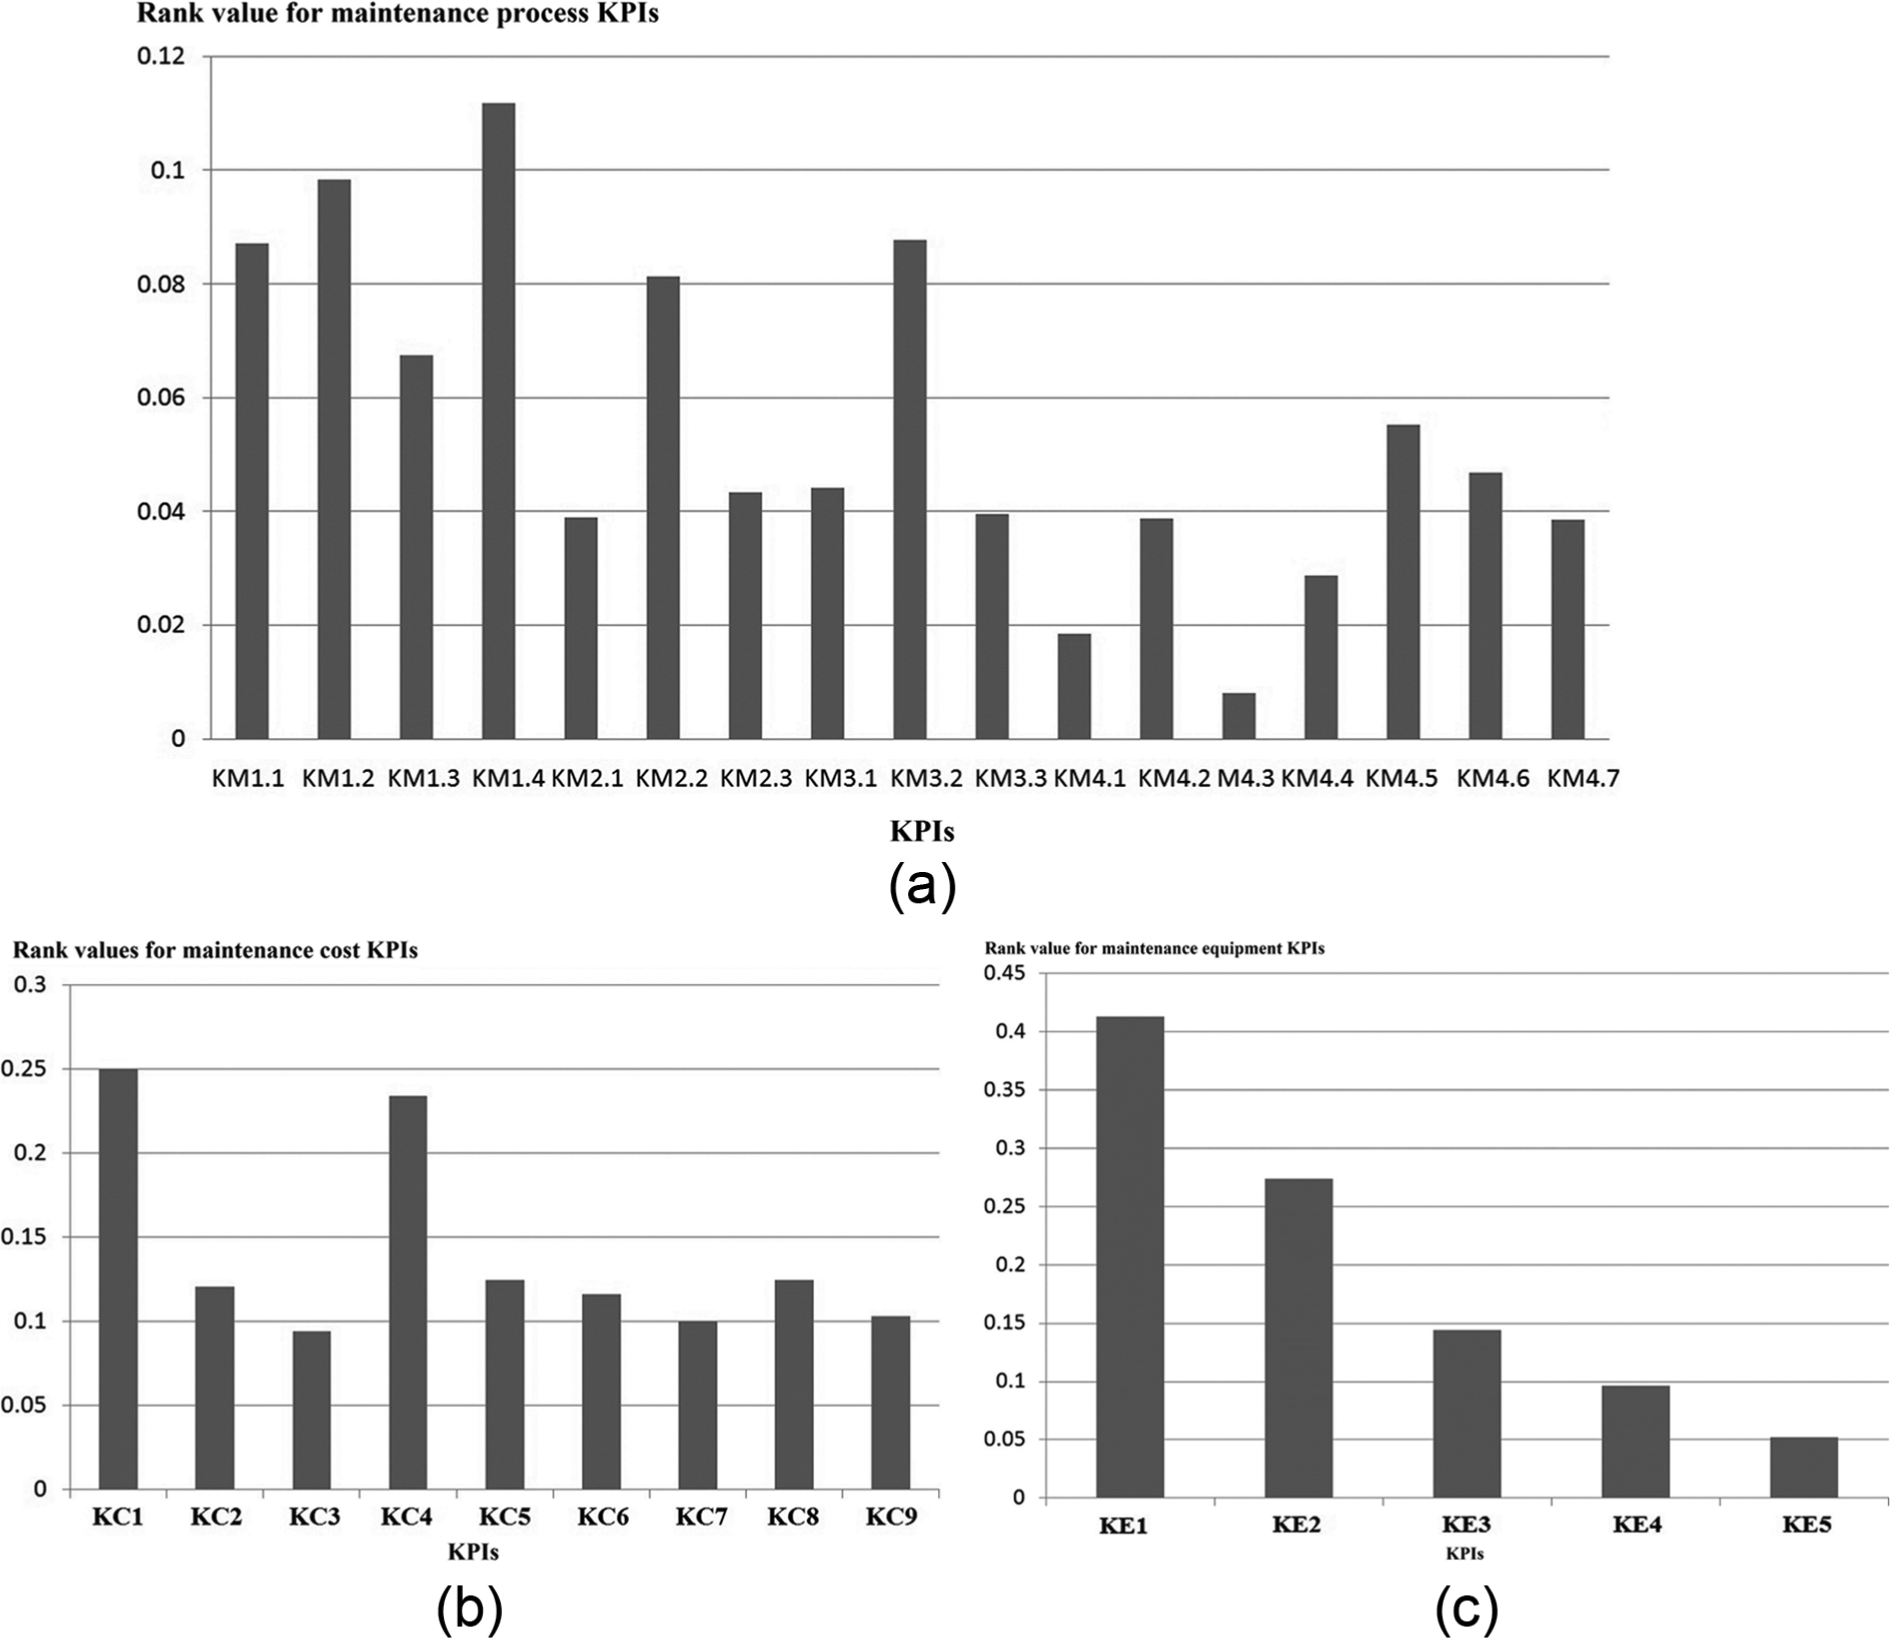
Rank of KPIs under maintenance performance measures: (a) maintenance process KPIs, (b) maintenance cost KPIs and (c) maintenance equipment KPIs.
The optimized rank of the maintenance equipment indicators is presented in Figure 4(c). It shows that the Number of Failures indicator (KE1) has the most influential rank in the scope of maintenance equipment in Serbian metal processing SMEs. This is explained by the fact that the Number of Failures indicator includes all failures: operational, non-operational, safety and so on. The second influential rank is held by Failure/Breakdown Frequency indicator (KE2) which is logical because the indicator represents a measure of reliability. The indicator that also represents a measure of reliability is Mean Time between Failures indicator (KE3). Its weight value is 0.24, but metal processing SMEs in Serbia still have a short time between failures and therefore a low value for this indicator. The Availability indicator (KE4) and the Equipment Effectiveness Indicator (KE5) have the lowest influence in Serbian SMEs.
The second task is to provide support for optimization of KPIs according to the desired level of maintenance process (see Table 1) in the randomly chosen SME with respect to the values of KPIs in the SME which is placed at first place in the rank (see Figure 3).
Using the first module of the software, an SME could identify KPIs that need improvement (for instance, by comparison with leading SMEs) or a KPI where room for improvement exists; also the KPIs that are at a satisfactory level could be fixed. The goal could be to assess its own KPIs, identifying its strengths and weaknesses by comparison with the leading and average ones. In addition, each SME could develop its own scenario for improvement of learning from the leading organizations. It is assumed that the total increase in the value of the selected KPIs is 10%.
By using the proposed algorithm (Steps 8–10), the coefficient of improvement of the selected KPIs is determined. The given results are presented in Figure 5.
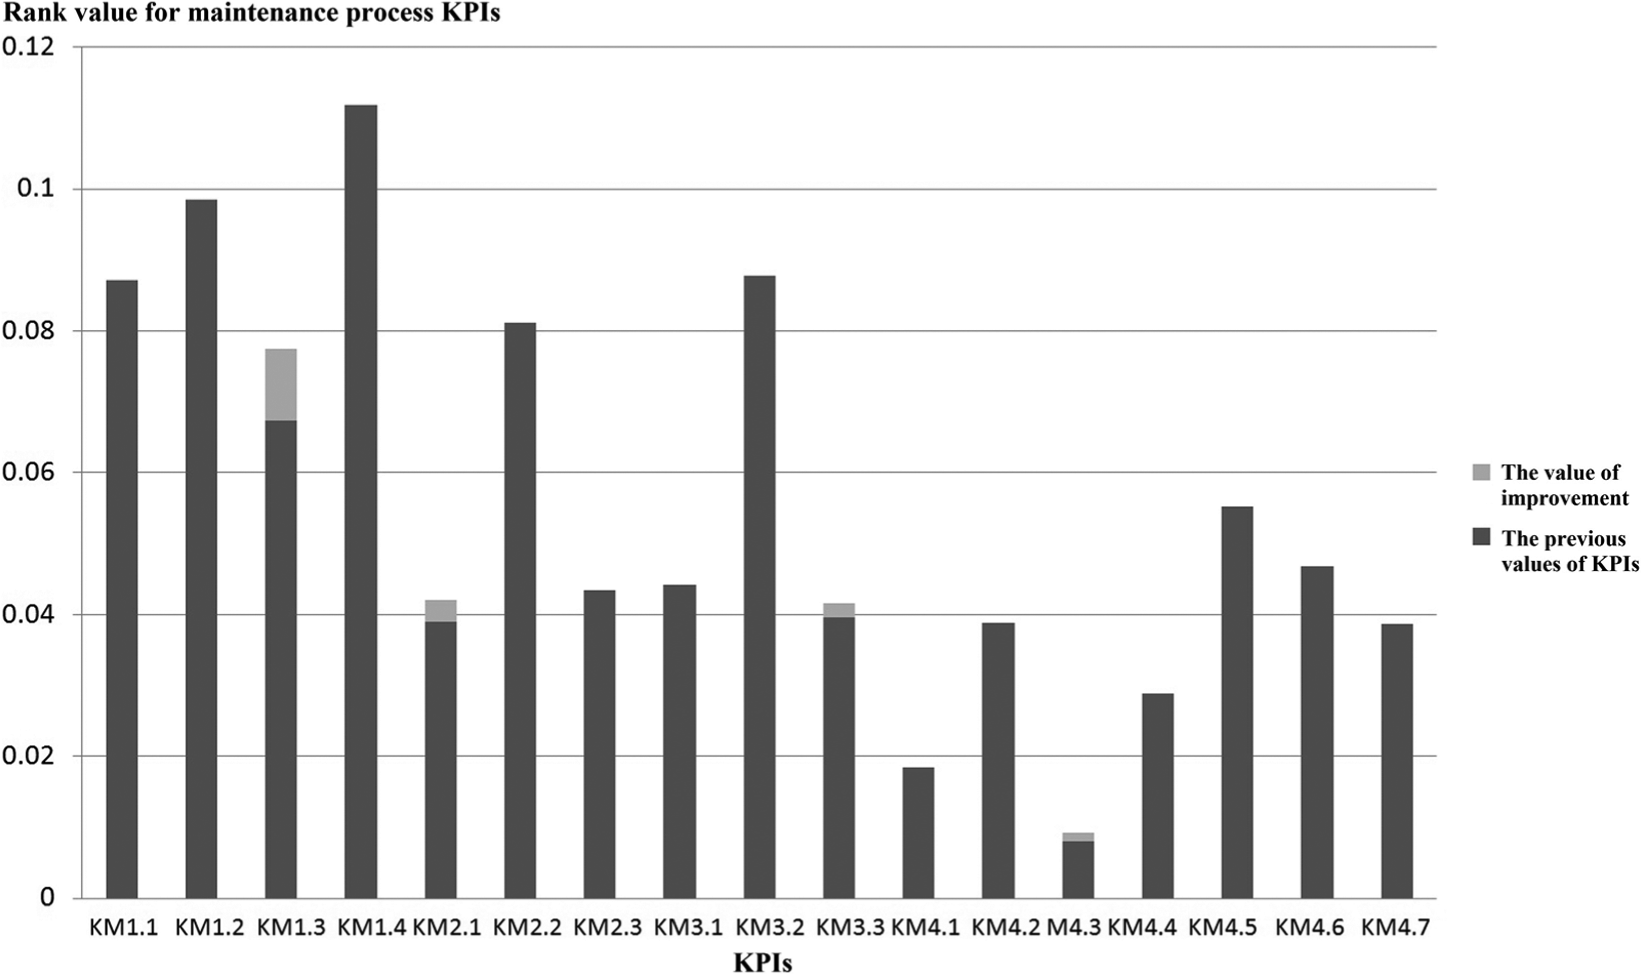
Optimization of maintenance process KPIs for a randomly chosen SME.
By using the proposed algorithm, the degree of improvement of each selected KPI is calculated so that the improvement of KM1.3 is 4.6%, KM2.1 is 2.7%, KM3.3 is 1.8% and the improvement of KM4.3 is 0.9%.
The result is an exact level of KPIs that need to be reached, in order to make specific improvement of maintenance performance, having specific KPIs for multi-objective optimization. On the other hand, it is possible to provide changes in KPIs and re-calculate maintenance performance, which is a much easier task. The same process of multi-objective optimization could also be performed with cost and equipment performance indicators.
Conclusion
It is clear that research of MPM has an important place as well as a number of issues. A novel approach to the ranking and assessment of maintenance performance KPIs, as well as overall ranking of maintenance performances in SMEs, is presented. In addition, the presented approach enables multi-objective optimization of selected KPIs in the scope of optimization of maintenance performances.
The list of KPIs was selected from the literature. The approach is based on evaluations of KPI weights by experts (the fuzzy rating of each decision maker was described by using five linguistic expressions which are modeled by TFNs). These weights were the input for ranking and optimization using MATLAB GA toolbox.
The approach was tested on 53 SMEs from the Serbian metal processing sector. Their inputs (values for KPIs) were used for calculation and ranking of KPIs (for process, costs and equipment), as well as ranking of the highest, average and lowest values. The ranking of SMEs was also performed. In addition, the presented solution enables multi-objective optimization.
Furthermore, the value of optimization was tested on a group of SMEs which proved that improvement of maintenance performance could be more significant (or performed at the shorter period of time) if the specific KPIs were targeted for improvement.
The presented solution could provide identification of strengths and weaknesses (comparing KPIs), learning from a leading organization (in prioritization of KPI improvement) and improvement of maintenance performance. Moreover, the presented solution could be a starting point for further improvement because the optimization of specific KPIs could be accompanied by the suggested strategies and/or tools. An approach could be applied more widely by applying the presented approach in different industries or countries or simple usage for assessment of maintenance performance indicators in single companies and for planning of future improvements.
The mathematical approach of fuzzy ranking followed by GA is robust and reliable. The limitations of the specific research are related to the selection of SMEs (SMEs from the Serbian metal processing industry). This limitation is mostly present in the area where a specific SME compares itself with the leading one or where the upper limits for specific KPIs are defined (even they could be manually increased in the software). Further research should be directed to increasing the number of SMEs, industries, countries and so on. In addition, this approach could be used as the basis for more complex solutions and decision support systems.
Footnotes
Declaration of conflicting interests
The authors declare that there is no conflict of interest.
Funding
This research received no specific grant from any funding agency in the public, commercial or not-for-profit sectors.