
Abstract
High-resolution defect detection is an integral part of non-destructive testing (NDT). Ultrasonic array transducers have been developed to respond to this need and provide high-resolution images for such applications. At present, high-resolution imaging is achieved by ultrasonic array design, such as enhanced transducer materials, and optimised element geometry to fulfil inspection requirements and miniaturise imaging artefacts, etc. This paper presents a novel ultrasonic array and controller system design strategy that can miniaturise the array and reduce manufacturing cost of the entire array system. This then enables the permanent or semi-permanent installation of arrays onto structures and long-term continuous structural health monitoring (SHM). The array geometry is designed as a compromise between the required imaging performance for the desired application and the fabrication cost for permanent installation. A prototype array transducer is constructed from piezoceramic elements bonded to a flexible printed circuit (FPC) substrate and then permanently installed on example structures to demonstrate long-term monitoring. Improved long-term sensitivity to defect growth is achieved by applying a compensation strategy for velocity and phase changes with temperature. Results show that a 5 MHz, 18-element prototype array can detect changes as small as 0.1 mm in the diameter of a side-drilled hole (SDH) defect after 3 months of continuous monitoring.
Keywords
Introduction
Material and structural failures cause economic losses.1–4 Non-destructive testing (NDT) and structural health monitoring (SHM), are used to prevent these losses by detecting and evaluating defects before they cause failure.5–7 High-resolution defect inspection capabilities are critical to the early defect detection in the fields of NDT and SHM.8–12 Ultrasonic testing is widely used for such applications as it is suitable for a wide range of materials, sensitive to small defects and provides many features for defect characterisation. 13
Considering common industrial applications, failures typically start within a localised area of a structure subject to higher stress, for instance, from a bolt-hole3,14 or change in geometry such as a pipeline weld.4,15 These are examples of scenarios where ultrasonic array inspection is a common approach as it provides high-resolution images of defects which are often easy to interpret. 11 However, due to the cost and size of current array systems, array inspections are typically made periodically, often when the structure is off-line or undergoing maintenance. Building on recent developments in ultrasonic array transducers for continuous monitoring applications16,17 and portable ultrasound-on-chip platforms 18 in the field of medical diagnosis, we present a low-cost, low-profile, high-frequency ultrasonic array transducer that facilitates high-resolution imaging. These attributes also make the array suitable for permanent installation and ensure a stable ultrasonic coupling condition for long-term monitoring.
Current off-the-shelf ultrasonic phased arrays use piezoelectric ceramic elements bonded between carefully designed, rigid backing and matching layers, then packaged within a metal casing. The array elements and their inter-element pitch are required to be small, typically half a wavelength, to ensure imaging artefacts such as grating lobes are avoided. Array imaging algorithms, such as plane wave imaging (PWI), 19 synthetic aperture focusing technique (SAFT), 20 and the total focusing method (TFM), 21 can then be used to generate high resolution images with good contrast. However, this classic type of ultrasonic array transducer also leads to a high manufacturing cost and the associated packaging means they have a relatively large physical size, both of which limit the prospects of long-term installation for continuous monitoring purposes.
Different from ultrasonic phased arrays for NDT, ultrasonic arrays for SHM are designed around the concepts of low-cost and permanent installation for long-term continuous monitoring with on-demand interrogating capability. In the field of SHM, researchers have explored the use of networks of sparsely distributed piezoceramic and piezo-polymetric elements directly bonded to or embedded in structures to achieve long-term inspection, typically using low-frequency guided waves.
9
Ultrasonic arrays for SHM can be classified into two main groups: compact and sparse arrays. Intensive research has been performed on sparse arrays for long-term inspection due to their potential for global coverage.
22
For example, Giurgiutiu
23
demonstrated defect detection using piezoelectric wafer active sensors (PWAS) bonded to a plate-like structure to excite guided waves. They designed a 4-element 300 kHz (S0 mode ultrasonic guided wave) PWAS sparse array and showed the array system can locate an enlarged through-hole with 10 mm accuracy.
24
Yan et al.
25
also demonstrated a multi-element sparse guided wave array which can conduct tomographic SHM for plate-like structures. They demonstrated the detection capability of a through-hole with a 6.35 mm diameter in a composite plate by using a 350 kHz S2 mode ultrasonic guided wave. However, the array in this work showed limitations in defect location on anisotropic plates, due to the wave skew effects. Huan and Li
26
developed a sparse array for SHM with the use of shear horizontal guided wave excitation, which was able to detect 4 mm diameter through-holes and locate them with a 12 mm accuracy. Researchers have also explored the use of guided wave compact arrays (i.e. phased arrays for beam steering) for SHM applications, using a one-dimensional (1D),27,28 two-dimensional (2D)29–32 and interdigital
33
geometric formats. Giurgiutiu and Bao
27
developed a linear 9-element, 300 kHz (S0 mode), 9.0 mm pitch (half wavelength) phased array for crack detection in plate-like aluminium structures. Fromme et al.
28
designed a low-frequency (160 kHz) 32-element guided wave ultrasonic compact array with piezoceramic discs for large plate-like structures which sweeps an unfocused beam over a large area. Yu and Giurgiutiu
29
investigated the applications of 2D compact arrays for in situ guided wave damage detection with a wide area of coverage capability. Two 2D guided wave compact arrays,
This paper presents the development of an ultrasonic array for long-term localised structural integrity monitoring that combines the merits of both NDT and SHM ultrasonic arrays. In this work, ultrasonic bulk wave is adopted for the SHM on block-like structures. A low-cost array design concept is proposed to enable an ultrasonic phased array to be permanently installable on sample structures for long-term continuous health monitoring and high-resolution defect detection. Section ‘Ultrasonic array’ describes the design concept and experimental performance of the developed ultrasonic array transducer. Simulation tools were used to design the array geometry such that high-performance imaging is achieved over an acceptable region with the minimum number of elements, which contributes to simple array design and cheap manufacturing. 34 Section ‘Long-term continuous monitoring experiment’ presents long-term continuous monitoring data acquired using the developed ultrasonic array to demonstrate its inspection capability and its reliability for long-term installation. Section ‘Signal compensation’ explores signal compensation strategies to correct for benign changes that occur during long-term monitoring. Finally, Section ‘Tracking small changes in defect size’ demonstrates the capability of the developed ultrasonic array on the detection of small defect changes.
Ultrasonic array
Array design concept
The aim of this paper is to develop an ultrasonic array suitable for permanent installation applications that require long-term monitoring of local regions of a structure. For example, monitoring components around a stress concentration such as a bolt hole. As shown in Figure 1(a), an array structure is conceived in which piezoelectric ceramic elements are soldered on a flexible printed circuit (FPC) substrate containing the wiring tracks.
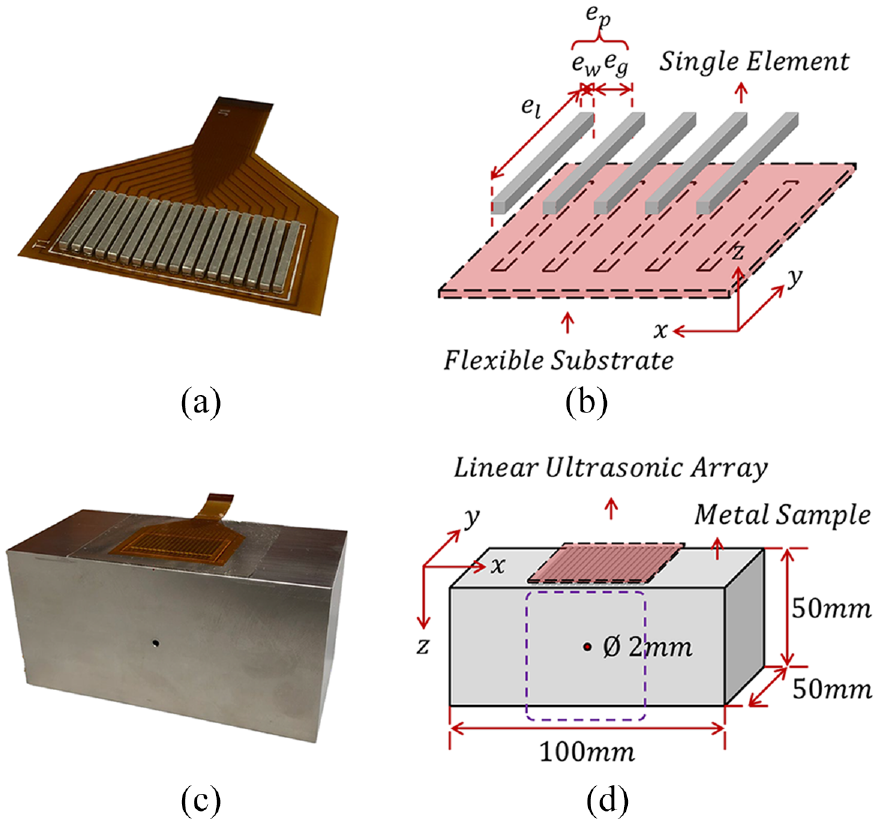
Design of the ultrasonic array and sample block for long-term continuous monitoring: (a) shows a photo of the developed ultrasonic array, (b) schematically demonstrates the array element geometry, (c) shows a photo of the prepared sample block made from mild or stainless steel, the developed array transducer is bonded on the top surface of the sample block, and (d) schematically shows the sample block dimensions. The linear array element configuration is oriented on the x-axis, hence the x–z imaging plane. Note that similar design strategy has been adopted by the Acellent technology for the development of an ultrasonic guided wave array. 35
As shown in Figure 1(b), the element width (
Array geometry selection
To illustrate the effects of the array element parameters on the ultrasonic array imaging performance, simulations are conducted with different array element configurations. Here, a 2D hybrid model,
38
which is designed based on Huygens’ principle model (i.e. using the Rayleigh integral approach) and a ray-based model, is implemented to simulate ultrasonic time-domain responses, which are then used to produce images with an ultrasonic imaging algorithm. The input pulse of the simulation is a 5-cycle Gaussian-enveloped sinusoidal tone burst, with a 5 MHz centre frequency which is typical of many NDT array applications. The simulated sample block is illustrated in Figure 1(d) and the simulated material is mild steel, with a longitudinal velocity 5850 m/s, which leads to a wavelength,
where
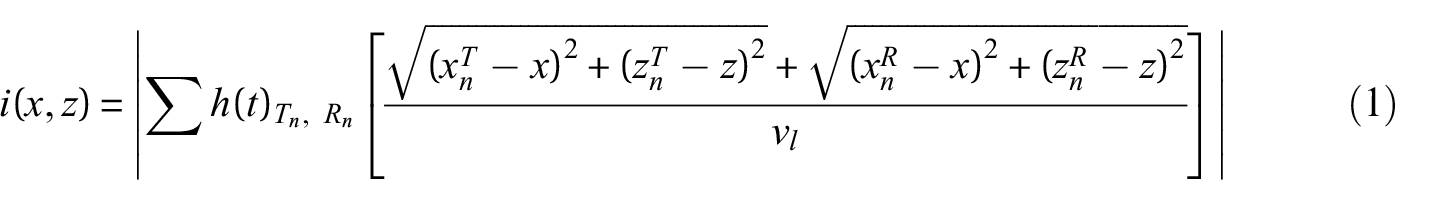
Figure 2 shows the TFM simulation results for different configurations of array element pitch, width, and gap, but with similar aperture sizes, that is, 27.6, 26.5 and 27.2 mm respectively. It is noted that all TFM images are presented in a decibel (dB) scale in this paper. There is a SDH defect simulated in the middle of the inspection area. A 50 mm ROI (red dashed rectangle) is set and centred at the SDH position to evaluate the array element geometry effect on the TFM imaging quality. The best TFM image is seen in Figure 2(a), which presents no imaging artefacts in the entire imaging region. This is due to the small array pitch size compared to the wavelength. Imaging artefacts start to emerge in the TFM images when the number of elements is decreased, whilst the aperture size is maintained, and hence the pitch size increased, as shown in Figure 2(b) and (c). In Figure 2(b) the grating lobes are outside of the ROI and their amplitudes are lower than the defect amplitude. If the array pitch is further increased, as shown in Figure 2(c), the grating lobes extend into ROI and the grating lobe amplitude is also increased. This will negatively affect the defect detection as in the worst case the imaging artefact might be detected as a defect or potentially mask any defect present in that area. From this discussion the prototype array transducer was designed as per Figure 2(b) with 5 MHz centre frequency, 18 elements, 1.5 mm array pitch size and 1.0 mm element width, offering a good compromise between reduced element count and array imaging performance. The material and manufacturing cost of the prototype array transducer is approximately £15, that is, £14 for the piezoelectric elements and £1 for the FPC substrate circuit. The simplified ultrasonic array controller system developed in our work was assembled from a single-channel ultrasonic probe controller (HS5, TiePie, The Netherlands), a multiplexing control unit (4B, Raspberry Pi, UK) and two 16-channel analogue multiplexing chips (MIKROE-4111, MikroElektronika, Serbia). The total device cost of the described multiplexing array controller setup is approximately £1500.
Simulated TFM image comparison of different ultrasonic array element geometries. (a) 5 MHz array with 28-element, 0.6 mm element width and 1.0 mm pitch size, (b) 18-element, 1.0 mm element width and 1.5 mm pitch size array, and (c) 14-element, 1.2 mm element width and 2.0 mm pitch size array.
Prototype evaluation
To evaluate the capability of the prototype array for long-term continuous monitoring, mild steel and stainless steel test samples were prepared as shown in Figure 1(c) and (d), each containing a SDH defect. The reason for using SDH defect is the SDH is drilled parallel to the scanning surface and presents the same reflector to all beam angles, and it is a true 2D defect, which is good for the 2D simulation validation. The ultrasonic array was bonded on the top surface of the sample block with epoxy resin under vacuum for resin degassing (see Figure 1(c)). The array was connected to an array controller (MicroPulse, Peak NDT, UK) for full matrix capture (FMC) data acquisition in which the complete set of time-domain data from all combinations of transmitting and receiving elements of the ultrasonic array was captured. 21 As above, ultrasonic imaging was performed using the TFM imaging algorithm.
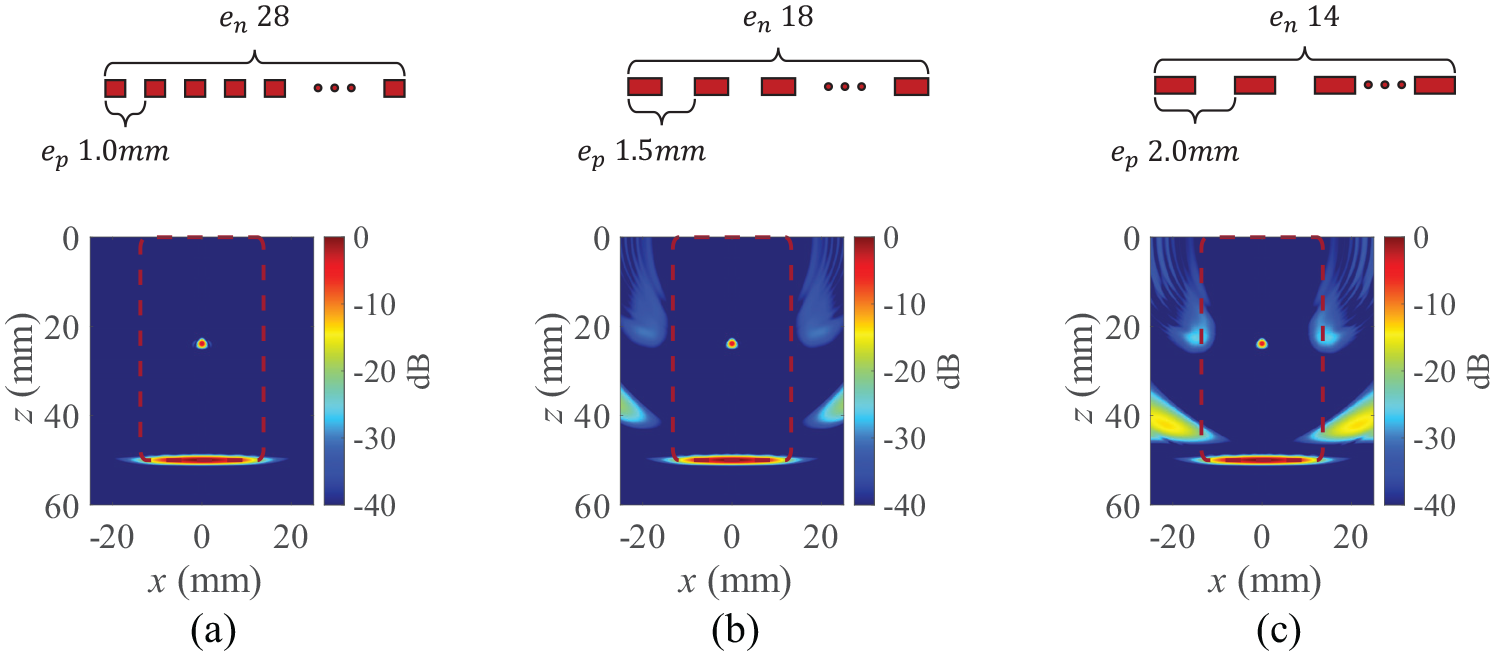
The ultrasonic performance of the array geometry design is evaluated by using the previously developed rapid ultrasonic array assessment framework (RUAAF). 34 As shown in Figure 3(a), the experimental ultrasonic data used in the RUAAF simulation is acquired from a pair of representative elements to extract the coherent and random noise levels, material acoustic attenuation coefficient and input pulse shape. Compared to the previous hybrid model, the RUAAF approach implements a noise model, acoustic attenuation and the direct and inverse piezoelectric transverse functions of the representative array elements in the bonded condition. Note that, for accurate RUAAF analysis, the piezoelectric element used in the simulation are required to have the same piezoelectric properties, bonding and dimensions as the elements used for the prototype array transducer fabrication.
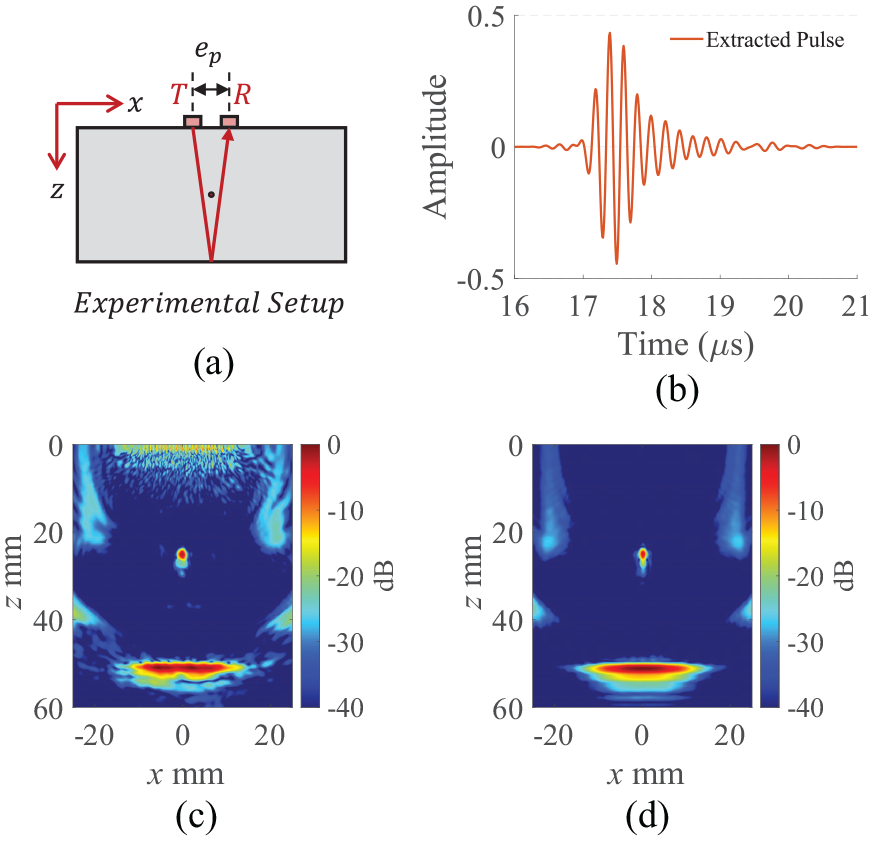
Ultrasonic TFM image comparison between the experiments measured and simulated output. (a) Schematically demonstrates the experimental data acquisition used in the simulation. (b) The input pulse for the RUAAF simulation uses the experimentally measured backwall echo. (c) Shows the TFM image from experimental measurement, and (d) shows the simulation output by using the RUAAF method.
As schematically shown in Figure 3(a), the input pulse for the simulation is obtained by extracting the measured signal from an A-scan, such as the backwall echo. Since the backwall echo is a propagated experimental input pulse, backpropagation can be applied with a correction to account for the ultrasonic propagation path, beam spread, material acoustic attenuation and element directivity effects. In this way the input pulse for RUAAF is found as shown in Figure 3(b). In the RUAAF model, the modified input signal and other parameters are then used as follows,
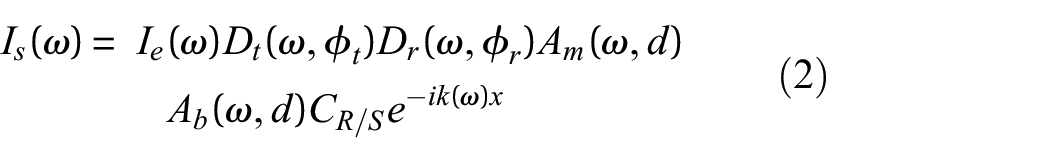
Where
Figure 3(c) shows the experimental TFM image acquired from the developed array transducer, for the evaluated configuration, and Figure 3(d) shows the simulated TFM image from the RUAAF simulation. Note that the SDH defect and sample backwall ultrasonic responses are respectively seen as the dot-shaped feature at
Flexibility of the developed ultrasonic array
The general structure of the developed array uses a flexible FPC substrate, which enables the possibility of NDT inspection on non-planar surface geometries, something difficult with standard arrays.
A stainless steel sample with a curved top surface is prepared to evaluate the ultrasonic imaging performance of the developed array on non-planar surfaces. Figure 4(a) shows the prepared sample (arc of circle with 505 mm diameter) containing a SDH onto which the flexible ultrasonic array is bonded. The TFM imaging algorithm shown in Equation (1) is used to generate the TFM image, which is shown in Figure 4(b). Figure 4(c) shows the TFM after data acquisition using our low cost multiplexed array controller from which it can be seen that very similar performance to the commercial controller is achieved. This shows that the SDH feature in the TFM image agrees well with the SDH location (red dashed line) in the schematic. Good imaging performance, a 45 dB SNR for imaging the SDH defect, has been achieved using the developed ultrasonic array for non-planar surface imaging. It is noted that the ultrasonic array controller used for later experimental results is the MicroPulse system for maintaining the experimental consistency. Considering the TFM comparison shown in Figure 4, the low-cost ultrasonic array system should potentially match the performance. Further performance evaluation for the proposed low-cost ultrasonic array controller will be conducted in future work.
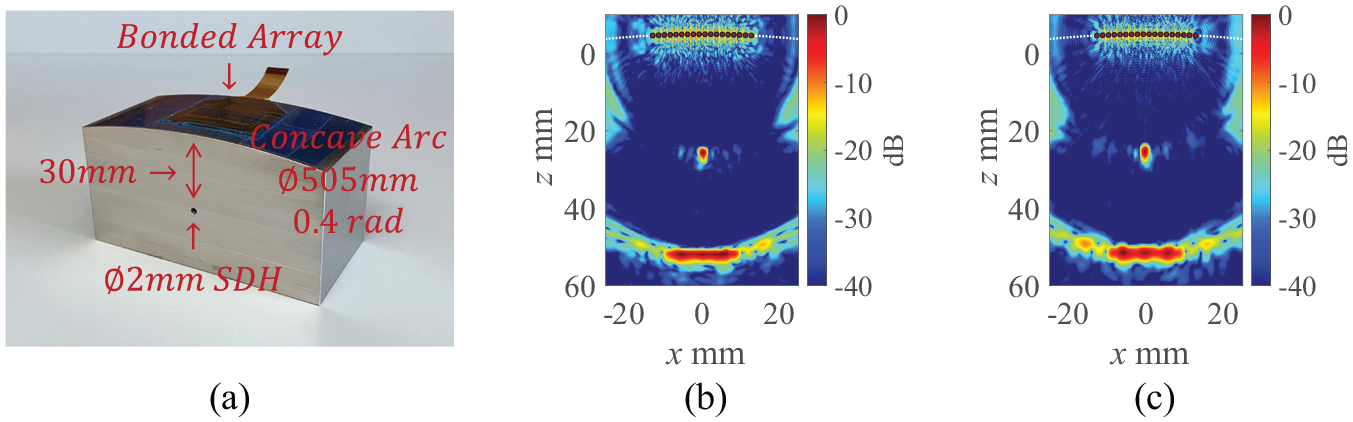
TFM image demonstration of a curve-surface sample with a bonded ultrasonic array. (a) Shows the prepared sample block with a curved top surface where a developed flexible ultrasonic array is bonded, (b) the TFM image after data acquisition using the MicroPulse array controller system, and (c) is the TFM image after data acquisition using the low-cost multiplexed array controller.
Long-term continuous monitoring experiment
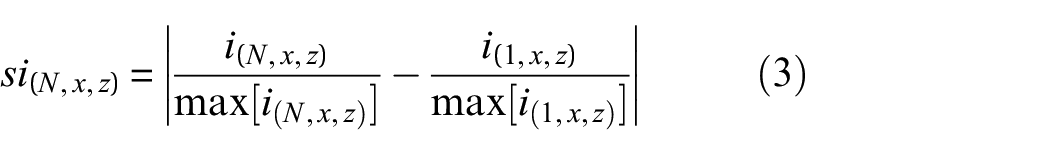
Having demonstrated the capability of a low-cost ultrasonic array, its application to long-term continuous localised monitoring is now investigated. Figure 5 shows example TFM images from a long-term continuous localised monitoring dataset and how they may be used. The TFM images shown in Figure 5(a) and (b) are acquired respectively on Day 1 and Day 167, roughly 3 months apart. Ultrasonic measurement comparison is made by subtracting TFM images to detect changes as,
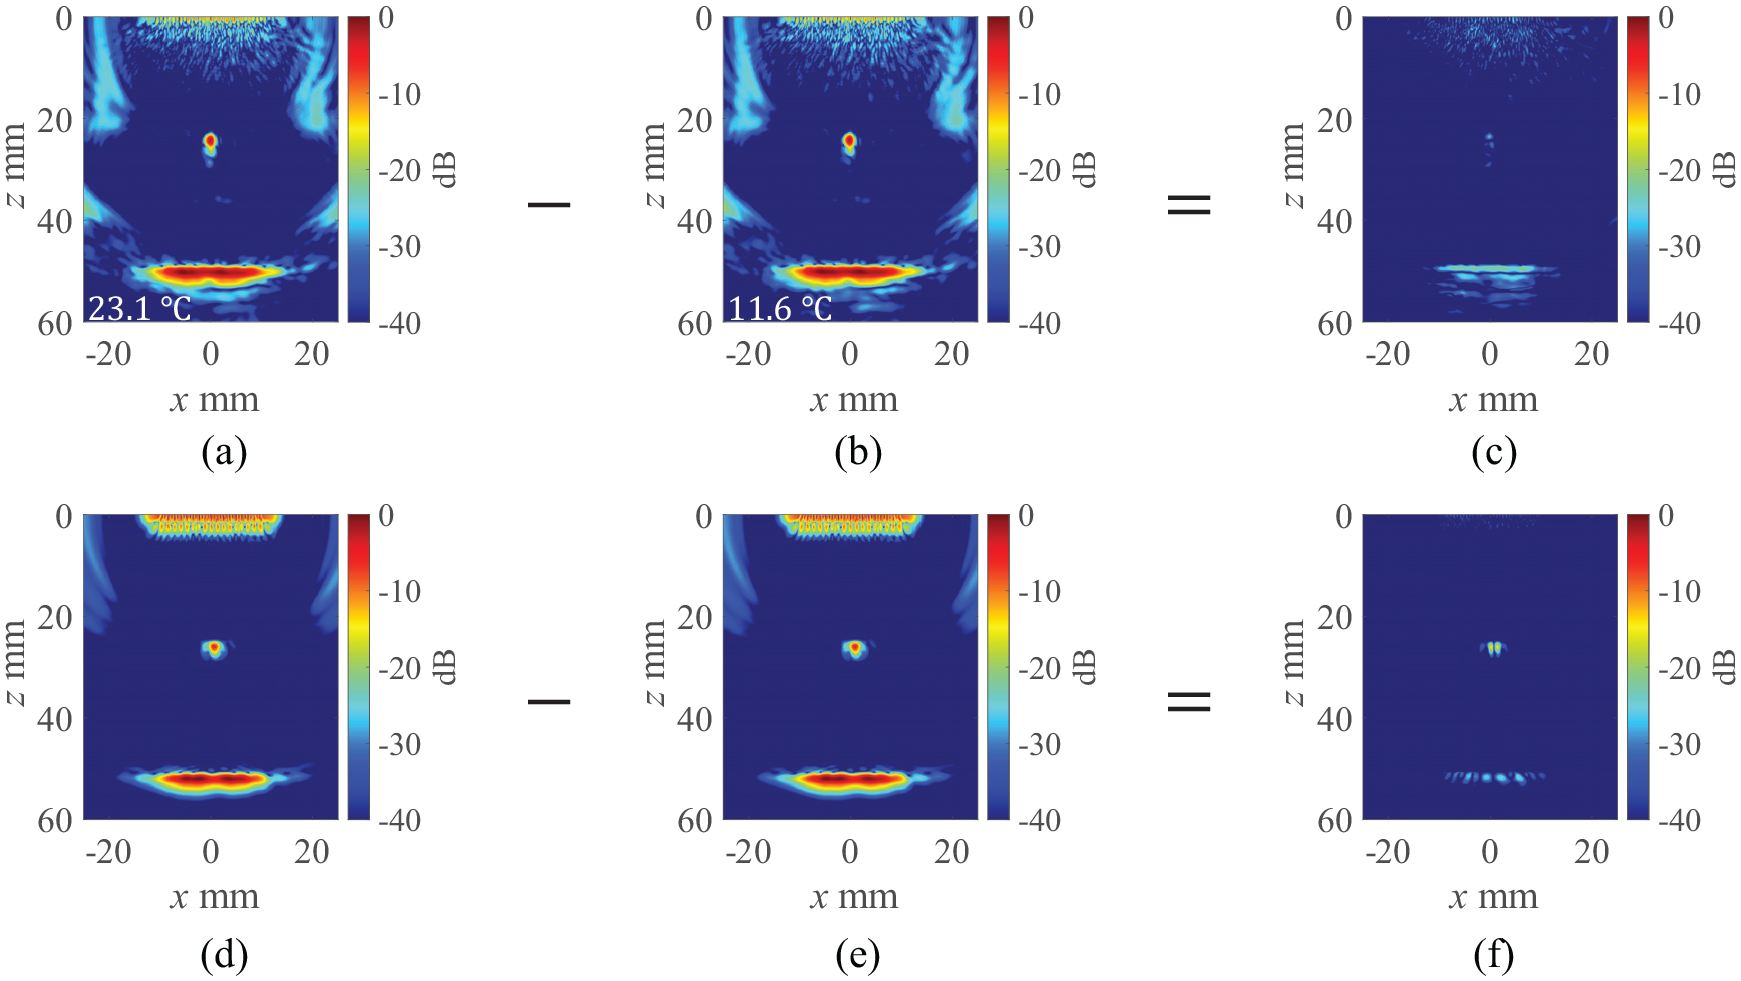
Demonstration of the long-term continuous monitoring experimental results. The developed 5 MHz array is bonded on a mild steel sample block. (a) TFM image from a dataset acquired on Day 1 (26 July 2021), (b) TFM image from dataset acquired on Day 167 (10 Jan 2022), (c) is the image given by the subtraction of the Day 1 and Day 167 TFM images. Laboratory temperatures are shown. A subtraction comparison is made by using a commercial ultrasonic array (5 MHz, 64-element, 0.6 mm pitch size with a 0.1 mm element gap elementary geometry), which are presented in (d), (e) and (f). Note that, the FMC data shown in (d) and(e) are measured on the same day.
where
To understand the potential benefits of permanently installed low-cost arrays, a comparison is made to a commercial ultrasonic array (Imasonic, France), which is a 5 MHz, 64-element, 0.6 mm-pitch and 0.1 mm gap array. The acquired FMC dataset is modified after acquisition to create a response equivalent to a 5 MHz, 18-element, 1.2 mm-pitch and 0.1 mm-gap array, the closest element geometry to the low-cost array (18-element, 1.5 mm-pitch and 0.5 mm-gap). As it is noted in the figure caption, FMC data of Figure 5(d) and (e) are acquired on the same day, the only difference is the array coupling condition. It is important to note that care was taken to try to minimise said variation. The commercial array is firstly gel-coupled to the sample and the location is marked. After the first capture (Figure 5(d)), the array was taken off the sample and then replaced on the marked location on the sample for the second capture (Figure 5(e)). The SNR of the SDH defect in an individual TFM image is 52.74 dB, which is 5.64 dB better than the developed low-cost ultrasonic array (47.10 dB). However, the subtracted TFM image using the gel-coupled commercial array shows a −9.96 dB difference in the SDH area, which is 15.84 dB higher than our permanent installed system, −25.80 dB in the same area in Figure 5(c), even without any compensation approaches. Given the care taken to create consistent coupling conditions it is important to note that this represents a best-case performance deficit.
Better subtraction performance can be achieved by using signal compensation methods. Previous authors have suggested that temperature variations strongly affect ultrasonic data.10,39,40 For example, the ambient temperature difference between the two experimental measurements as shown in Figure 5 is 11.5 °C and this could be responsible for the changes in the ultrasonic datasets.
Before investigating correction techniques, the variability in the ultrasonic properties, such as the longitudinal velocity and the system time delay, were determined under changing environmental conditions. Figure 6(a) shows that the laboratory ambient temperature varies between 10 °C and 30 °C during the monitoring period. Figure 6(b) shows that there is a near-linear relationship between the measured longitudinal velocity and the temperature, referred to as the v–T relations of the thermal expansion effect of the sample material. The longitudinal velocity variation is about 0.1%, that is, 7 m/s from 5915 to 5922 m/s, during the monitoring period. The v–T relation is rounded to −0.55 m/s °C for the mild steel sample, which is comparable to an existing literature on the same material (−0.62 m/s °C). 41 From Figure 5(c) it can be seen that the system time delay changed from 402 to 408 ns over the same period. To quantify the image subtraction performance, the SDH amplitude in the subtracted TFM images is measured relative to the Day 1 SDH TFM image and converted to a dB scale. From Figure 6(c) it can be seen that the subtracted SDH image amplitude increases by 10 dB, that is, from −36 to −26 dB as the monitoring progresses, and our hypothesis is that the majority of this is due to the combined effect of velocity and system delay changes as a result of changing temperature. However, it is noted that this result is still better than the performance of the repeated use of the gel-coupled commercial array.
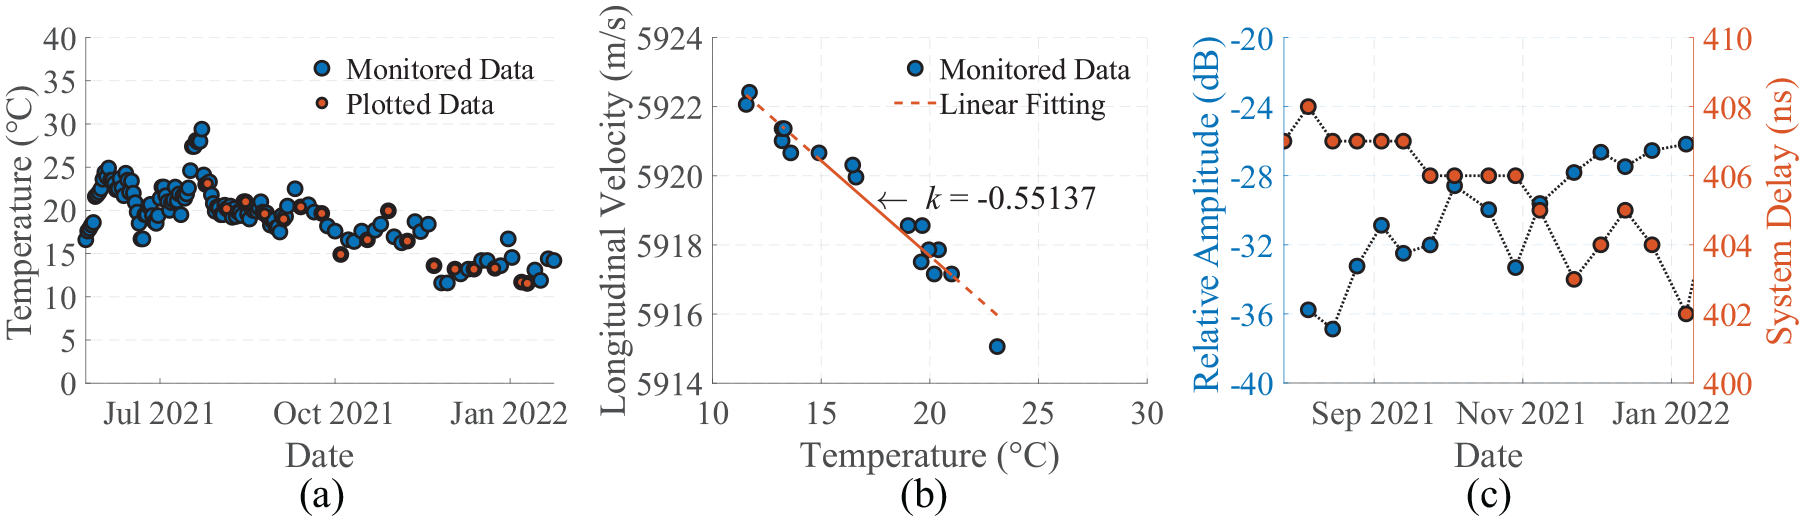
Parameters from the long-term continuous monitoring data. (a) Shows the monitored ambient temperature, (b) linear fitting of the monitored longitudinal velocity versus temperature, and (c) shows the monitored system time delay and the SDH amplitude in the subtracted TFM images.
Signal compensation
Development of the compensation strategy
To overcome the effects of changes in the system time delay and acoustic longitudinal velocity on the TFM subtraction, signal compensation is implemented. As shown in Figure 7, the system time delay changes are corrected by signal shifting which is implemented by backpropagating the signal with the measured system time delay,
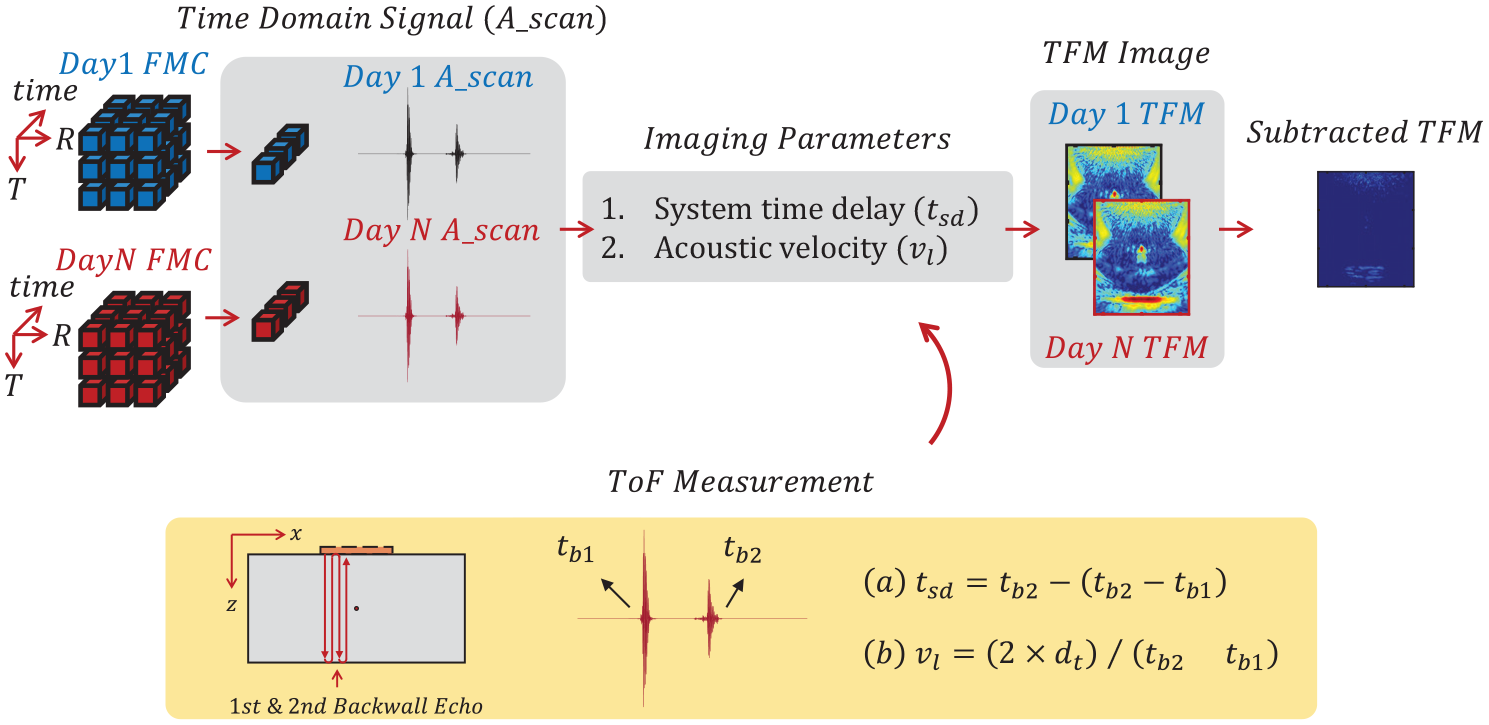
Diagram of the data compensation strategy. Time shifting is used to remove the system time delay, velocity measurement or time-domain stretching are applied to correct for variations in speed of sound. System time delay and longitudinal velocity are found from the first and second backwall echoes from the test sample.
A range of strategies based on the described techniques were explored to shift the time and correct for the varying velocity. Their impacts on the subtraction performance are summarised in Table 1. For signal shifting, the alternatives were the time domain method already mentioned and using cross-correlation in the frequency domain (
Comparison of data compensation methods for the long-term monitoring ultrasonic data. Signal shifting compensation is in Orange (top two rows) and signal stretching compensation operation in Blue (bottom two rows). The circles indicate that median values are used whereas the rectangle indicates the chosen method is implemented separately on all time-domain data. Note that, indicative TFM subtraction results in the bottom row are for day 167.
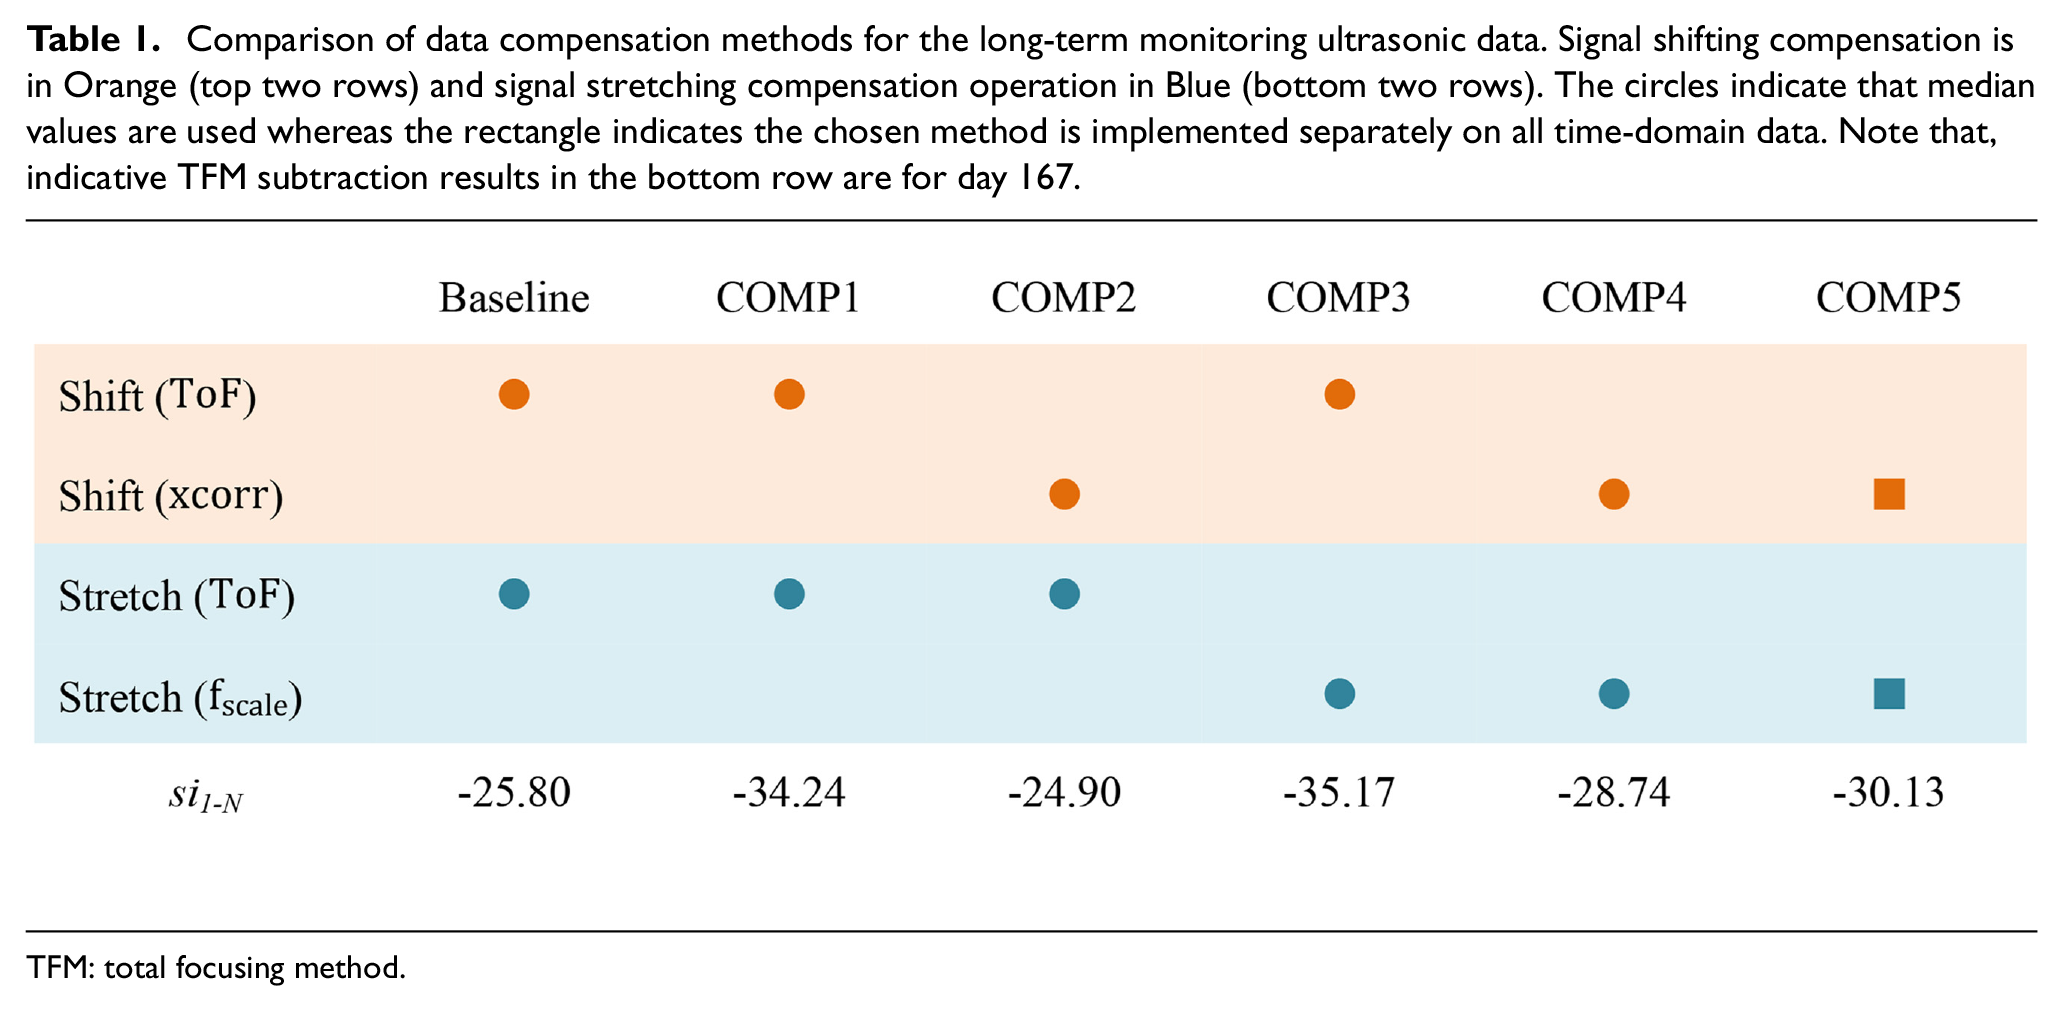
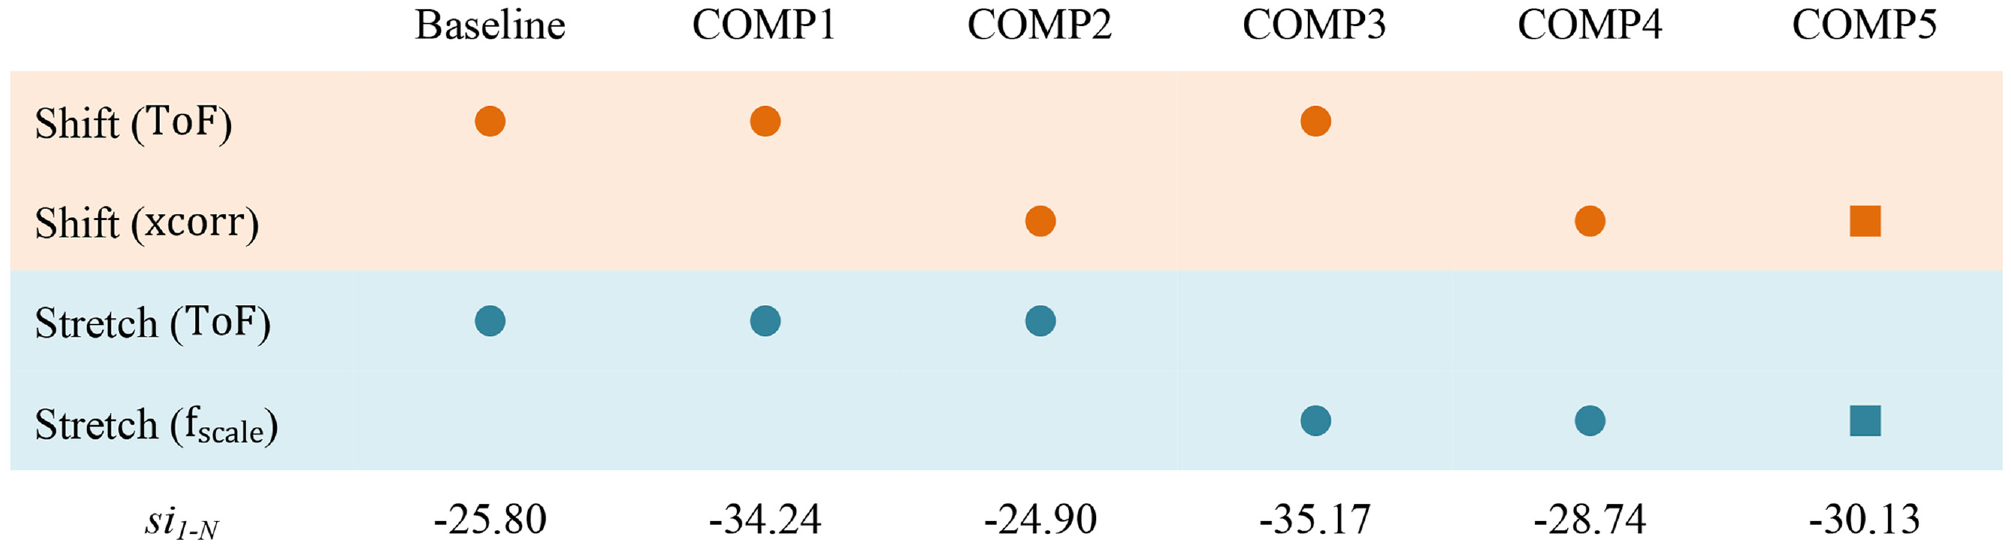
TFM: total focusing method.
For the Baseline group, a time domain ToF measurement is used to measure the system time delay (
The next approach explored (COMP1) is to measure the
In COMP2 the time shift is found by cross correlation (applied in the frequency domain). This is done for the pulse-echo A-scans of the FMC data and the median calculated and used to shift the data. In essence this shifts the latest measured data (Day N) to align with the Day 1 data. This approach was found to perform less well than the baseline. The hypothesis of this reduced performance is that the cross-correlation uses the complete ultrasonic signal for calculation, while some of the feature differences might not be related to the change of system time delay.
In COMP3 the scale transform method 42 is used to stretch the time domain data on Day N relative to day 1 to essentially put it in the same velocity state. This is applied to all time data within the FMC and then the median found. This stretch is equivalent to the velocity compensation performed in COMP1. As the data has been stretched the day 1 velocity is the used for the TFM generation. This approach (−35.17 dB) performed slightly better than COMP1 (−34.24 dB).
In COMP4 the time shift is found by cross correlation (applied in the frequency domain) between day 1 signal and Day N signals, as it in COMP2. Signal stretch factor is found by the scale transform method, as in COMP3. This is done for the pulse-echo A-scans of the FMC data and both the medians found for
The COMP5 group uses the same signal compensation combination as COMP4, however, instead of using the median for all time traces of the FMC dataset, COMP5 shifts and stretches each individual time trace of the FMC dataset acquired on Day N to match with the corresponding time trace acquired on Day 1. The subtracted amplitude in the SDH area is −30.13 dB, which is seen to offer a small improvement (1.39 dB) relative to COMP4, but adds a significant amount of further processing, and is potentially more vulnerable to noise effects and still performs worse than COMP1 and COMP3.
Overall, Table 1 shows that COMP1 and COMP3 provide the optimum, broadly comparable compensation performance for the TFM image subtraction, resulting in an 8 dB reduction in the subtraction artefacts compared to the Baseline group. COMP3 uses the scale transform method for velocity compensation, which is more computationally demanding than the ToF approach. Thus, the COMP1 signal compensation, which implements the ToF method for the signal compensation, is selected as it is performs well and is the simpler to implement.
Long-term monitoring results
Figure 8 shows the subtracted TFM image comparison between the uncompensated (a) and compensated data (b) produced from the Day 1 (26 July 2021) and Day N (from 27 July 2021 to 10 January 2022) data. Ambient temperature is recorded during this long-term monitoring experiment, which is presented in Figure 6(a). Figure 8(c) shows the comparison of the long-term monitored subtracted TFM image amplitude in the SDH area which is a 10 mm × 10 mm white dotted box centred at the SDH location. The SDH amplitudes measured from the compensated subtracted TFM images are approximately 10 dB lower than the uncompensated values. Using appropriate ultrasonic data compensation approaches, the developed low-cost array exhibits a high-resolution inspection capability, being able to resolve small defect changes (>−34 dB) using TFM image subtraction.
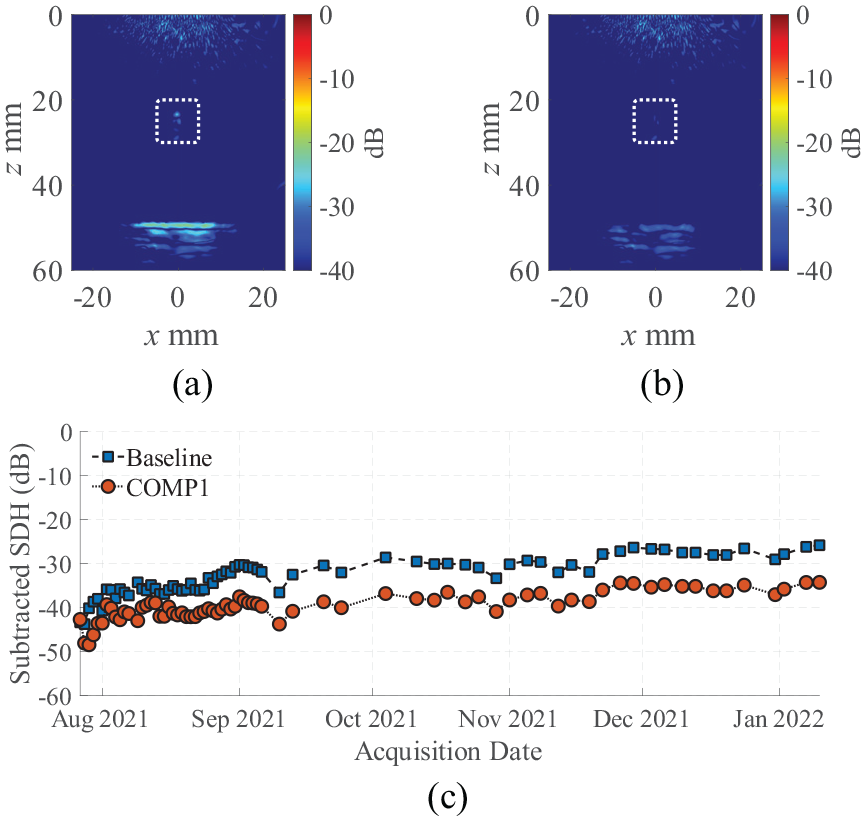
An example of subtracted TFM image comparison between the uncompensated data and compensated data (COMP1). (a) Is an example subtracted TFM without compensation, (b) is the example subtracted TFM image obtained after compensation, and (c) shows the comparison of the long-term monitored SDH amplitudes of the subtracted TFM with and without signal compensation over the 3-month duration of the experiment.
Tracking small changes in defect size
To show the detection made possible by the performance demonstrated, a further mild steel sample was prepared with an initial 2.0 mm in diameter SDH defect. This hole was then expanded in increments to evaluate the detection sensitivity of the developed ultrasonic array transducer to small defect changes. Figure 9 shows the results as this SDH is expanded to 3.0 mm in diameter in 0.1 mm increments. The expanding SDH scenario is also simulated using the RUAAF model, with a varying size SDH scatterer 43 (whose complete scattering matrix is used). In Figure 9(a), good amplitude agreement is seen when the SDH diameter is 2.1 mm and for points >2.5 mm, where the averaged error is 1.65 dB, as shown in Figure 9(b).
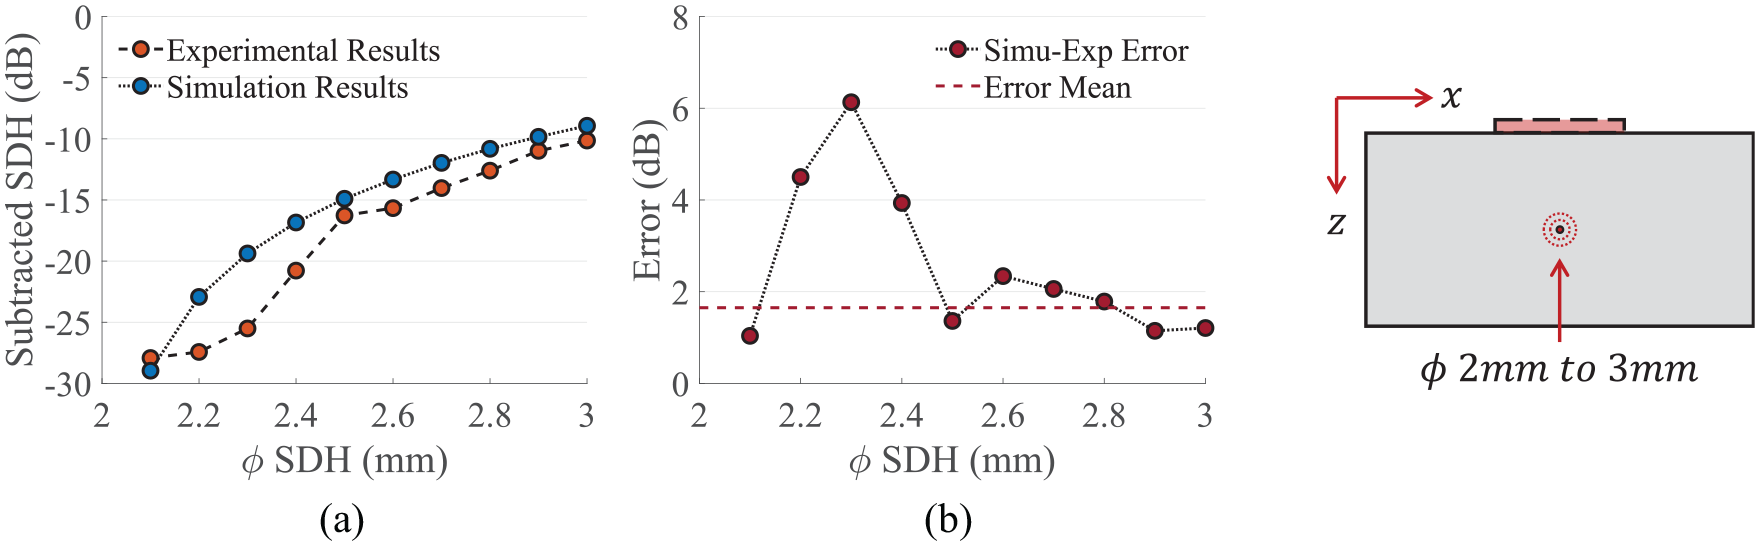
SDH expanding experiment in which a 2.0 mm in diameter SDH, it is then redrilled to expanding to 3.0 mm in diameter with a 0.1 mm increments. (a) Subtracted SDH image amplitudes as a function of the SDH diameter and (b) shows the error between the simulation results and experimental measurements. The inset schematic on the right shows the defect redrilling position.
Figure 10 shows the long-term monitored data of the subtracted SDH amplitude from the expanded hole sample. Monitoring data was acquired from 8 October 2021 (data #1) to 10 January 2022 (data #27). For data #28, which was acquired on 11 January 2022, the original 2.0 mm diameter SDH is redrilled to 3.0 mm in 0.1 mm increments over a period of hours (shown in the red dashed box). The hole diameter is shown in the bar chart within the red dashed box and numbered with the subtracted SDH amplitude points. The subtracted SDH amplitude is −50 dB at the start of the long-term monitoring period, it then increases to −30 dB for data #15 (29 November 2021). This increase is thought to be caused by changes in the epoxy resin bonding condition between the array transducer and the sample block. After data #15 (at the end of November), the subtracted SDH amplitude is stable at around −30 dB until data #28, which is the final undamaged capture. From the experimental data, the SDH amplitude is −31 dB for data #28 with the 2.0 mm diameter SDH, which immediately increases to −24 dB when the SDH is redrilled to 2.1 mm in diameter. This shows a 7 dB difference in the subtracted TFM image with a 0.1 mm increase in diameter for a SDH defect which suggests that this array and processing combination would be able to detect such changes when used for long-term monitoring of components. The subtracted SDH amplitude increased further as the drill diameter was increased to 3.0 mm, suggesting that all the small changes could be detected.
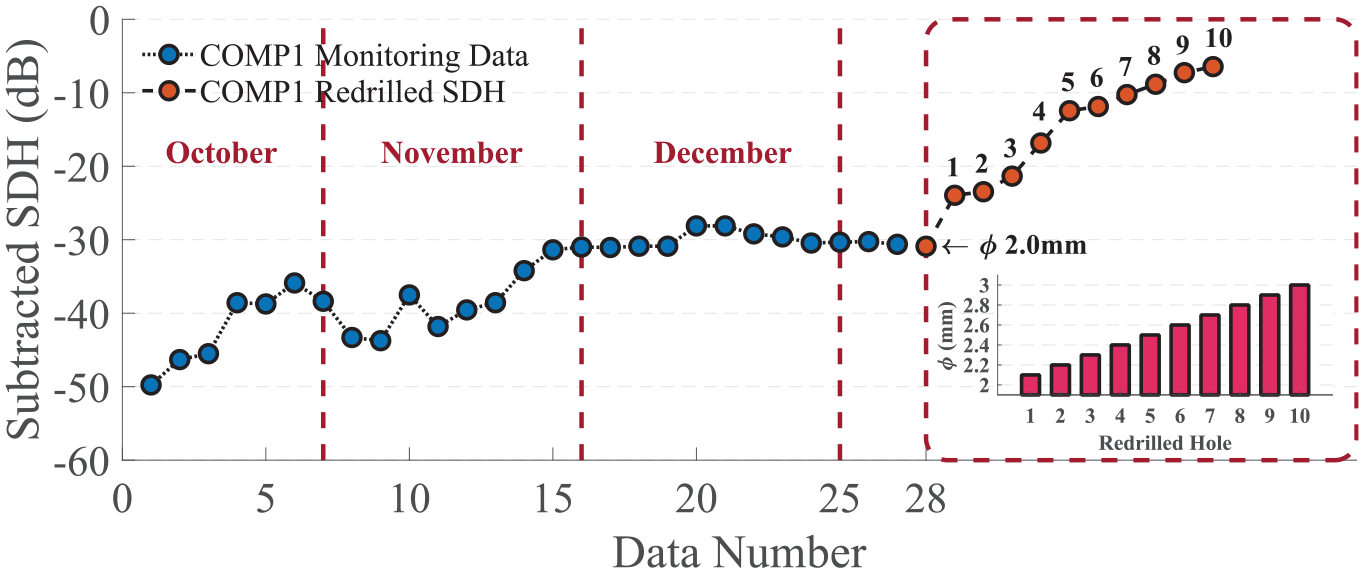
Long-term monitoring of the SDH peak amplitude of the subtracted TFM images. Plotted data measured from 8 October 2021 (data number #1) to 10 January 2022 (data number #27) with the implementation of the COMP1 signal compensation group. On #28, the 2.0 mm in diameter SDH is resized up to 3.0 mm with a 0.1 mm increment in diameter.
We now consider how this detection ability compares to that with the non-subtracted TFM images. Figure 11 shows the peak location tracking plot of the SDH expanding experiment. A small imaging region is selected around the SDH location and a very fine (0.01 mm pixel size) TFM image without subtraction is shown in Figure 11(a). The SDH peak locations from images as the hole is expanded are shown in Figure 11(b) in the x–z coordinate. In Figure 11(b), the effect of a small machining error of the SDH centre can be seen as the x coordinates change from −1.79 to −1.93 mm. The SDH peak location tracking also suggests that a SDH diameter change of 0.2 mm can be directly identified from the original TFM image, which is somewhat lower than that from tracking the amplitude after TFM image subtraction. However, we note that such highly accurate location measurements also require a permanent attachment, that is, a system such as ours, so this location information is complementary to the previously mentioned amplitude-change information. Furthermore, TFM contour plots have also been used for the defect sizing analysis. Cegla et al. 44 demonstrated an installable waveguide array system for SHM using shear horizonal bulk waves. Their experimental results showed good sizing performance on crack-like defects larger than a wavelength in size, using half-skip TFM contour plots thresholded to the 6 dB level. In our work, a SDH defect is made, rather than a crack-like defect. This means the direct TFM can be used instead of the half-skip TFM for the ultrasonic imaging process, as SDH defects present the same reflection coefficient to all beam angles. Contour plots are made and shown in Figure 11(c) and (d) for two different sized holes. −6 and −10 dB contours are extracted from conventional TFM images of the SDH ultrasonic responses. Figure 11(c) is the contour plot of the initial 2.0 mm SDH, and Figure 11(d) is made from the 3.0 mm SDH. Lateral width of the contour plots is extracted for hole sizing. In Figure 11(c), the contour lateral width is 1.28 mm for −6 dB and 1.67 mm for −10 dB. In Figure 11(d), it is 1.36 mm for −6 dB and 1.82 mm for −10 dB. Considering the actual drill diameters in the machining process, it is clear that the contour plot of the TFM image is not accurately measuring the SDH defect size in the sample. Because of the inability to size in this case, our work did not further explore the defect sizing analysis directly based on the original ultrasonic images to evaluate or track the defect changes.
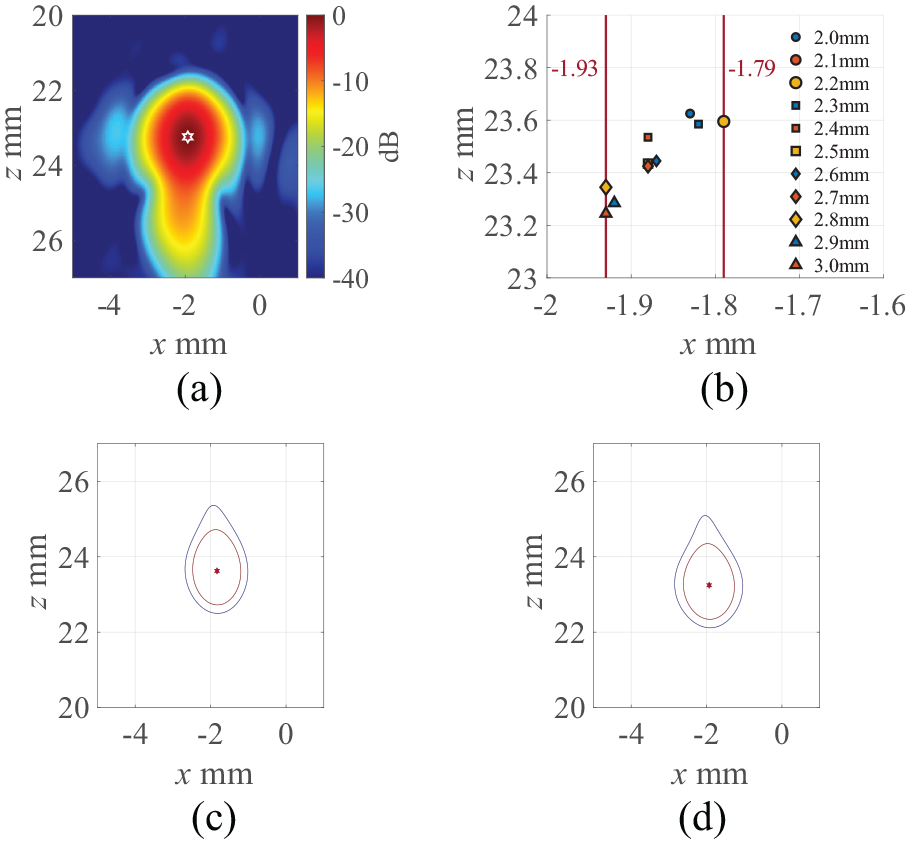
SDH peak location tracking for the SDH expanding experimental data. (a) Is the TFM image of the SDH defect, a small imaging region is chosen for this SDH peak location evaluation as the pixel size is set to 0.01 mm, (b) shows the tracked SDH peak locations from 2.0 mm to 3.0 mm diameter during the hole enlargement process, (c) shows the TFM contour plot when the SDH is 2.0 mm in diameter, respectively at −6 dB (red) and −10 dB (blue), and (d) is the TFM contour plot of the enlarged 3.0 mm hole.
Conclusions
The current design strategy of ultrasonic array and associated controller system for high-resolution NDT applications makes the array expensive in cost and relatively large in profile. This paper presented an ultrasonic array design concept that can miniaturise the design and manufacturing cost of an ultrasonic array system, and further facilitates a permanent installation capability and resulting high-resolution inspection performance with relatively low requirements on the array element quantity. This paper introduced the design concept of a long-term installable ultrasonic array for high-resolution long-term localised monitoring for industrial structures. Ultrasonic data was acquired during a monitoring period of several months and ultrasonic images were generated using the TFM ultrasonic imaging algorithm. By monitoring the experimental ambient temperature, material-related ultrasonic parameters, for instance the temperature dependence of velocity, can be obtained from the long-term monitored data. Signal compensation strategies were then implemented for the long-term monitored dataset to explore the detection possibility for the high-resolution defect change detection leading to an 8 dB improvement. This allows the developed ultrasonic phased array to have a high-resolution continuous monitoring capability for industrial structures in NDT applications. A 0.1 mm change in diameter was detected for a SDH defect from the long-term monitored FMC dataset, performed overs 3 months. The advantage of the developed ultrasonic array is its simple and low-cost manufacturing, which enables permanent installation. The final performance of such a system is excellent, leading to high-resolution sensitivity to small defect changes, even though the acquired ultrasonic data are limited in quality compared to current commercial arrays. Furthermore, the developed array has the flexibility to be installed on uneven surfaces. All these features enable the developed ultrasonic phased array to be applicable to meet various industrial requirements for long-term continuous monitoring purposes. However, there are also limitations for the current work, such as image quality variation with defect location and variable coupling condition effects resulting from the installation process on the array imaging performance. These effects on the proposed low-cost ultrasonic array will be evaluated in the future work.
Footnotes
Acknowledgements
Thanks to Dr. Duncan Casey (MaynoothWorks, Ireland) and Prof. Annela Seddon (University of Bristol) for helpful discussions.
Declaration of conflicting interests
The author(s) declared no potential conflicts of interest with respect to the research, authorship, and/or publication of this article.
Funding
The author(s) disclosed receipt of the following financial support for the research, authorship, and/or publication of this article: This work was funded by the EPSRC(EP/L016648/1) via a Bristol Centre for Functional Nanomaterials (BCFN) PhD studentship.