
Abstract
Soil scour near a bridge pier foundation is one of the leading causes of bridge failures. Traditional vibration-based scour monitoring methods are nearly incapable of quantifying scour levels using a single acceleration response without knowledge of excitation information. In this paper, a new output-only scour level prediction method is introduced via the integration of an unscented Kalman filter (UKF), random decrement (RD), and newly derived continuous Euler–Bernoulli beam addressing river water, traffic loads, and the linear and nonlinear behavior of sediments around the pier as external effects. We conducted extensive simulation studies and applied the method to an existing medium-span bridge with a steel girder and concrete deck in service in the province of Manitoba, Canada. These studies show that our proposed method can accurately estimate scour levels using only one accelerometer, which was validated with an independent bathymetric survey of the soil level at the pier foundation. Furthermore, three different linear and nonlinear soil profiles representing the soil behavior around the pier were also investigated as case studies in the scour level estimation process. The results confirm that a cubic function exhibits the best performance in quantifying the scour level around bridge piers.
Keywords
Introduction
Scour is one of the leading causes of bridge failures, which happen suddenly without any warning. 1 Until 2010, around 80% of 614,387 bridges in the US were built over water streams, and all of these bridges experienced floods frequently during their life spans. 2,3 Failure analysis of 1000 bridges in the US determined that foundation scour was the first cause of failure for about 60% of bridges. 3 Therefore, developing a scour monitoring system is critical to preventing catastrophic bridge failures in transportation systems. The failures of the Bonnybrook Bridge in Calgary in 2013 and the I-10 bridge in southern California in 2015 are two recent notable cases of bridge failure in North America attributed to scour around their piers and abutments.
Many approaches have been proposed to detect scours or quantify the severity of scours around the foundations of bridge piers and abutments. These approaches can be categorized into two groups. The first group focuses on directly measuring scour depth using instruments installed in critical places under the water. The most straightforward technology uses buried switches, which detect the scour when it reaches the buried sensors. 4 Different types of buried sensors, called float-out devices, are available. These devices are buried under the riverbed upstream and send a signal as soon as they are unburied and tilted in a predefined orientation. However, there is no way to approve their operations. 5,6 Another type of sensor is a magnetic sliding collar sensor, which takes advantage of a manual or automated gravity-based physical probe resting on the streambed and moves downward as scour develops. A sufficiently large gravity rod should be selected to avoid its penetration into the streambed in static state. A remote sensing element is used to send the signal of a change in the depth of the gravity sensor as an indicator of scour. 7
However, these sensors are only for one-time use, and the sensor installation process is challenging. Other research has used electromagnetic signals to track changes in physical properties in areas where soil and water interact. 8 With this technique, replacing the sensor in cases of damage or dysfunctionality is almost impossible. Placing a gravity rod protected by tubes beside the bridge pier is another approach. The rod moves down when the soil level goes down because of scour. 9 However, the protection of these tubes during the flood season is a massive challenge given the processes involved in their reinstallation and calibration. 9 Some other techniques, such as the use of fiber sensors, 10 piezo sensors, 11,12 and electrical conductivity devices, 13 are also used for scour monitoring.
Electromagnetic sensors are another type of probe that has been installed around bridge piers and piles to track changes in the dielectric permittivity of the surrounding bridge foundation. 14 These wireless probes send information about the scour depth and hole refill in a real-time manner. 15 Still, the installation of these probes, their protection during the flood season, and the calibration of sensor response after flood seasons are significant challenges associated with these sensors. Recently, a technology called BridgeCat 16 has been used in the UK; it puts a sonar scanner, a high-resolution camera, and a digital altimeter on a hydraulic arm. The whole system is installed on a vehicle, and the riverbed height is measured using these sensors. This technique is costly and requires closing the bridge, causing traffic issues. 17 In general, direct approaches are expensive, and most of them are for one-time use only. Measurement-related uncertainty given the nature of sensors installed underwater, is also a major challenge for these kinds of methods. 18 Therefore, structural vibration-based methods have been developed to overcome the disadvantages of direct methods. 19
The second group of approaches use changes in dynamic modal properties (e.g., natural frequencies and mode shapes) caused by scour in piers and foundations by analyzing vibration measurements. 20,21 The stiffness of a bridge pier depends on the mechanical properties of its structural components and their boundary conditions. Scour phenomena change the boundary condition of a bridge pier by reducing the height of the soil that supports the pier and pier foundation—consequently, the stiffness of the pier changes, which also changes the natural frequencies and mode shapes. Many researchers have reported that the natural frequencies of bridges are reduced because of increased scour depth. 22,23 Therefore, to facilitate the use of changes in natural frequencies and mode shapes caused by scour, researchers have developed a bridge–soil interaction model using the finite element method (FEM). 24 The core concept of this method is to compare the natural frequencies calculated from actual measurements with those calculated from the developed tuned models. As the comparison index, a frequency response function with the Winkler model considering the mass of soil surrounding the pier was used, and modal updating using an iterative method was conducted. 25 The limitation of this method is that it requires a specific vehicle FEM model in the developed bridge–soil interaction model; therefore, its application is limited to problems subjected to a specific vehicle vibration only.
Xiong et al. 26 used a flexibility matrix based on FEM to predict the scour level in a bridge pier. The flexibility matrix is a combination of natural frequencies and their mode shapes. Some experimental studies have been conducted to investigate the effects of scour on the change in mode shapes. 27 Choudhury et al. 28 developed a FEM model and updated it with the actual natural frequencies of the pier; they then used the updated model to estimate scour depth with empirical equations and a modal updating process. To apply these methods to real structures, the mode shapes are required, but extracting accurate mode shapes from measured vibrations is very challenging; it also requires the installation of many sensors. Furthermore, these methods require precise modal updating, and which mode shapes and natural frequencies should be used is unclear; extensive simulations and case studies are thus required to determine sensitive modal properties.
Palanisamy and Sim 29 used an extended Kalman filter (EKF) to estimate the change in foundation stiffness caused by scour. They assumed white noise as an input excitation for the bridge pier, which is not applicable to a full-scale bridge system that is usually subjected to different ambient, periodic, and impact excitations. These excitations are not easily measurable, so the development of an output-only scour quantification method is a must. Another issue is that the EKF works based on first-order Taylor series linearization, and its performance decreases by increasing the order of nonlinearity in the system. 30,31 Therefore, the method cannot be used for highly nonlinear soil-structure interaction functions. Furthermore, Palanisamy and Sim developed a simple pier model, but this model cannot be generalized for different types of bridge piers.
The literature above shows that traditional approaches can detect whether a scour has occurred using natural frequencies or can localize the scour by comparing the mode shapes of bridge systems. Some of these approaches require specific excitations, such as impact or cyclic loadings, or specific loading, such as a specific vehicle type, while most can quantify the level of scour to some degree using ambient vibration data.
This study aims to develop a comprehensive mathematical model aims at introducing an output-only model-based scour quantification method considering various types of boundary conditions, and soil profiles around the pier of a bridge system. The output-only Kalman filtering-based scour quantification approach is proposed using a continuous Euler–Bernoulli beam model of a bridge pier that considers various types of predefined soil–bridge interaction functions.
The advantages of the proposed method are as follows. First, it does not require many sensors; rather, only a single accelerometer is attached to the top of the pier close to the girder. Second, the proposed method does not require information on excitation sources in that it can consider any type of excitation sources, such as ambient vibration, impact, or vehicle-induced vibration. Third, the method can quantify the scour level of the bridge pier. Finally, the different boundary conditions of bridge piers and different soil properties can be considered.
This paper is organized as follows. In Proposed method, the continuous governing equation of motion of a bridge pier is developed based on Euler–Bernoulli beam theory. This model is used for the state-space formulation of Kalman filtering; then, we introduce the unscented Kalman filter (UKF). 31 The original UKF needs corresponding measured excitation information for estimation, but it is not viable for measuring bridge excitations. 32 Therefore, the random decrement (RD) technique 33,34 is introduced as a data-driven approach that extracts the free vibration of a bridge pier, which is used as an input of the UKF to predict the scour level. 35 In Case studies, two illustrative systems are selected to demonstrate the efficacy of the proposed method. At first, simulation studies are done to show the capability of the proposed method. As a full-scale experiment, the proposed method is validated with vibration data measured from an in-service bridge pier located in the province of Manitoba, Canada. A survey rod and an acoustic Doppler profiler (ADP) system are used to measure the soil level around the pier of interest and verify the estimated results of the proposed method.
Proposed method
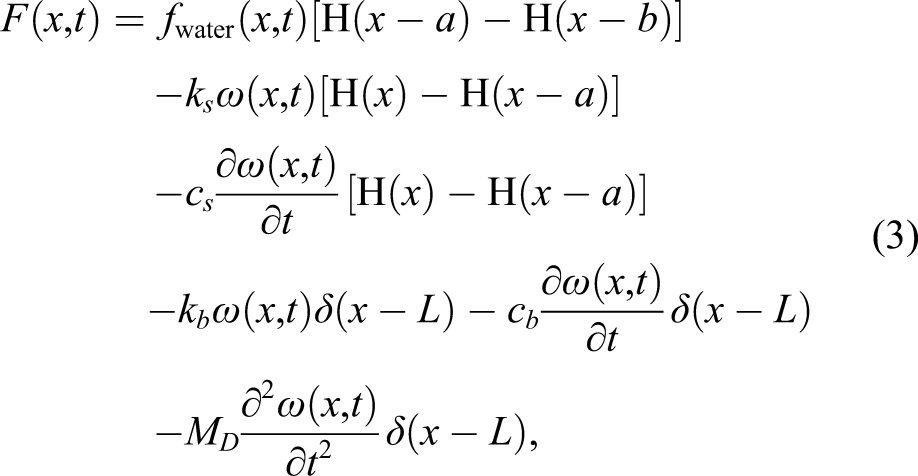
To predict the scour level, a physics model-based scour estimation method is proposed. This method is composed of the RD method and the UKF. The role of RD is to extract free vibration responses from the ambient acceleration vibrations measured by the accelerometer installed on a bridge pier. The extracted free vibration response is fed into the UKF to estimate the soil level, an indicator of the scour level. The UKF estimates the variables of the state-space equation defined with a continuous Euler–Bernoulli pier model. Therefore, the proposed scour monitoring method is an output-only approach because it does not use any bridge excitation information (Figure 1). The proposed method’s details, including the RD, UKF, and newly developed continuous Euler–Bernoulli pier model methods, are described in the next sections. Overall procedure of the proposed method.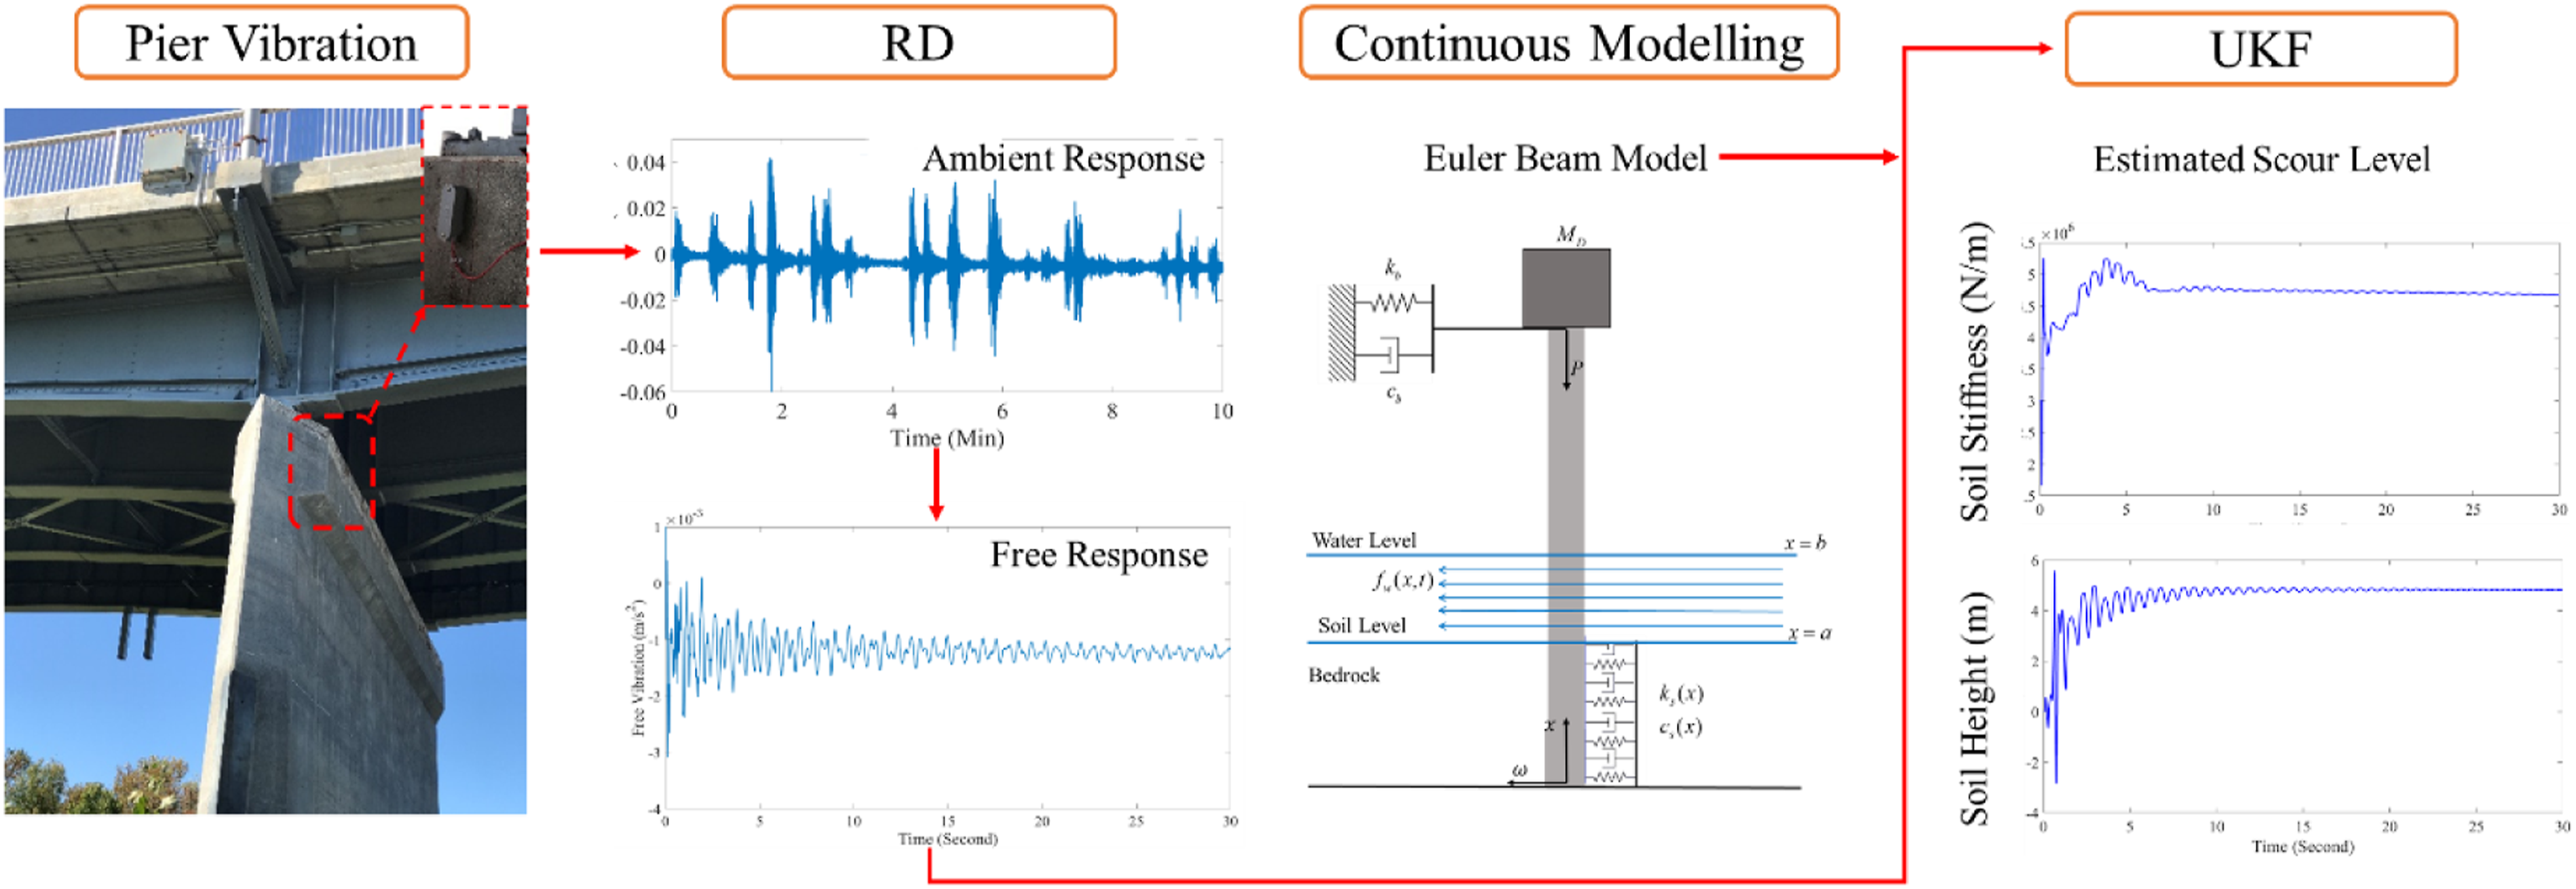
Random decrement method
RD is a data-driven algorithm for extracting the free vibration response of a dynamic system from its measured response and subjected to random or ambient vibrations. The technique averages out to a finite number ( Schematic view of the RD method.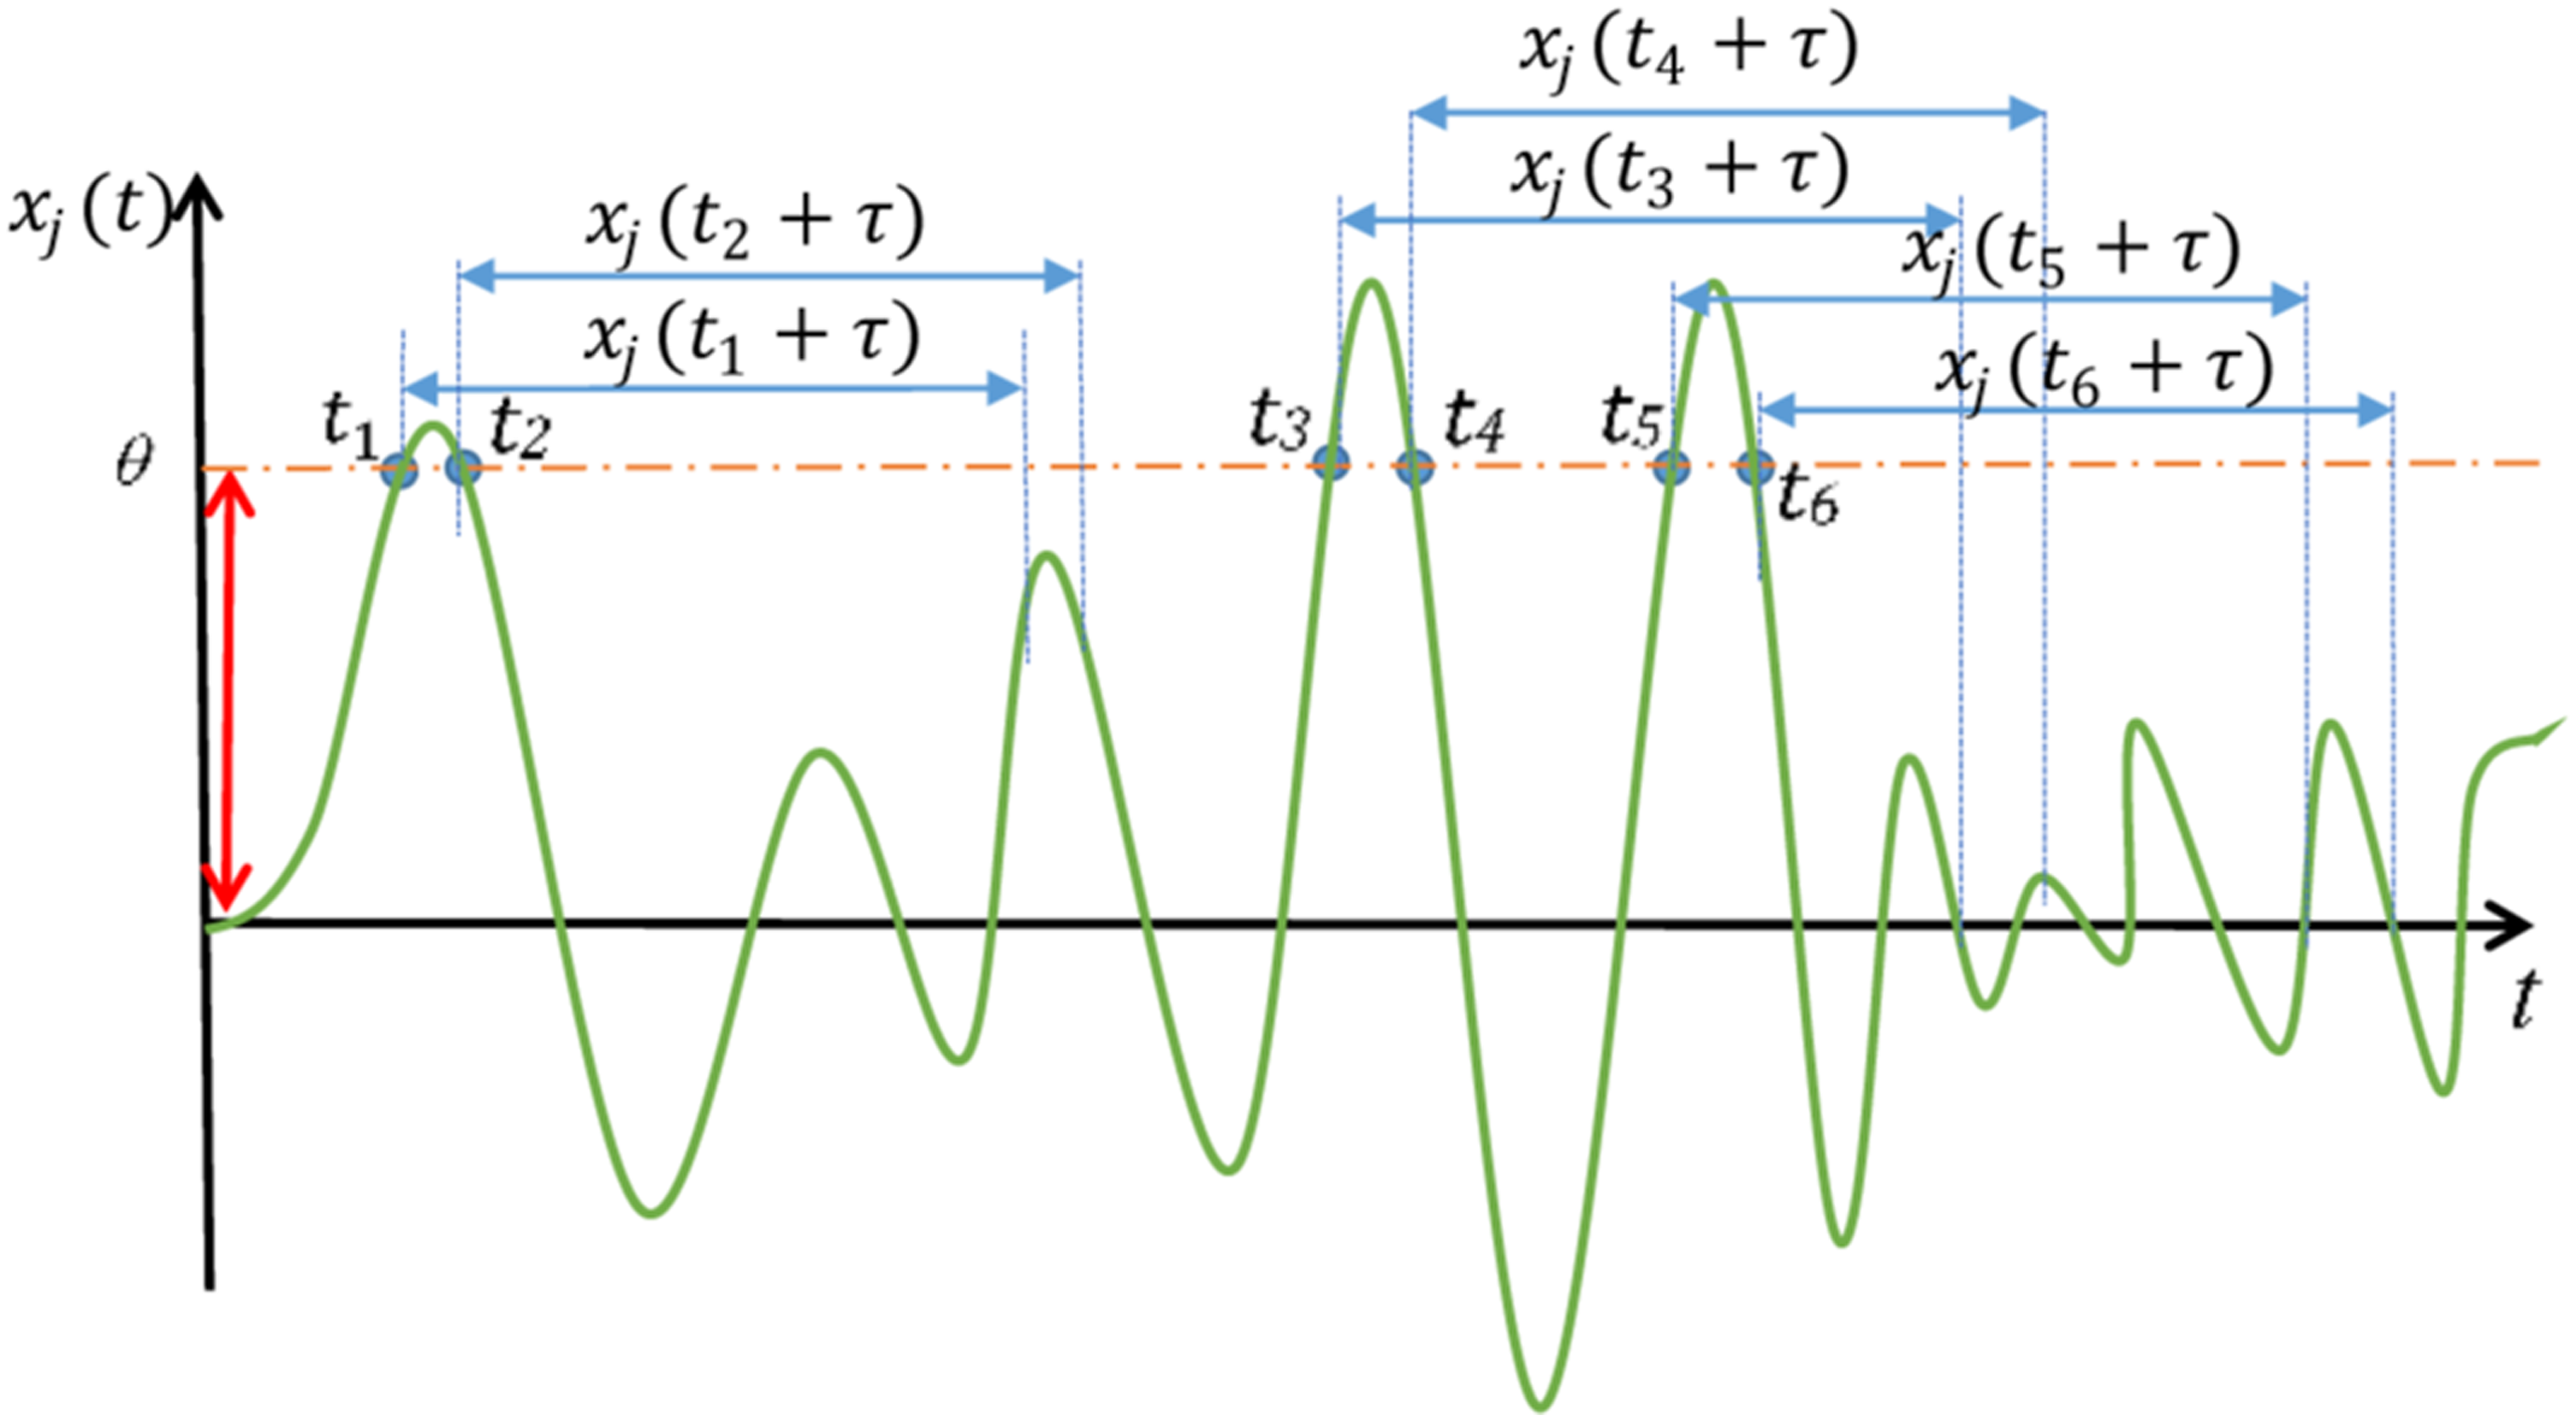
Eulerian beam model for a bridge pier
In this paper, the UKF uses the extracted free vibration, Schematic view of Euler–Bernoulli beam model of a bridge pier with rocker bearings.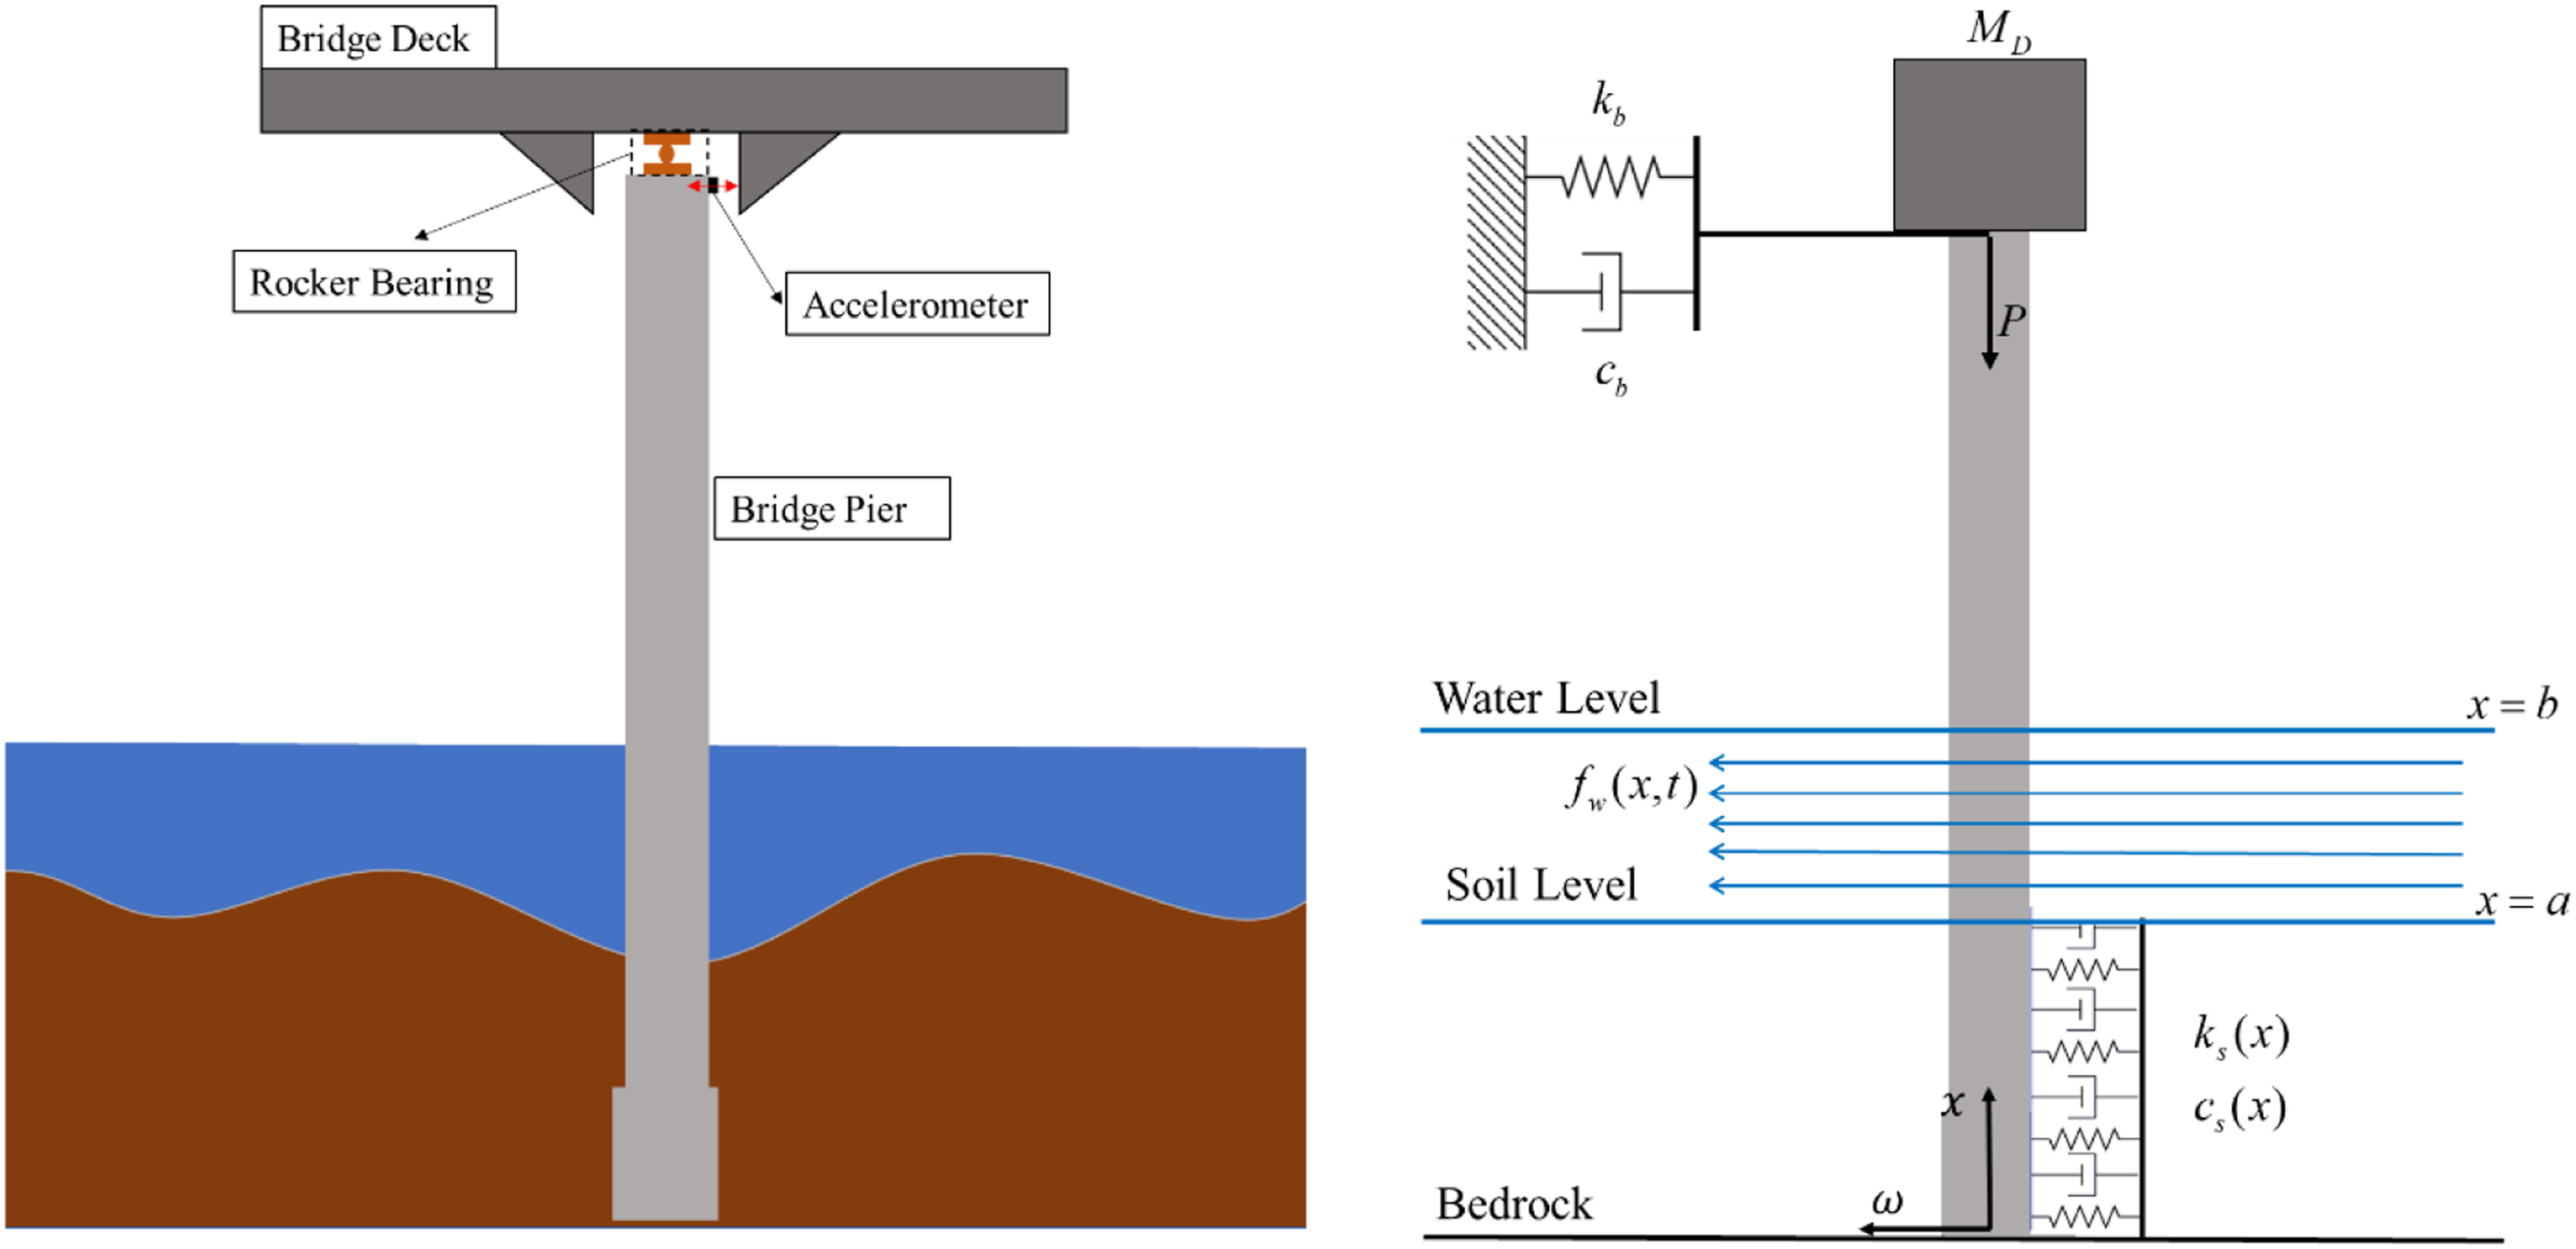
The bridge pier experiences lateral and vertical forces because of the crossing vehicles and the river water beating the pier. The bridge deck is supported in the center of the cross-sectional area of the pier, limiting the lateral displacement (i.e., the maximum allowed lateral displacement during the year in this rocker beaning is approximately 8 cm) on the top of the bridge pier; therefore, assuming the Euler–Bernoulli beam model for the bridge pier and neglecting the shear deformations are reasonable. This very general and well-established modeling approach has been adopted in numerous published journal articles in the analysis area.
36-38
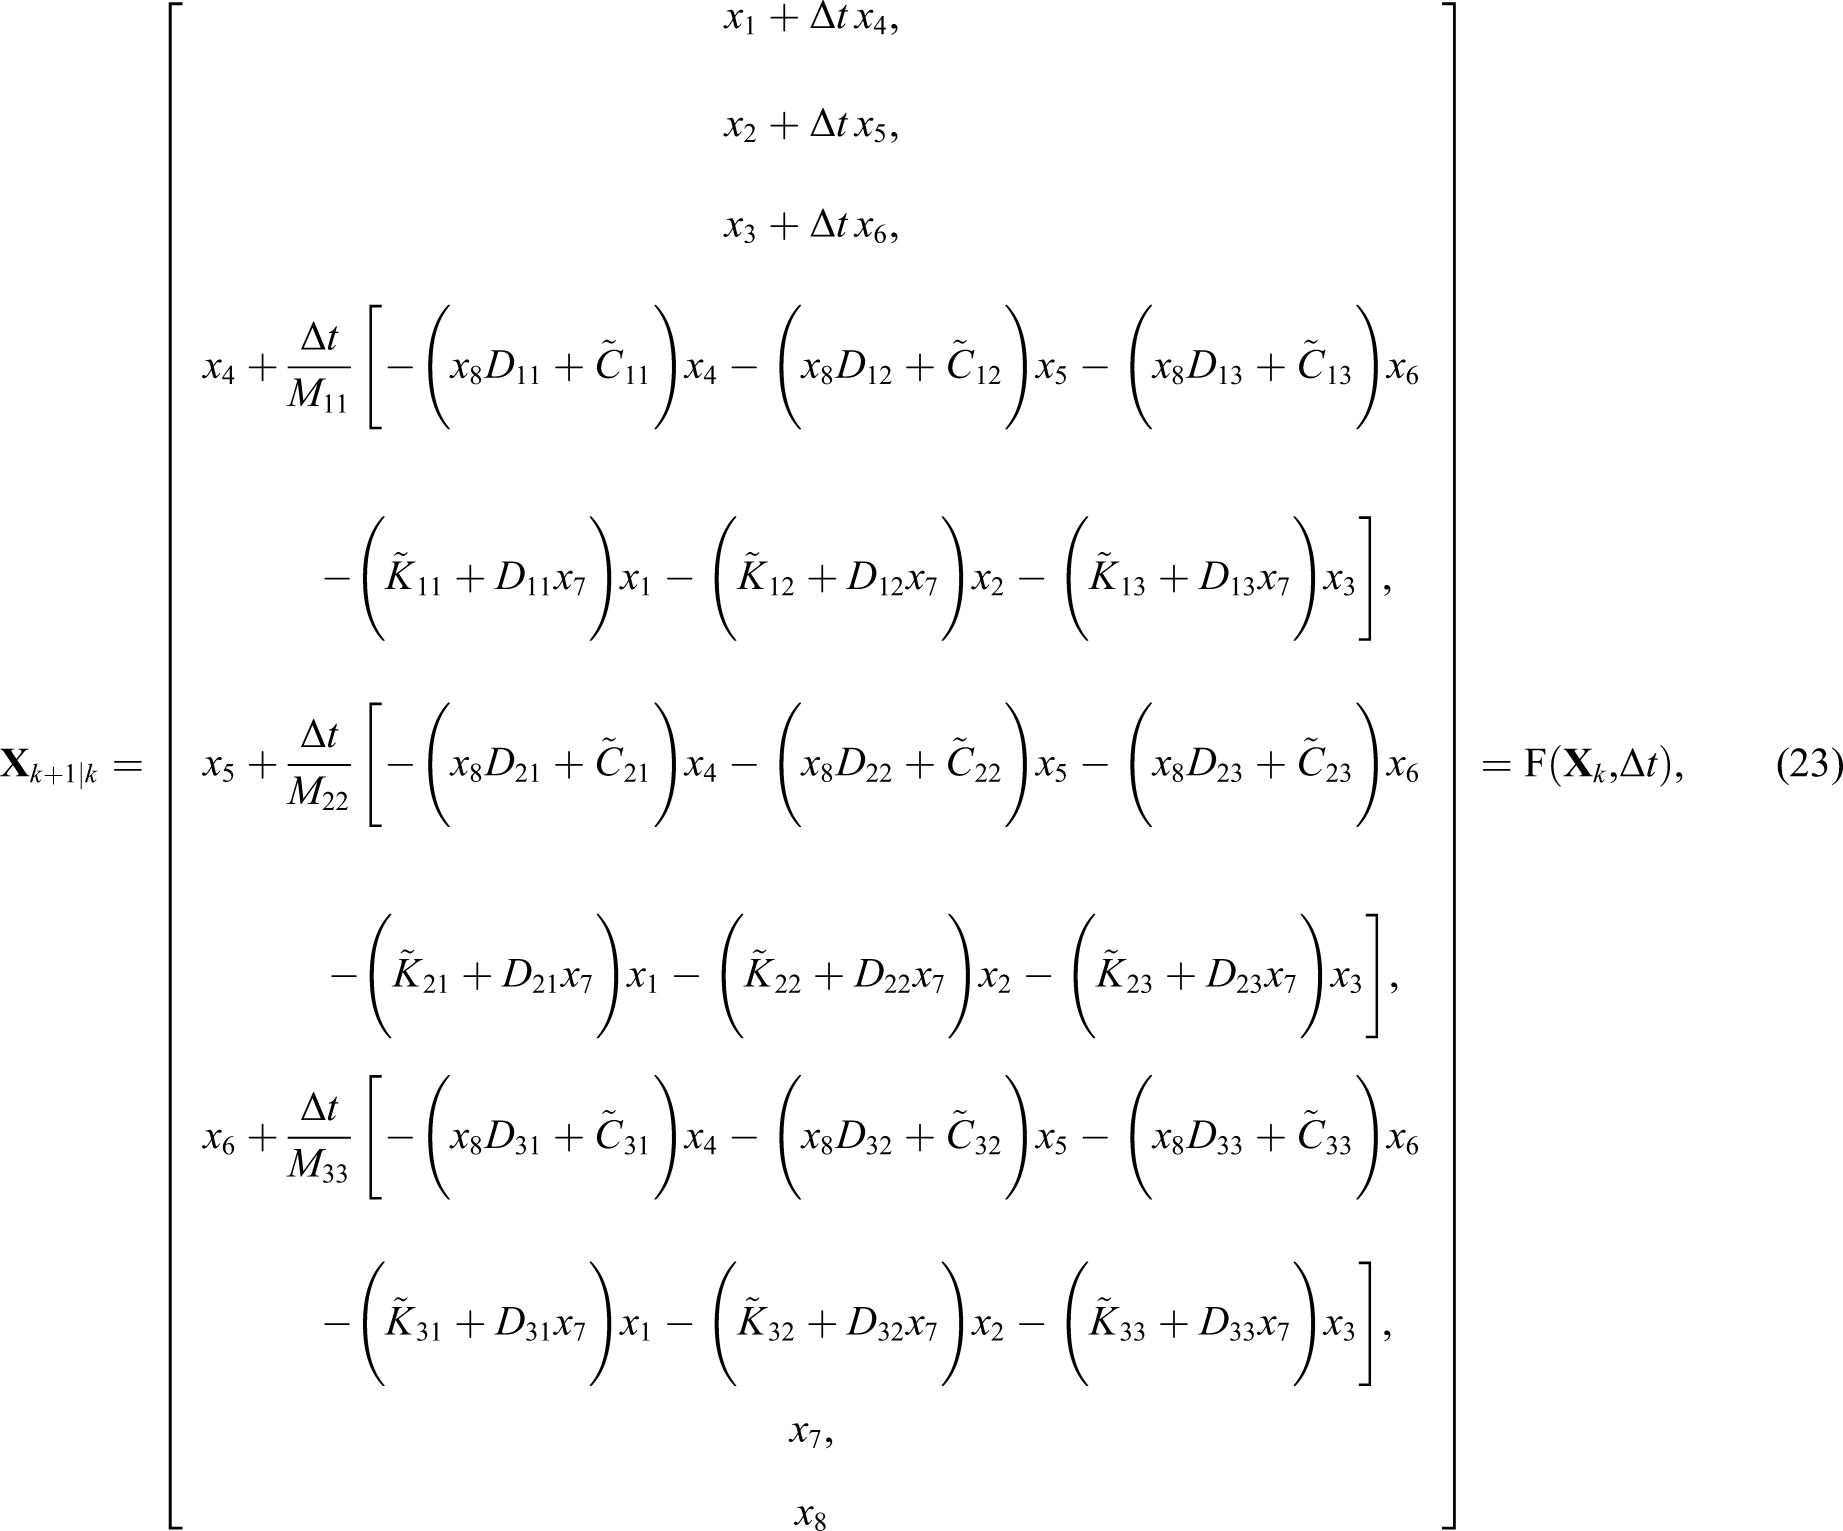
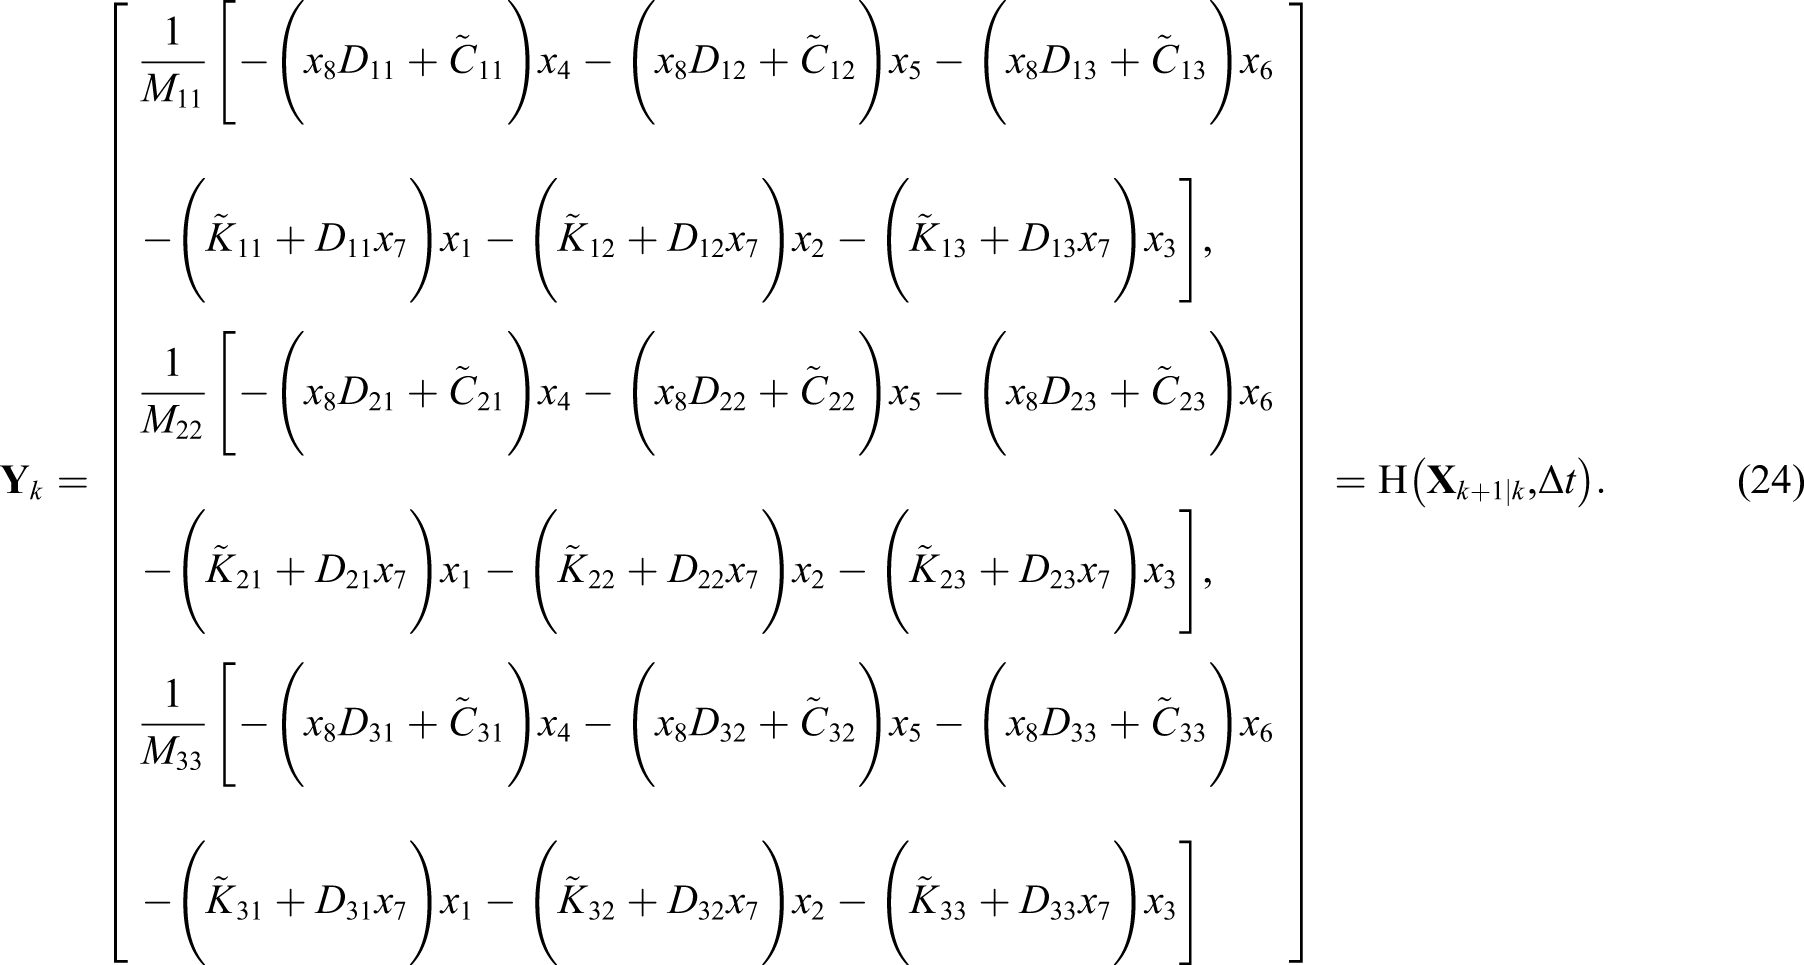
Considering an Euler–Bernoulli beam with a modulus of elasticity E, moment inertia I, cross-section area and density of the bridge pier
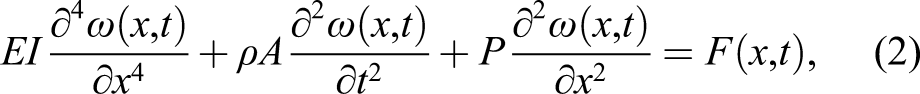
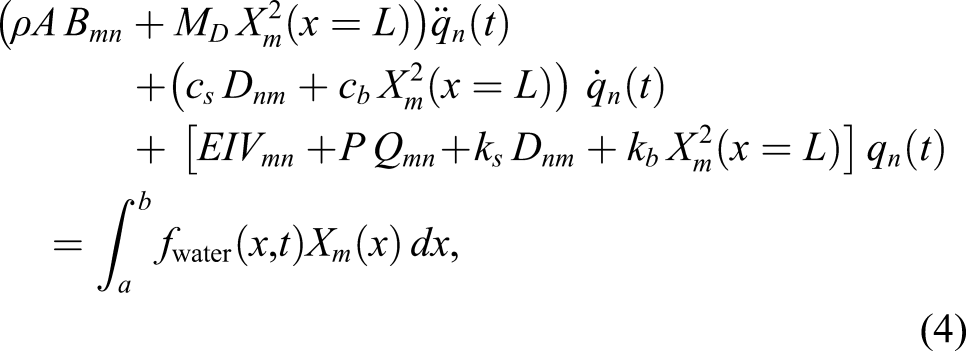
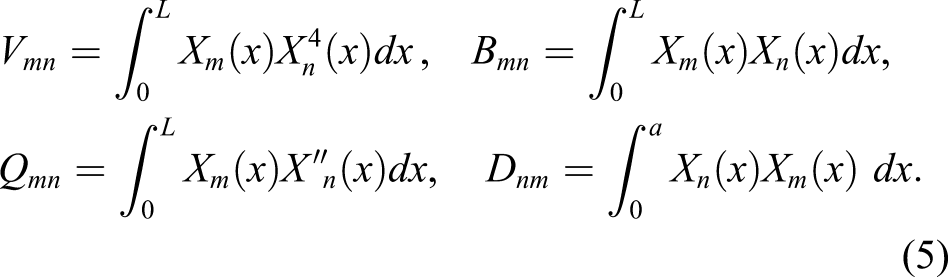
Based on the assumed mode approach,
39

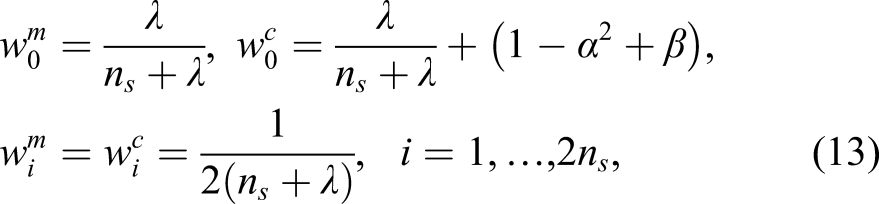
Kalman filtering
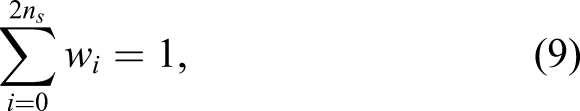
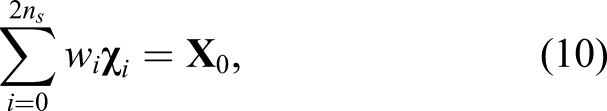
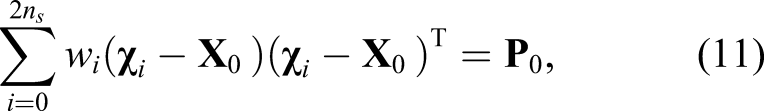
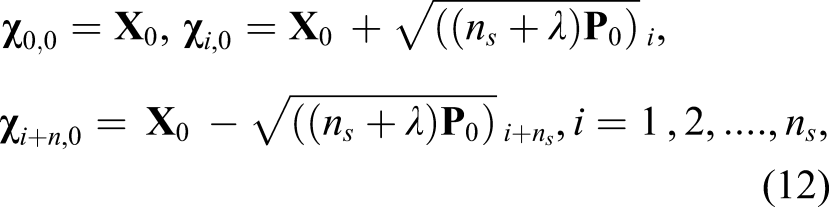
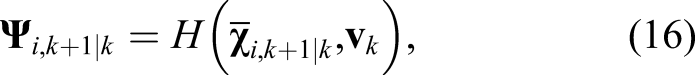
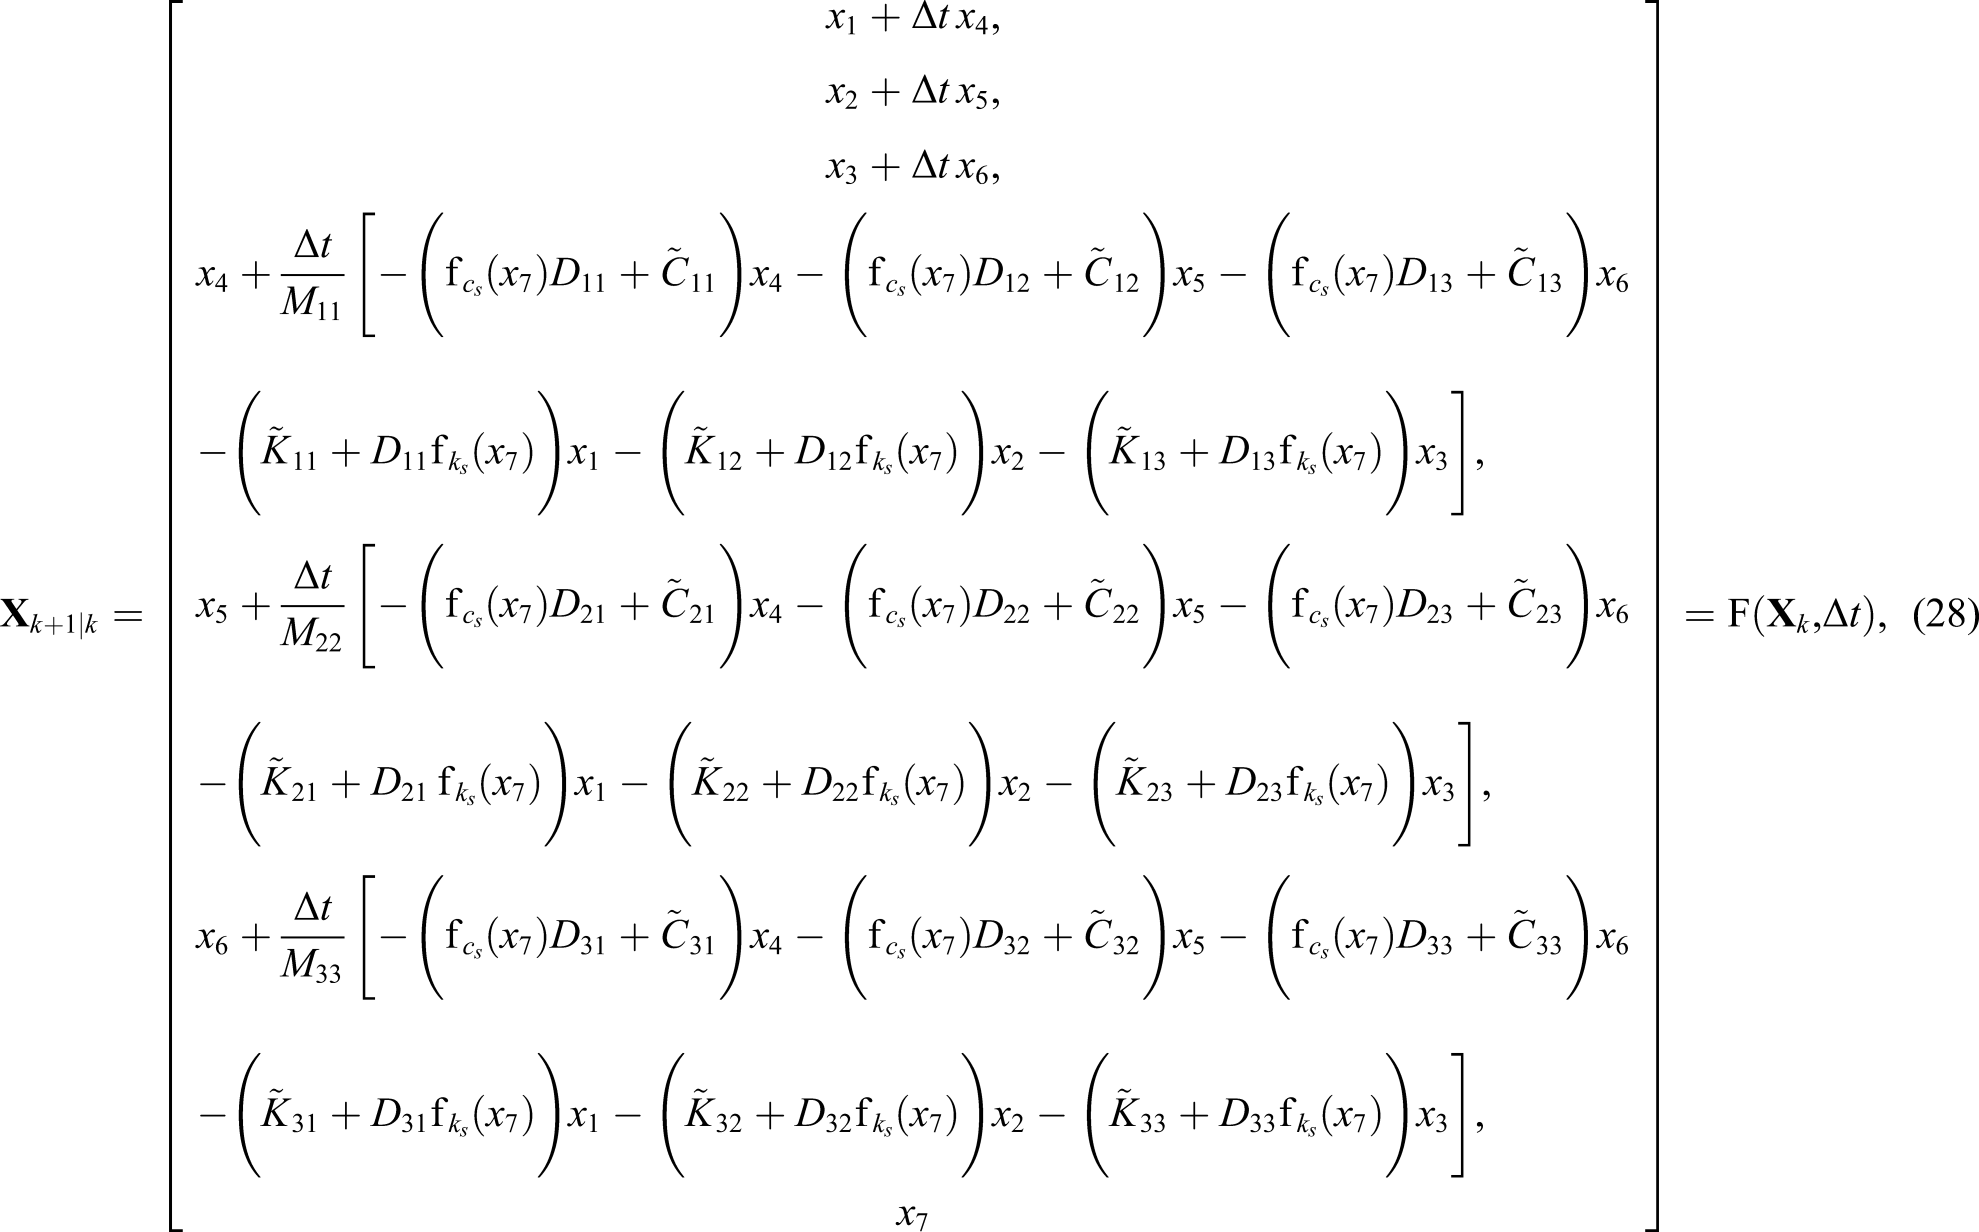
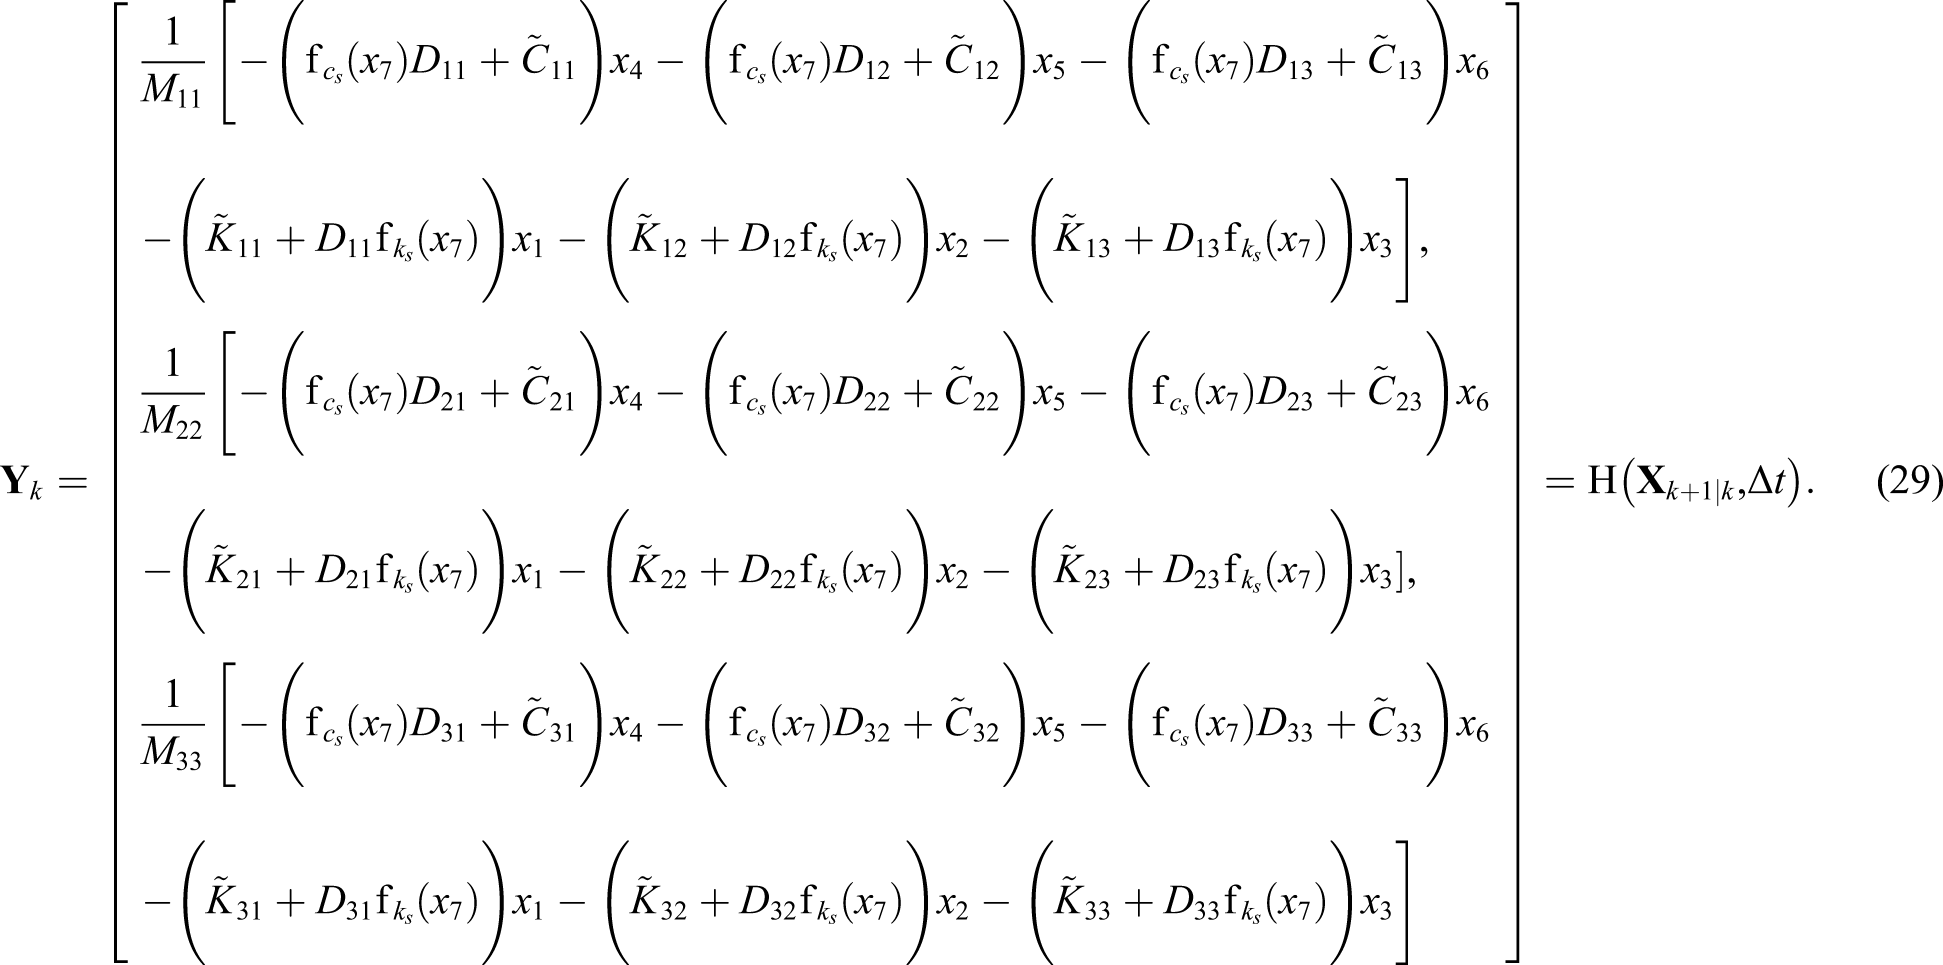
Kalman filtering 41,42 is a type of Bayesian recursive filter assuming a Gaussian distribution for measured data and a least square loss function in a Bayesian inference framework. A linear Kalman filter works for a limited number of states showing linear behavior. An EKF 43 is defined to compensate for the linear Kalman filter’s incapability for nonlinear systems identification. The EKF works based on the first-order linearization of the Taylor series, but it still does not estimate an actual value for systems with a high level of nonlinearity. Besides, for the first-order Taylor series, the derivative of the transition and measurement function needs to be calculated, which is hardly viable in some cases. 30 The UKF is a derivative-free filter developed to address the drawbacks of the EKF. The UKF tries to approximate the distribution of the states of the dynamic equation of motion (equation (6)) using carefully chosen sigma points instead of approximating nonlinear functions. There have been some applications and improvements of the UKF because of damage identification problems in structural systems. 44-46 In this paper, we use the UKF for scour detection and quantification around a bridge pier. We need to convert equation (6) into a state-space form considering the desired states for estimation purposes.
The transition and measurement functions of a dynamic system in a general form of the state-space model in the discrete domain are defined as follows


To begin the UKF algorithm, we take advantage of some predefined points, sigma points, to approximate the desired parameter distributions of each iteration. Let us assume
For each time step

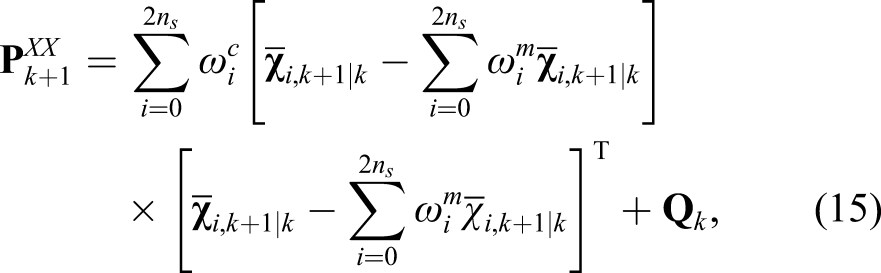
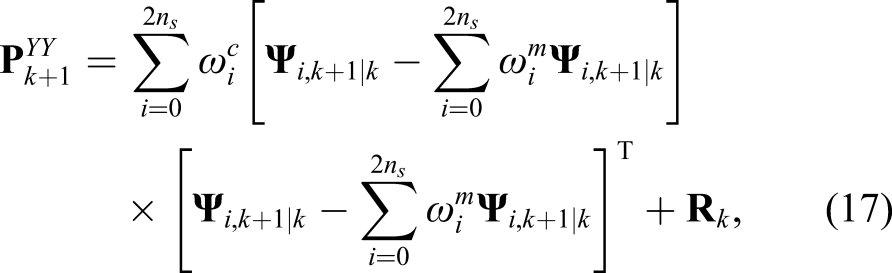


In the Kalman filtering approach, we need to define a process error for the system, compensating for the mathematical model’s uncertainty and other assumptions involved in the estimation process. For this specific problem, measuring the external excitations of the bridge pier is almost impossible. To deal with this issue, we introduced the RD, which extracts the free vibration response of the vibrating system. This means that the reference measured data aimed for in the UKF would be independent of the excitation—whatever it is. 34 As the RD eliminates the variables related to the input excitations in the transition and measurement functions, and the performance of the UKF decreases with the increasing size of the state vector, the combination of the RD and UKF improves the estimation accuracy of the UKF for large state vectors. Moreover, the uncertainty related to the input estimation does not affect the unknown state estimation, which reduces the total uncertainty in the estimation process. The robustness of the RD-UKF combination has been demonstrated using extensive numerical and experimental studies. 34,35 The error associated with the free vibration extraction process will compensate for the white noise parameter (v k ) in the measurement function. Eventually, the UKF estimates the system parameters (e.g., stiffness and damping) more accurately.
Case studies
In the previous sections, the Euler–Bernoulli beam theory was employed to determine the general dynamic equation of a bridge pier. This model could be adapted for various types of bridge piers with different boundary conditions and external excitations, water levels, and soil heights around the pier. This section simulated a bridge pier vibration using MATLAB 47 software and used the output vibration response for scour quantification. We also implemented our proposed approach on a real bridge pier located in Morris, Manitoba (Canada). Details on each of these studies are presented in the following subsections.
Numerical simulations
The mathematical model of a virtual bridge pier, equation (6), was used for simulation studies via MATLAB software. We considered a concrete pier with a rectangular cross-sectional area,
The first three vibrational mode functions of the Euler–Bernoulli beam are considered for analysis. We apply a combination of a triangle impulse force with a 0.5 s duration, a random vibration with an amplitude of 0.01 g, and an El-Centro earthquake time history (dividing the total signal amplitude by 10) as ambient vibration, all of which are external excitations applied to the bridge; see Figure 4(a). The total vibration response of the model, with the excitation introduced in Figure 4(a), is shown in Figure 4(b). (a) Excitation applied to the simulating structure; (b) Total acceleration vibration response of the structure.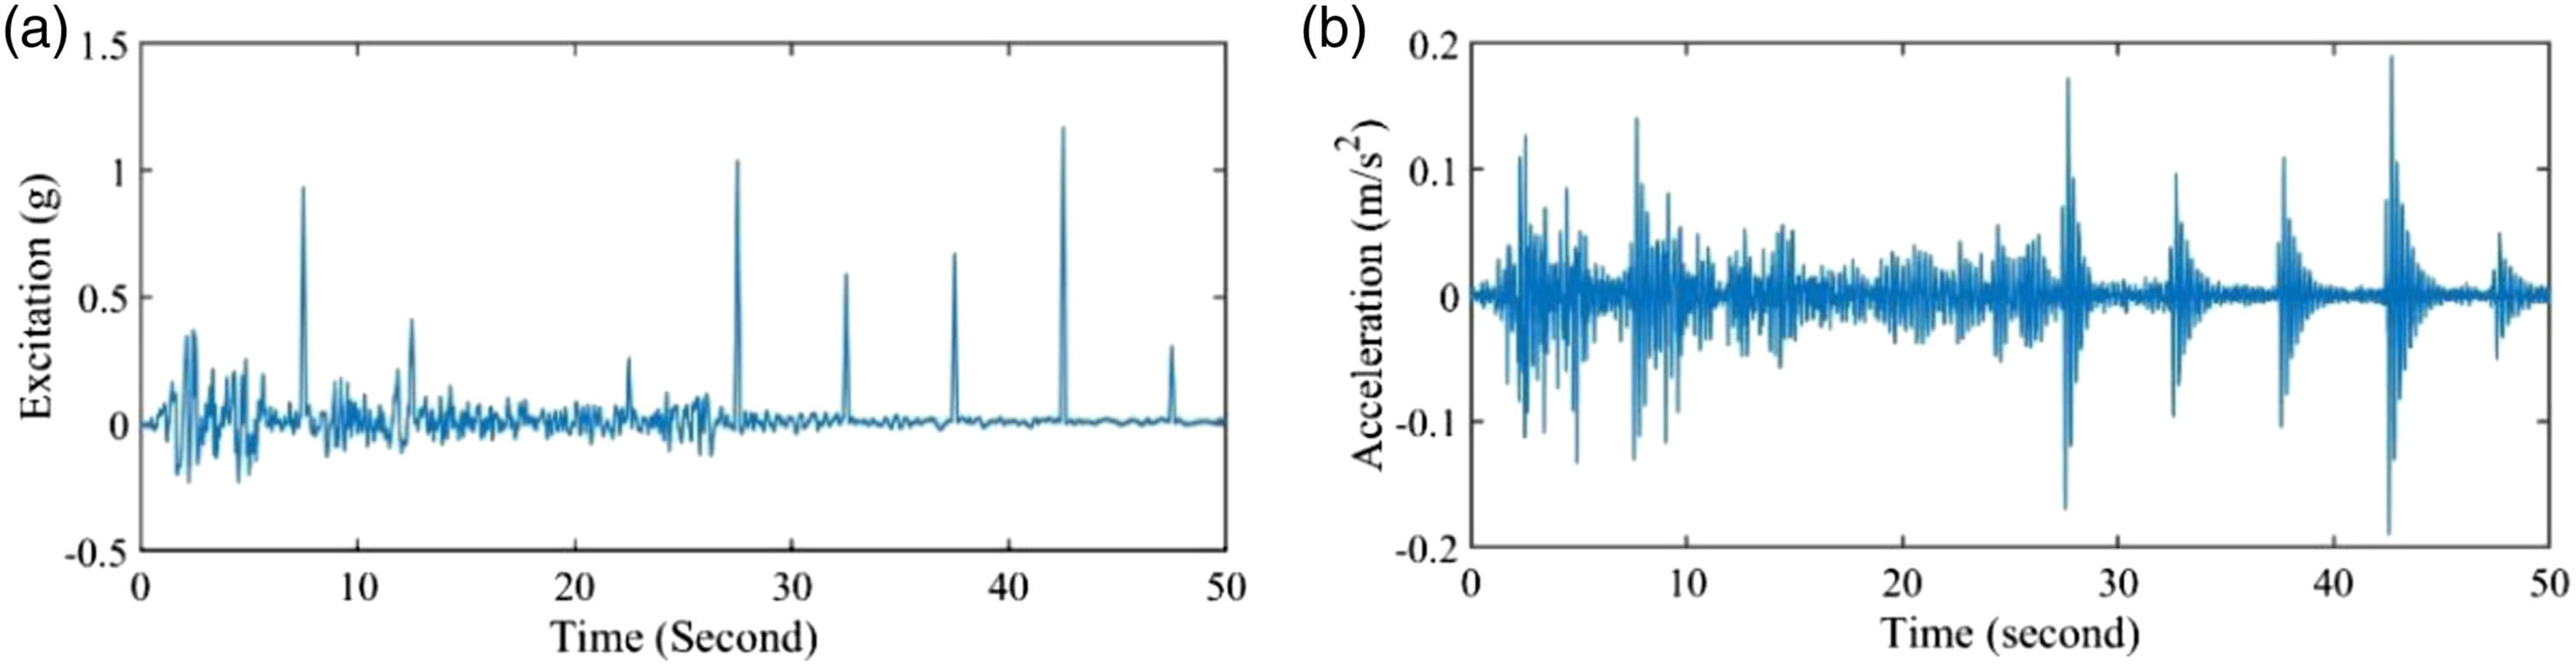
We assume a fixed-free boundary condition for the Euler−Bernoulli beam with its corresponding mode shape function that is
We define the desired states and transfer equation (6) to the state-space form. We chose to predict the soil parameters as desired states to eventually predict soil stiffness and height; this is more convenient for quantifying the scour level. It is assumed that no damage exists in the bridge pier, itself. The desired state vector consists of (a) Free vibration response of the system; (b) FFT of the free vibration response.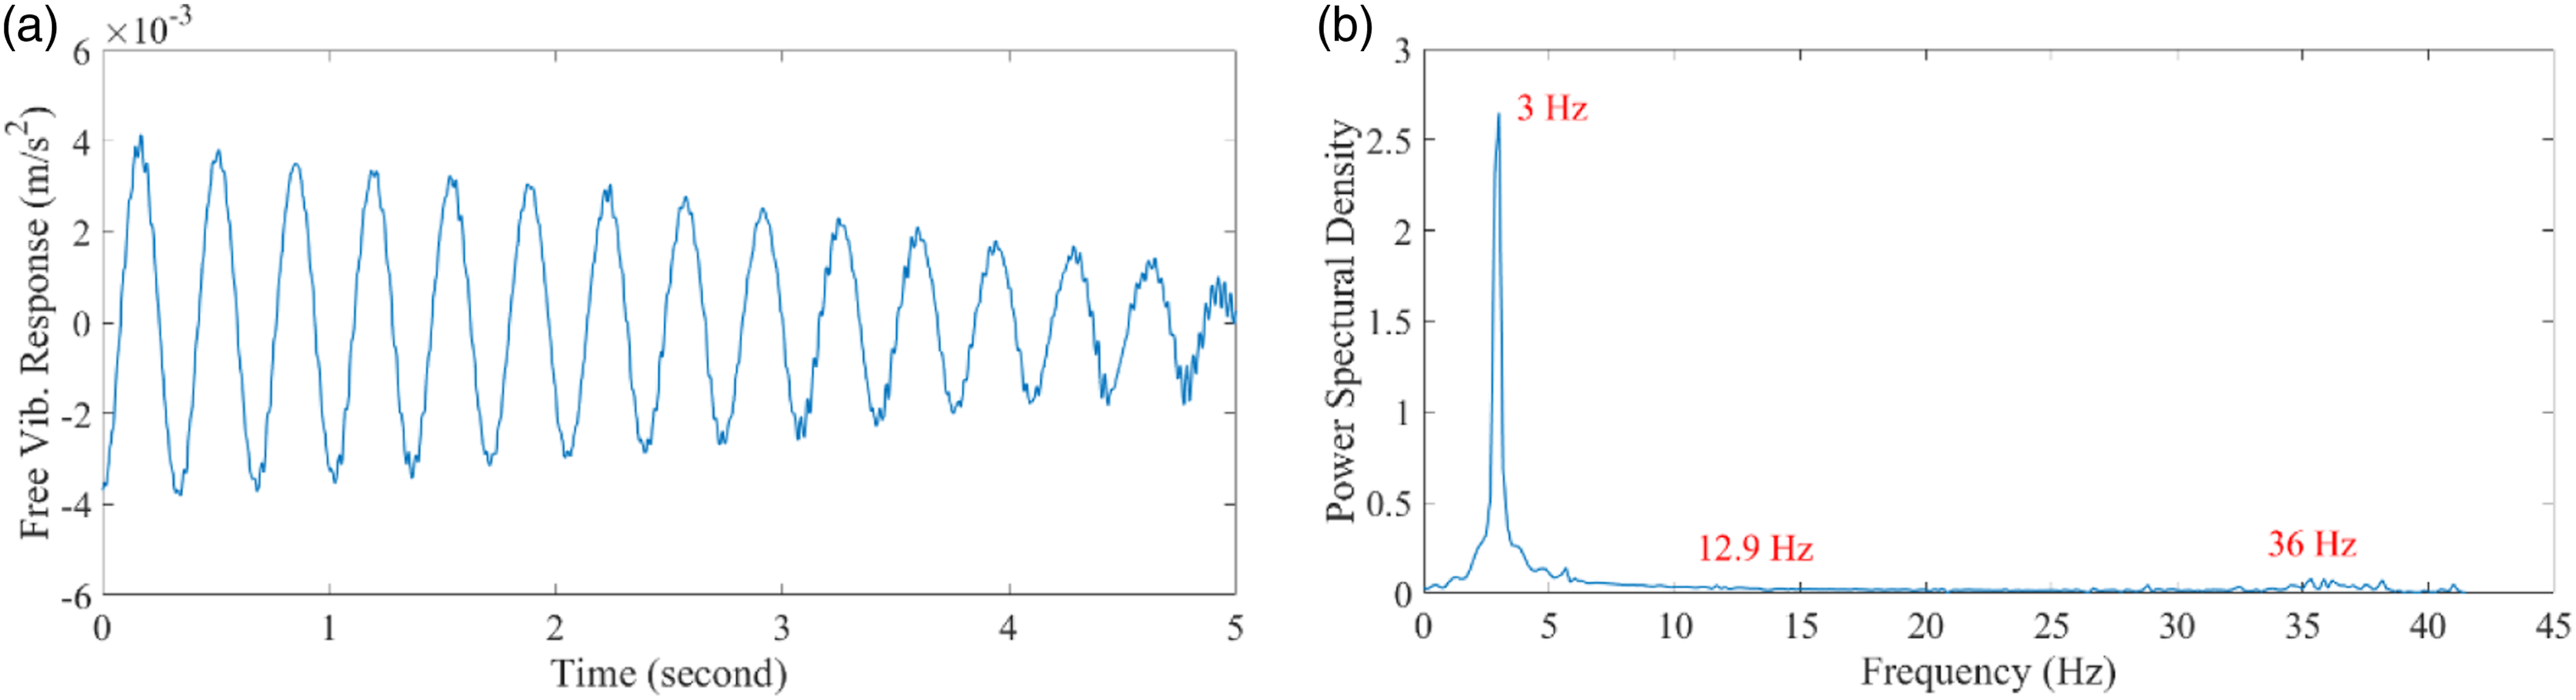
The free vibration response reduces the uncertainty of the mathematic model due to unknown excitations. Considering equation (6) and desired state vector equation (22), the free vibration response, the discrete domain state-space transition, and measurement functions of the model are expressed as (a) Estimated stiffness; (b) Damping value of the soil.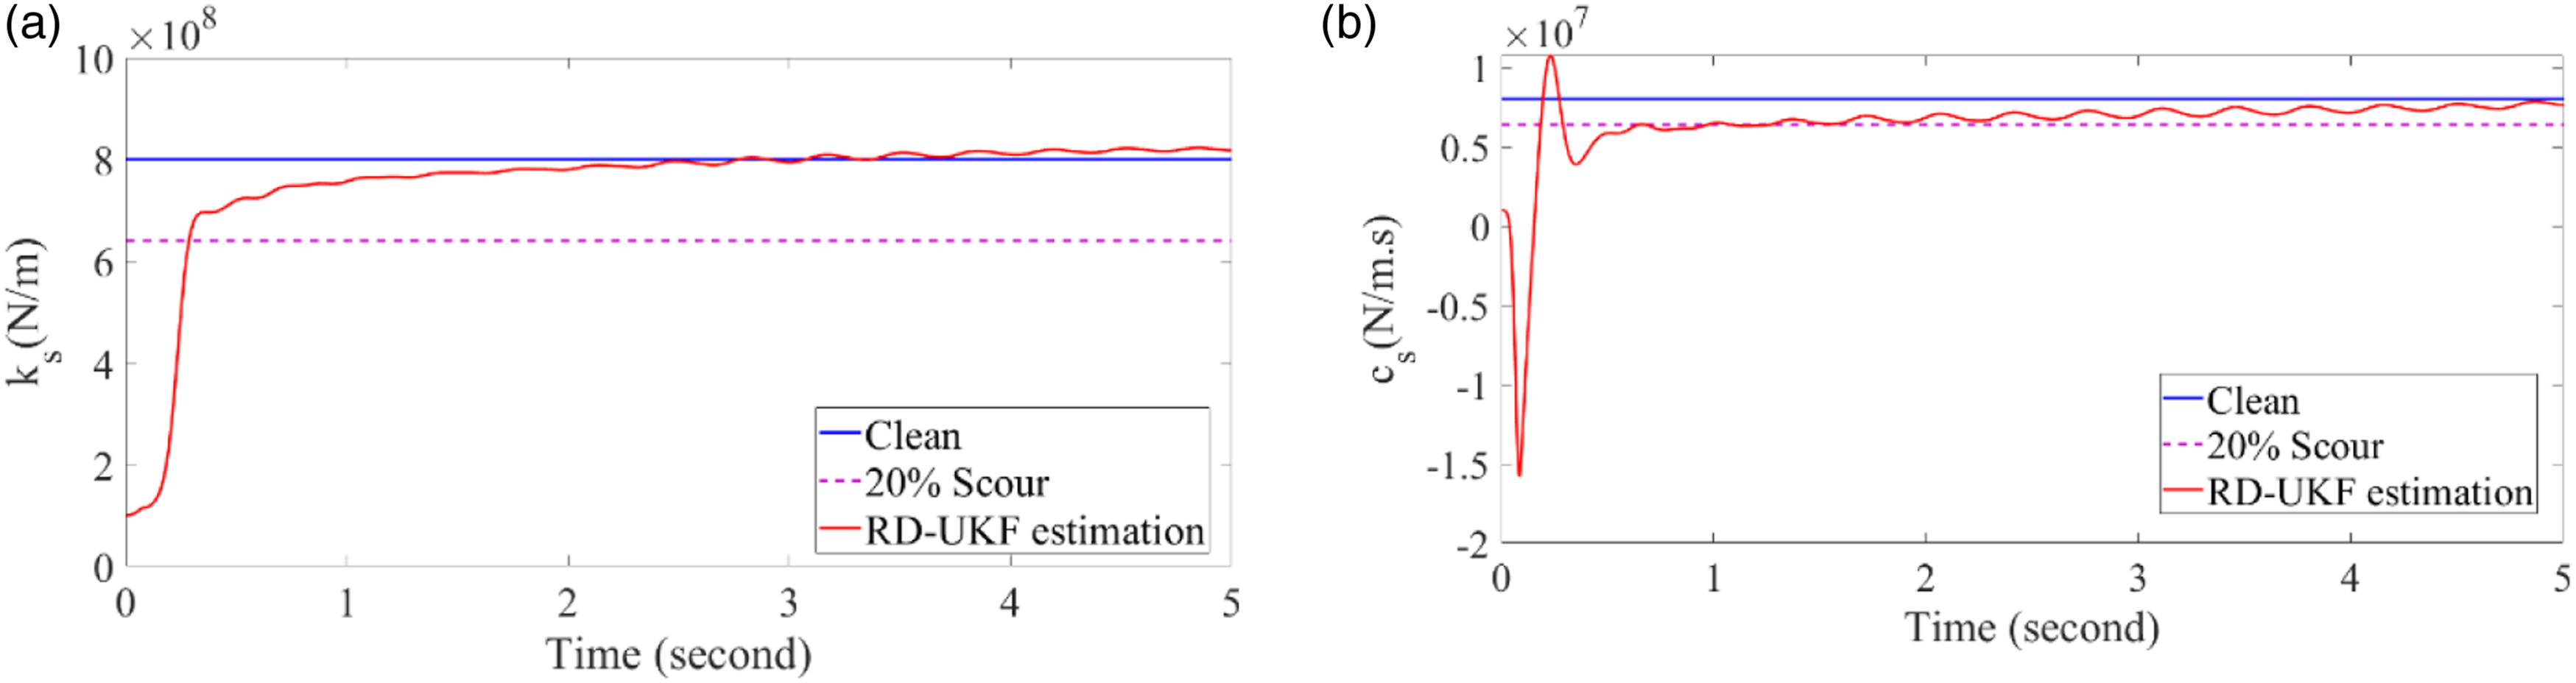
The initial displacement Estimated stiffness (a) and damping (b) values of the soil with the constant profile affected by scour.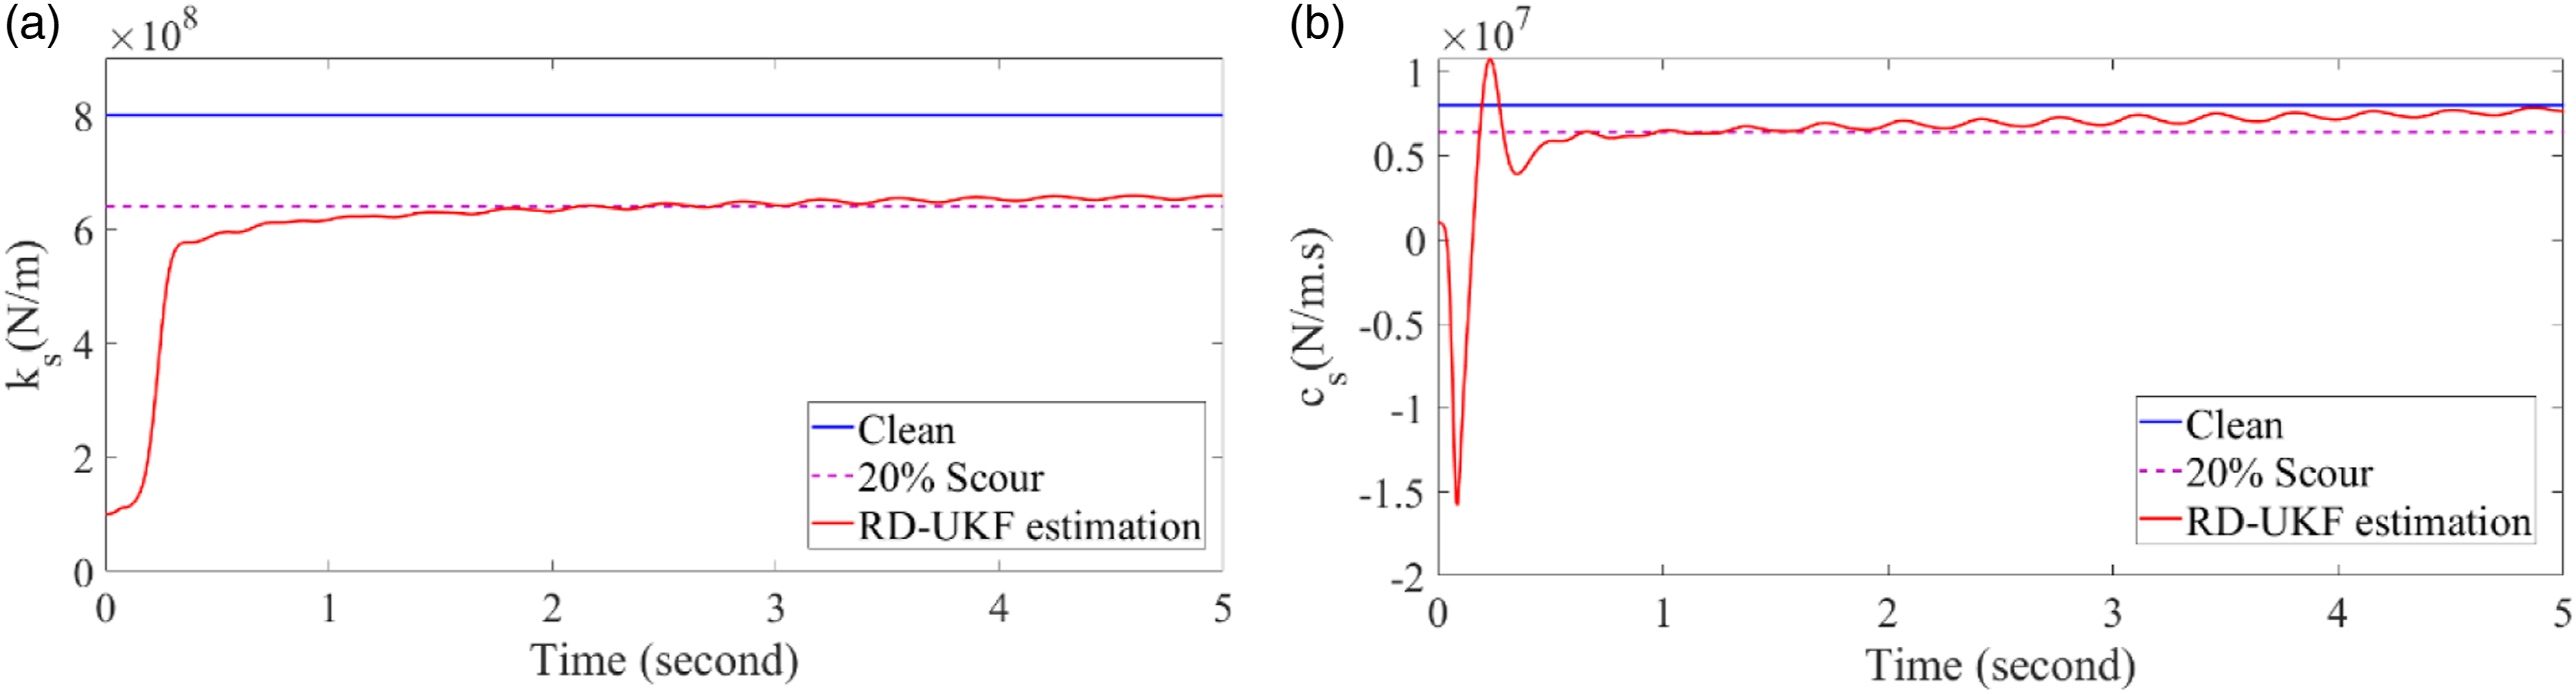
Estimation of the soil stiffness and damping values using the introduced method.
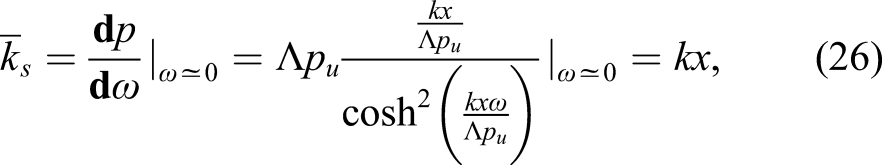
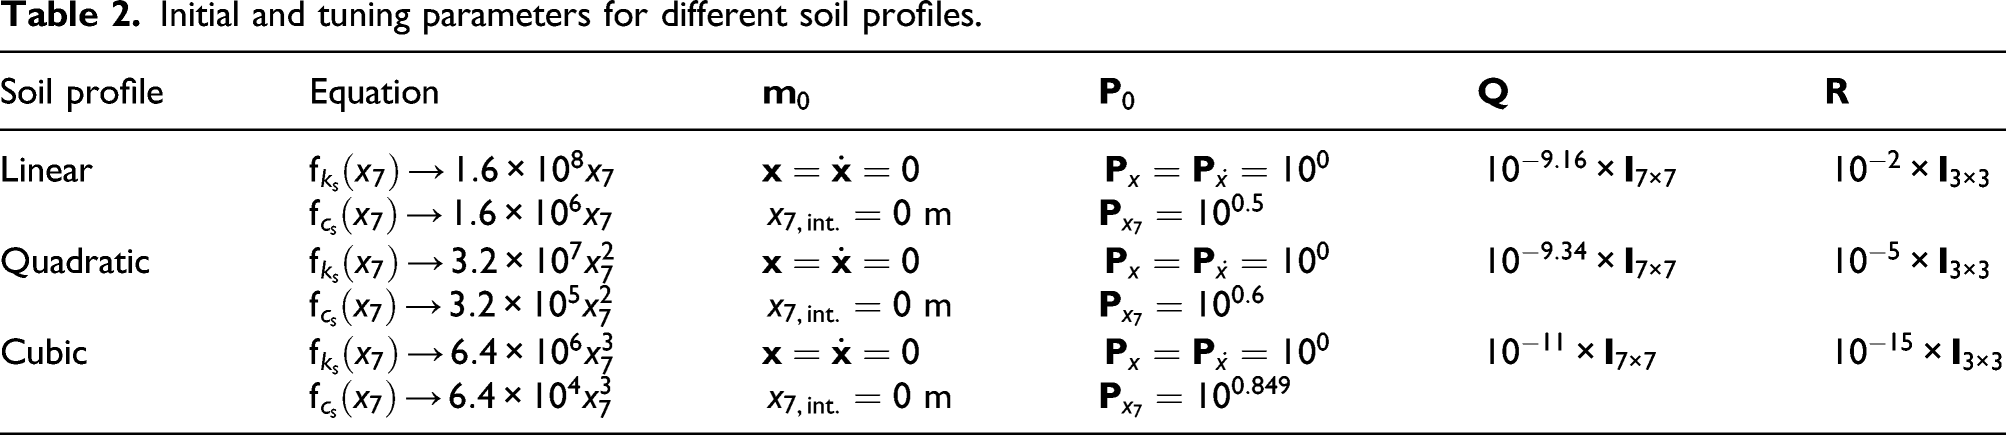
We estimated the soil stiffness around the pier accurately; however, to estimate the soil height around the pier, we had to define the soil profile as a function of the soil height. The soil reaction equation, equation (25), represents the lateral soil response around the pier (soil reaction, 
The initial values and details of the state estimation process are mentioned in Table 2 for the three profiles for the sake of reproducibility for future users. As we will estimate the soil height using different profiles, 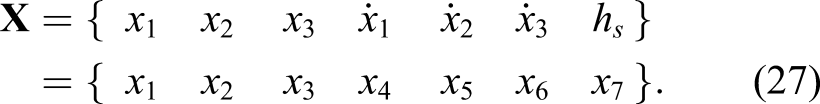
Initial and tuning parameters for different soil profiles.
The estimated soil height is shown in Figure 8(a). Results of soil height estimations.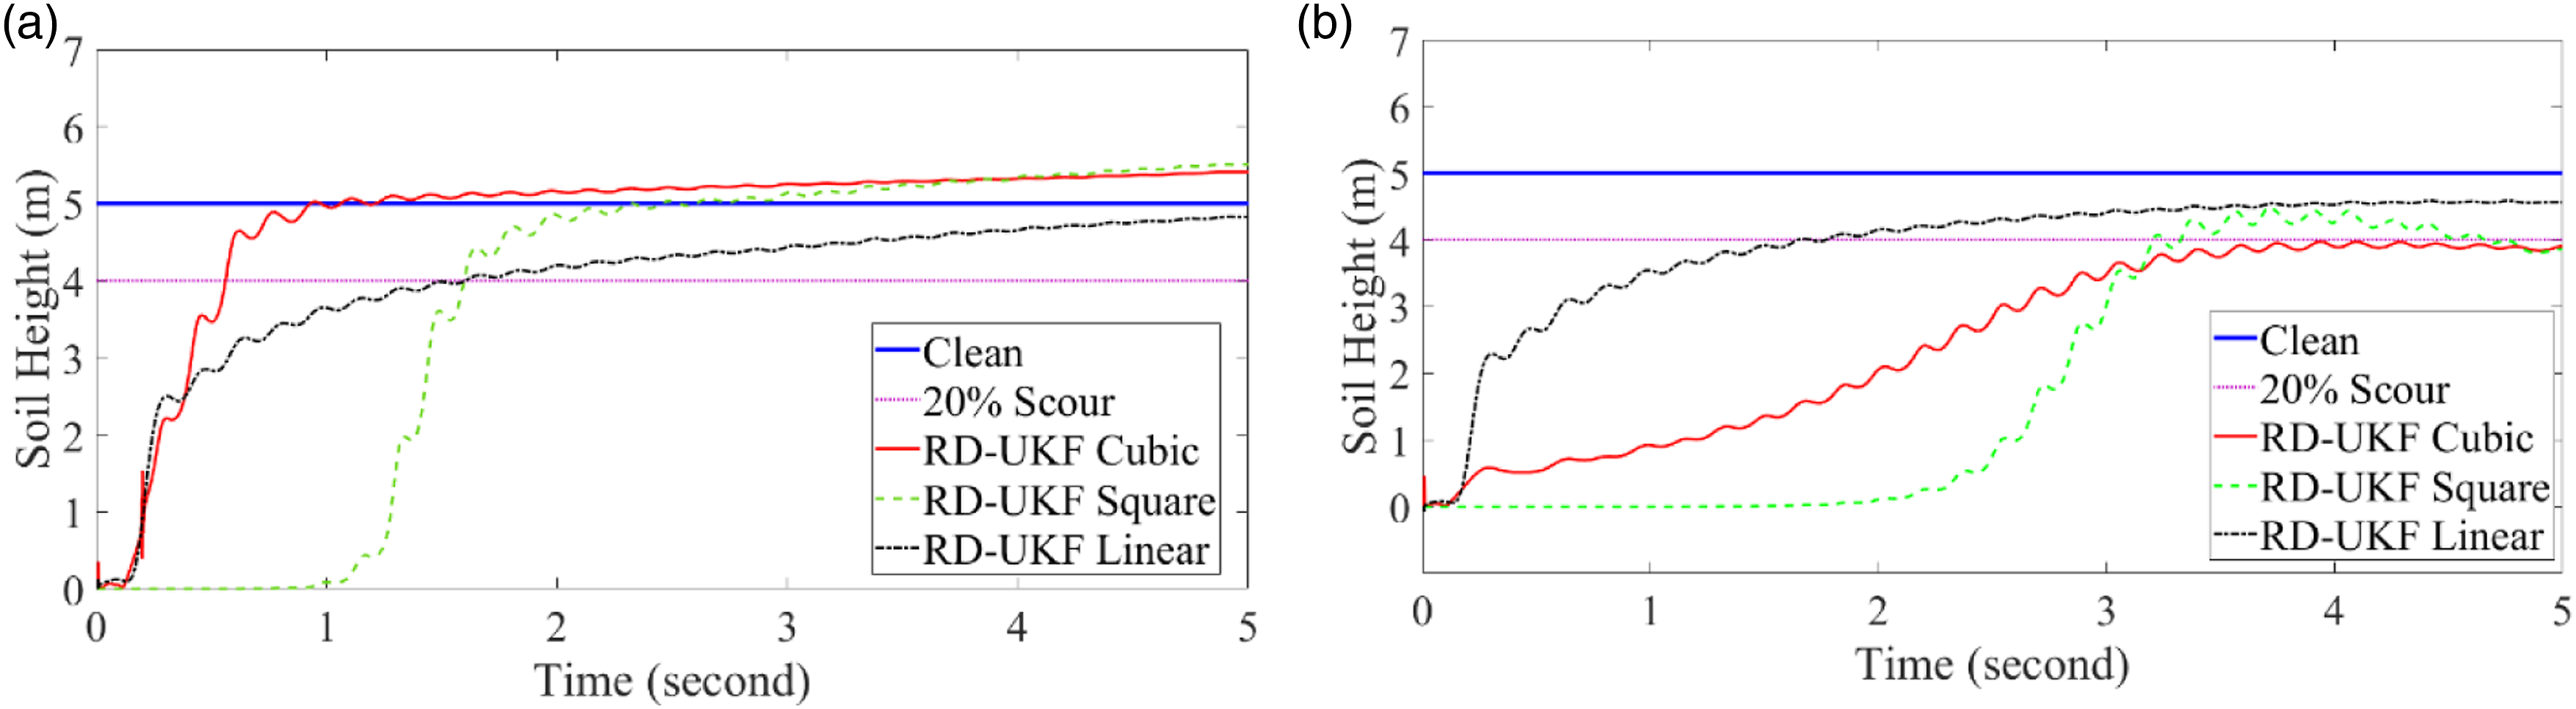
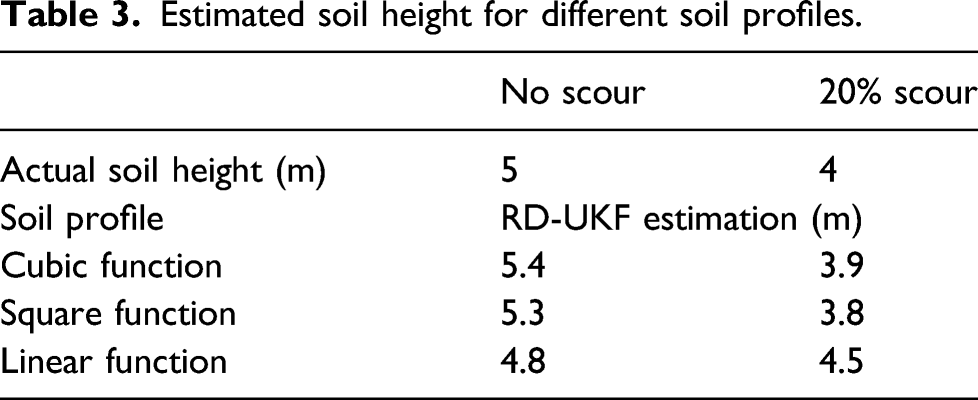
Estimated soil height for different soil profiles.
To compare the data-driven approach to this proposed method, we have illustrated the frequency response spectrum of the model under scour in Figure 9. The first natural frequency of the pier (Figure 5(b)) has been changed from 3 Hz to 2.83 Hz. While 20% of the scour was assumed for the soil around the pier, the natural frequency was decreased by about seven percent. This means that the natural frequency-based scour monitoring technique is not reliable in scour quantification. The data-based approach can only detect the existence of scour.
18
Therefore, the introduced method will be beneficial to compensate for the drawback of current data-based methods for scour monitoring purposes. (a) Free vibration response under scour; (b) FFT of the free vibration response of the system under scour.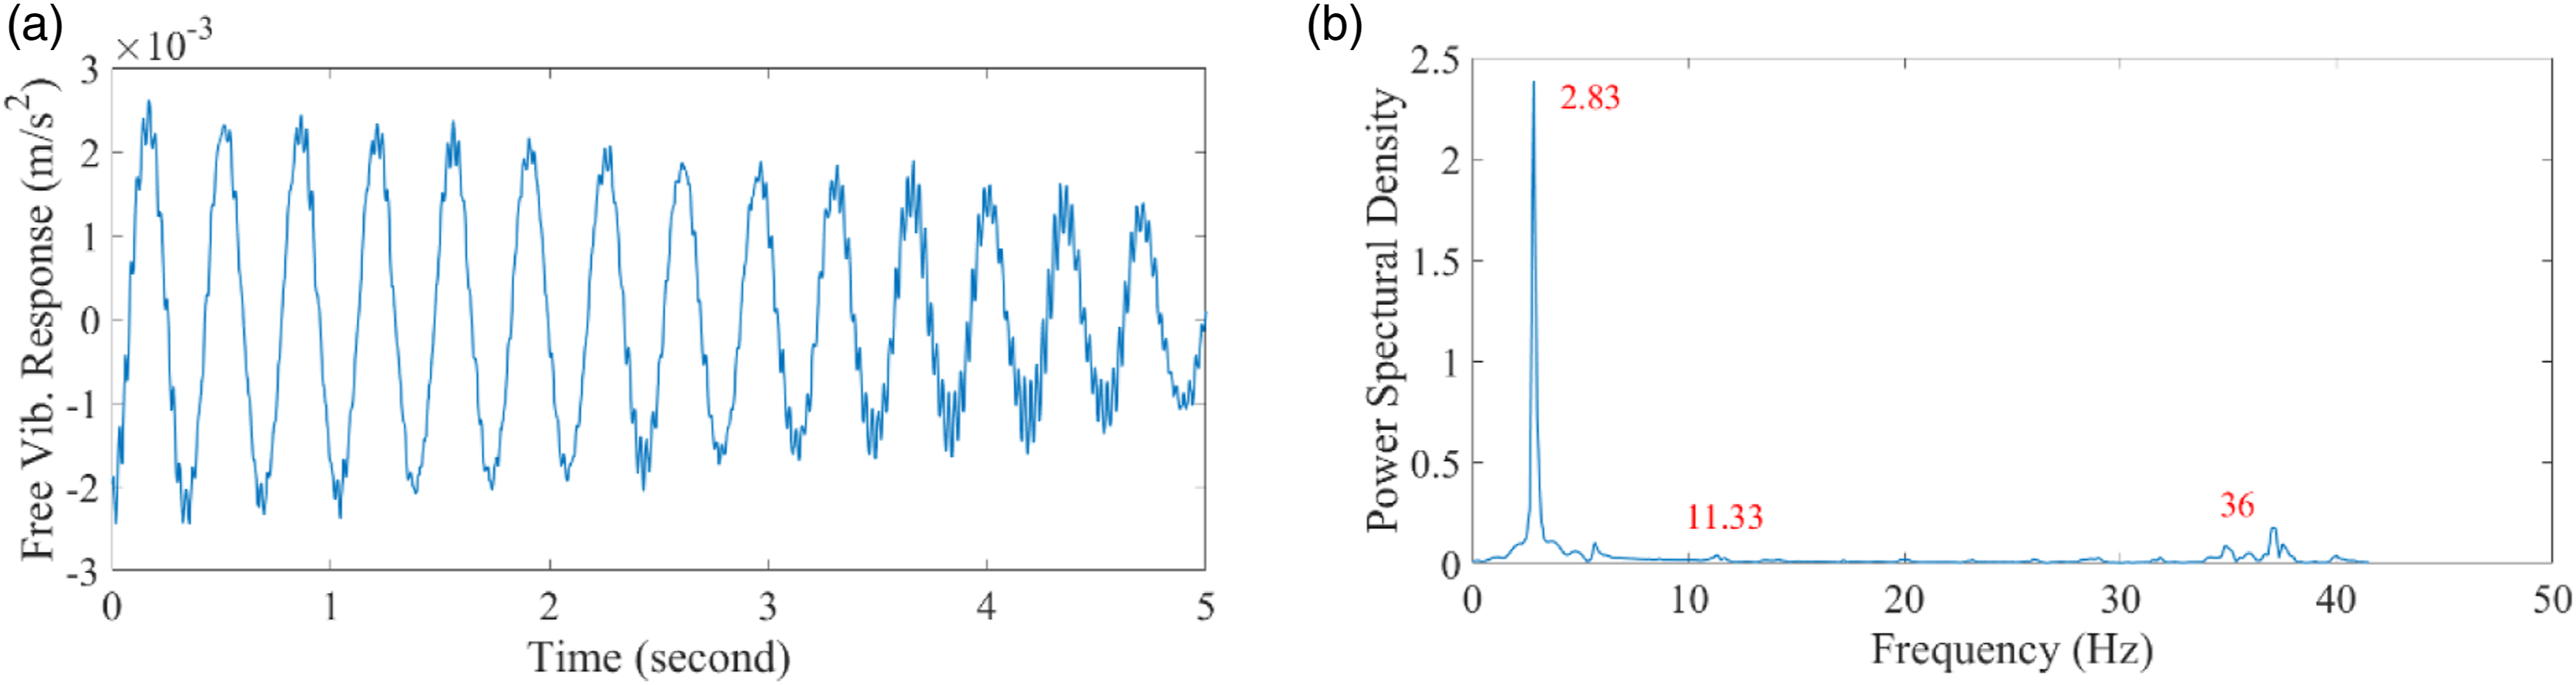
This section introduced the capabilities of the proposed method for scour quantification in a simulation study. In the next section, the proposed method is examined using a real large-scale bridge system.
Application to a large-scale bridge pier
In the previous section, we demonstrated the capability of the proposed method in scour quantification of a bridge pier in simulation studies. To investigate the method’s performance in an actual structure, the ambient vibration responses of a multi-span bridge under normal operation (located in Morris, Manitoba, Canada) were measured over the duration of a year, starting in October 2019. This five-span continuous bridge system is about 300 m long and was supported on 10 piers. Approximately 7500 vehicles travel across the bridge each month. We installed a uniaxial accelerometer to pier five to measure ambient vibrations on the pier caused by the beating river water, crossing traffic, wind, and pedestrians. We selected pier five because it is surrounded by water all year, and it is vulnerable to scour, as shown in Figure 10. Images of the bridge and the installed sensor on pier five are shown in Figure 11. Side view of the large-scale bridge system drawing. Views of the bridge, installed sensor, and data acquisition system.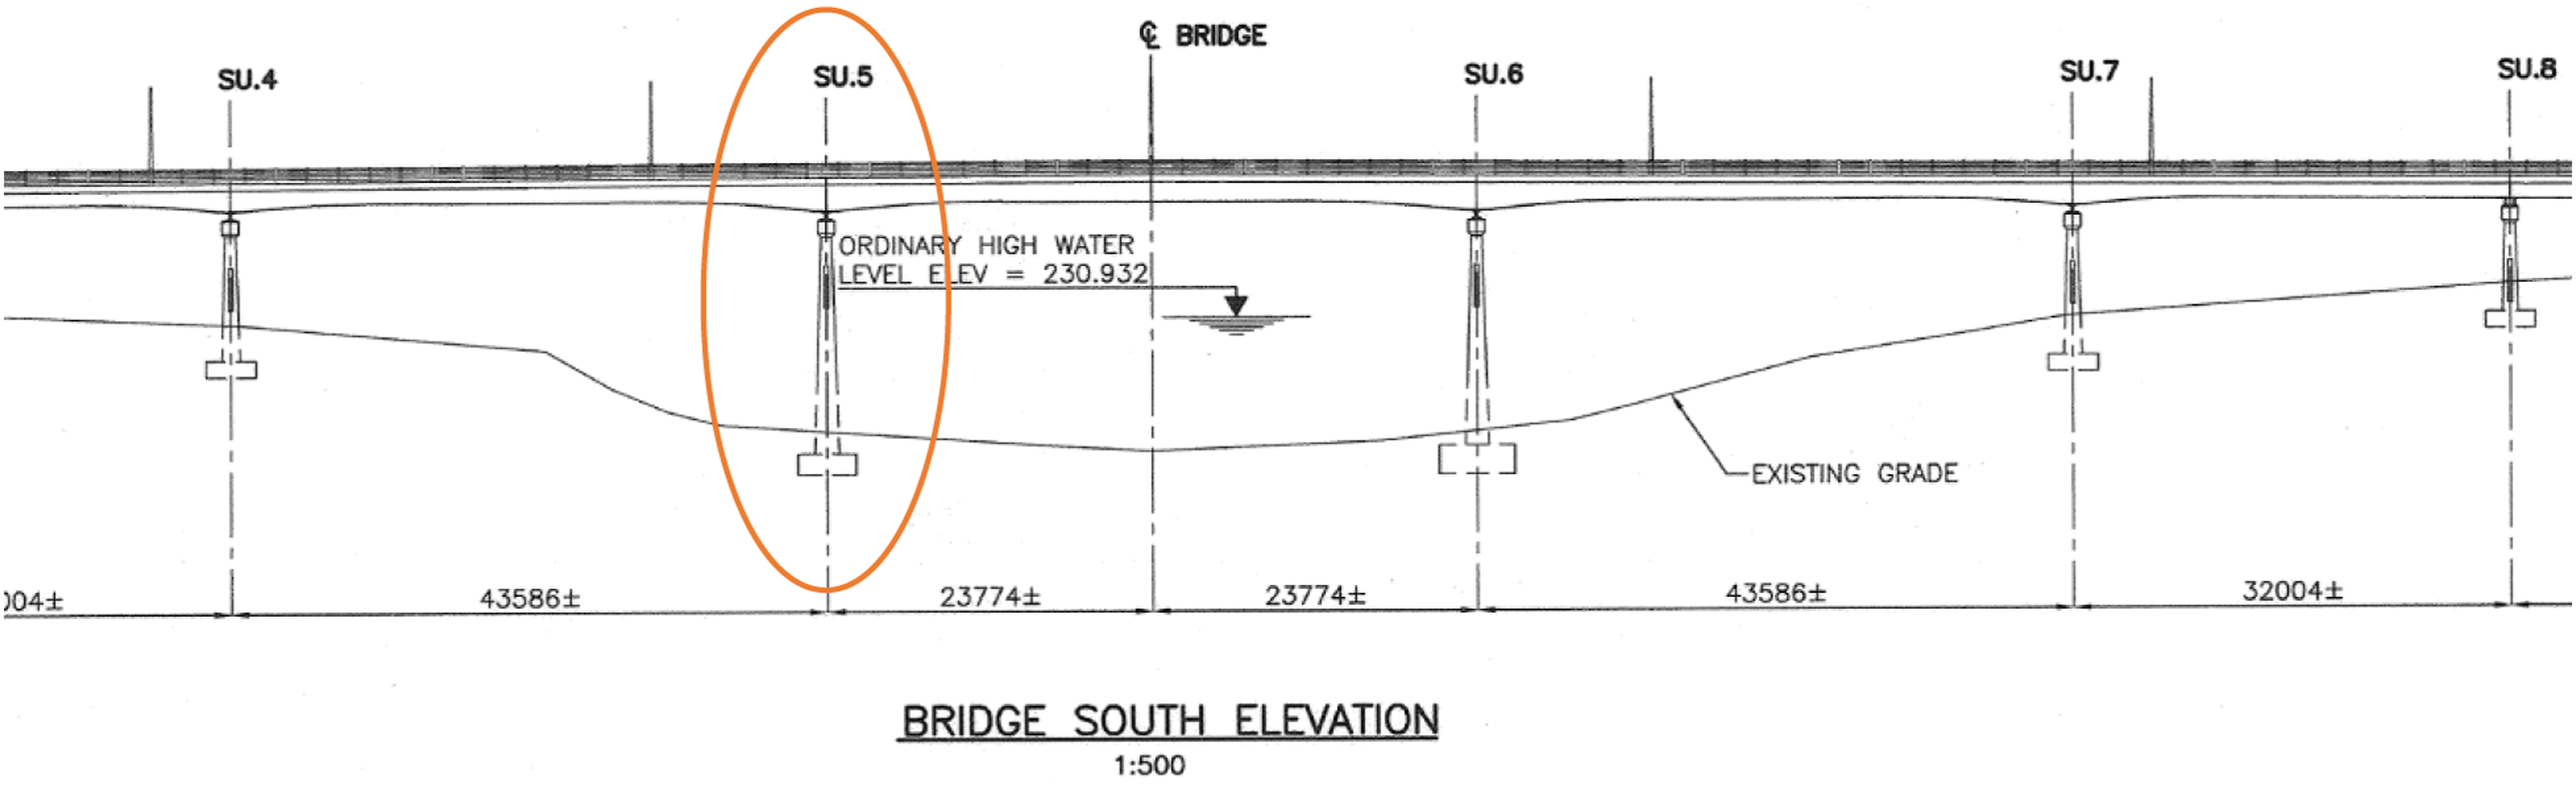
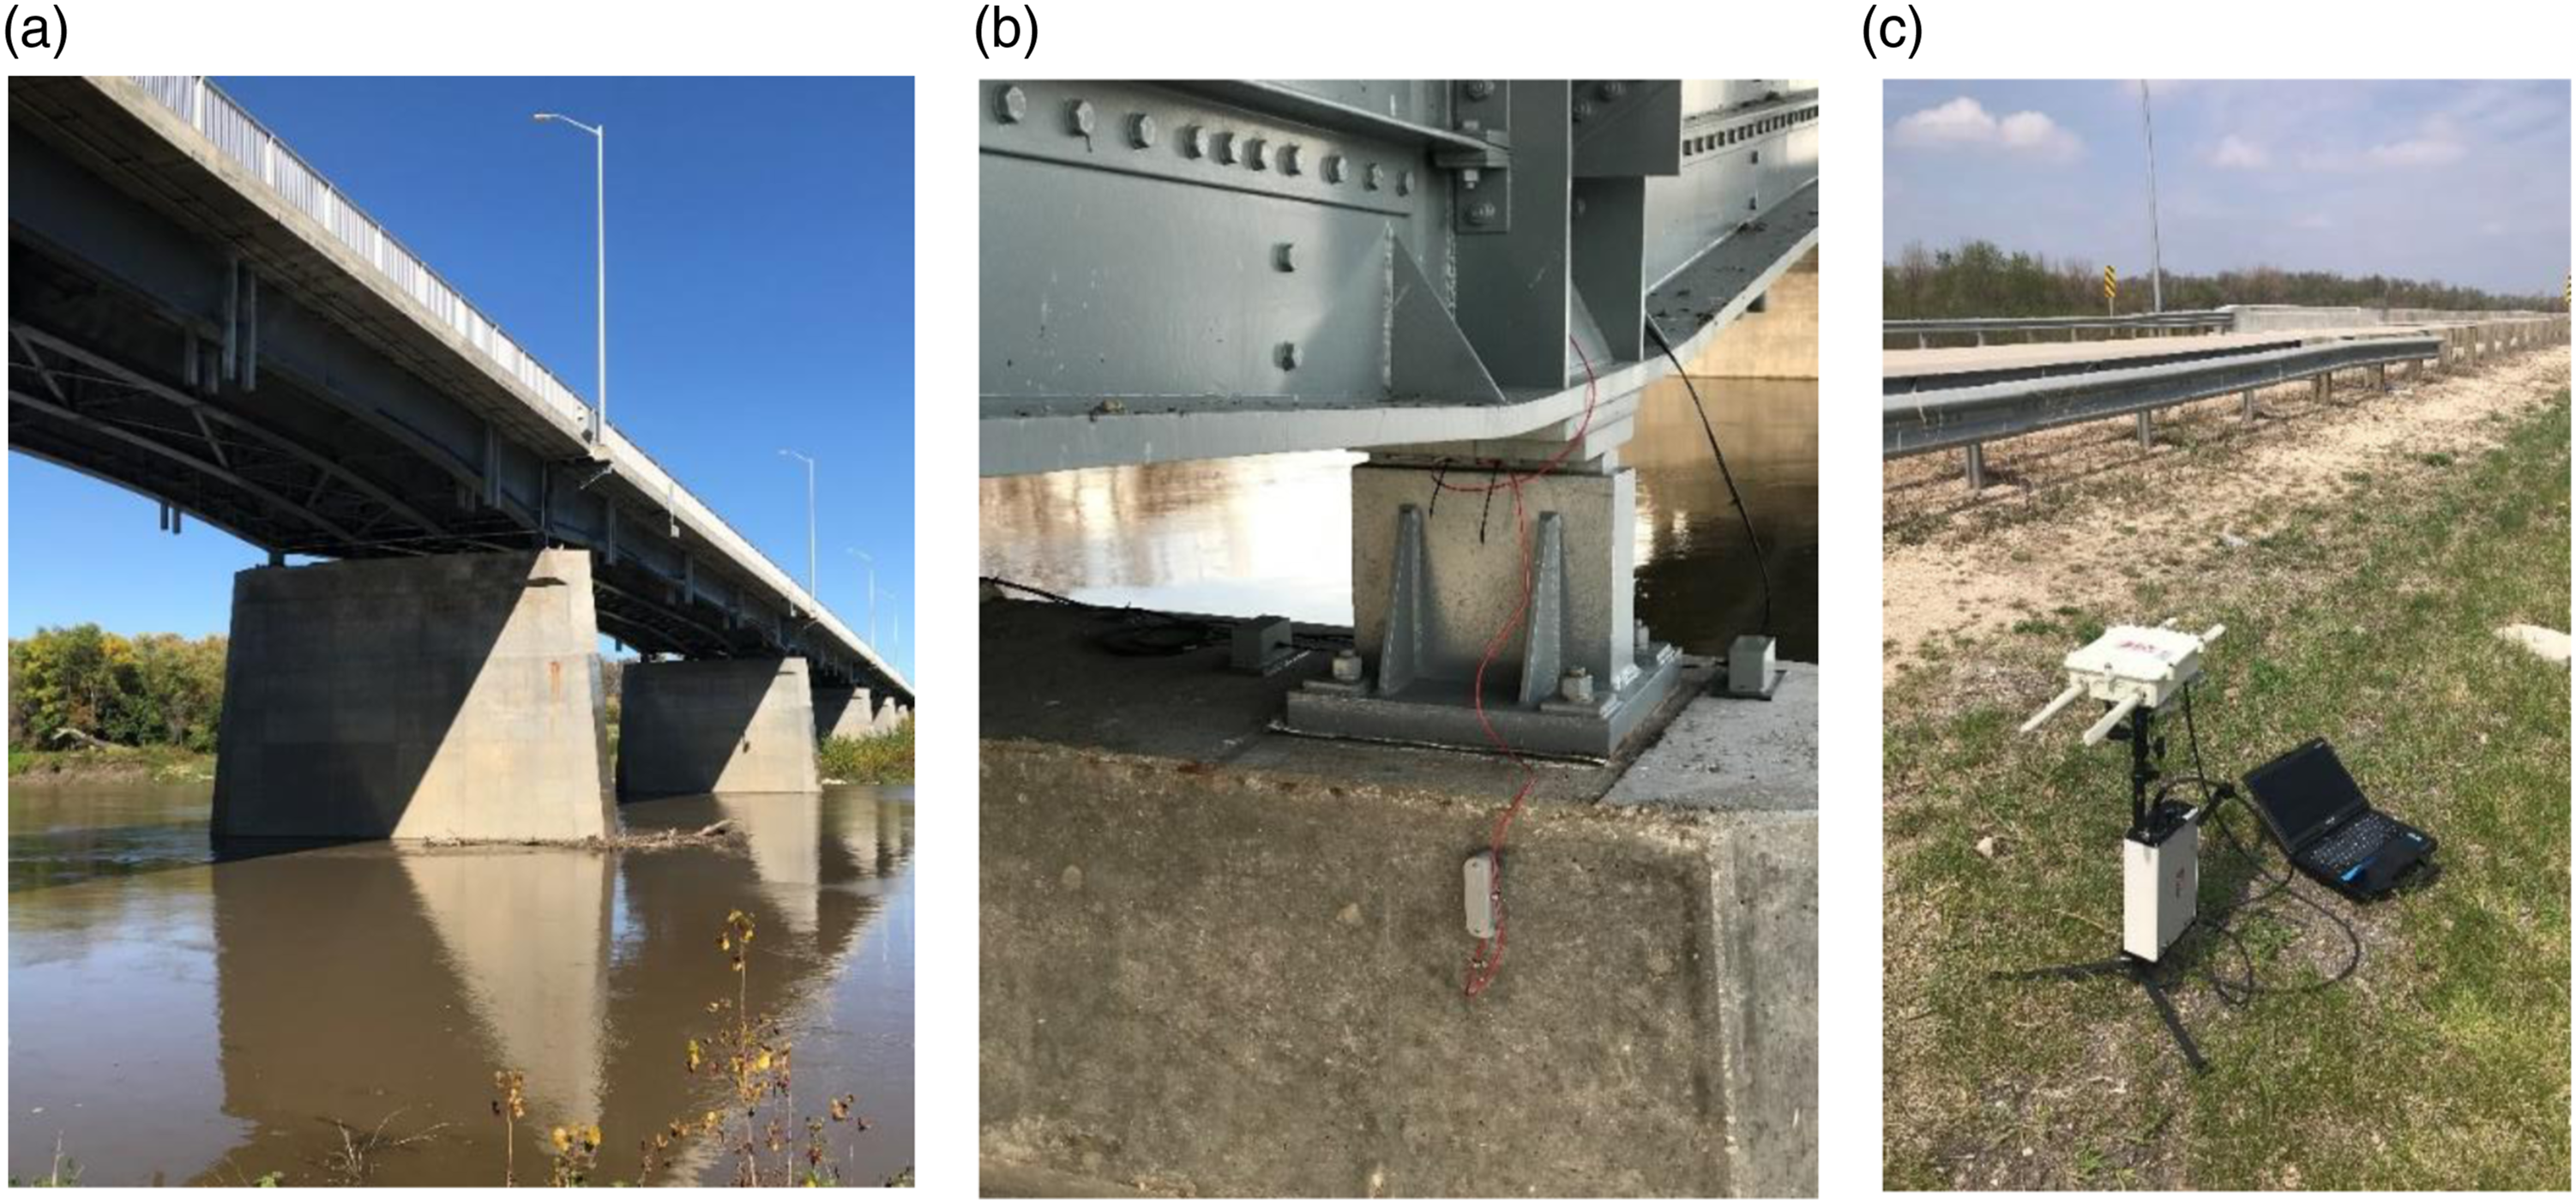
A MEMS-Piezoresistive BDI model A1316 accelerometer was used to measure the vibration response of the pier. It has an amplitude range of ±2 g, a frequency range (min) of 0–300 Hz, and a voltage sensitivity of 1000 mV/g. A four-channel wireless data acquisition system was used for data communication (BDI model, STS-PRIME-0337), as shown in Figure 11(c).
The river water always flows around piers five and six during a year, but the water level changes during the flood season in the early spring and Fall. We recorded the ambient vibration responses of pier five for four months (February, July, August, and October). The soil stiffness around the pier was estimated each time. The ambient vibrations of pier five in February and August (2020), both measured around 3pm, are shown in Figure 12. Ambient vibration responses of pier 5.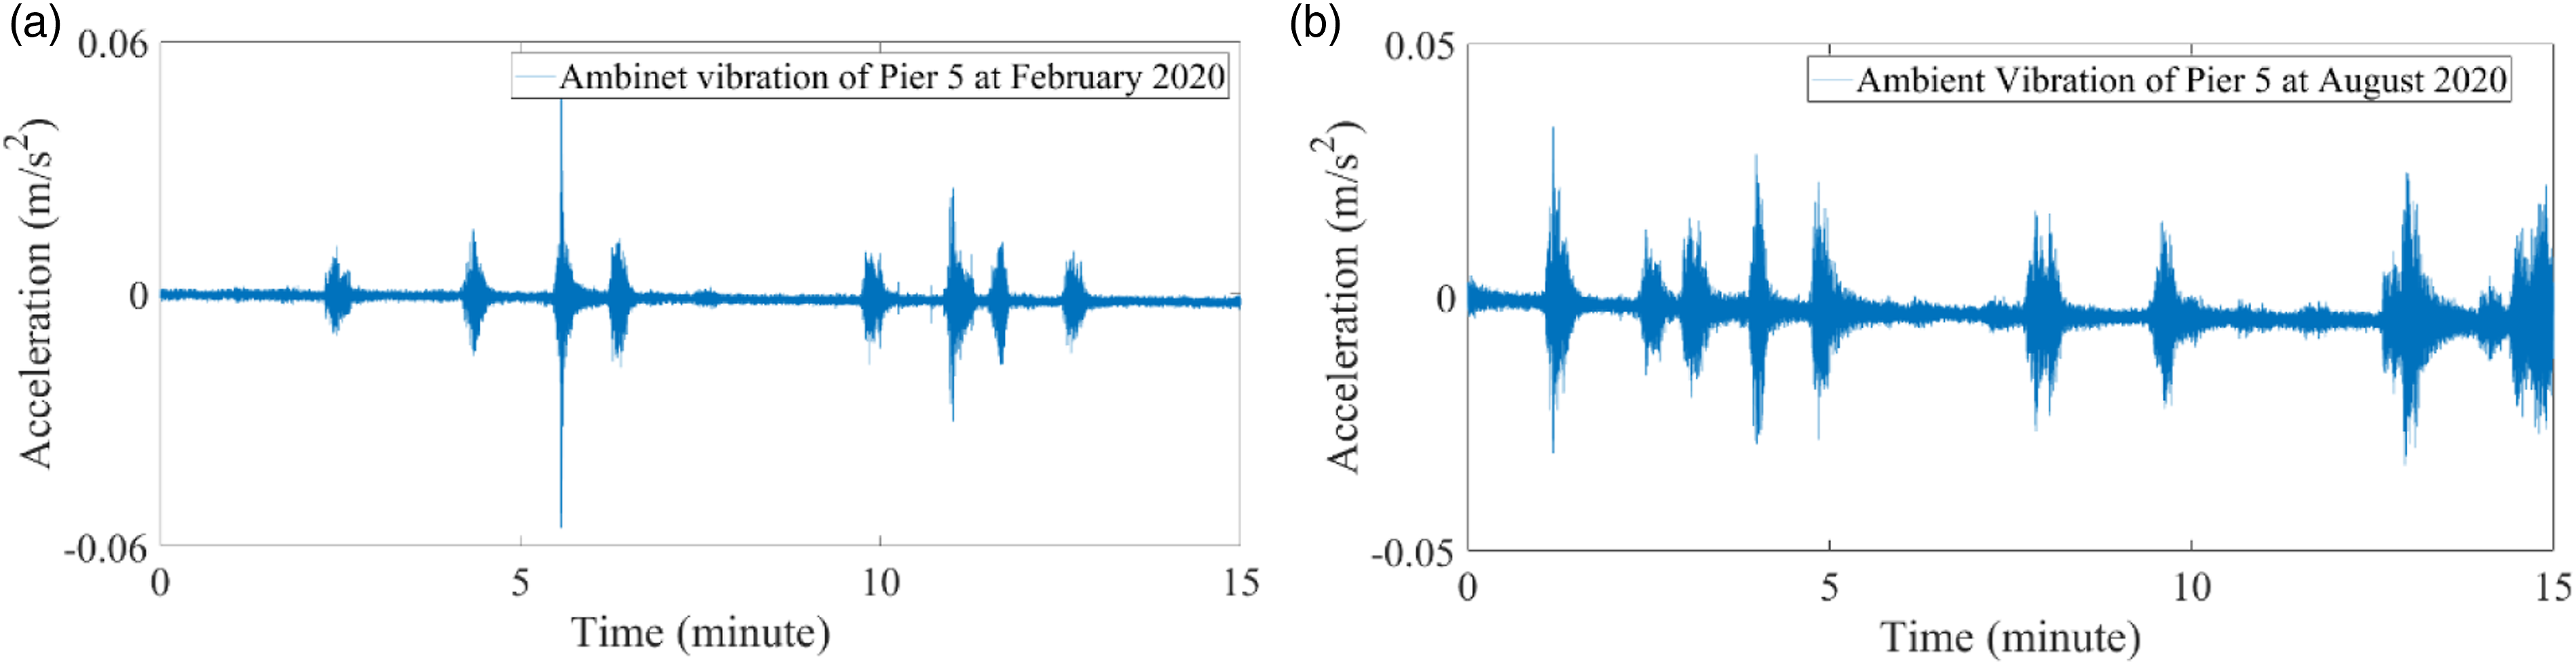
The sampling rate of the data acquisition system was 100 Hz, and the data were recorded for about 30 min each time. Considering that the bridge length is about 300 m, and the maximum speed limit on the bridge is Free vibration responses of pier 5.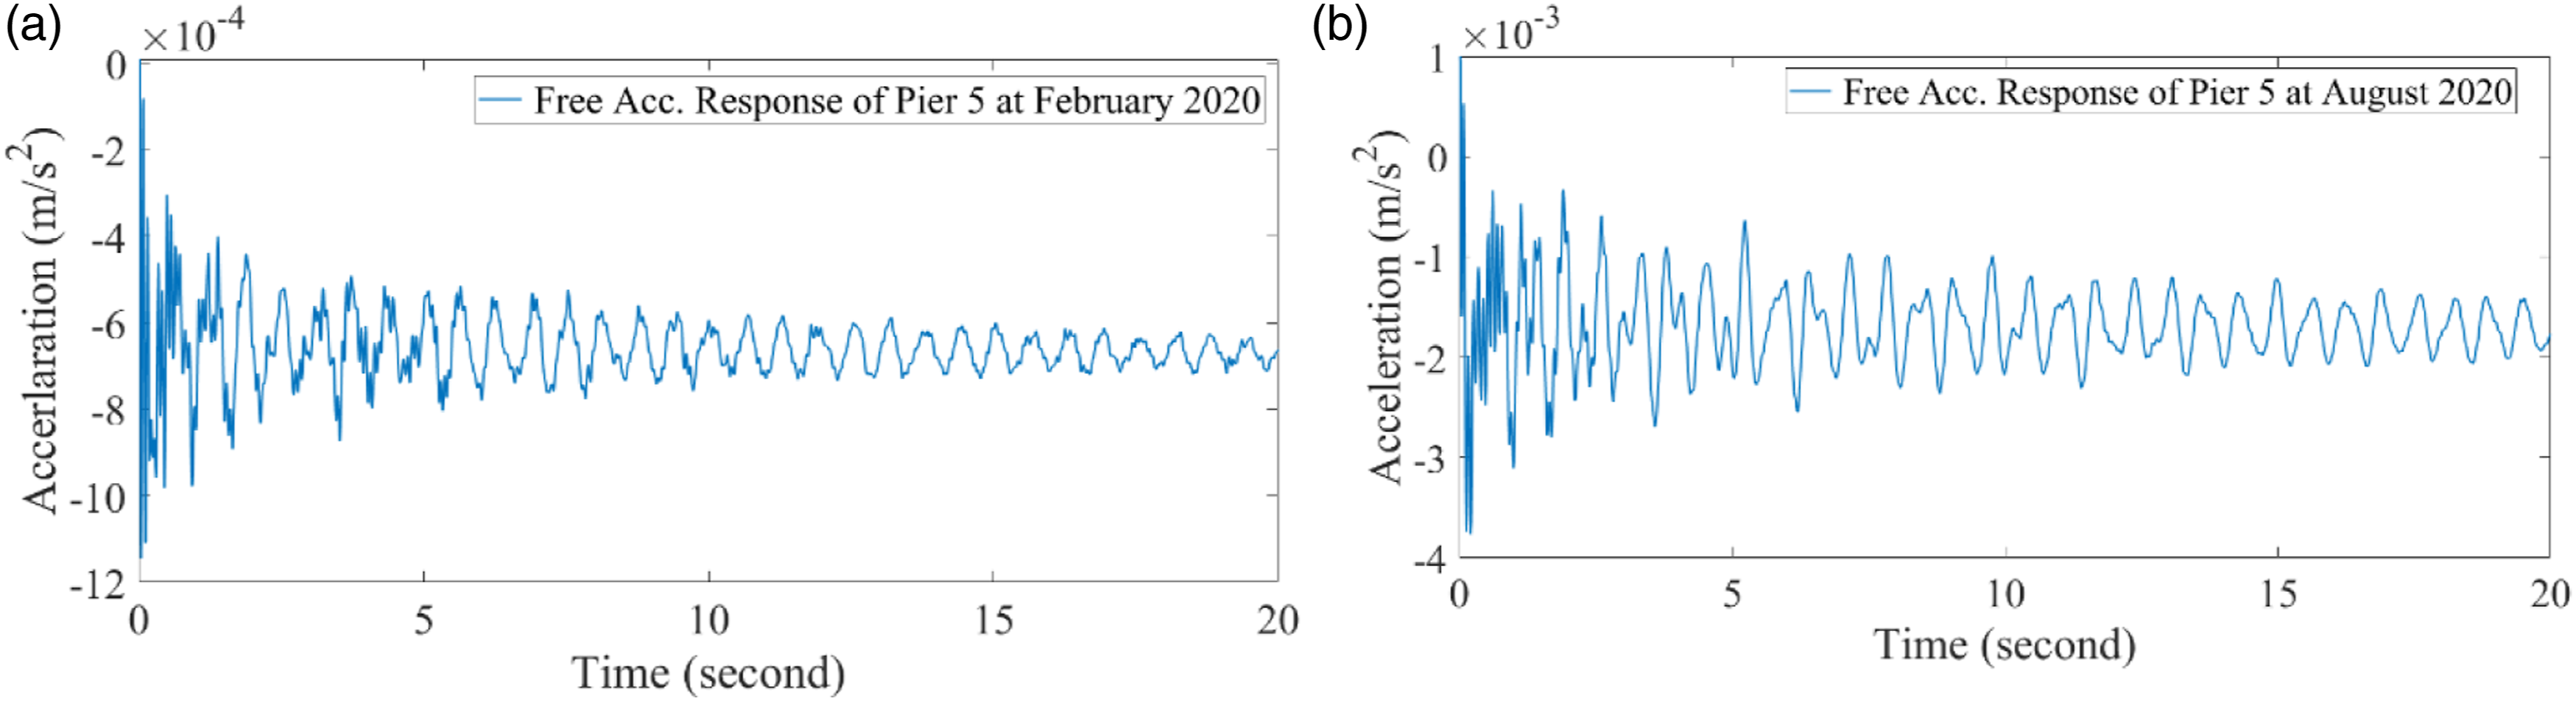
As in the simulation study, the fixed-free boundary condition was considered for the modeling of the Euler–Bernoulli beam, as shown in Figure 3. Four rocker bearings are at the top of the pier, and they are connected to the girders, as shown in Figure 14. The stiffness and coefficient of friction of this bearing are The four high-type rocker bearings of the pier 5.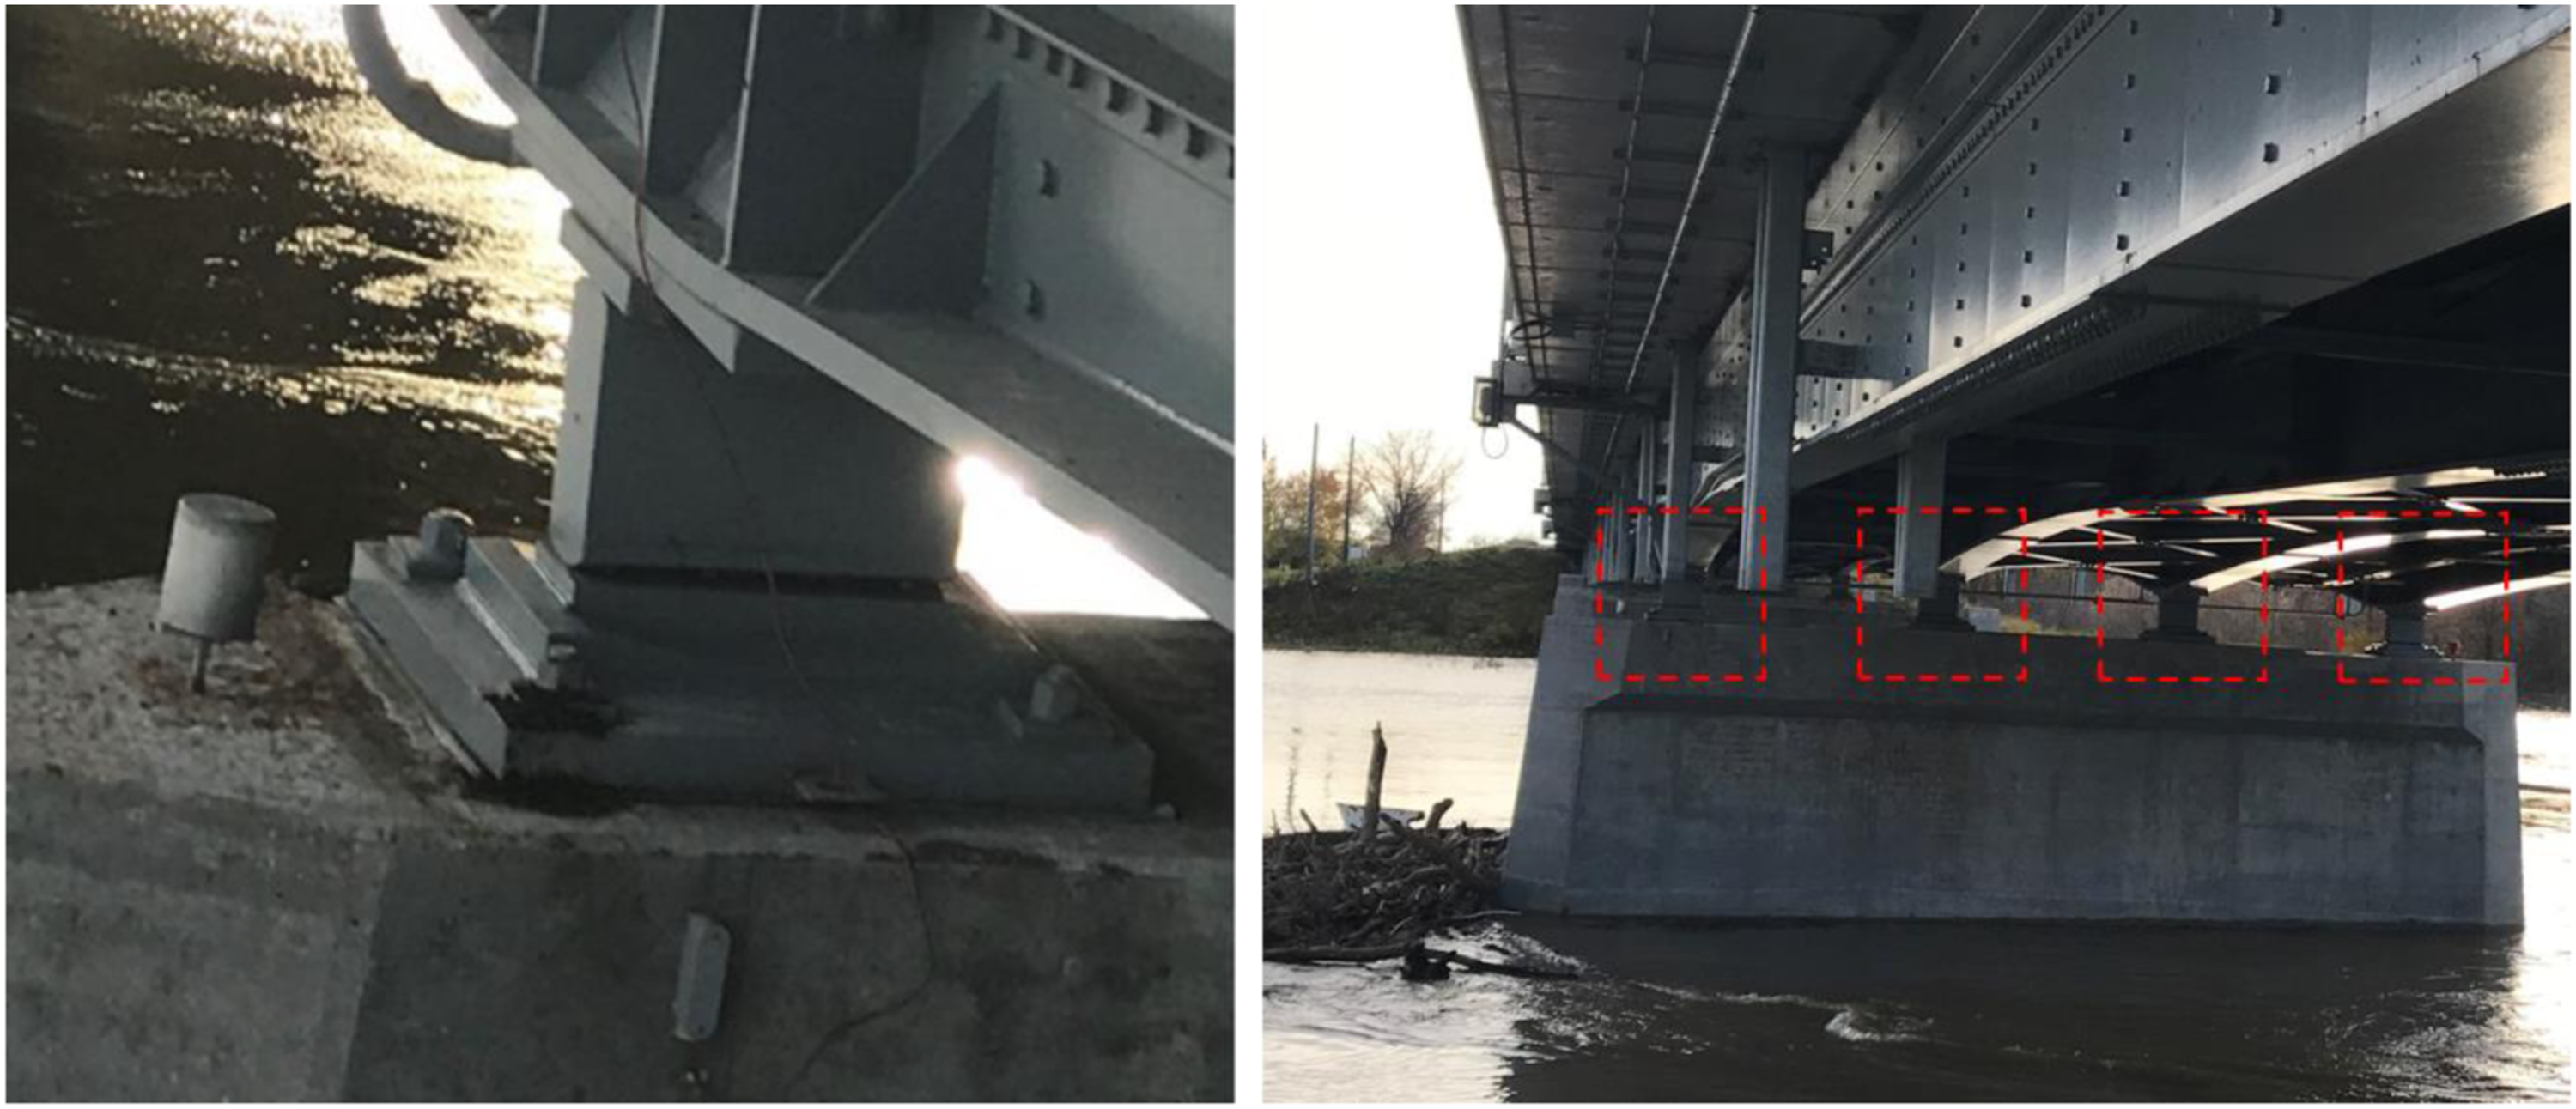
We consider pier 5 as an Euler–Bernoulli beam with a rectangular cross-section that has an area of Estimated soil stiffness around the bridge pier in different months.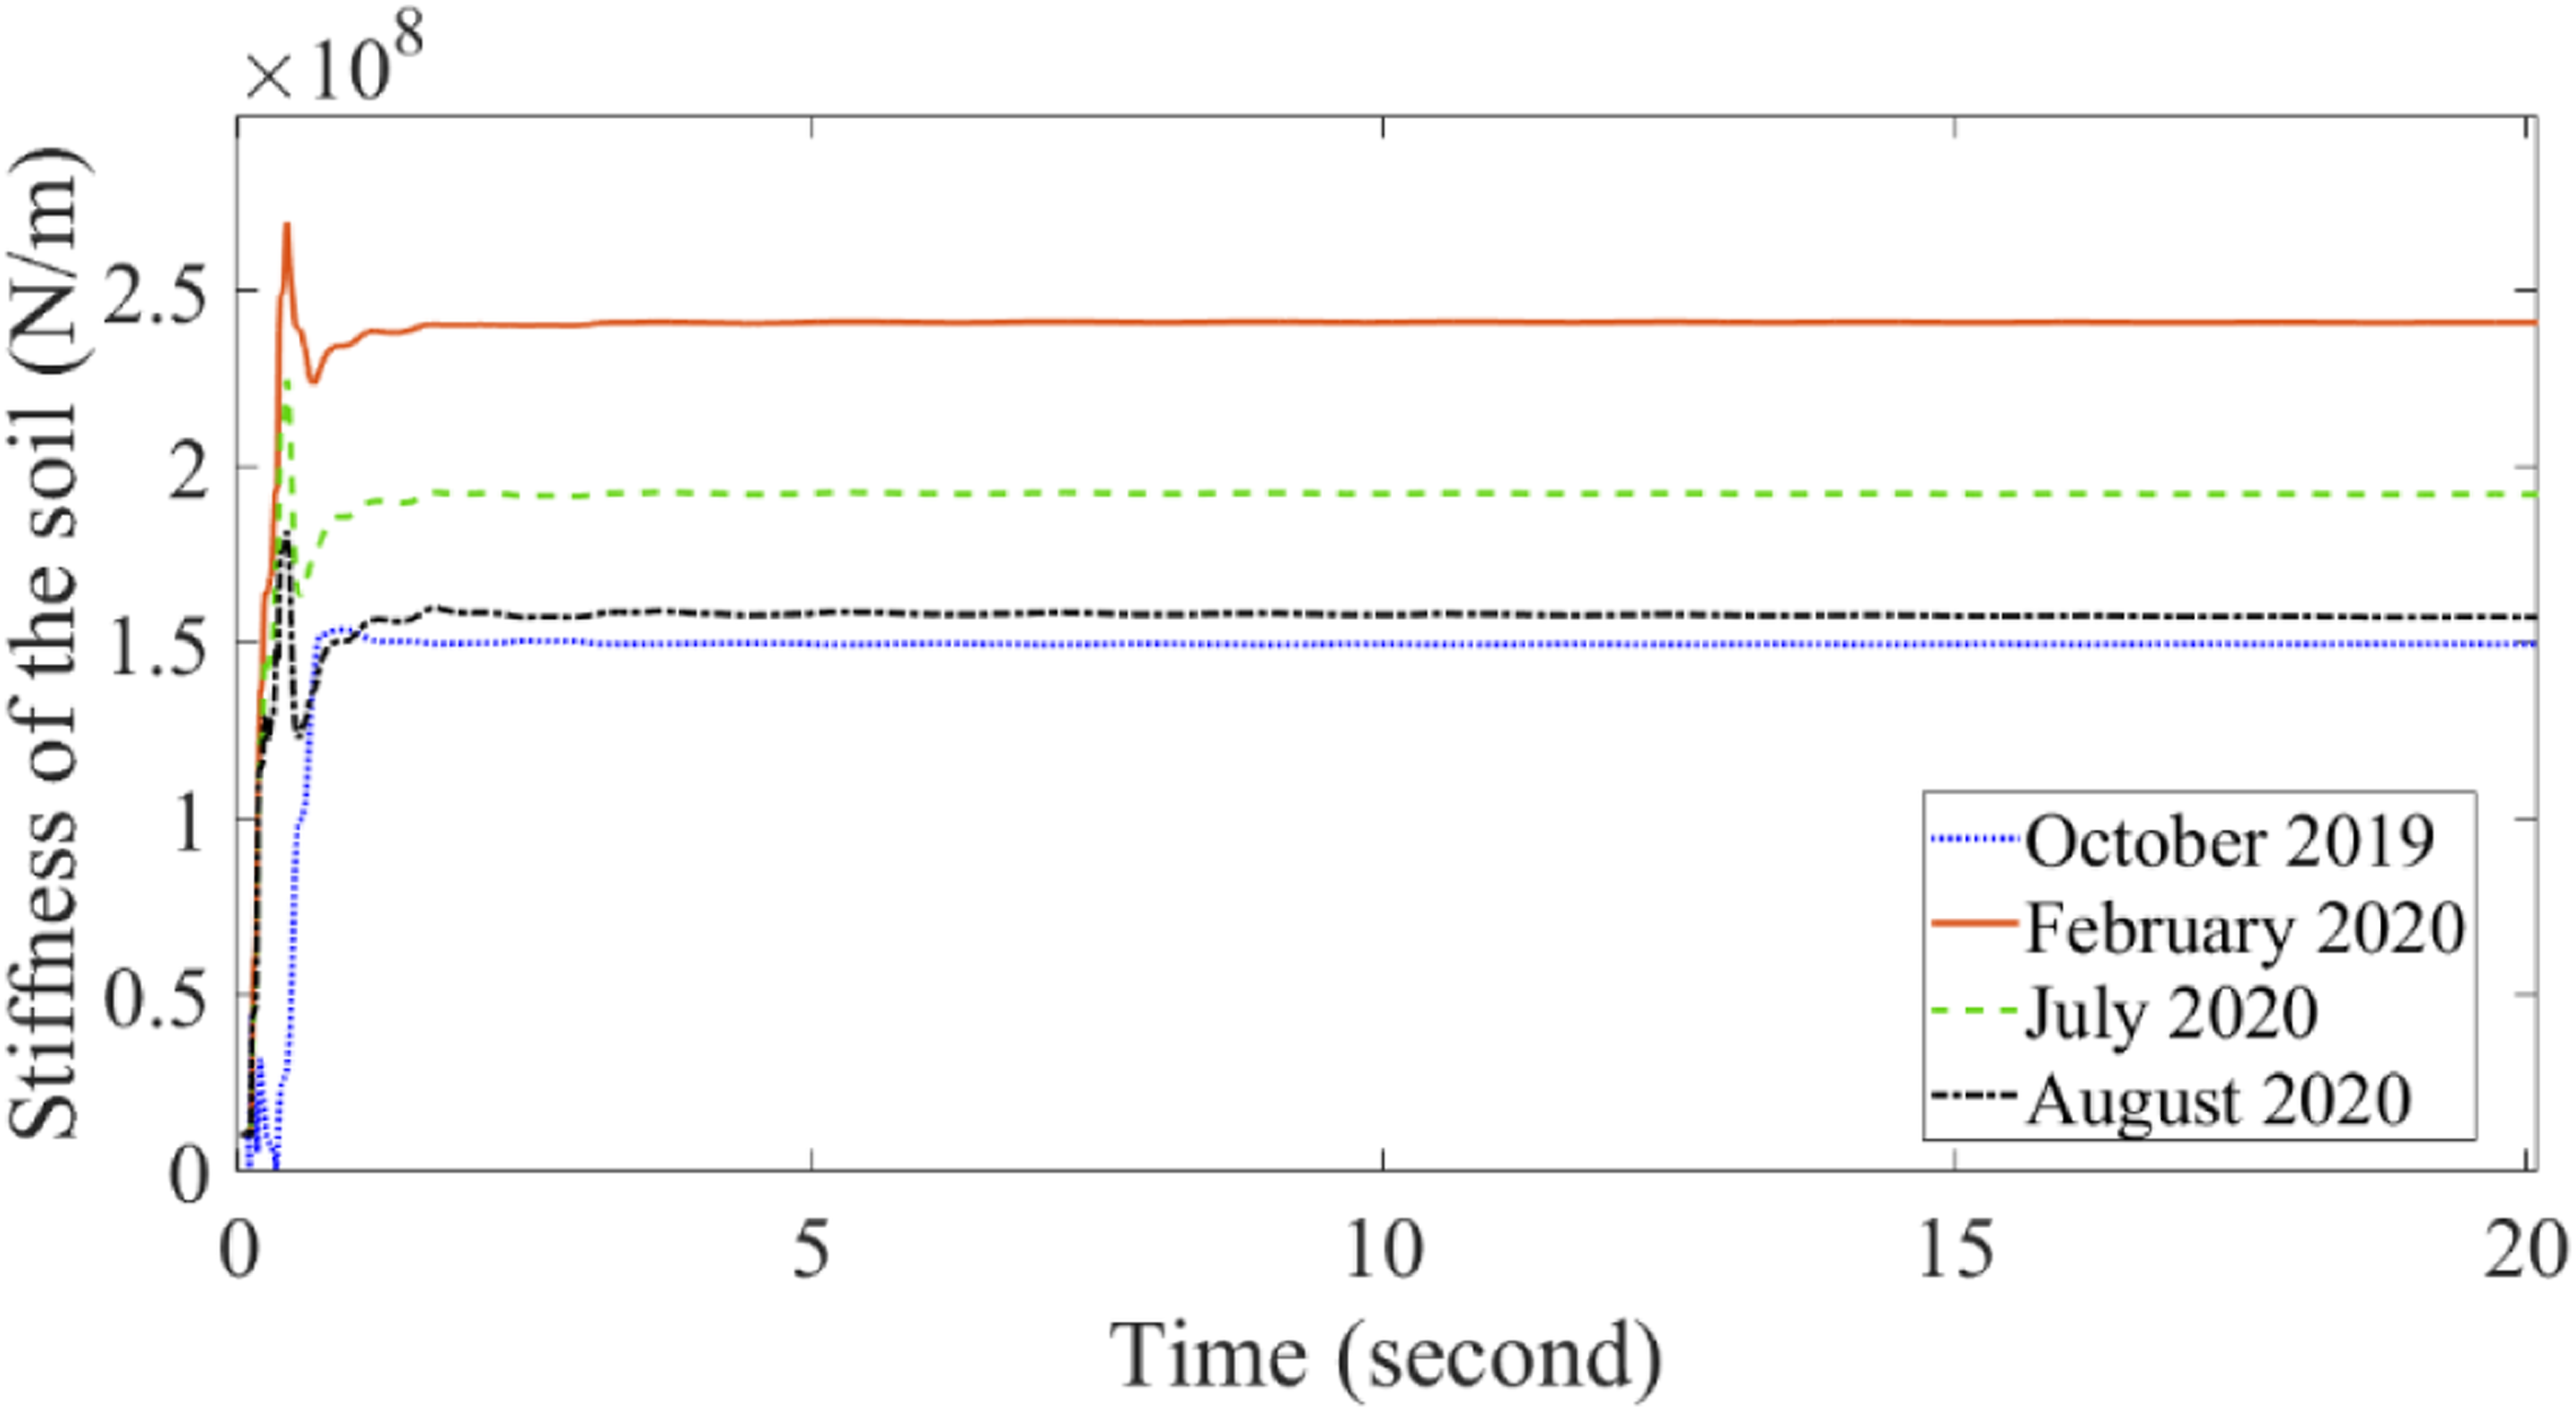
Figure 15 shows the estimated stiffness value around
The simulation study results in Numerical simulations show that soil stiffness behavior leads to a more accurate estimation of the soil height around the pier using a cubic function rather than the two other functions. Therefore, the soil height will only be estimated using the cubic function. The initial soil height is assumed to be zero with Estimated soil height around the bridge pier in different months.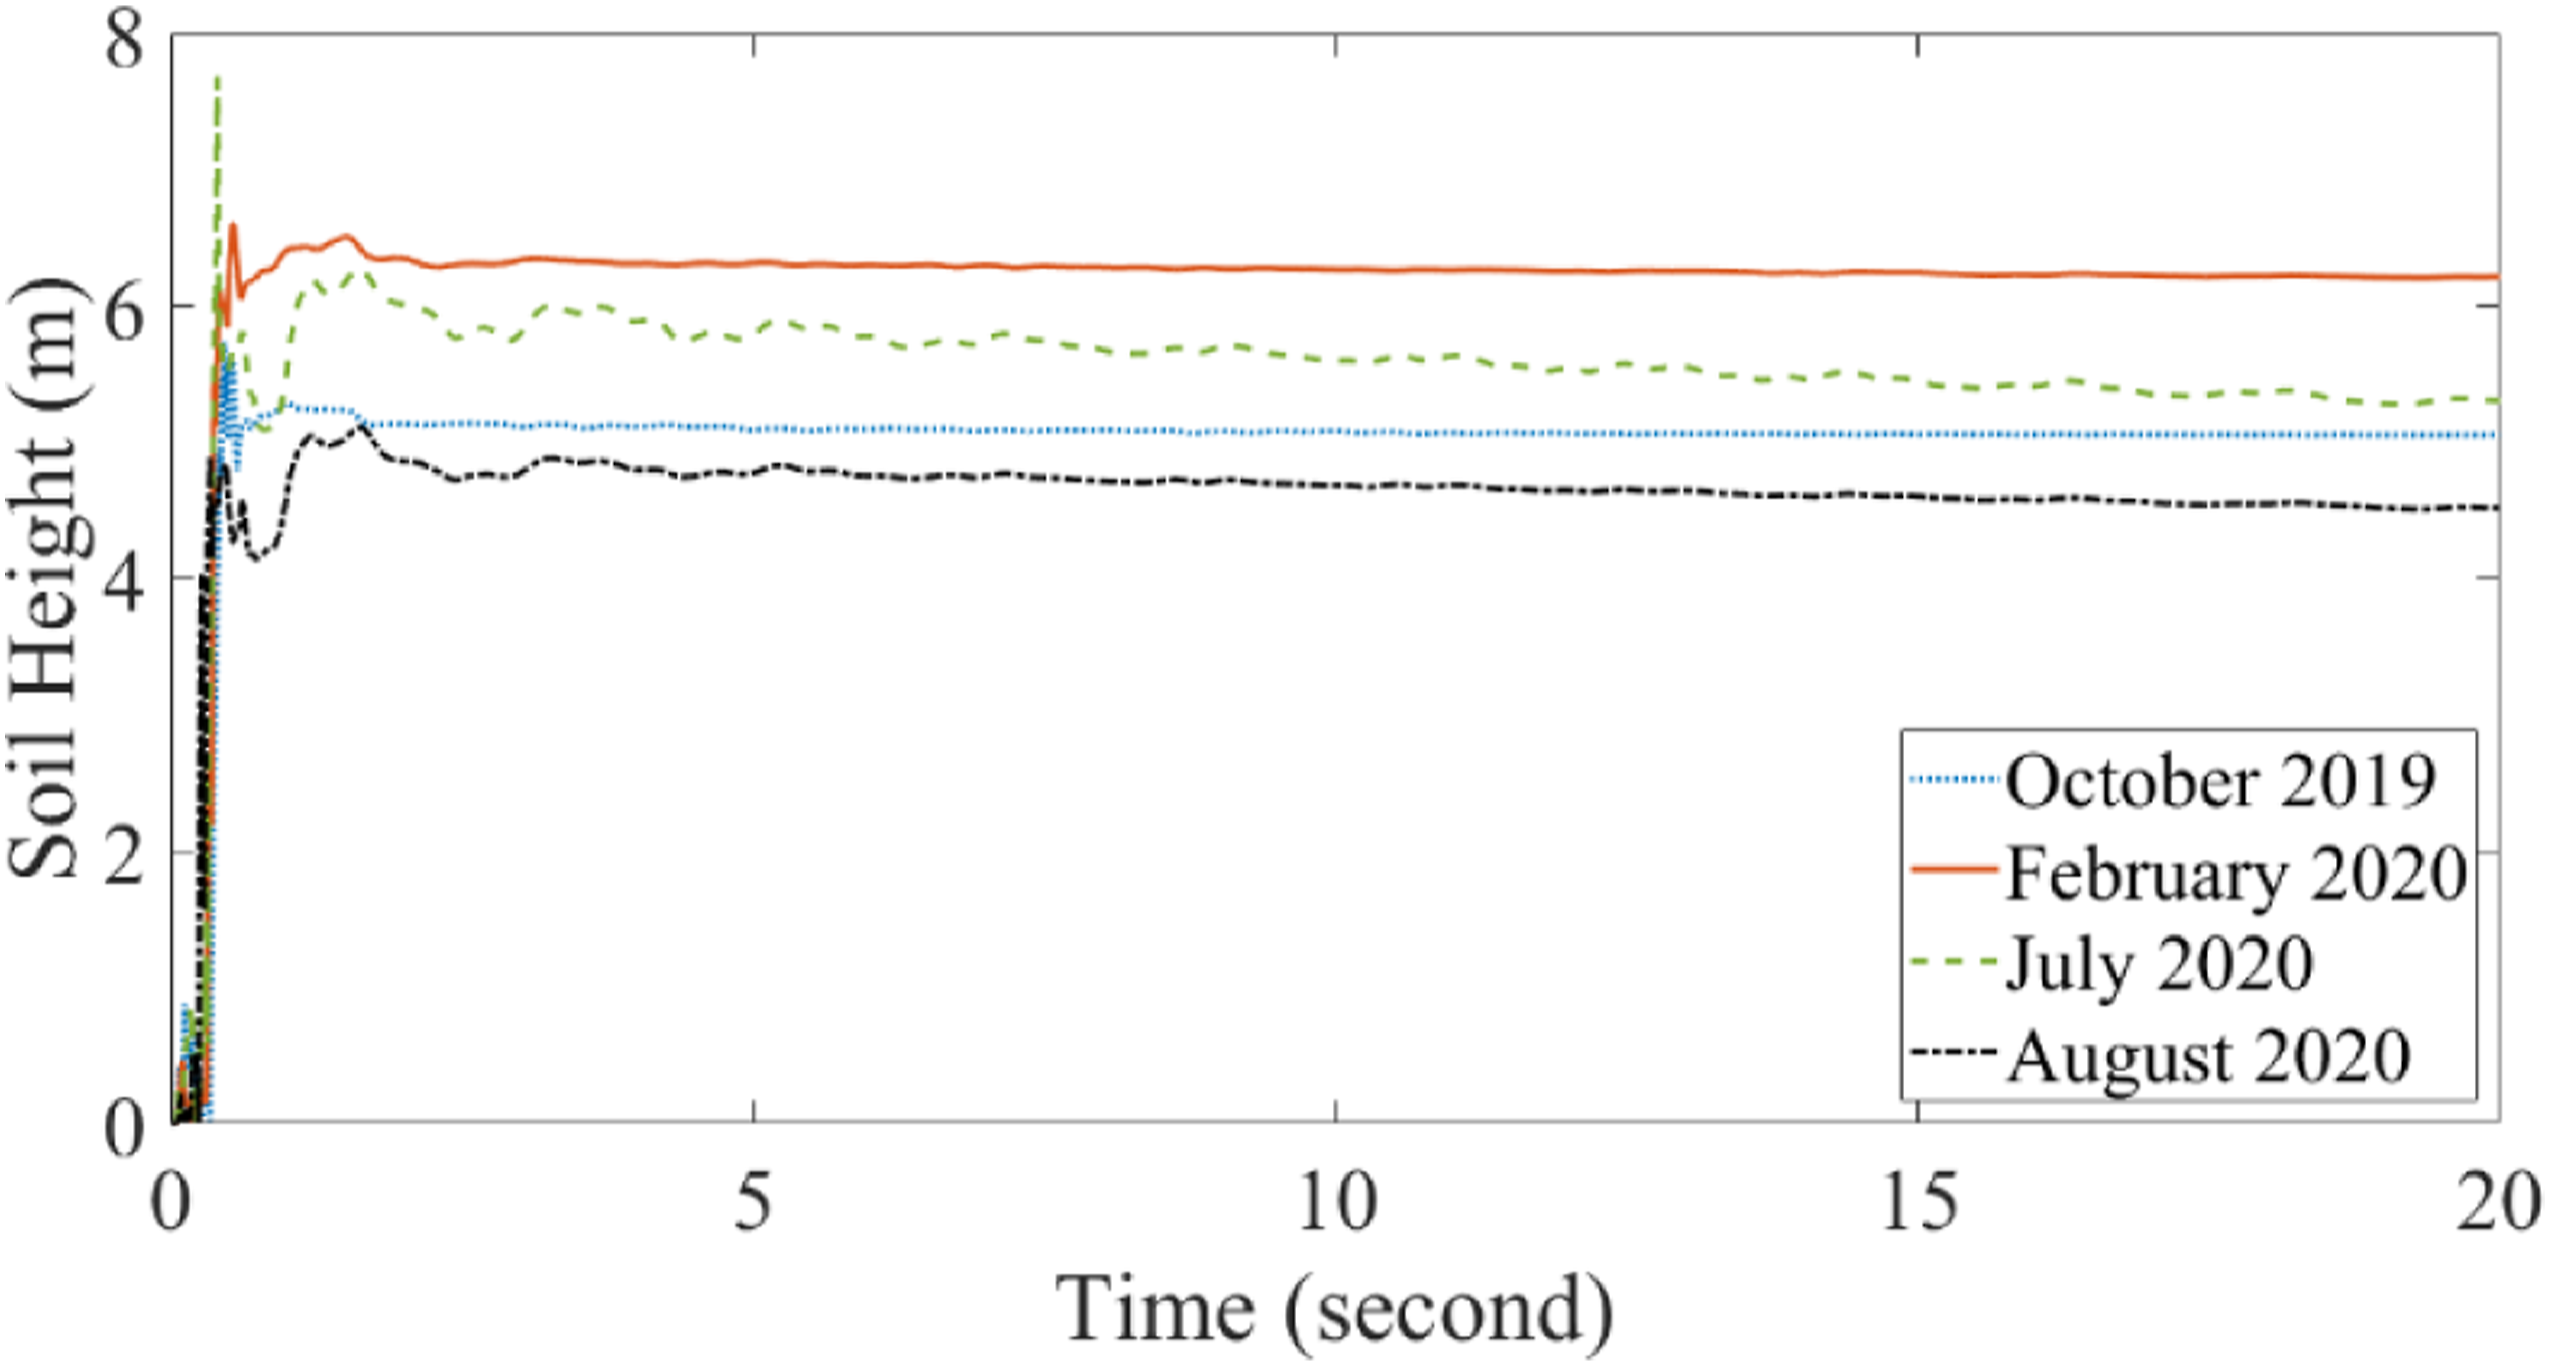
To verify the estimated soil height in Figure 16, we excavated the river ice in February 2020 and measured the height of the sediment around the pier using the Canadian Geodetic Vertical Datum of 2013 (CGVD2013).
56
We measured the water height and water level using the surveying rod equipment shown in Figure 17(a). The pier-footing elevation is available from the bridge drawings. The soil height around the pier was extracted, as shown in Figure 17(b). (a) The survey used for the soil height around the pier 5; (b) and schematic of the height of the soil around the pier 5.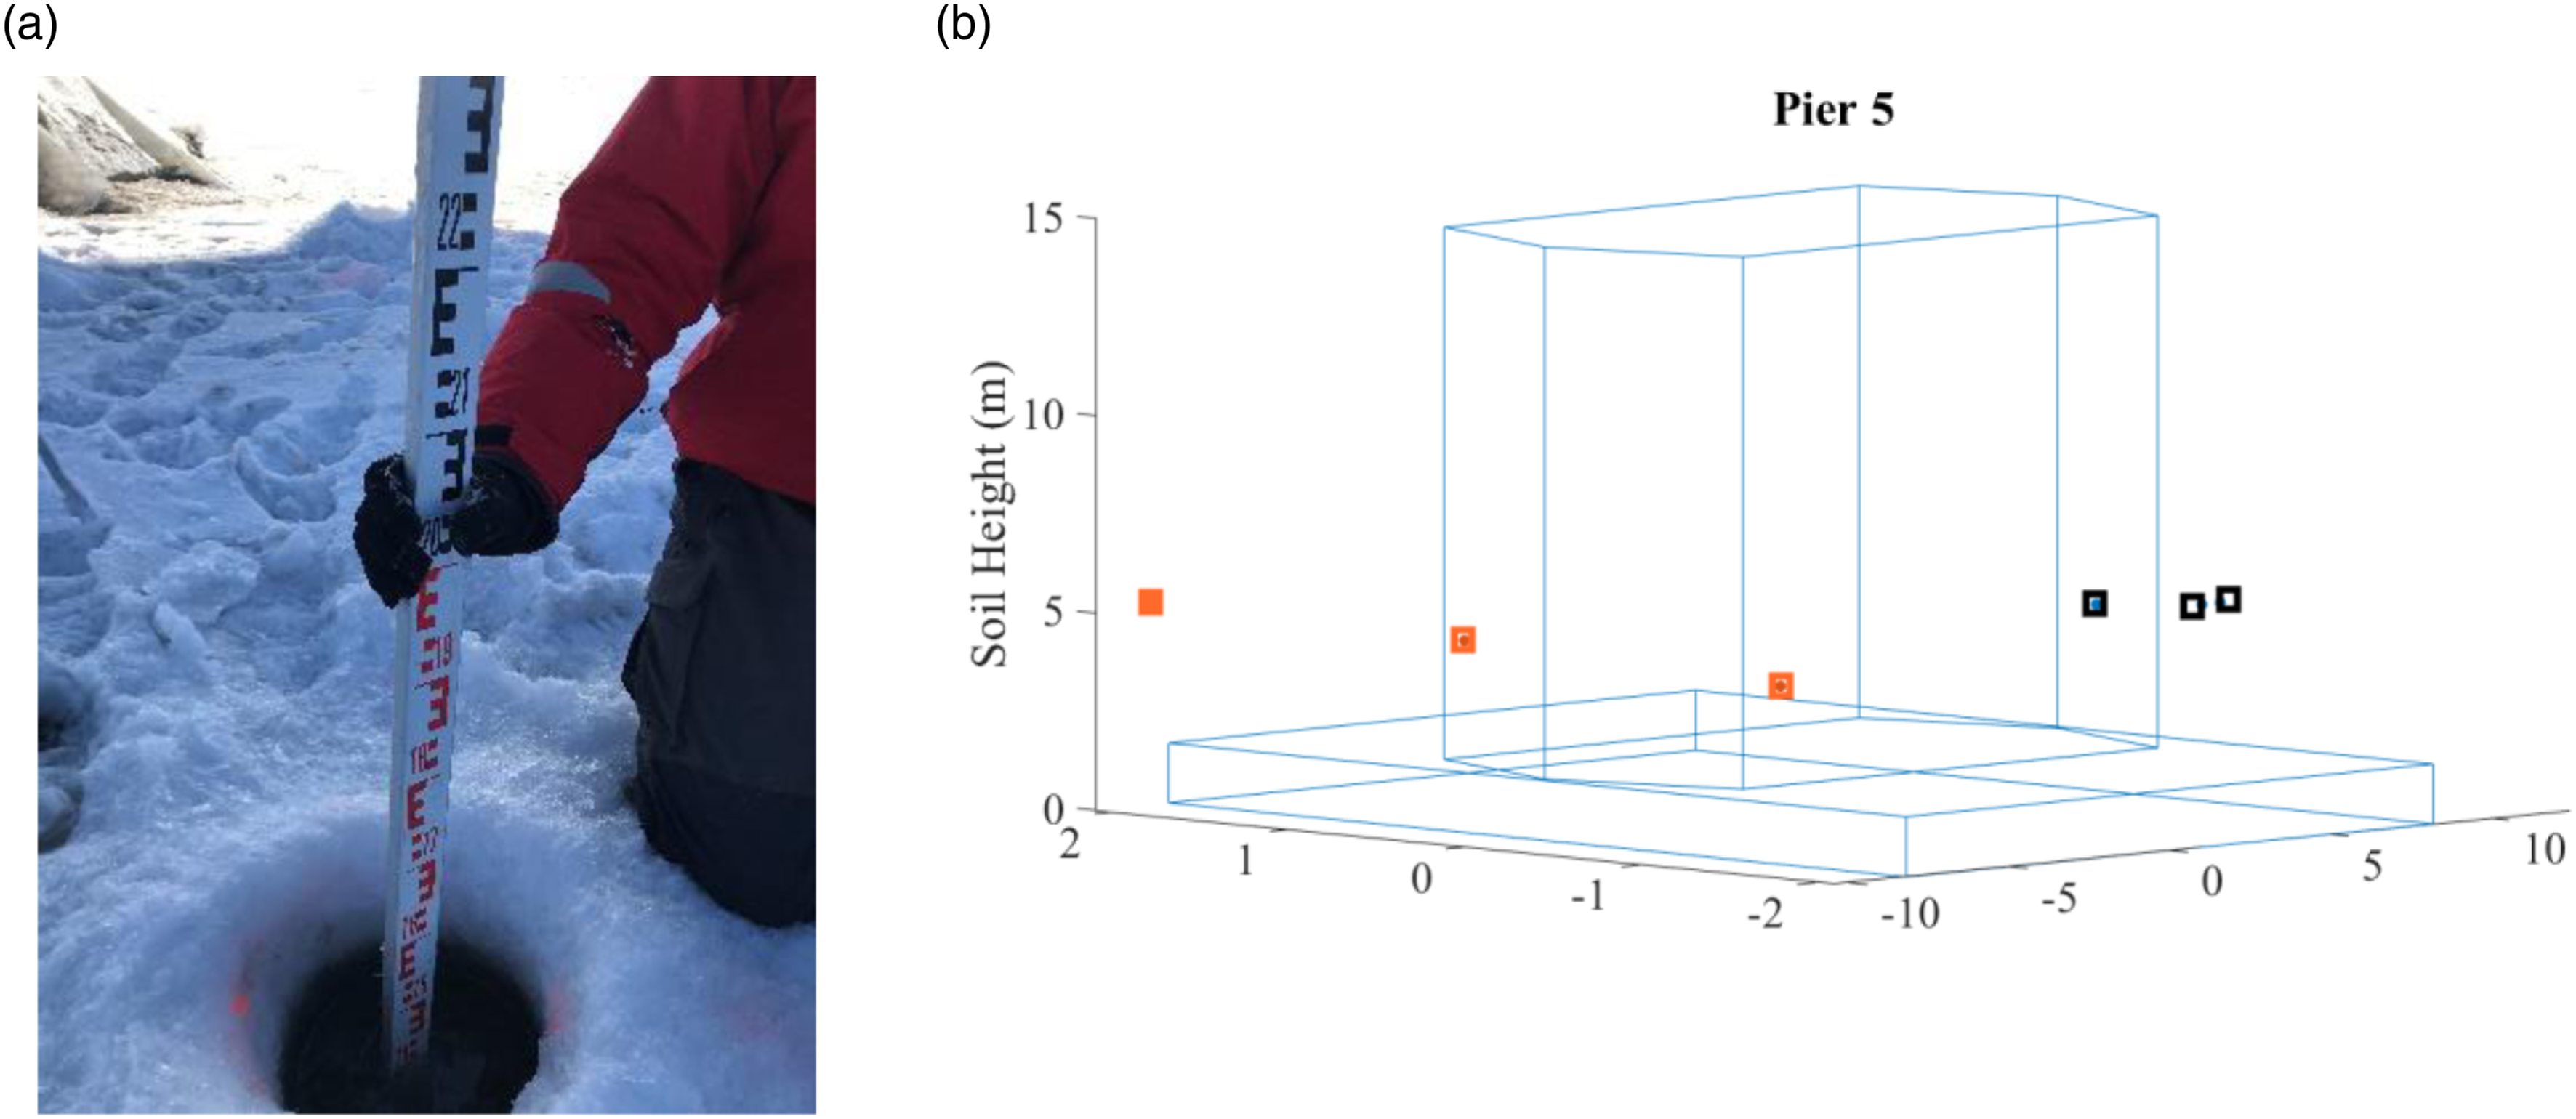
Figure 17(b) shows that the orange-colored points denote the downstream heights, and the black points denote the upstream heights. The estimated soil height is almost in agreement with Figure 16; both show that the soil height was 4–5 m, with an average of 4.7 m. This height can be used for future analysis to create an initial estimate of the sediment profile. The thick ice in February caused a difference between the estimated soil height and the measured height in February. As the model does not consider the temperature effect, and we also assumed that all other components had fixed stiffness values, the RD-UKF intelligently increased the soil stiffness (height) to compensate for this difference.
In addition to the February measurement, for further confirmation, we verified our estimated soil height in August 2020 as well. A highly accurate ADP system was used to measure the river soil height around the pier, as shown in Figure 18. Grounded in the second field measurement, the soil height around the pier was 4–5 m, with an average of 4.67 m. The RD-UKF algorithm then accurately estimated the soil height around the pier during summer and fall, but not in winter. It should be emphasized that the estimated soil heights in the full-scale study (over a year) did not change considerably (no scour happened). It was also validated by river bathymetry tests in both winter and summer. An acoustic Doppler profiler (ADP) boat and measured soil height around the pier 5 in August 2020.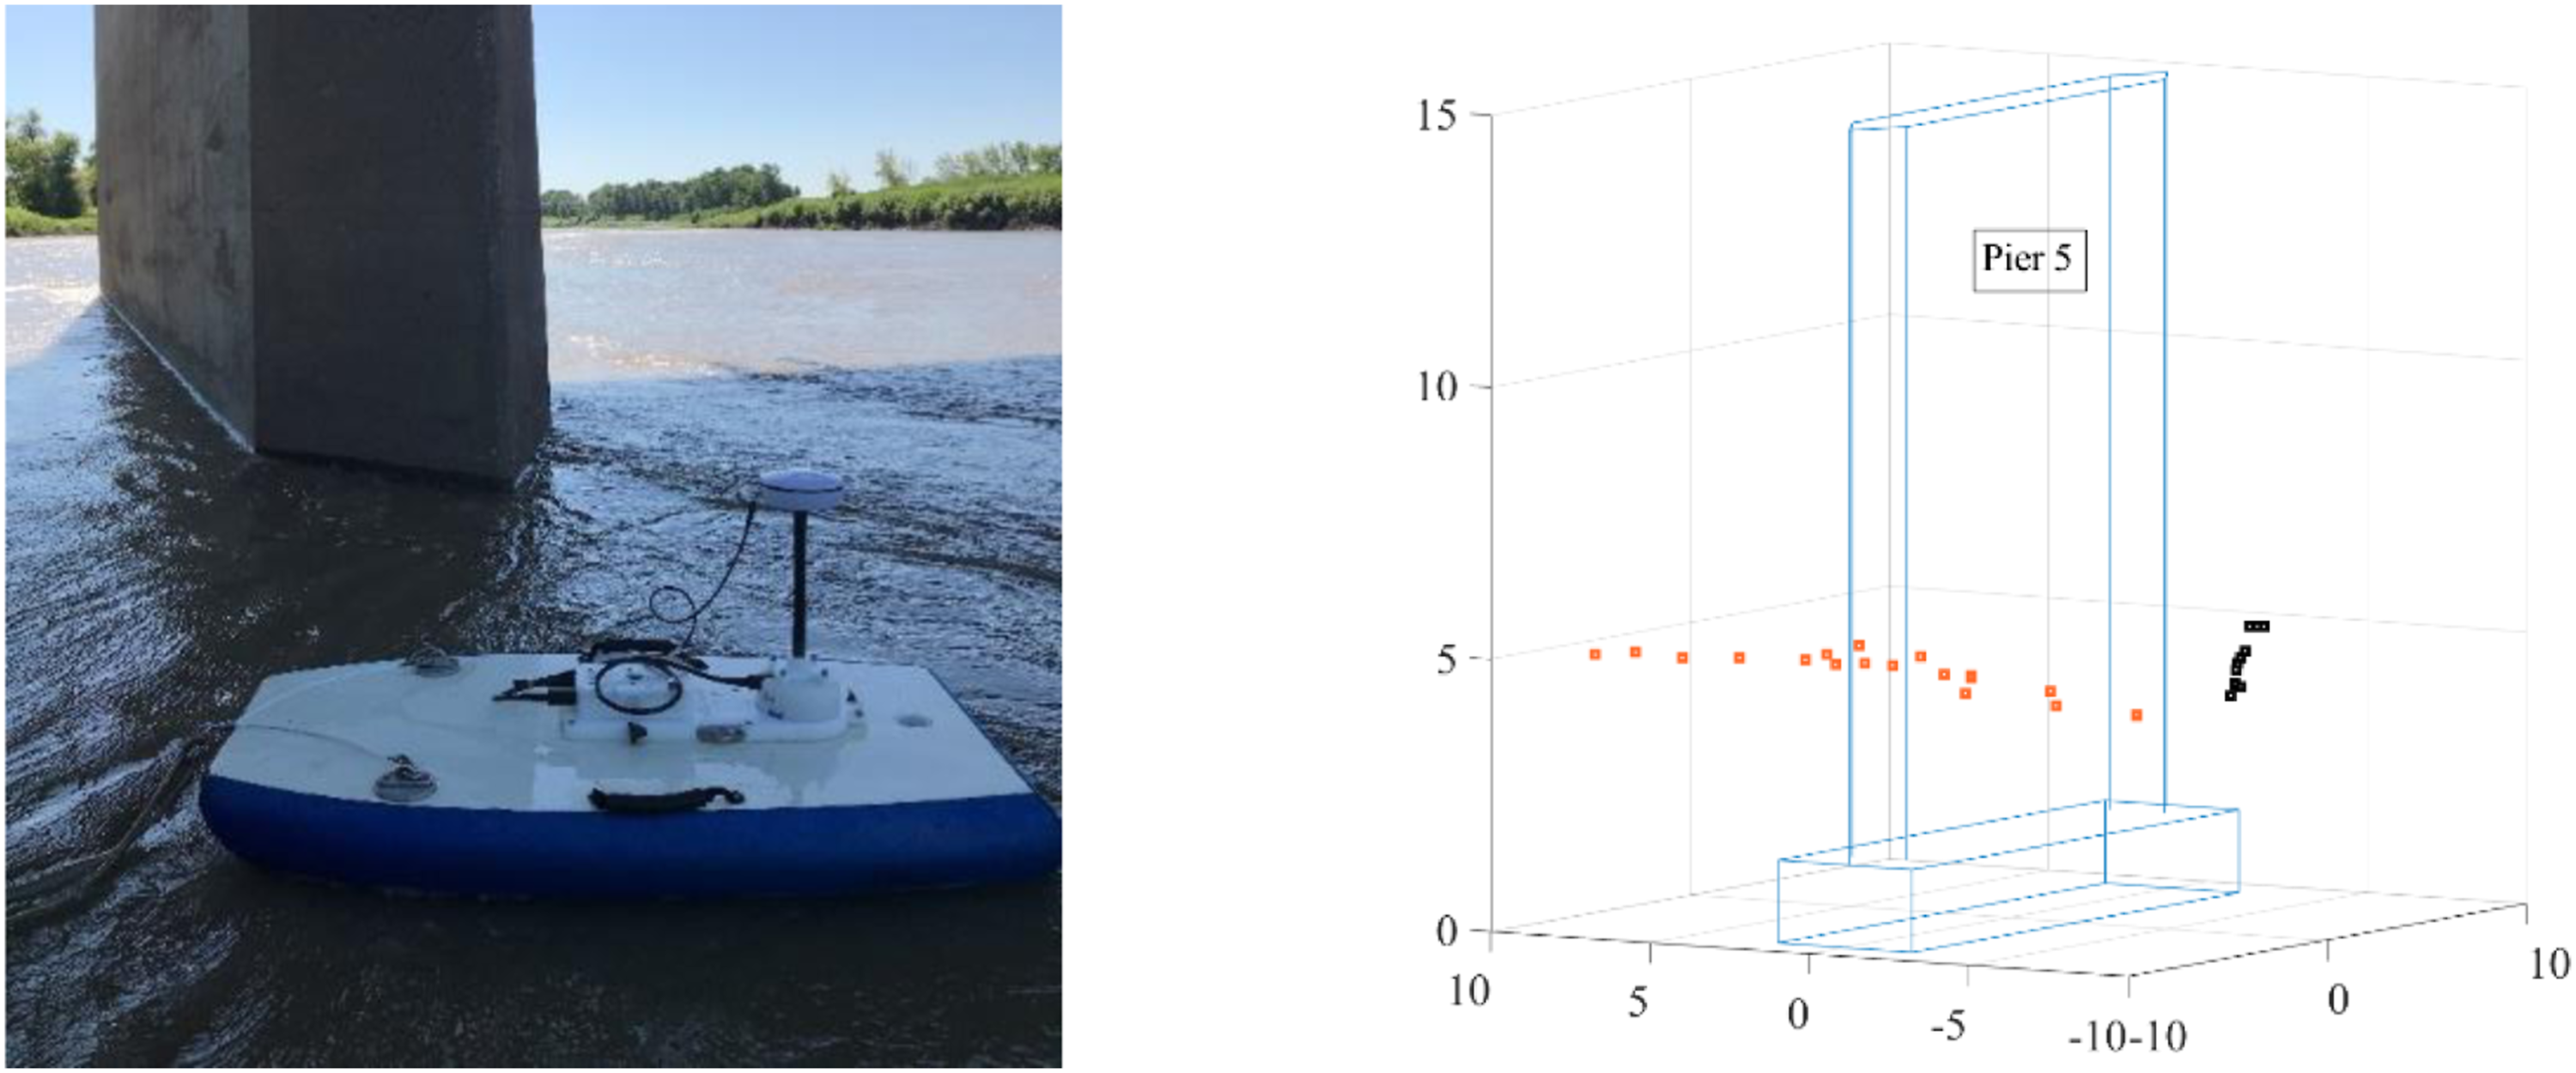
In addition to the model-based scour quantification, we have shown the FFT of the extracted free vibration response for the 4 months considered in this study in Figure 19. The first three natural frequencies of the Euler–Bernoulli model estimated by the RD-UKF are 2 Hz, 5.3 Hz, and 11 Hz, respectively. The natural frequencies of the measured vibration responses, as shown in Figure 19, showed good agreement with the calculated values for all 4 months. The magnitude of the natural frequencies in February appeared to be larger than the other 3 months. The second natural frequency (5.8 Hz) was measured only in February, and the measured natural frequencies in February were slightly higher than those of the other months. The third natural frequency in February was about 7% greater than the corresponding values in the other 3 months. In addition to the three modes discussed above, modes of 1.57 Hz, 2.6 Hz, and 3.57 Hz were also measured. It is assumed that these modes are related to the modes of the entire bridge system.
57-59
FFT of the free responses of the pier 5 in different months.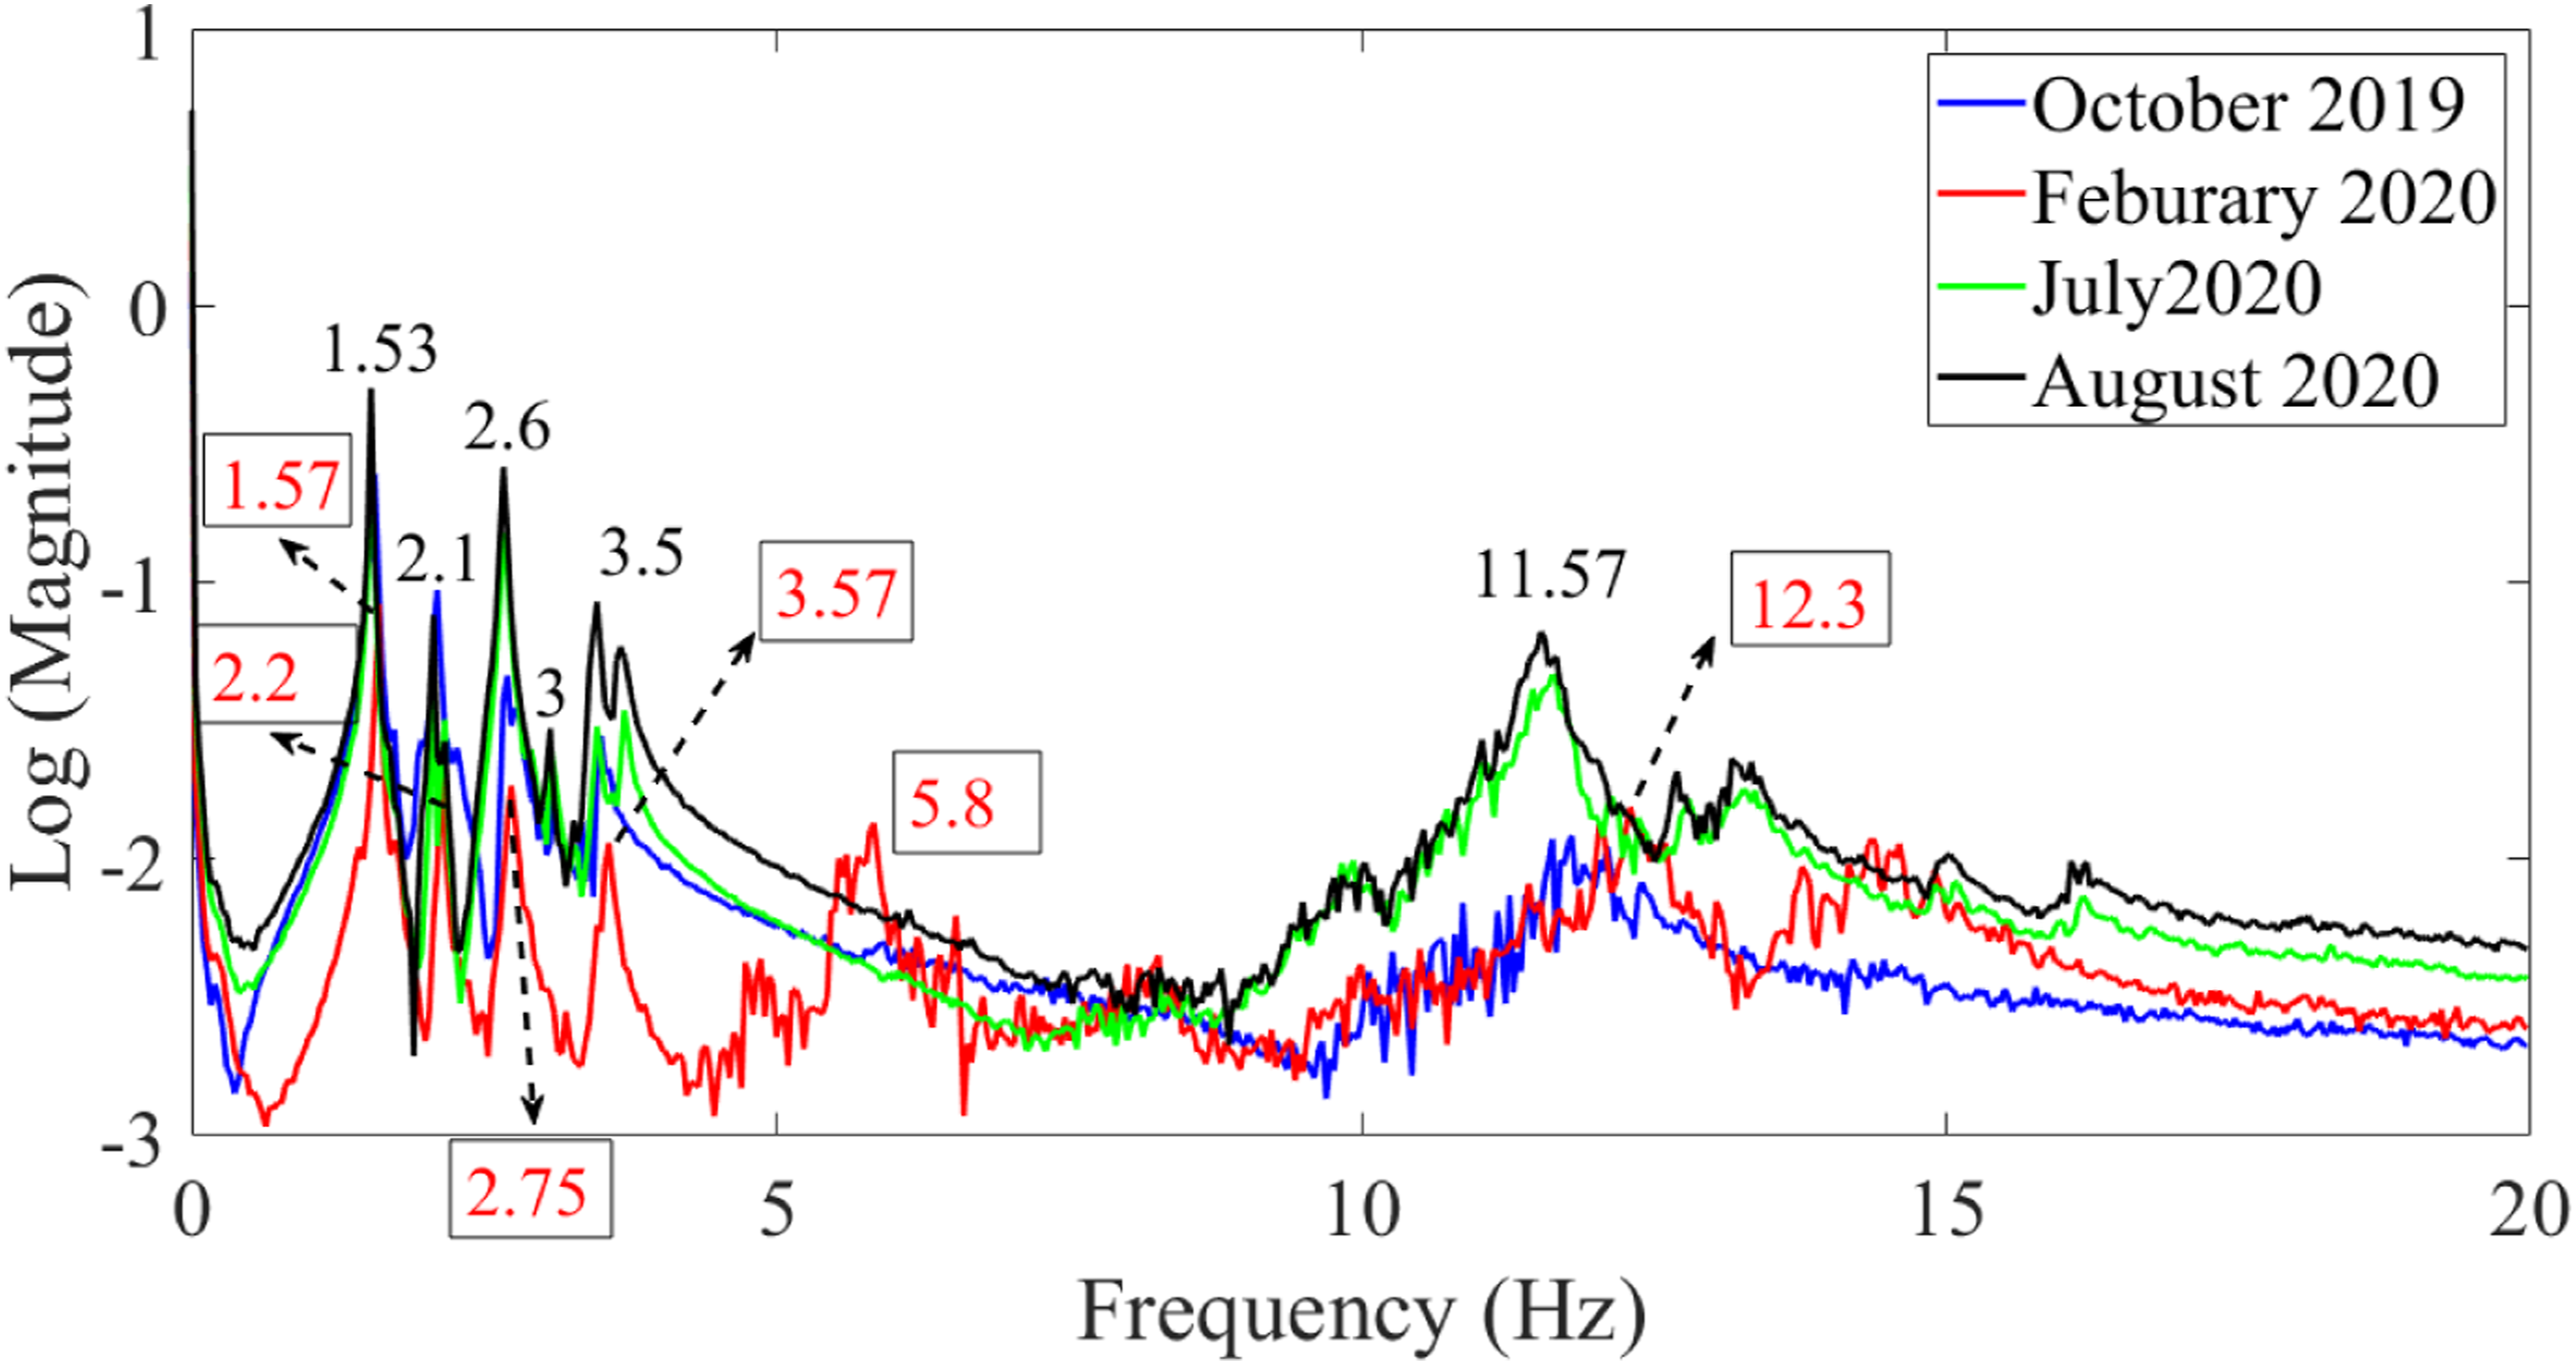
It is challenging to find the dominant peak triggered by the soil effect from Figure 19 to track its change for the purpose of scour monitoring. Another difficulty is determining whether the scour affects all of these peaks or only some of them. Moreover, it is impossible to define a clear relationship between the rates of change in the natural frequencies and soil stiffness because of the scour (Figure 9). However, Figures 8 and 16 show that the Kalman filtering-based method can estimate the soil height around the pier. In a nutshell, the introduced Kalman filtering-based method could help overcome the limitations of traditional data-driven methods in estimating the scour level, despite its complex mathematical equations, difficulties in finding the tuning parameters, and the initial information for the UKF.
Conclusion
The scour phenomenon around bridge piers and foundation systems is one of the most critical problems threatening the safety of bridge systems. The current vibration-based scour monitoring methods focus on the extraction of the natural frequencies and mode shapes of bridge decks and piers. These features can only be used to detect the scour around the pier, but they are not enough for scour quantification. In this paper, a model-based scour monitoring method was introduced to estimate the level of scour. To realize this, a continuous mathematical model was developed for a bridge pier based on the Euler−Bernoulli beam theory. The beam boundary condition was defined as fixed-free, with the soil layer at the fixed end and the load from the superstructure above at the free end. The model accepts various external loadings or combinations of them; therefore, it can be customized for a broad range of bridge pier types with different boundary conditions and loading conditions. The RD technique was employed to extract the free vibration response of the bridge pier, which was fed into the UKF for the desired state estimation. The pier model parameters were updated using RD-UKF and acceleration responses were measured at the pier coping. The introduced method was capable of scour quantification in the different soil profiles around the pier. The experimental study’s estimated soil heights were verified using two different bathymetry tests in the winter and summer seasons. The technical contributions of this study are summarized as follows: (1) A novel output-only physics model-based scour level quantification method was introduced. (2) The Euler−Bernoulli beam theory was used to develop the pier model, considering loads due to traffic, water flow, wind, and sediments around the pier as external loadings. (3) The introduced method requires only one measurement of uniaxial acceleration response. (4) The introduced method can quantify the level of scour accurately. (5) The introduced approach was verified using a comprehensive simulation and field study that considered the linear and nonlinear behavior of the soil around the pier. (6) The model can be generalized to a broad range of bridges with various types of loadings, boundary conditions, and soil-structure interaction functions. (7) The experimental data estimation results were verified by two independent bathymetric surveys, and the results were well in agreement with actual measurements.
Developing more accurate mathematical models with different types of predefined soil-structure interaction functions and considering the winter ice effect and early spring ice collision effect in the model is the next step in our future study.
Footnotes
Acknowledgments
The authors would like to acknowledge the Manitoba Infrastructure Agency for their support during the field study and for providing the required instruments. Ms Evangeline Murison for providing us with the bridge drawing and other related data. Mr Alexander Wall for his cooperation in measuring the riverbed height using the survey rod and ADP system, and Mr Geoffrey Gao for his help attaching the accelerometer to the pier. We would like to acknowledge the KGS Group for using its Ansys software to implement modal analysis on the whole bridge.
Declaration of conflicting interests
The author(s) declared no potential conflicts of interest with respect to the research, authorship, and/or publication of this article.
Funding
The author(s) received no financial support for the research, authorship, and/or publication of this article.